 Ivan Odak1†
 Lâle M. Bayir1,2†
 Lennart Riemann1,3
 Ruth Sikora1,2Jessica Schneider1,2Yankai Xiao1
 Nora Möhn4
 Thomas Skripuletz4
 Gernot Beutel2Matthias Eder2
 Arnold Ganser2
 Reinhold Förster1
 Christian R. Schultze-Florey1,2*‡
 Christian Koenecke1,2*‡
- 1Institute of Immunology, Hannover Medical School, Hannover, Germany
- 2Department of Hematology, Hemostasis, Oncology and Stem Cell Transplantation, Hannover Medical School, Hannover, Germany
- 3Department of Pediatric Pneumology, Allergology and Neonatology, Hannover Medical School, Hannover, Germany
- 4Department of Neurology, Hannover Medical School, Hannover, Germany
Variability or stability might have an impact on treatment success and toxicity of CD19 CAR T-cells. We conducted a prospective observational study of 12 patients treated with Tisagenlecleucel for CD19+ B-cell malignancies. Using a 31-color spectral flow cytometry panel, we analyzed differentiation stages and exhaustion markers of CAR T-cell subsets prior to CAR T-cell infusion and longitudinally during 6 months of follow-up. The majority of activation markers on CAR T-cells showed stable expression patterns over time and were not associated with response to therapy or toxicity. Unsupervised cluster analysis revealed an immune signature of CAR T-cell products associated with the development of immune cell-associated neurotoxicity syndrome. Warranting validation in an independent patient cohort, in-depth phenotyping of CAR T-cell products as well as longitudinal monitoring post cell transfer might become a valuable tool to increase efficacy and safety of CAR T-cell therapy.
1 Introduction
CD19-directed chimeric antigen receptor (CAR) T-cell therapy has become a standard-of-care treatment for patients with relapsed or refractory diffuse large B-cell lymphoma (DLBCL) and B-cell lineage acute lymphoblastic leukemia (B-ALL). For both entities the CD19 CAR T-cell product Tisagenlecleucel was approved for demonstrating curative potential (1, 2), which was also confirmed in real-world analyses (3). However, this treatment harbors potentially life-threatening side effects such as cytokine release syndrome (CRS) and immune effector cell-associated neurotoxicity syndrome (ICANS), which require meticulous patient observation and trained medical staff to provide adequate clinical management (4). The incidence of CRS after treatment with Tisagenlecleucel has been reported to range between 57-93% (1, 5, 6), with severe CRS (≥ grade 3) (7) emerging in about 10-30% of patients (3, 8, 9). ICANS has been described to occur in about 20-70% of patients treated (10) and severe neurotoxicity (≥ grade 3) manifested in 10-35% of patients respectively (3, 11, 12). Although isolated ICANS can occur, manifestation of severe CRS has been associated with a higher risk of concomitant neurotoxicity (13). Risk factors for CRS and ICANS have been described (13–19), but specificity and sensitivity for these broad predictive markers appear to be low.
To date, cell intrinsic factors determining the outcome and side effects of CAR T-cell therapy are largely unknown. The CAR T-cell immune phenotype before and after cell transfer may become a suitable and readily available biomarker to predict outcome and toxicity. A recent study described CAR T-cells with higher expression of co-inhibitory molecules (LAG3 and PD1) as well as lower expression of the cytotoxicity marker CD107a to be associated with favorable outcome (19). Common use of methods such as Time-of-Flight Cytometry or spectral flow cytometry allows almost unparalleled resolution in terms of cell phenotyping on a single-cell protein level. Given the vast amount of data obtained by these methods, an analysis pipeline is needed to decipher it in a meaningful way.
In this study, we prospectively analyzed the CAR T-cell immune phenotype kinetics in the context of patients’ clinical course. To this end, we applied a 31-color spectral flow cytometry approach to identify differentiation stages and exhaustion status of the CAR T-cell product itself and longitudinally in patients’ blood samples during 6 months of follow-up. In addition to a conventional gating approach, we employed a quantitative unsupervised clustering analysis. Ultimately, we provide data on the dynamics of expression of various T-cell markers over time and their correlations with response to therapy and occurrence of CRS or ICANS.
2 Materials and methods
2.1 Cohort and study design
Between July 2019 and May 2020 we recruited 16 patients diagnosed with relapsed/refractory DLBCL or relapsed/refractory ALL, who received treatment with Tisagenlecleucel in the Department of Hematology, Hemostasis, Oncology and Stem Cell Transplantation at Hannover Medical School (Germany). We obtained written, informed consent from all participants. As shown in Supplementary Figure S1, we excluded four patients from the analysis: two patients due to lack of biomaterials, one patient received a cell product that did not comply with the manufacturer’s standard regarding minimal cell count and in one case the sample quality of the obtained biomaterial was insufficient for further analysis. This study was designed in accordance with the Declaration of Helsinki and approved by the institutional review board of Hannover Medical School (8610 _BO_K_2019). The study layout is shown in Supplementary Figure S2.
Tisagenlecleucel was administered in an inpatient setting. The cell product bag was flushed with NaCl 0.9% to administer as many CAR T-cells as possible to the patient. Prior to disposal, the cell product bag was flushed again and left-over cells were used for analysis in flow cytometry. A standardized follow-up, consisting of a minimum of 10 days of hospitalization and subsequent scheduled outpatient appointments, was implemented (Supplementary Figure S1). Thorough neurological screening was performed by specialists to monitor occurrence of respective side effects (11). Response to therapy was determined 30 days as well as 90 days after CAR T-cell infusion. In most cases, response evaluation was based on PET-CT scans with response assessment according to Lugano classification (20). In case of unavailability of PET-CT scan, conventional CT staging was performed.
2.2 Flow cytometry
Within this study, we obtained whole blood samples from patients to process into peripheral blood mononuclear cells (PBMCs) using Ficoll gradient centrifugation as described elsewhere (21), which were cryopreserved at -80°C. We set up a custom-built antibody panel to discriminate T-cell subsets and investigate surface expression of activation and exhaustion markers (Supplementary Table S1). The range of analyzed cells in the CAR T-cell gate for the CAR T-cell products was 219-7482 with the median being at 3793. For the patient’s samples, the range of analyzed cells in the CAR T-cell gate was 128-11354 with the median being 968. Samples were stained at room temperature, using 30 monoclonal antibodies and a viability dye, and washed twice. We used an Aurora spectral flow cytometer (Cytek) equipped with five lasers (355 nm, 405 nm, 488 nm, 561 nm, 640 nm) to acquire the primary data. Data analysis was performed using SpectroFlo version 2.2.0 (Cytek) and FCS Express™ 7 (Denovo). Gating of CAR+ cells is shown in Figure 1B.
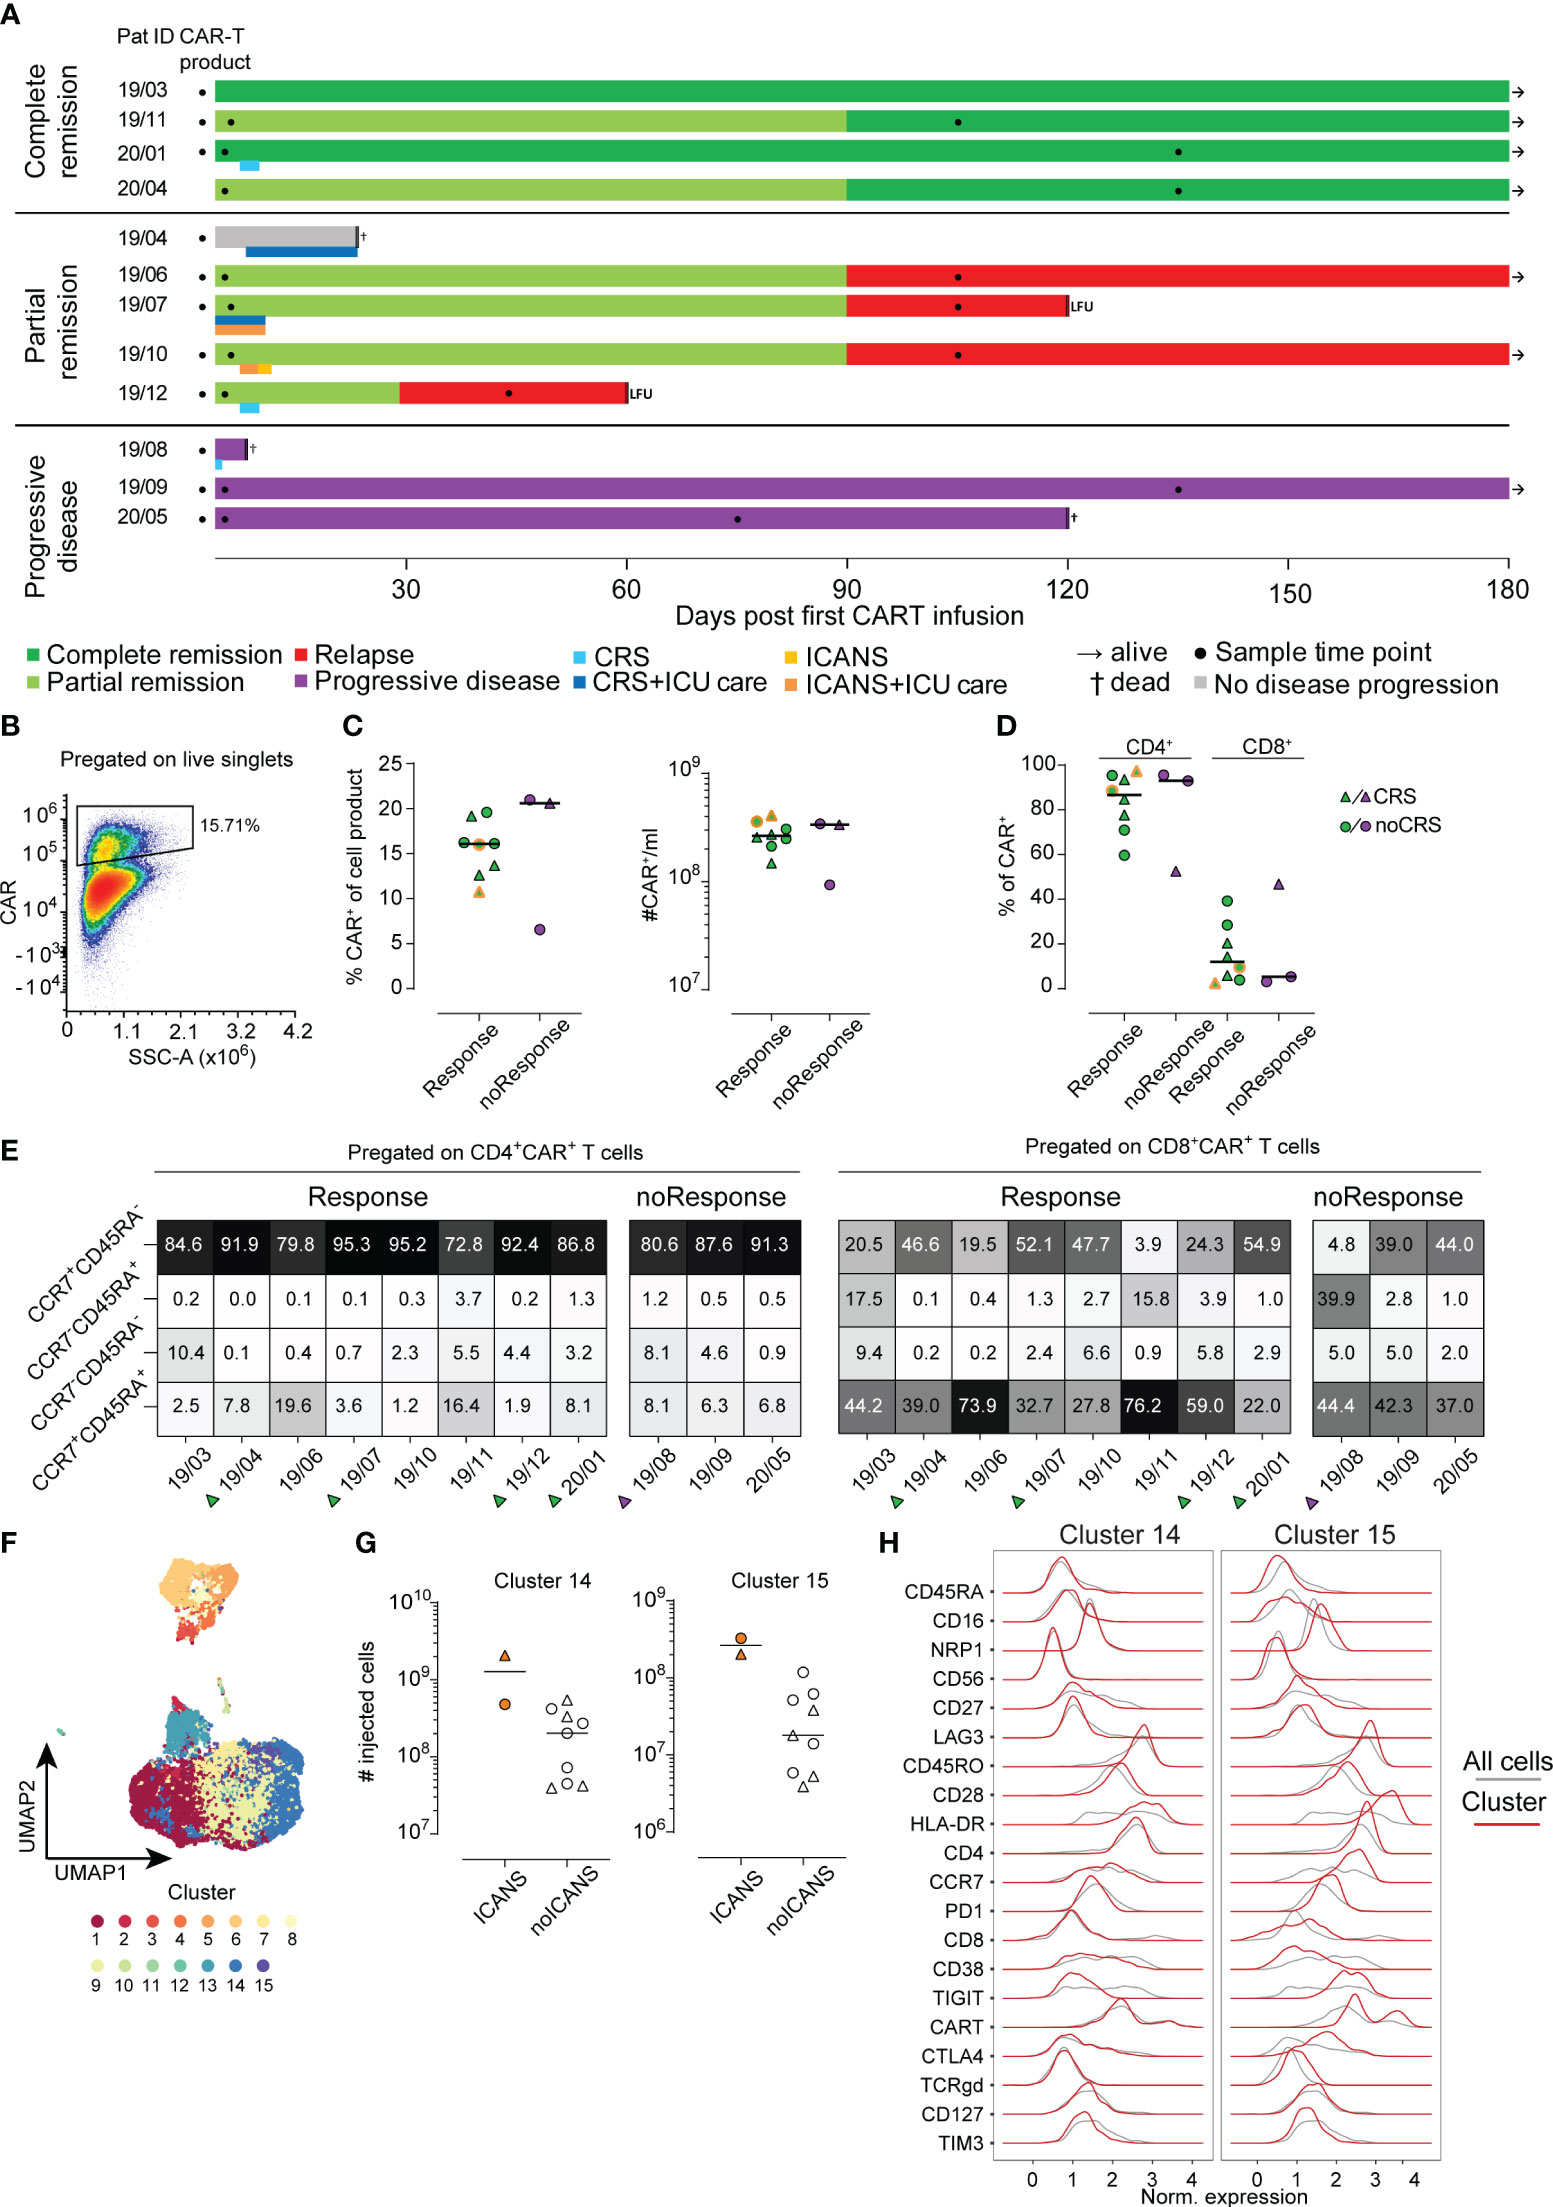
Figure 1 Analysis of CAR T-cell product. (A) Each patient is represented by one line with color coding response to CAR T-cell therapy (dark green complete remission, light green partial remission, red relapse, grey no evidence of disease progression, purple progressive disease). A second color-coded line below the response indicates occurrence of CRS (blue) and ICANS (orange). Sampling is indicated by filled black circles. Follow-up time was 180 days. LFU indicates loss to follow-up. (B) Example for CAR+ T-cell gating (C) Percentages (left) and absolute cell numbers (right) of infused CAR+ T-cells is shown. Lines represent median. (D) Distribution of CD4+ and CD8+ CAR+ cells in the CAR T-cell product. (E) Distribution of CAR+ subpopulation based on their CCR7 and CD45RA expression pattern. (F) UMAP visualization identifying 15 distinct cell clusters in CAR+ T-cells of the cell product (n=11). (G) Numbers of injected cells with cluster 14 (left) or cluster 15 (right) phenotype in the CAR T-cell products of patients with or without ICANS development. (H) Detailed surface marker phenotype of cells within clusters 14 and 15. Red line shows expression of cells of the indicated cluster only, grey line indicates expression of all cells.
2.3 Unsupervised quantitative cluster analysis
First, conventional 2D gating was performed to remove dead cells and doublets for data clean-up. Additionally, for patient samples, non-leukocyte cells (CD45RA-CD45RO-) and monocytes (CD14+) were also removed prior to data export. We then proceeded to further investigate the samples using an unsupervised clustering approach (Figure 1F). Transformation of data was performed via the Logicle function of the R FlowCore package (version 2.2.0, Bioconductor) (22). In the next step, the FlowAI algorithm (version 1.20.1, Bioconductor) was applied for quality control (23). The FlowSOM algorithm (version 1.22.0, Bioconductor) was used for clustering the data according to default settings (24). The number of FlowSOM meta-clusters was set to 15 for the CAR T-cell products and 20 for analysis of all cells. Ultimately, the Uniform Manifold Approximation and Projection (UMAP, Figure 1F) approach served for dimensionality reduction. Before clustering, expression of all markers was checked manually for each sample using histogram plots. In case of absence of expression dynamics (equal in all samples) the respective marker was excluded from the analysis to avoid technical artefacts. Manual cluster annotation was set up considering relative expression of markers among clusters.
2.4 Statistical analysis
We used Prism 7 (GraphPad) for statistical analysis. All data was tested for normality of distribution and tested with appropriate test as indicated in the figure legends. For comparison of mean fluorescence intensity (MFI) values of various activation and exhaustion molecules expressed on CAR+ T-cells within the cell product and at early and late time points two way ANOVA with Tukey’s post hoc test was used.
3 Results
A total of 16 patients were recruited to this prospective observational study, of whom 12 met the inclusion criteria (Supplementary Figure S1). Eight of 12 patients had a complete (CR, N=4) or partial remission (PR, N=4) at three months post CAR T-cell therapy with a median duration of response of 13.5 months (range 8-24) (Figure 1A). Three patients did not respond to CAR T-cell therapy and showed progressive disease (PD, Figure 1A). In the subset of patients who initially experienced PR, one patient progressed one month after CAR T-cell infusion and three subjects showed relapsed disease at three months of follow-up. One patient died from neutropenic sepsis 23 days post CAR T-cell infusion without signs of disease progression. Detailed clinical characteristics are shown in Table 1 and Supplementary Tables S2, S5.
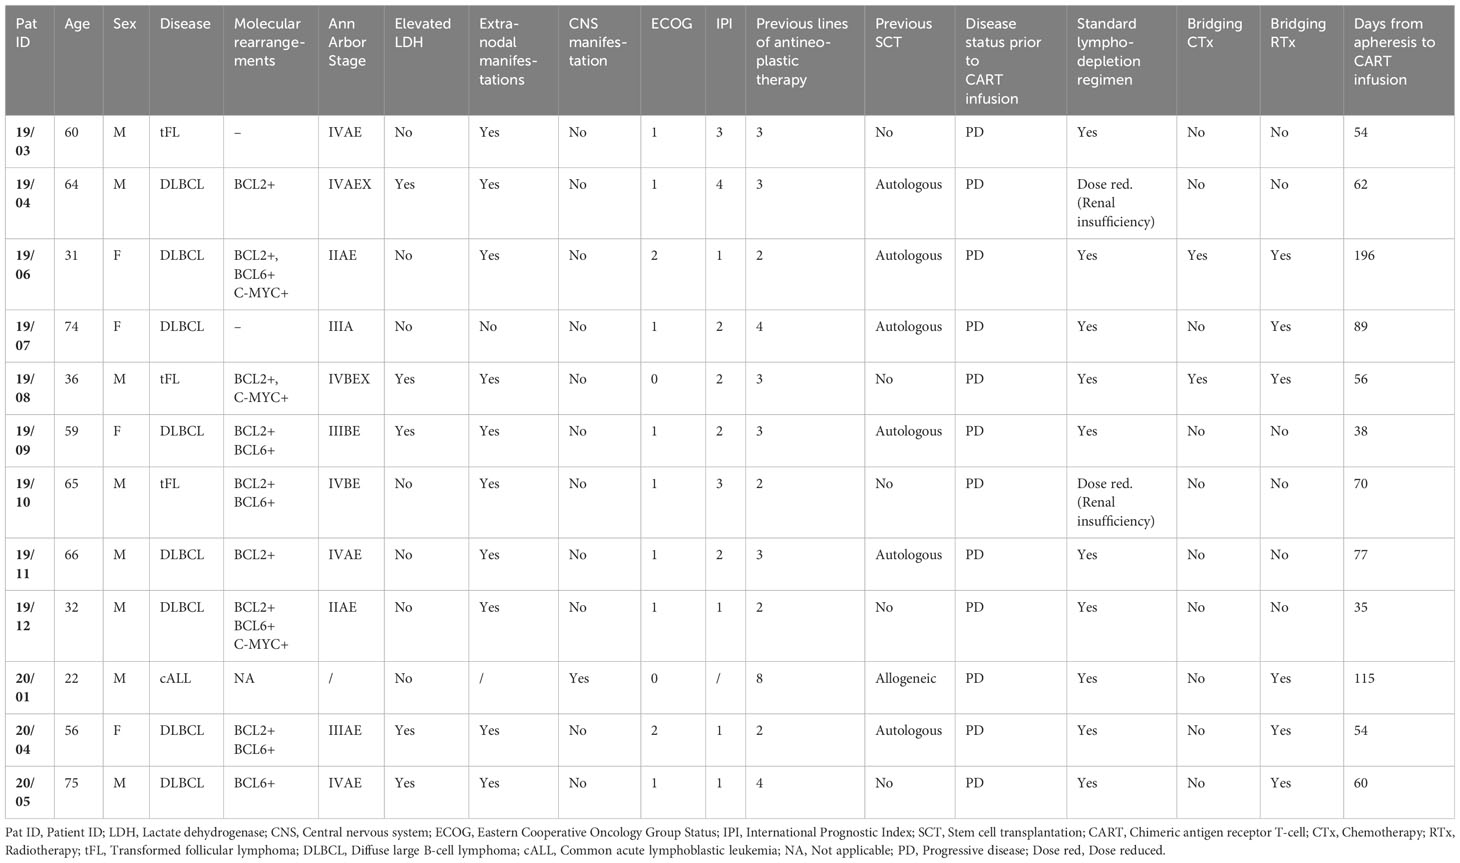
Table 1 Patients’ characteristics prior to CART therapy.
CRS manifested in five out of 12 patients (41.7%), of whom 3 cases were classified as °I and could be managed with supportive care only (7). One patient developed CRS °IV and later met diagnostic criteria for secondary hemophagocytic lymphohistiocytosis; he died from neutropenic sepsis. One patient had CRS °II and concomitant ICANS °II, which was treated with tocilizumab and dexamethasone. Another patient suffered from ICANS °II and received dexamethasone alone (Supplementary Table S4).
3.1 In depth phenotyping of CAR T-cell products does not reveal differences with regard to outcome upon conventional 2D analysis
We analyzed the phenotype of the infused CAR T-cell products (n=11) using conventional 2D gating. In order to assess differences with regard to outcome after CAR T-cell therapy, we separated the cohort based on response criteria into responders (n=8) and non-responders (n=3). Moreover, patients with CRS and ICANS were highlighted throughout the figures when applicable (Figures 1C–E, 2A, B). No differences were detected when comparing the percentage and absolute counts of CAR T-cells within the CAR T-cell product for responders versus non-responders (Figure 1C). Notably, the two patients with ICANS had received the highest absolute count of CAR+ T-cells within the cohort (Figure 1C, indicated by dual-coloring). However, we did not observe any differences between the groups based on the occurrence of CRS (Figure 1C).
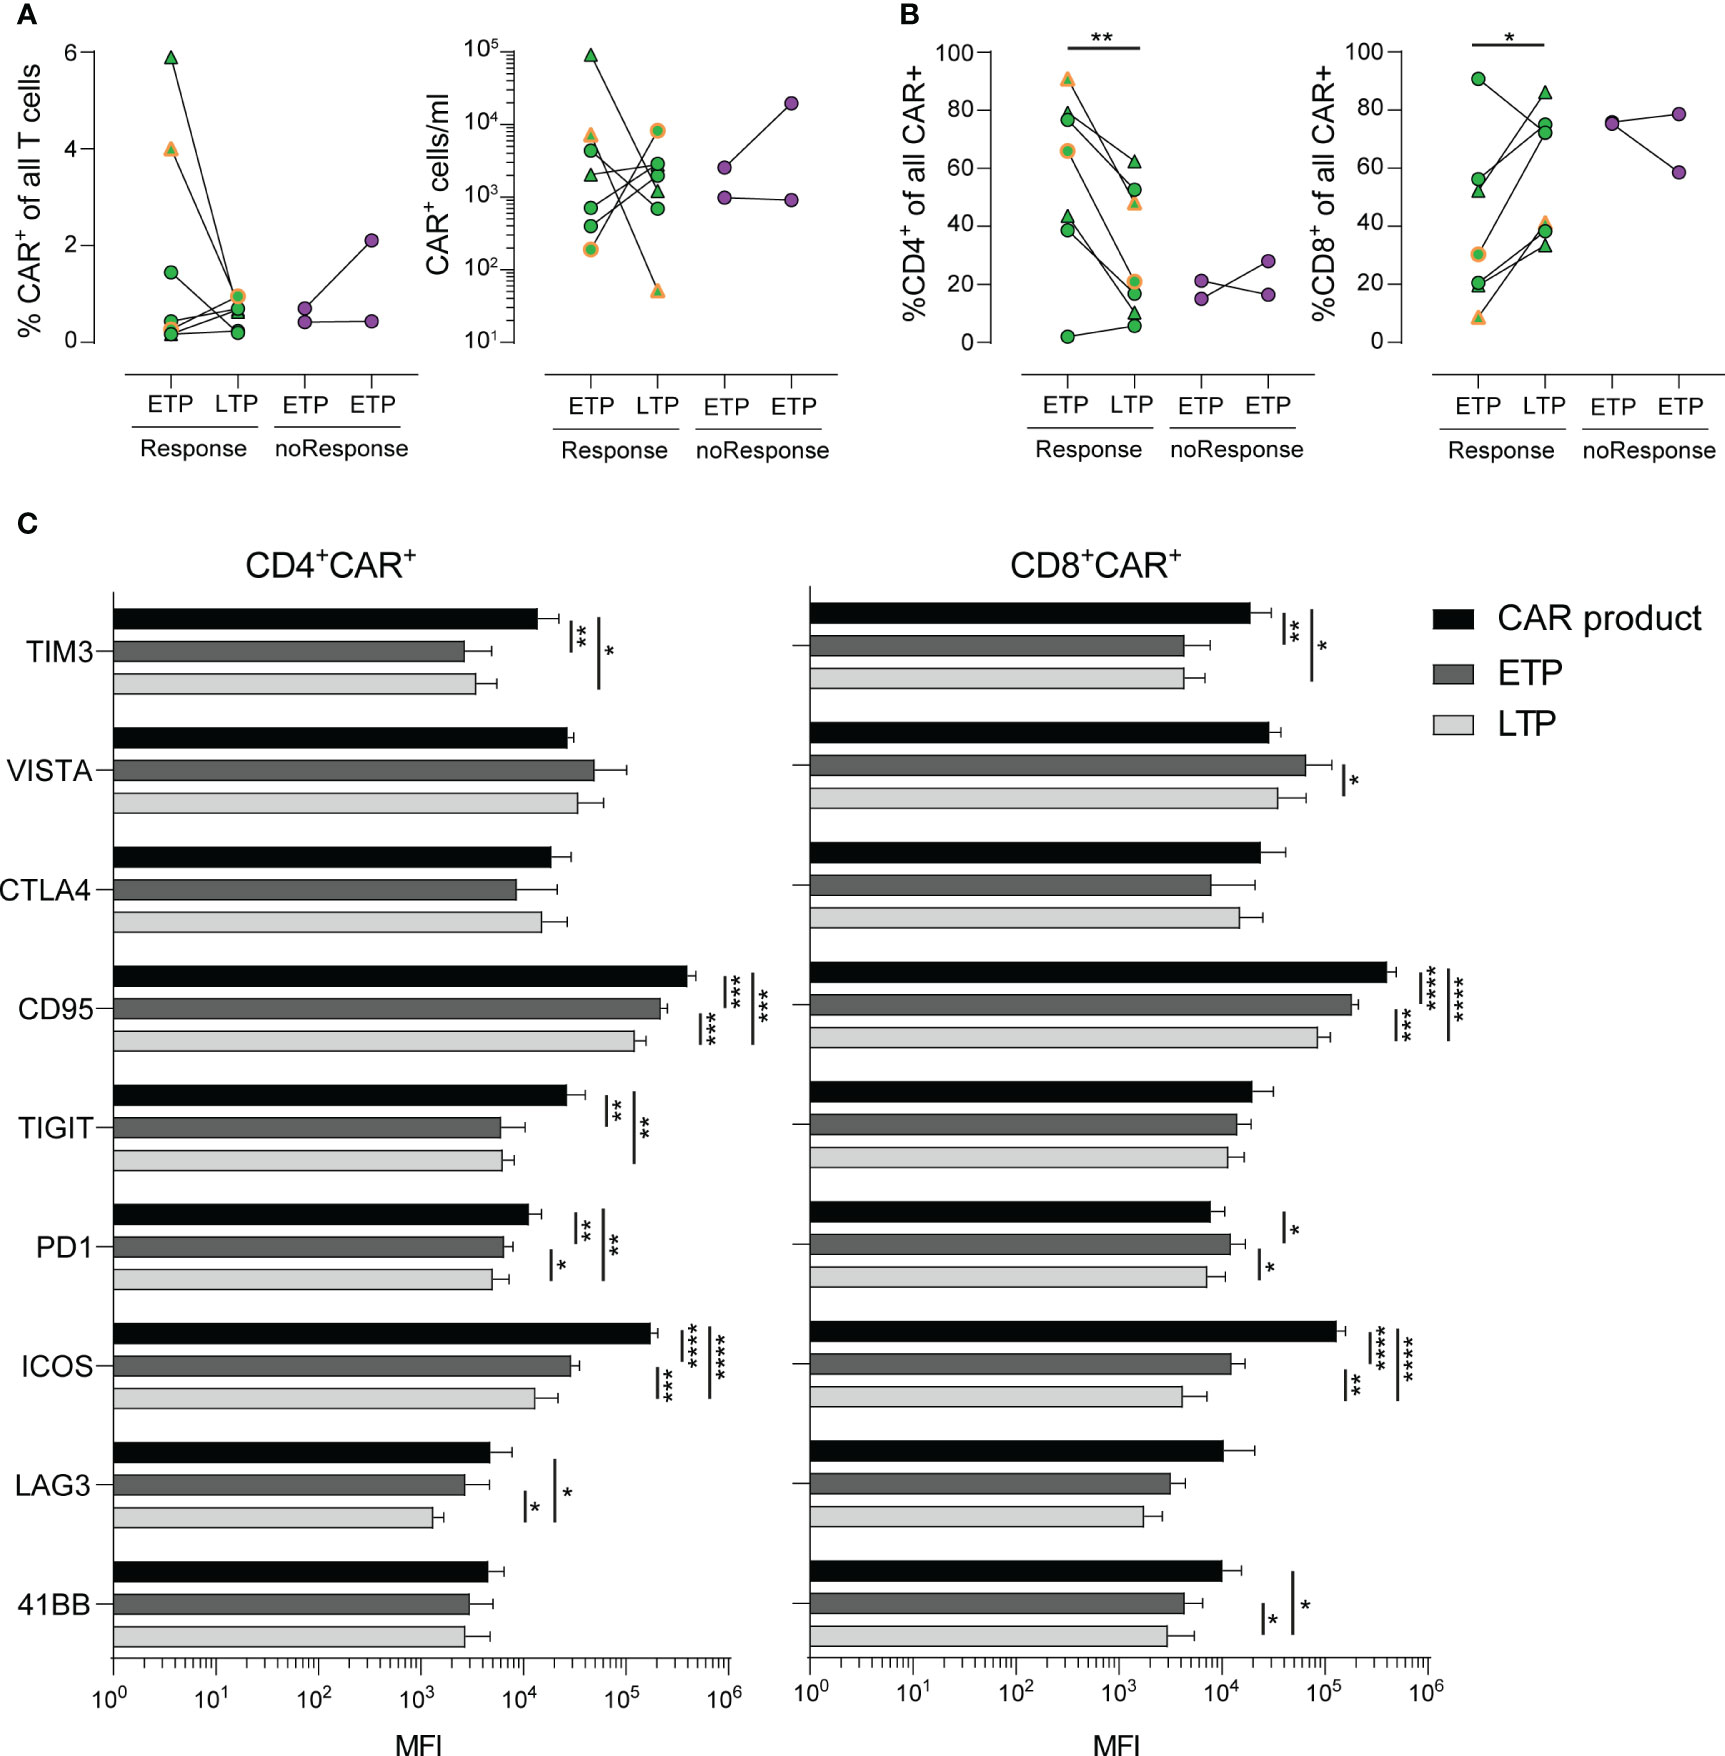
Figure 2 Stability and long-term phenotype of CAR+ T-cells. (A) Frequencies (left) and numbers (right) of CAR+ T-cells in PBMCs of patients in early (ETP) and late (LTP) time points post CAR T-cell infusion. (B) Distribution of CD4+ (left) and CD8+ (right) CAR+ cells of all CAR+ cells. (C) Mean fluorescence intensity (MFI) values of various activation and exhaustion molecules expressed on CAR+ T-cells within the cell product (black) and at early (dark grey) and late (light grey) time points. Lines represent mean. Statistics was done by two-way paired t test (A, B) or two way ANOVA with Tukey’s post hoc test (C). *p<0.05; **p<0.01; ***p<0.001; ****p<0.0001.
Of note, CD4+ CAR+ T-cells made up around 80% of the whole CAR T-cell product in this cohort. However, we did not detect an association of CD4/CD8 distribution in respect to treatment success or side effects (Figure 1D).
Next, we analyzed the CAR T-cells before infusion based on their CCR7 and CD45RA expression pattern. The combination of CCR7 and CD45RA expression is often used to describe naïve (CCR7+CD45RA+), effector/memory (CCR7-CD45RA-), TEMRA (CCR7-CD45RA+) and central memory (CCR7+CD45RA-) T-cells (25). In our cohort, the great majority of both CD4+ and CD8+ CAR T-cells expressed CCR7 and/or CD45RA (Figure 1E). CCR7 expression indicates the ability of CAR T-cells to enter the secondary lymphoid organs. After all, we could not detect a significant association of the expression of CCR7 and CD45RA with anti-tumor activity or toxicity (Figure 1E). In conclusion, conventional 2D analysis of the CAR+ T-cell population of the CAR T-cell products did not reveal any statistically significant differences regarding quantity or activation phenotype neither in responders versus non-responders nor in patients with or without CRS and/or ICANS.
3.2 Unsupervised cluster analysis identifies patients developing ICANS
Beyond conventional gating, we performed an unsupervised cluster analysis (26) of the infused CAR T-cell product (n=11) as well as across all available samples (n=29). As described in the Methods section cells were separated into 15 distinct clusters for the analysis of the infused CAR T-cell products (Figure 1F) and 20 distinct clusters in the case of all samples analysis (Supplementary Figure S2A). Due to lack of statistical power, we did not focus on correlations of clinical outcome with cell clusters but used a descriptive data analysis approach. Interestingly, the two patients developing ICANS received CAR T-cell products with a higher amount of cells with cluster 14 and 15 phenotype (Figure 1G). A closer look into the phenotype of cluster 14 and 15 revealed a shared similarity in most of the molecules. Yet, cluster 14 was defined by lack of expression of CCR7, PD1, TIGIT and CTLA4 compared to cluster 15. Both of these cell clusters were made up of CD4+ T-cells, however cluster 15 also had a higher proportion of CAR+ T-cells compared to cluster 14 (Figure 1H). In order to evaluate possible interplay of other cell types with CAR T-cells, we performed an integrated analysis of all samples from the CAR T-cell products, ETP and LTP (n=29). This analysis yielded 20 unique clusters (Supplementary Figure S2A). While we did observe some longitudinal differences, due to our small sample size, we did not identify any pattern that would separate responders from non-responders or CRS and/or ICANS patients (Supplementary Figure S2B). Still, a closer analysis identified CD4+CAR T and CD8+CAR T-cells predominantly making up clusters 5 and 12 respectively, but also present in clusters 4, 8, 9 and 11 (Supplementary Figures S3A, B).
3.3 The majority of activation markers on CAR+ T-cells show stable expression over time
Subsequently, we focused on the CAR T-cell kinetics within the patients’ peripheral blood at early time points (ETP, n=9, median 2 days, range 2-3 days) and late time points (LTP, n=9, median 105 days, range 48-130 days) post CAR T-cell infusion (Figure 1A; Supplementary Figure S1A).
As shown in Figure 2A, the percentage of CAR T-cells within the patients’ blood as well as the absolute count of CAR T-cells showed a heterogeneous dynamic, with some patients exhibiting a steep decline, while others had stable or expanding CAR T-cell populations. Of note, we observed increased frequencies of CAR T-cells with a CD8+ phenotype in patients with response by day 30 and a paralleled drop in frequencies of CD4+ CAR T-cells (Figure 2B).
Despite our deep phenotyping, we failed to observe differential expression of any one activation or checkpoint molecule prior to infusion that might be associated with development of either response to treatment or occurrence of CRS or ICANS. Finally, we analyzed the expression kinetics of activation markers, such as TIM3, VISTA, CTLA4, CD95, TIGT, PD1, ICOS, LAG3 and 4-1BB in a longitudinal time line. CD4+ and CD8+ CAR T-cells exhibited a similar expression kinetic of the majority of markers related to T cell exhaustion (Figure 2C). Notably, despite the obvious heterogeneity in terms of treatment of each patient, we observed a marked decrease of expression of TIM3, CD95, ICOS and TIGIT (in CD4+ CAR T-cells only) during the late time points throughout the cohort. Taken together, the detailed description of expression kinetics sheds light on the underlying complexity of CAR T-induced immune responses, including tumor escape mechanisms (27).
4 Discussion
Our approach of in-depth phenotyping of T-cell subsets of the CAR T-cell product as well as patient samples early and late after CAR T-cell therapy in a small cohort focused primarily on identification of differential expression of surface molecules as a function of outcome and toxicity.
Upon conventional 2D analysis of the CAR+ T-cell population of the CAR T-cell products we did not observe statistically significant differences regarding quantity or activation phenotype associated with response nor toxicity. While a clear causative relationship between dose of transferred CAR T-cells and occurrence of CRS or ICANS has not yet been demonstrated, several groups have identified high numbers of transferred CAR+ T-cells or increased expansion as a risk factor (13, 19, 28, 29). It is worth noting, that following lentiviral transduction and expansion protocols used in creation of the cell product, CCR7+CD45RA+ CAR T-cells likely do not have the same functional capacity as compared to non-genetically modified naïve T-cells (30). In our cohort, the great majority of both CD4+ and CD8+ CAR T-cells expressed CCR7, thus likely retaining their ability to enter lymph nodes which represents an important aspect of their potency to clear lymphatic tumors (31, 32).
In contrast to the standard 2D gating approach, employing an unsupervised cluster analysis of the CAR T-cell products we separated 15 distinct clusters, which were analyzed in a descriptive manner. Two clusters were associated with ICANS. Both clusters 14 and 15 contained CAR+ T-cells and the overall exhausted-like phenotype of these two clusters resembled each other. Besides the amount of CAR+ T-cells, they diverged only in expression of CCR7, PD1, TIGIT and CTLA4. While the pivotal role of CCR7 has been described above, both TIGIT and CTLA4 are immune checkpoints that regulate immune function and have been shown to influence anti-tumor control (33–35). Cluster 15, which had a higher proportion of CAR+ T-cells, simultaneously exhibited a higher expression of TIGIT and CTLA4, implying a more activated state. Considering that patient ID 19/07 had both CRS and ICANS we cannot rule out that the underlying CRS might have influenced this finding. However, upon analysis of all CRS patients we did not observe a divergent expression profile compared to patients who did not exhibit CRS.
We could not identify a distinct CAR T-cell kinetic neither for response to therapy nor for occurrence of CRS or ICANS. This was also the case for any activation or checkpoint molecule. These data point to the existence of multiple pathways or mechanisms involved in anti-tumor activity as well as CRS or ICANS induction, which seems reasonable regarding the rather low likelihood of only one specific marker determining CRS- or ICANS-inducing T-cell subsets. Interestingly, in contrast to CD8+ CAR T-cells, we identified an overall decline of CD4+ CAR T-cells over time. Importantly, a reduced CAR+ T-cell population over time is not necessarily associated with reduced anti-tumor activity as the CAR+ T-cell kinetic might also reflect homing towards the CD19+ target cells outside of the circulation. While treatment of high-grade CRS typically involves steroids, the majority of CRS patients in our cohort did not require such treatment, suggesting a CRS-treatment unrelated drop in CAR+ cells.
Expression kinetics of activation markers revealed highest levels within the CAR T-cell product with a decline over time for the majority of markers. A recent study identified lower expression of PD1 and LAG3 as well as higher levels of the cytotoxicity marker CD107a at peak expansion to be linked with a favorable outcome (19). Due to our limited cohort size and thus not sufficient statistical power, we did not aim to identify a distinct profile associated with response or toxicity. Nevertheless, our longitudinal comparisons allowed for a detailed mapping of expression of various checkpoint molecules relevant in immunotherapy. This could be further enhanced by single cell RNA sequencing, allowing for an in-depth read-out of the transcriptional profile, potentially shedding light on underlying mechanisms of toxicity and efficacy. Therefore, future research should consider inclusion of such methodology in order to correlate outcome parameters with transcriptomics.
However, for all analyses individual patient variables also need to be taken into account, likely influencing outcome as well as potential risk factors for development of CRS/ICANS, e.g. disease status prior to CAR T-cell therapy or concurring inflammation. Considering the restricted statistical power of our small patient cohort, a multivariable analysis to assess the role of these variables was not possible. Instead, we described clinical variables in detail for every patient. Hence, the risk factors can be reviewed in an individual patient approach (Supplementary Tables S2, S3). Nevertheless, a larger and more diverse validation cohort is required, not only to replicate our findings in an independent patient population, but also to include patients with different CAR T-cell products in order to provide a more comprehensive picture with regard to clinical variables influencing outcome and the development of CRS and ICANS using a multivariable model. Such a validation approach is the prerequisite to test the suitability of the identified T-cell phenotypes as a future biomarker. Ultimately, warranting validation of our results, longitudinal in-depth phenotyping of T-cell subsets in patients undergoing CAR T-cell therapy might help identify patients at risk for adverse events as well as read-out of efficacy of the cell product. Therefore, translation of our findings into clinical practice might lead to improved outcome and safety.
Data availability statement
The original contributions presented in the study are included in the article/Supplementary Material. Further inquiries can be directed to the corresponding authors.
Ethics statement
The studies involving humans were approved by Ethikkommission Hannover Medical School. The studies were conducted in accordance with the local legislation and institutional requirements. The participants provided their written informed consent to participate in this study. Written informed consent was obtained from the individual(s) for the publication of any potentially identifiable images or data included in this article.
Author contributions
IO: Conceptualization, Formal analysis, Methodology, Visualization, Writing – original draft. LB: Formal analysis, Methodology, Visualization, Writing – original draft. LR: Formal analysis, Methodology, Writing – review & editing. RS: Formal analysis, Methodology, Validation, Writing – review & editing. JS: Investigation, Writing – review & editing. YX: Writing – review & editing. NM: Investigation, Writing – review & editing. TS: Resources, Writing – review & editing. GB: Investigation, Writing – review & editing. ME: Investigation, Writing – review & editing. AG: Resources, Writing – review & editing. RF: Resources, Writing – review & editing. CS-F: Conceptualization, Formal analysis, Funding acquisition, Investigation, Methodology, Writing – original draft. CK: Conceptualization, Funding acquisition, Investigation, Writing – original draft.
Funding
The author(s) declare financial support was received for the research, authorship, and/or publication of this article. This research was funded by grants from Deutsche Forschungsgemeinschaft (SFB900/B8, Project ID 158989968) (CK) and the German Federal Ministry of Education and Research (01EO1302) (CS-F and CK). LB was supported by the KlinStrucMed program funded by Else Kröner-Fresenius foundation. LR was supported by the TITUS clinician scientist program, which is funded by the Else Kröner-Fresenius foundation. NM was supported by the PRACTIS clinician scientist program, which is funded by Deutsche Forschungsgemeinschaft.
Acknowledgments
We thank Melanie Drenker for sample preparation.
Conflict of interest
Author TS reports honoraria for lectures and travel grants from Alexion, Alnylam Pharmaceuticals, argenx, Bayer Vital, Biogen, Celgene, Centogene, CSL Behring, Euroimmun, Janssen, Merck Serono, Novartis, Pfizer, Roche, Sanofi, Siemens, Sobi, Teva, Viatris; all outside the submitted work.
The remaining authors declare that the research was conducted in the absence of any commercial or financial relationships that could be construed as a potential conflict of interest.
The author(s) declared that they were an editorial board member of Frontiers, at the time of submission. This had no impact on the peer review process and the final decision.
Publisher’s note
All claims expressed in this article are solely those of the authors and do not necessarily represent those of their affiliated organizations, or those of the publisher, the editors and the reviewers. Any product that may be evaluated in this article, or claim that may be made by its manufacturer, is not guaranteed or endorsed by the publisher.
Supplementary material
The Supplementary Material for this article can be found online at: https://www.frontiersin.org/articles/10.3389/fimmu.2024.1298598/full#supplementary-material
References
1. Schuster SJ, Bishop MR, Tam CS, Waller EK, Borchmann P, McGuirk JP, et al. Tisagenlecleucel in adult relapsed or refractory diffuse large B-cell lymphoma. N Engl J Med (2019) 380:45–56. doi: 10.1056/NEJMoa1804980
2. Maude SL, Laetsch TW, Buechner J, Rives S, Boyer M, Bittencourt H, et al. Tisagenlecleucel in children and young adults with B-cell lymphoblastic leukemia. N Engl J Med (2018) 378:439–48. doi: 10.1056/NEJMoa1709866
3. Bethge WA, Martus P, Schmitt M, Holtick U, Subklewe M, von Tresckow B, et al. GLA/DRST real-world outcome analysis of CAR-T cell therapies for large B-cell lymphoma in Germany. Blood (2022) 140:349–58. doi: 10.1182/blood.2021015209
4. Neelapu SS, Tummala S, Kebriaei P, Wierda W, Gutierrez C, Locke FL, et al. Chimeric antigen receptor T-cell therapy — assessment and management of toxicities. Nat Rev Clin Oncol (2018) 15:47–62. doi: 10.1038/nrclinonc.2017.148
5. Schuster SJ, Svoboda J, Chong EA, Nasta SD, Mato AR, Anak Ö, et al. Chimeric antigen receptor T cells in refractory B-cell lymphomas. N Engl J Med (2017) 377:2545–54. doi: 10.1056/NEJMoa1708566
6. Neelapu SS, Locke FL, Bartlett NL, Lekakis LJ, Miklos DB, Jacobson CA, et al. Axicabtagene ciloleucel CAR T-cell therapy in refractory large B-cell lymphoma. N Engl J Med (2017) 377:2531–44. doi: 10.1056/NEJMoa1707447
7. Lee DW, Santomasso BD, Locke FL, Ghobadi A, Turtle CJ, Brudno JN, et al. ASTCT consensus grading for cytokine release syndrome and neurologic toxicity associated with immune effector cells. Biol Blood Marrow Transplant (2019) 25:625–38. doi: 10.1016/j.bbmt.2018.12.758
8. Yakoub-Agha I, Chabannon C, Bader P, Basak GW, Bonig H, Ciceri F, et al. Management of adults and children undergoing chimeric antigen receptor T-cell therapy: best practice recommendations of the European Society for Blood and Marrow Transplantation (EBMT) and the Joint Accreditation Committee of ISCT and EBMT (JACIE). Haematologica (2020) 105:297–316. doi: 10.3324/haematol.2019.229781
9. Pennisi M, Jain T, Santomasso BD, Mead E, Wudhikarn K, Silverberg ML, et al. Comparing CAR T-cell toxicity grading systems: application of the ASTCT grading system and implications for management. Blood Adv (2020) 4:676–86. doi: 10.1182/bloodadvances.2019000952
10. Sterner RC, Sterner RM. Immune effector cell associated neurotoxicity syndrome in chimeric antigen receptor-T cell therapy. Front Immunol (2022) 13:879608. doi: 10.3389/fimmu.2022.879608
11. Möhn N, Bonda V, Grote-Levi L, Panagiota V, Fröhlich T, Schultze-Florey C, et al. Neurological management and work-up of neurotoxicity associated with CAR T cell therapy. Neurol Res Pract (2022) 4:1. doi: 10.1186/s42466-021-00166-5
12. Penack O, Koenecke C. Complications after CD19+ CAR T-cell therapy. Cancers (Basel) (2020) 12:3445. doi: 10.3390/cancers12113445
13. Hay KA, Hanafi L-A, Li D, Gust J, Liles WC, Wurfel MM, et al. Kinetics and biomarkers of severe cytokine release syndrome after CD19 chimeric antigen receptor–modified T-cell therapy. Blood (2017) 130:2295–306. doi: 10.1182/blood-2017-06-793141
14. Yan Z, Zhang H, Cao J, Zhang C, Liu H, Huang H, et al. Characteristics and risk factors of cytokine release syndrome in chimeric antigen receptor T cell treatment. Front Immunol (2021) 12:611366. doi: 10.3389/fimmu.2021.611366
15. Teachey DT, Lacey SF, Shaw PA, Melenhorst JJ, Maude SL, Frey N, et al. Identification of predictive biomarkers for cytokine release syndrome after chimeric antigen receptor T-cell therapy for acute lymphoblastic leukemia. Cancer Discovery (2016) 6:664–79. doi: 10.1158/2159-8290.CD-16-0040
16. Morris EC, Neelapu SS, Giavridis T, Sadelain M. Cytokine release syndrome and associated neurotoxicity in cancer immunotherapy. Nat Rev Immunol (2022) 22:85–96. doi: 10.1038/s41577-021-00547-6
17. Butt OH, Zhou AY, Ances BM, DiPersio JF, Ghobadi A. A systematic framework for predictive biomarkers in immune effector cell-associated neurotoxicity syndrome. Front Neurol (2023) 14:1110647. doi: 10.3389/fneur.2023.1110647
18. Locke FL, Oluwole OO, Kuruvilla J, Thieblemont C, Morschhauser F, Salles G, et al. Association of metabolic tumor volume (MTV) and clinical outcomes in second-line (2L) relapsed/refractory (R/R) large B-cell lymphoma (LBCL) following axicabtagene ciloleucel (Axi-cel) versus standard-of-care (SOC) therapy in ZUMA-7. Blood (2022) 140:638–40. doi: 10.1182/blood-2022-158492
19. García-Calderón CB, Sierro-Martínez B, García-Guerrero E, Sanoja-Flores L, Muñoz-García R, Ruiz-Maldonado V, et al. Monitoring of kinetics and exhaustion markers of circulating CAR-T cells as early predictive factors in patients with B-cell Malignancies. Front Immunol (2023) 14:1152498. doi: 10.3389/fimmu.2023.1152498
20. Cheson BD, Fisher RI, Barrington SF, Cavalli F, Schwartz LH, Zucca E, et al. Recommendations for initial evaluation, staging, and response assessment of Hodgkin and non-Hodgkin lymphoma: the Lugano classification. J Clin Oncol (2014) 32:3059–67. doi: 10.1200/JCO.2013.54.8800
21. Fuss IJ, Kanof ME, Smith PD, Zola H. Isolation of whole mononuclear cells from peripheral blood and cord blood. Curr Protoc Immunol (2009) 85:7.1.1-7.1.8. doi: 10.1002/0471142735.im0701s85
22. Parks DR, Roederer M, Moore WA. A new “Logicle” display method avoids deceptive effects of logarithmic scaling for low signals and compensated data. Cytometry A (2006) 69:541–51. doi: 10.1002/cyto.a.20258
23. Monaco G, Chen H, Poidinger M, Chen J, de Magalhães JP, Larbi A. flowAI: automatic and interactive anomaly discerning tools for flow cytometry data. Bioinformatics (2016) 32:2473–80. doi: 10.1093/bioinformatics/btw191
24. Van Gassen S, Callebaut B, Van Helden MJ, Lambrecht BN, Demeester P, Dhaene T, et al. FlowSOM: Using self-organizing maps for visualization and interpretation of cytometry data. Cytom Part A (2015) 87:636–45. doi: 10.1002/cyto.a.22625
25. Schultze-Florey CR, Chukhno E, Goudeva L, Blasczyk R, Ganser A, Prinz I, et al. Distribution of major lymphocyte subsets and memory T-cell subpopulations in healthy adults employing GLP-conforming multicolor flow cytometry. Leukemia (2021) 35:3021–5. doi: 10.1038/s41375-021-01348-5
26. Odak I, Sikora R, Riemann L, Bayir LM, Beck M, Drenker M, et al. Spectral flow cytometry cluster analysis of therapeutic donor lymphocyte infusions identifies T cell subsets associated with outcome in patients with AML relapse. Front Immunol (2022) 13:999163. doi: 10.3389/fimmu.2022.999163
27. Majzner RG, Mackall CL. Tumor antigen escape from CAR T-cell therapy. Cancer Discovery (2018) 8:1219–26. doi: 10.1158/2159-8290.CD-18-0442
28. Gust J, Hay KA, Hanafi L-A, Li D, Myerson D, Gonzalez-Cuyar LF, et al. Endothelial activation and blood-brain barrier disruption in neurotoxicity after adoptive immunotherapy with CD19 CAR-T cells. Cancer Discovery (2017) 7:1404–19. doi: 10.1158/2159-8290.CD-17-0698
29. Lee DW, Kochenderfer JN, Stetler-Stevenson M, Cui YK, Delbrook C, Feldman SA, et al. T cells expressing CD19 chimeric antigen receptors for acute lymphoblastic leukaemia in children and young adults: a phase 1 dose-escalation trial. Lancet (London England) (2015) 385:517–28. doi: 10.1016/S0140-6736(14)61403-3
30. Klaver Y, van Steenbergen SCL, Sleijfer S, Debets R, Lamers CHJ. T cell maturation stage prior to and during GMP processing informs on CAR T cell expansion in patients. Front Immunol (2016) 7:648. doi: 10.3389/fimmu.2016.00648
31. Cuesta-Mateos C, Terrón F, Herling M. CCR7 in blood cancers – review of its pathophysiological roles and the potential as a therapeutic target. Front Oncol (2021) 11:736758. doi: 10.3389/fonc.2021.736758
32. Alrumaihi F. The multi-functional roles of CCR7 in human immunology and as a promising therapeutic target for cancer therapeutics. Front Mol Biosci (2022) 9:834149. doi: 10.3389/fmolb.2022.834149
33. Jiang VC, Hao D, Jain P, Li Y, Cai Q, Yao Y, et al. TIGIT is the central player in T-cell suppression associated with CAR T-cell relapse in mantle cell lymphoma. Mol Cancer (2022) 21:185. doi: 10.1186/s12943-022-01655-0
34. Stamper CC, Zhang Y, Tobin JF, Erbe DV, Ikemizu S, Davis SJ, et al. Crystal structure of the B7-1/CTLA-4 complex that inhibits human immune responses. Nature (2001) 410:608–11. doi: 10.1038/35069118
Keywords: CAR T-cell, DLBCL diffuse large B-cell lymphoma, ALL acute lymphoblastic leukemia, tisagenlecleucel tisa-cel, spectral flow cytometry, immunophenotyping, CRS cytokine release syndrome, ICANS immune effector cell associated neurotoxicity syndrome
Citation: Odak I, Bayir LM, Riemann L, Sikora R, Schneider J, Xiao Y, Möhn N, Skripuletz T, Beutel G, Eder M, Ganser A, Förster R, Schultze-Florey CR and Koenecke C (2024) Brief research report: in-depth immunophenotyping reveals stability of CD19 CAR T-cells over time. Front. Immunol. 15:1298598. doi: 10.3389/fimmu.2024.1298598
Received: 21 September 2023; Accepted: 08 January 2024;
Published: 22 January 2024.
Edited by:
Stephen Goldrick, University College London, United KingdomReviewed by:
Shahram Salek-Ardakani, Inhibrx, United StatesJinghua Lu, National Institute of Allergy and Infectious Diseases (NIH), United States
Copyright © 2024 Odak, Bayir, Riemann, Sikora, Schneider, Xiao, Möhn, Skripuletz, Beutel, Eder, Ganser, Förster, Schultze-Florey and Koenecke. This is an open-access article distributed under the terms of the Creative Commons Attribution License (CC BY). The use, distribution or reproduction in other forums is permitted, provided the original author(s) and the copyright owner(s) are credited and that the original publication in this journal is cited, in accordance with accepted academic practice. No use, distribution or reproduction is permitted which does not comply with these terms.
*Correspondence: Christian R. Schultze-Florey, c2NodWx0emUtZmxvcmV5LmNocmlzdGlhbkBtaC1oYW5ub3Zlci5kZQ==; Christian Koenecke, a29lbmVja2UuY2hpc3RpYW5AbWgtaGFubm92ZXIuZGU=
†These authors have contributed equally to this work and share first authorship
‡These authors have contributed equally to this work and share senior authorship