 Violet Ankunda1
 Joseph Ssebwana Katende1,2
 Gerald Kevin Oluka1,2
 Jackson Sembera1
 Claire Baine1
 Geoffrey Odoch2Peter Ejou2
 Laban Kato2 and The COVID-19 Immunoprofiling Team1,2
 Pontiano Kaleebu1,2
 Jennifer Serwanga1,2*
- 1Viral Pathogens Research Theme, Medical Research Council, Uganda Virus Research Institute and London School of Hygiene and Tropical Medicine, Uganda Research Unit, Entebbe, Uganda
- 2Department of Immunology, Uganda Virus Research Institute, Entebbe, Uganda
Introduction: This study aimed to delineate longitudinal antibody responses to the Pfizer-BioNTech BNT162b2 COVID-19 vaccine within the Ugandan subset of the Sub-Saharan African (SSA) demographic, filling a significant gap in global datasets.
Methods: We enrolled 48 participants and collected 320 specimens over 12 months after the primary vaccination dose. A validated enzyme-linked immunosorbent assay (ELISA) was used to quantify SARS-CoV-2-specific IgG, IgM, and IgA antibody concentrations (ng/ml) and optical densities (ODs). Statistical analyses included box plots, diverging bar graphs, and the Wilcoxon test with Bonferroni correction.
Results: We noted a robust S-IgG response within 14 days of the primary vaccine dose, which was consistent with global data. There was no significant surge in S-IgG levels after the booster dose, contrasting trends in other global populations. The S-IgM response was transient and predominantly below established thresholds for this population, which reflects its typical early emergence and rapid decline. S-IgA levels rose after the initial dose then decreased after six months, aligning with the temporal patterns of mucosal immunity. Eleven breakthrough infections were noted, and all were asymptomatic, regardless of the participants’ initial S-IgG serostatus, which suggests a protective effect from vaccination.
Discussion: The Pfizer-BioNTech BNT162b2 COVID-19 vaccine elicited strong S-IgG responses in the SSA demographic. The antibody dynamics distinctly differed from global data highlighting the significance of region-specific research and the necessity for customised vaccination strategies.
Introduction
A global health crisis triggered by the Severe Acute Respiratory Syndrome Coronavirus 2 (SARS-CoV-2), responsible for the COVID-19 pandemic, necessitated rapid research and development of vaccines. Among these, the Pfizer-BioNTech COVID-19 vaccine (BNT162b2) showed significant efficacy in clinical trials, which were mainly undertaken in Western cohorts. A significant knowledge gap remains regarding the vaccine’s performance in Sub-Saharan Africa (SSA). The region’s distinctive genetic diversity, its widespread endemic diseases, and unique microenvironmental factors, highlight the necessity to assess the performance of these vaccines in this specific demographic. Collectively, these distinct factors have been shown to invariably impact responses to various viral vaccines, highlighting the critical need to understand the implications on COVID-19 vaccines within this specific demographic (1–6). In this study, we analysed the 12-month serological responses to the Pfizer-BioNTech BNT162b2 COVID-19 vaccine in a Ugandan cohort, revealing potential disparities and contributing crucial region-specific data from SSA. This study aimed at guiding the design of vaccination strategies and discerning trajectories of long-term immunity in the region. By examining the correlations between baseline antibody levels, breakthrough infections, and subsequent antibody responses, we aimed to provide insights to appropriately guide public health prevention strategies that aligning with the unique contexts of the region.
We provide a comprehensive one-year analysis of the SARS-CoV-2-specific IgG, IgM, and IgA antibody dynamics for a region typically underrepresented in global vaccine research. We show the elicited seroconversion patterns and how they are influenced by baseline serostatus, with broader implications for booster strategies and breakthrough infections. The findings contribute pivotal insights for refining vaccination strategies and public health policies throughout Africa by bridging a significant knowledge gap. The findings emphasize the importance of understanding diverse vaccine responses to facilitate the formulation of customized and pragmatic immunization strategies.
Materials and methods
Study population and study design
We obtained 320 specimens from 48 participants who were administered two doses of the Pfizer-BioNTech COVID-19 BNT162b2 vaccine, given initially on day 0 and followed by a second booster dose on day 30. Samples were collected over 12-months, from March 21, 2021, to January 6, 2023, to monitor the participants’ antibody responses after vaccination. In this study, 48 participants aged 19 to 49 years were analysed, comprising 22 females (45.8%) and 26 males (54.2%), with a median age of 30 and an interquartile range (IQR) of 25 to 35 years. Blood samples were collected immediately before administration of the first Pfizer-BioNTech BNT162b2 COVID-19 vaccine dose, and subsequently on days 14 (D14PP) and 28 D28PP) following the first dose. A booster dose was administered approximately 30 days after the primary vaccination, followed by sample collections at 14 (D14PB) and 28 days post-boost (D28PB), and then at six (M6PP), nine (M9PP), and twelve (M12PP) months after the primary dose. Of the 48 participants, we had baseline Spike protein-specific IgG (S-IgG) data for 43, enabling us to categorise the cohort based on their S-IgG seropositivity, as shown in Figure 1 and summarised in Table 1.
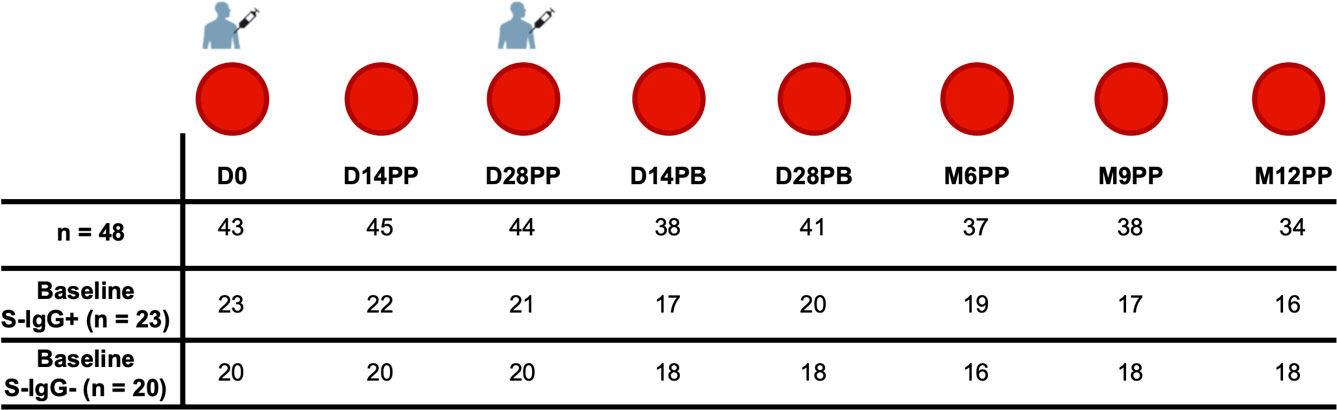
Figure 1 The Pfizer-BioNTech COVID-19 (BNT162b2) vaccine Administration and Sample Collection schedule. This figure illustrates vaccination and sample collection from 48 participants, detailing the number of samples obtained at each time point and the the number of subjects that were baseline S-IgG+ and baseline S-IgG-.
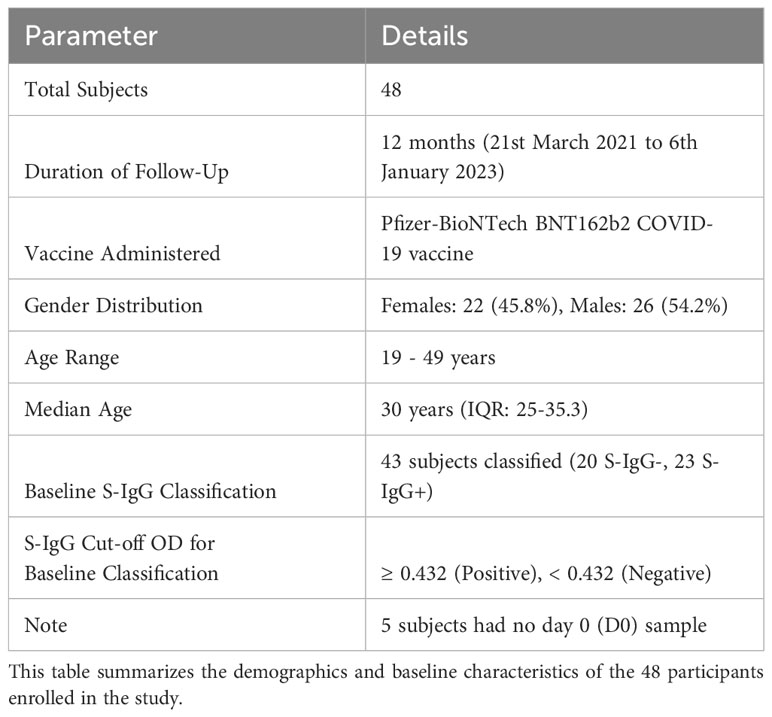
Table 1 Demographic and Methodological Overview of the Study.
Binding antibody ELISA to detect SARS-CoV-2-specific IgG, IgM, and IgA levels
We used a validated enzyme-linked immunosorbent assay (ELISA) protocol (7) to accurately measure SARS-CoV-2-directed antibodies, targeting both spike and nucleoprotein antigens. This allowed us to quantify IgG, IgM, and IgA concentrations in ng/ml based on detected optical densities at 450 nm. We coated the plates with 3 μg/ml antigen, equivalent to a total protein amount of 0.15 μg per well. This concentration was determined through a comprehensive assay validation, which involved testing a range of coating concentrations. The established cut-off values for antibody positivity within this population were: S-directed IgG (0.432), IgM (0.459), and IgA (0.226); and N-directed IgG (0.454), IgM (0.229), and IgA (0.225). Detailed steps regarding the ELISA protocol and cut-off criteria can be found in our previous publication (7, 8).
Statistical methods
We used box plots to visually illustrate the key statistical metrics, including medians as horizontal lines within boxes), means represented as black dots inside the boxes, and quartiles defined by the top and bottom edge of boxes. Diverging bar graphs were used to show the percentage of seroconversion at various follow-up time points. We applied the Wilcoxon test for pairwise comparisons to determine significant differences in antibody responses across time points, with a Bonferroni correction to adjust for multiple testing. Given the occasional missing data/samples across time points, we opted for unpaired tests. A threshold of p > 0.05 was deemed non-significant (ns). Significance levels were as follows: * for p <= 0.05, ** for p < 0.01, *** for p < 0.001, and **** for p < 0.0001.
Results
Dynamic serological responses to primary vaccination: rapid and sustained seroconversion of S-IgG and S-IgA, with transient S-IgM seropositivity
We utilised the pre-established population-specific seropositivity thresholds of 0.432 for S-IgG, 0.459 for S-IgM, and 0.226 for S-IgA, which were previously described (7). At the start of the study (baseline), participants were categorised into two groups as either serologically positive or negative for S-IgG antibodies based on these predefined cutoff values. We present data categorised by baseline S-IgG seropositivity, with participant counts and corresponding seropositivity percentages, reflecting the presence or absence of antibodies at specific time points. All 320 samples were included in the classification analysis, and the distribution of these samples based on S-IgG seropositivity at each time point is visually represented in Figure 2.
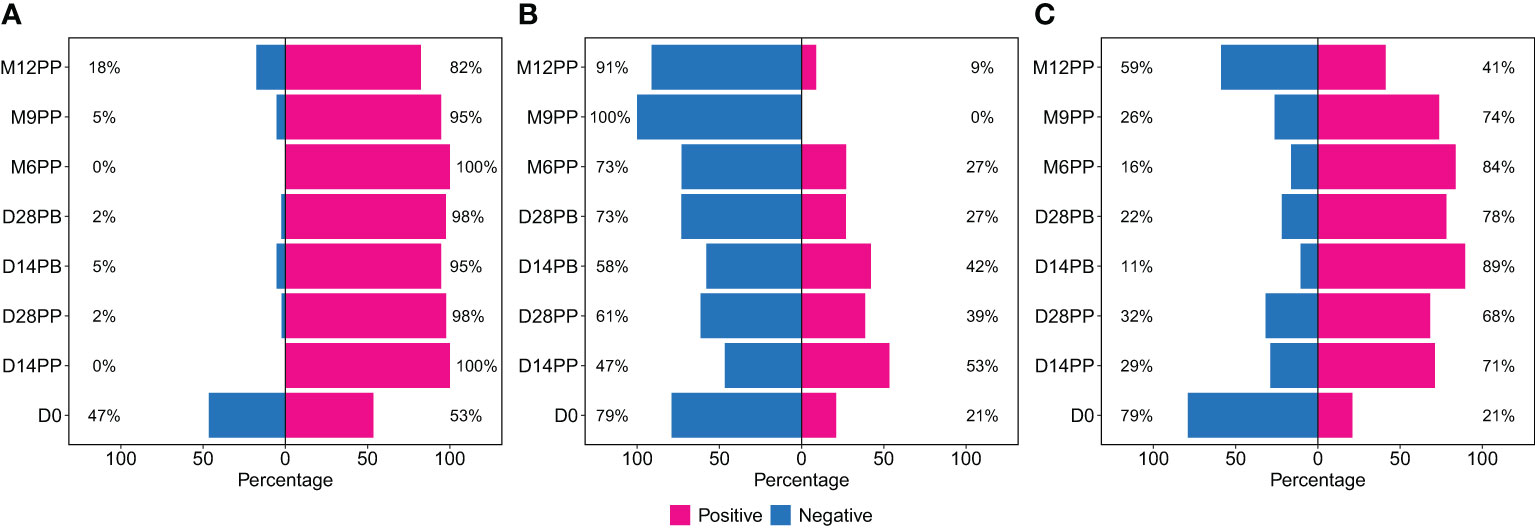
Figure 2 Rates of Spike Protein-Directed Seroconversion Following Pfizer-BioNTech COVID-19 (BNT162b2) Vaccination. This figure shows the percentage of participants who seroconverted at each time point. Using cutoffs of 0.432 for S-IgG, 0.459 for S-IgM, and 0.226 for S-IgA, the 320 samples were categorized as either positive or negative for IgG (A), IgM (B) and IgA (C) antibodies. The bar graphs represent the proportion of participants with positive or negative status at each interval.
We began the study on day 0, with 47% of the participants lacking S-IgG antibodies. By day 14 after the initial vaccination, all participants showed S-IgG positivity; these levels persisted above 80% throughout the subsequent study duration, as depicted in Figure 2A. The S-IgM antibodies initially appeared in 21% of participants on day 0, reaching a peak of 53% on day 14 post-primary vaccination. However, most participants saw their antibody levels decline, reaching seropositivity rates of 27% six months after the primary dose and eventually dropping to zero nine months the primary vaccination, as shown in Figure 2B. The proportion of individuals with detectable S-IgA antibodies exhibited a notable increase post-vaccination, rising from 21% at baseline to 71% two weeks after the initial dose. This trend continued, reaching a peak of 89% two weeks following the booster dose. Subsequent levels of IgA seropositivity remained consistently high, above 70% for an extended period before declining to 41% at the 12-month mark (Figure 2C).
Median nucleoprotein-directed IgG (N-IgG) antibodies remained predominantly suboptimal throughout the study, showing a non-significant increase only at the 12-month mark, regardless of the baseline S-IgG serostatus (Supplementary Figures 1A, B). Initially, positive N-IgG responses were detected in only 26% of the participants. This proportion remained relatively stable, hovering around 20% until 28 days post-booster dose. Subsequently, there was a gradual increase to 38% at six months, escalating further to 62% by 12 months, as represented in Supplementary Figure 1C. Alongside this, N-IgM antibody levels were consistently low across all participants, irrespective of baseline S-IgG seropositivity status (Supplementary Figures 1D, E). The proportion of S-IgM seropositive participants gradually decreased from 51% at baseline to 24% on D28PB, surged to 57% at six months, suggesting possible breakthrough infections, and then sharply fell to 6% by 12 months (Supplementary Figure 1F).
Post-vaccination trends revealed strong S-IgG response, limited impact of booster dose, suboptimal S-IgM Levels, and transient S-IgA elevation
We next examined the dynamics of Spike-directed antibodies, observing a significant increase in S-IgG levels from baseline to day 14 post-prime, sustained until 28 days post boost, after which a decline was evident, as determined by box plots and the unpaired Wilcoxon test, summarised in Figure 3. The baseline median OD values on day 0 were 0.464 with an interquartile range (IQR) of 0.250 to 0.793, corresponding to concentrations of 40.986 binding antibody units (BAU)/ml (IQR 20.314 to 113.864), as shown in Figures 3A, B, Table 2. Antibody levels surged to median OD levels of 1.247 and concentrations of 534.576 BAU/ml by day 14 post-prime (IQR: 0.850–1.474 and 204.062–1257.831, respectively), and remained elevated at day 28 post-boost, with OD values of 1.330 (IQR 1.147, 1.489) and concentrations of 642.461 BAU/ml (IQR 341.770, 993.056). S-IgG OD levels significantly declined between six to twelve months post-prime, as detailed in Figure 3A and Table 2. Following the initial surge, S-IgG antibody concentrations remained statistically stable throughout the follow-up period, illustrated in Figure 3B. In contrast, S-IgM antibody responses consistently exhibited suboptimal trends over this duration, as depicted in Figures 3C, D. Significant increases in S-IgA antibody levels, as indicated by elevated ODs and concentrations, were observed 14 days after the initial dose, persisting for nine months post-prime, followed by a notable decline in OD levels beyond nine months (Figures 3E, F). Nucleoprotein-directed antibody levels (N-IgG) were predominantly suboptimal, displaying a non-significant increase at month 12, while median N-IgM levels consistently remained low throughout the study period, Supplementary Figure 2.
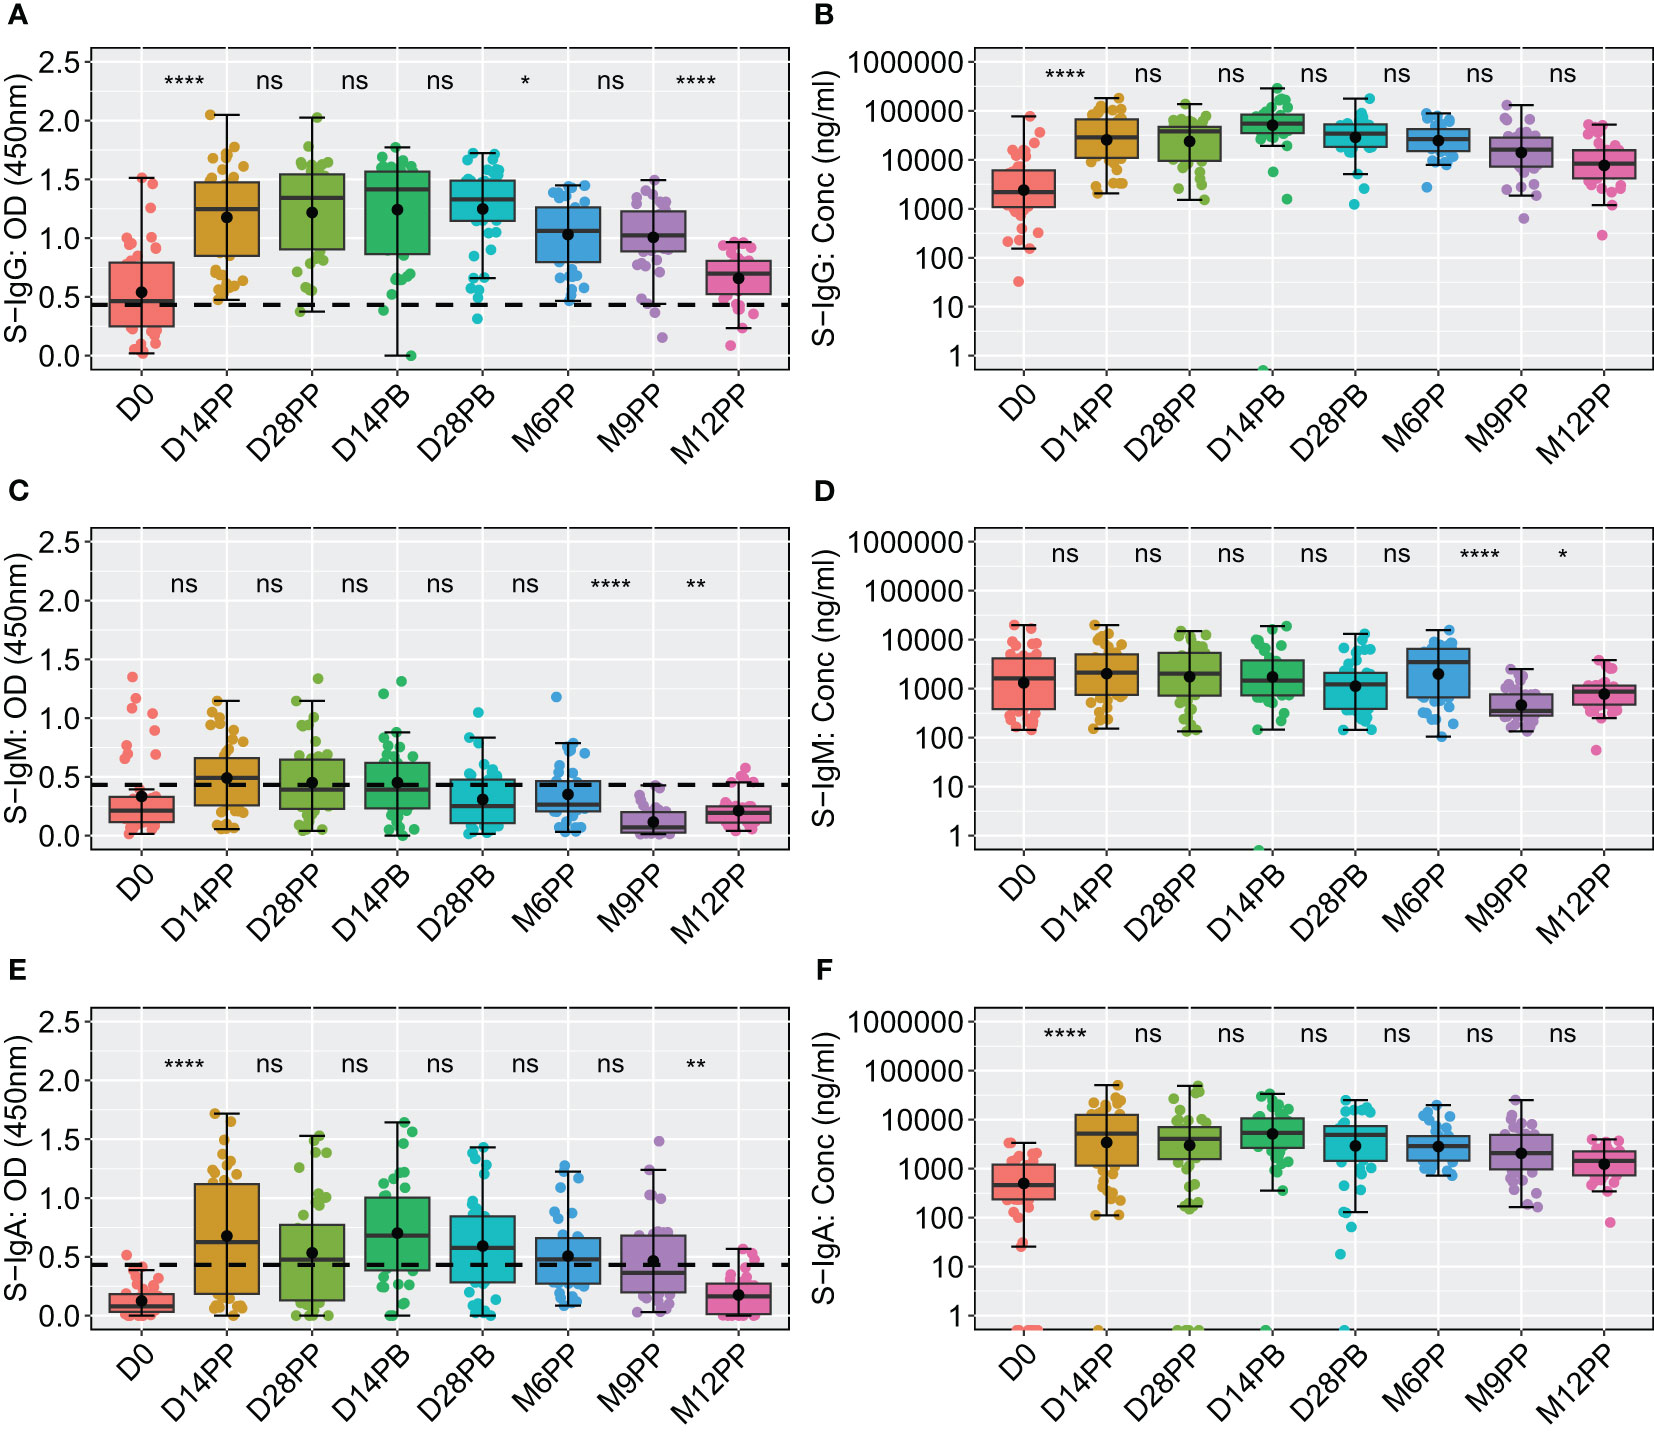
Figure 3 Comparative Analysis of Spike-Directed Antibody Responses: Boxplot Representation Across Different Time Points. This figure shows the distribution of antibody responses over time using boxplots, highlighting the median (lines), mean (black circles), and quartiles for IgG (A, B), IgM (C, D) and IgA (E, F). Significant differences between adjacent time points were assessed using an unpaired Wilcoxon test with a Bonferroni correction for multiple testing. Notation ns denotes p-values > 0.05 and was considered insignificant. *p ≤ 0.05, **p < 0.01, and ****p < 0.0001, indicating increasing levels of statistical significance.
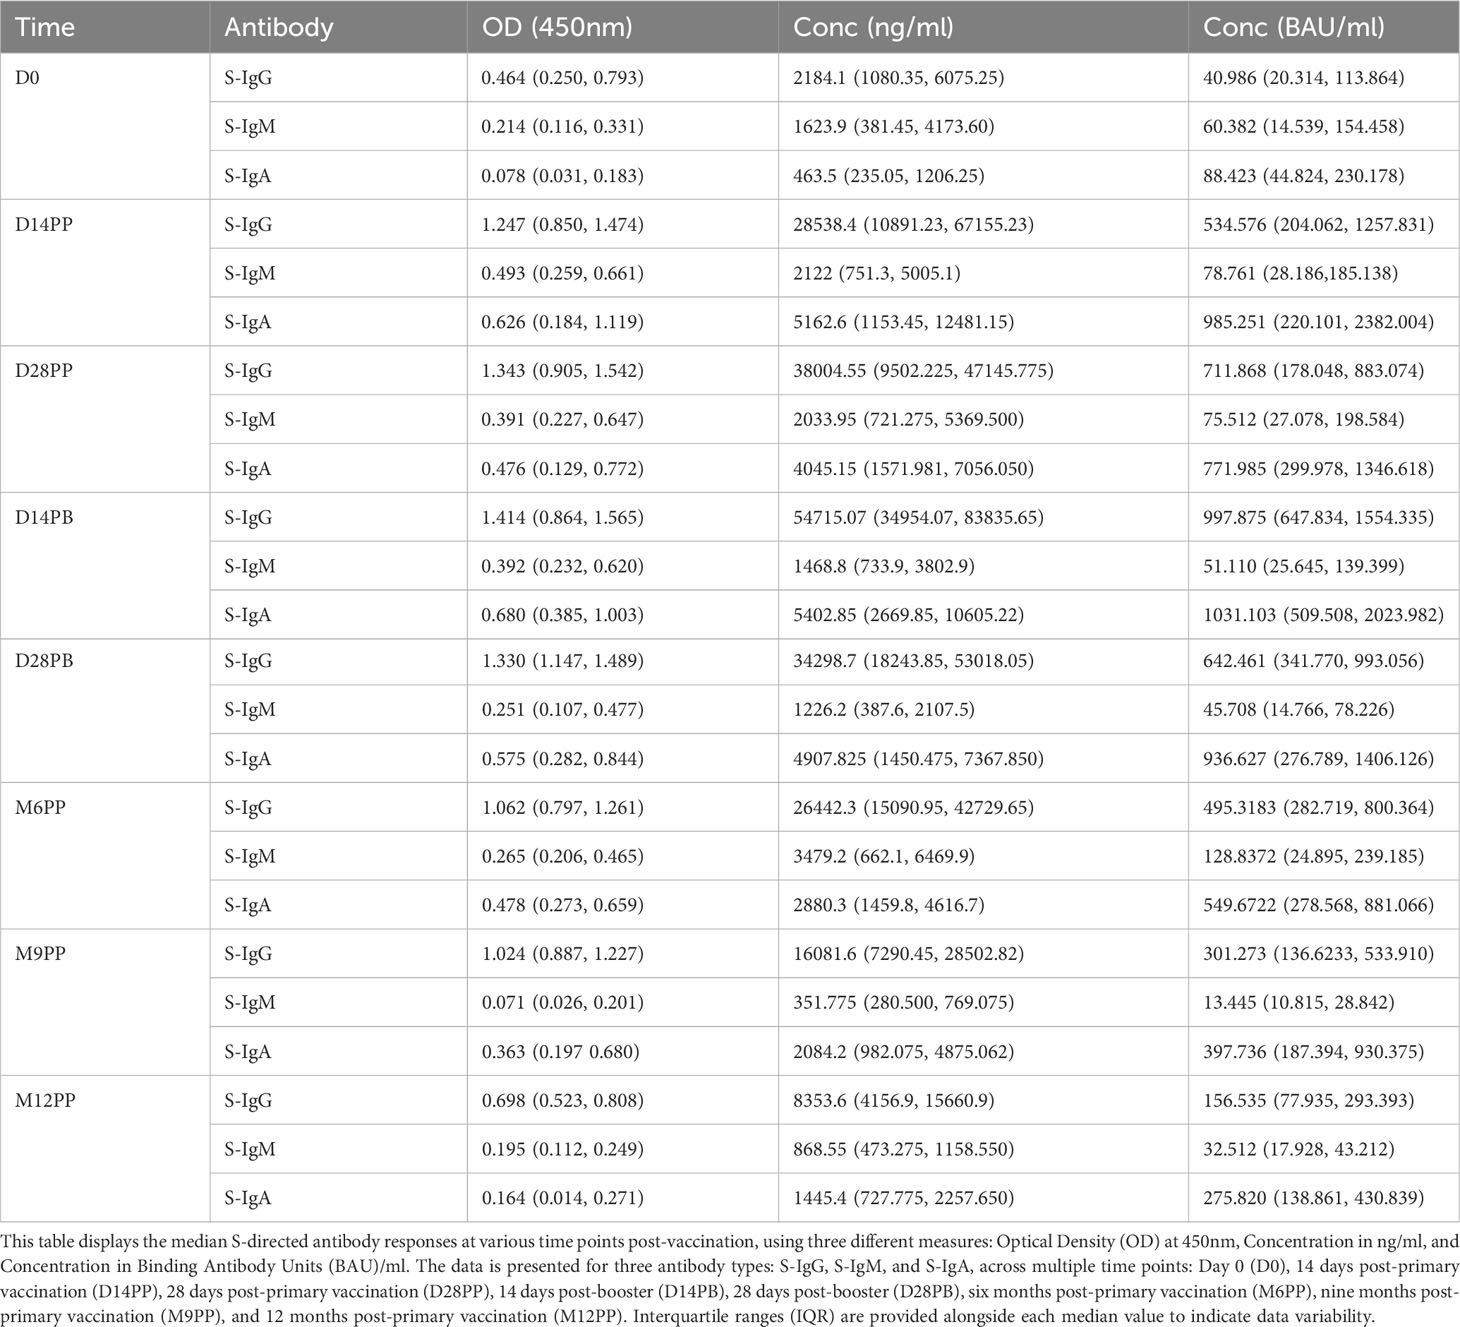
Table 2 displaying the median S-directed antibody responses, including interquartile ranges (IQR), at each specified time point.
The availability of baseline S-IgG serostatus data for 43 individuals, allowed us to stratify our analysis based on their initial S-IgG seropositivity. Individuals were categorised as either S-IgG+ (in red) if their levels met or exceeded the S-IgG cutoff or as S-IgG- (in blue) if their levels fell below the threshold, as shown in Figure 4. There was a significant increase in S-IgG antibody responses 14 days after the initial dose, observed in both S-IgG positive and negative groups. While baseline antibody levels at D0 significantly differed between the two groups, with S-IgG+ participants displaying higher responses, the distributions of S-IgG antibody OD levels and concentrations after vaccination remained statistically indistinguishable (Figures 4A, B). After 14 days of priming, the S-IgG antibody concentrations remained comparable between both groups with no discernible enhancement in immune responses after the booster dose administration. Throughout the study, we consistently observed low S-IgM antibody responses below the established cutoff, with no distinguishable differences in S-IgM antibody OD levels (Figures 4C) and concentrations (Figure 4D) between participants who initially tested positive for S-IgG and those who did not. S-IgA antibody levels showed an initial increase within the first 14 days after priming, maintaining this elevation until 28 days post-boost, followed by a gradual decline. Notably, the responses did not significantly differ between participants with baseline S-IgG antibodies (S-IgG+) and those without (S-IgG-) at any assessed time points, as depicted in Figures 4E, F. The data show a robust S-IgG response post-vaccination, suboptimal S-IgM, and gradually declining moderate S-IgA responses after six months, highlighting key immunological dynamics.
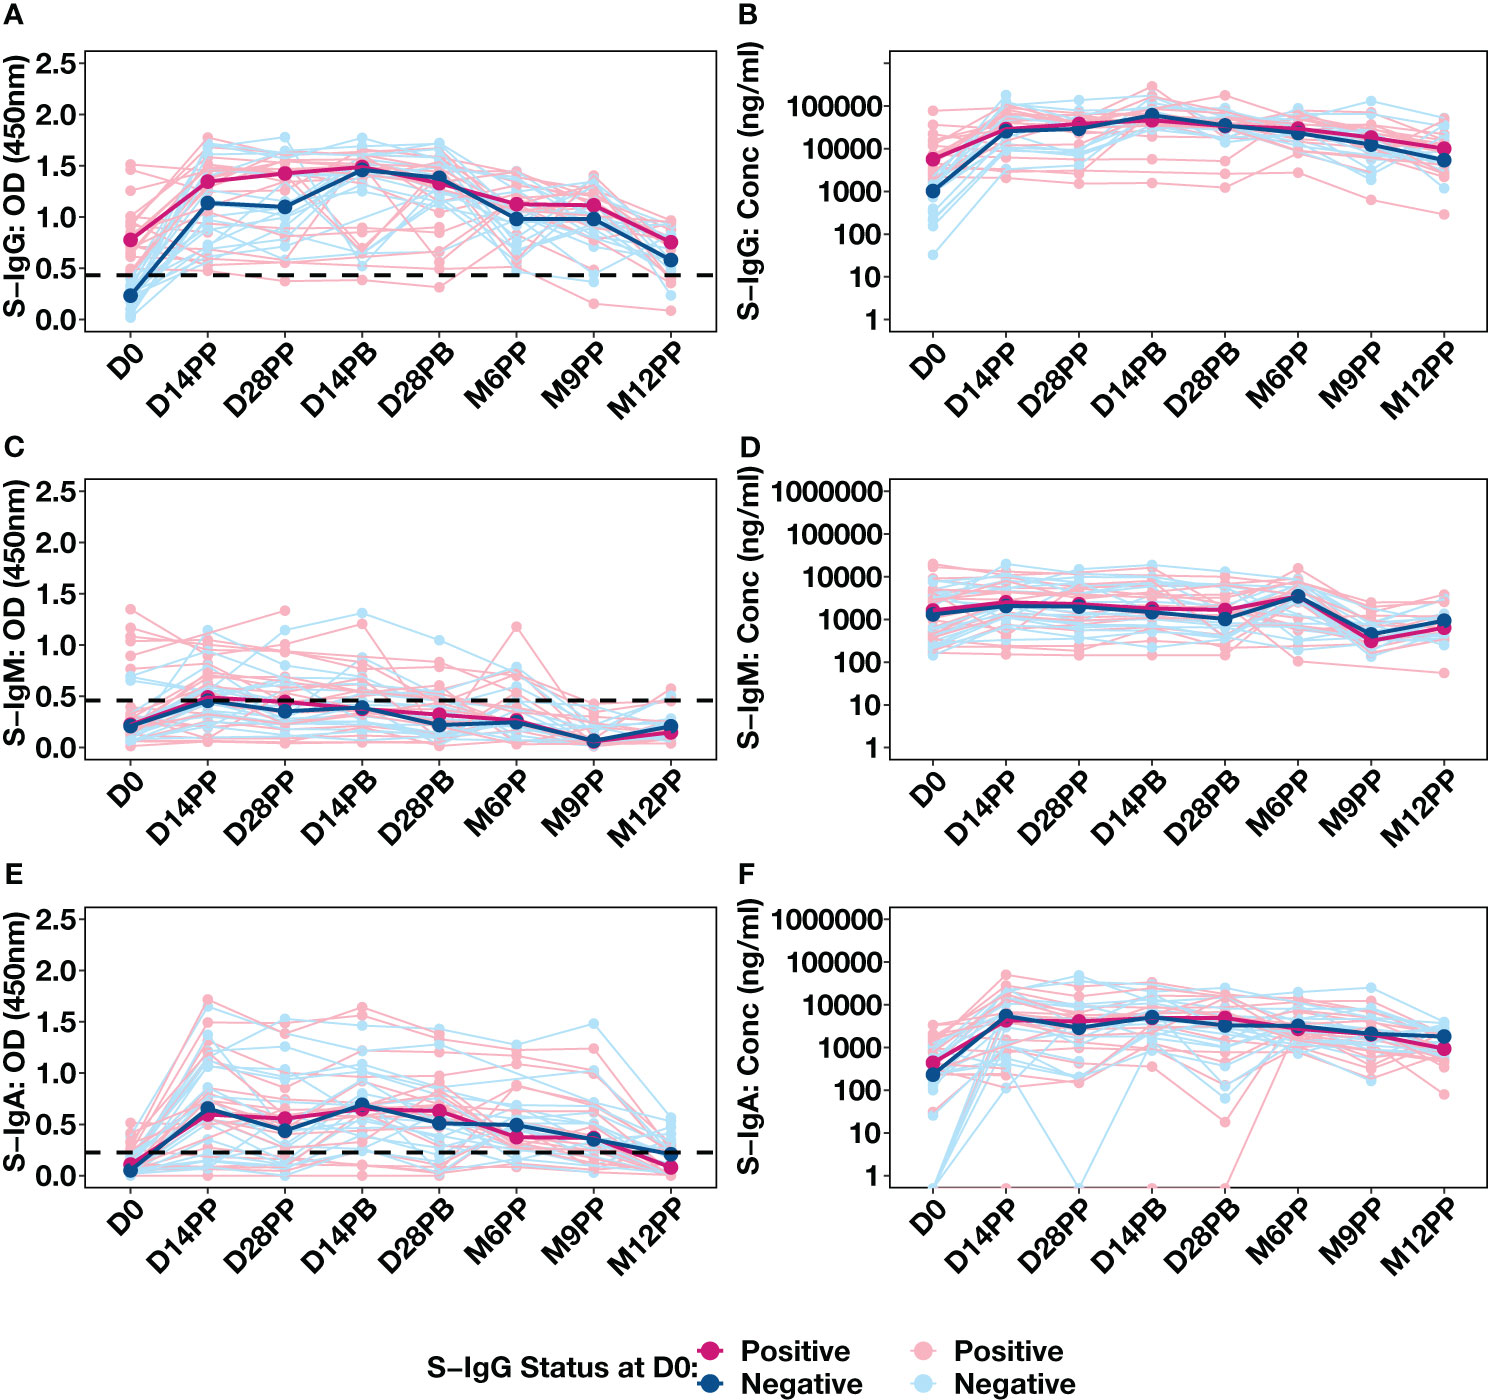
Figure 4 Individual Antibody Response Profiles Categorized by Baseline Spike Protein IgG Seropositivity. This figure shows the antibody responses against the Spike protein, including IgG (A, B), IgM (C, D), and IgA (E, F). Participants were colour-coded based on S-IgG seropositivity at baseline: positive in pink (S-IgG levels ≥ S-IgG cutoff) and negative in blue. Thick lines indicate group median values, while thin lines depict individual profiles.
Longitudinal analysis of post-vaccination breakthrough infections reveals no significant differences based on baseline S-IgG serostatus
We generated heatmaps illustrating the median fold-changes in Spike-directed antibody responses between consecutive timepoints, based on pairwise analyses of antibody OD levels (Figure 5A) and concentrations (Figure 5B). Increased responses are presented in red, while reduced responses are depicted in green. Significant fold increases in S-IgG and S-IgA antibody responses were observed 14 days after the baseline (D0), with minimal changes observed between subsequent time points. There were minimal fluctuations in S-IgM levels across pairwise time points. In various studies, methods to distinguish reinfection from initial infection have shown consistency. A macaque study identified a 7.6-fold increase in N-IgG antibody levels as indicative of reinfection (9), paralleled by a human study in West Africa suggesting a 7-fold rise (10). Similar patterns of titre increase were also observed in high-income settings (11, 12). A recent and more controlled hospital-based study in Spain defined reinfections as a rise of at least 5.9% in titres of anti-nucleoprotein antibodies and/or a minimum of 5.1% increase in anti-RBD titres, provided there was no booster vaccination in the preceding three months (13). Here, we used an 11-fold increase in N-IgG levels, which was previously established as the threshold for presuming an infection in this population. Consequently, an 11-fold increase in N-IgG antibody levels after a completed vaccination regimen served as an indicative marker for potential breakthrough infection. Individuals who exhibited this surge in antibody levels within 14 days of their final vaccine dose were categorized as breakthrough cases. Eleven breakthrough infections were observed at varying time intervals following completion of the full vaccination course: seven cases emerged at six months post-vaccination, while two occurred at nine months and two at one-year post-primary vaccination, as depicted in Figure 5C. Excluding breakthrough infections, S-IgG antibody concentrations significantly increased 14 days post-prime, remaining stable after that. S-IgM remained suboptimal, while S-IgA notably rose until day 14, stabilising slightly above the threshold, as shown in Supplementary Figure 3.
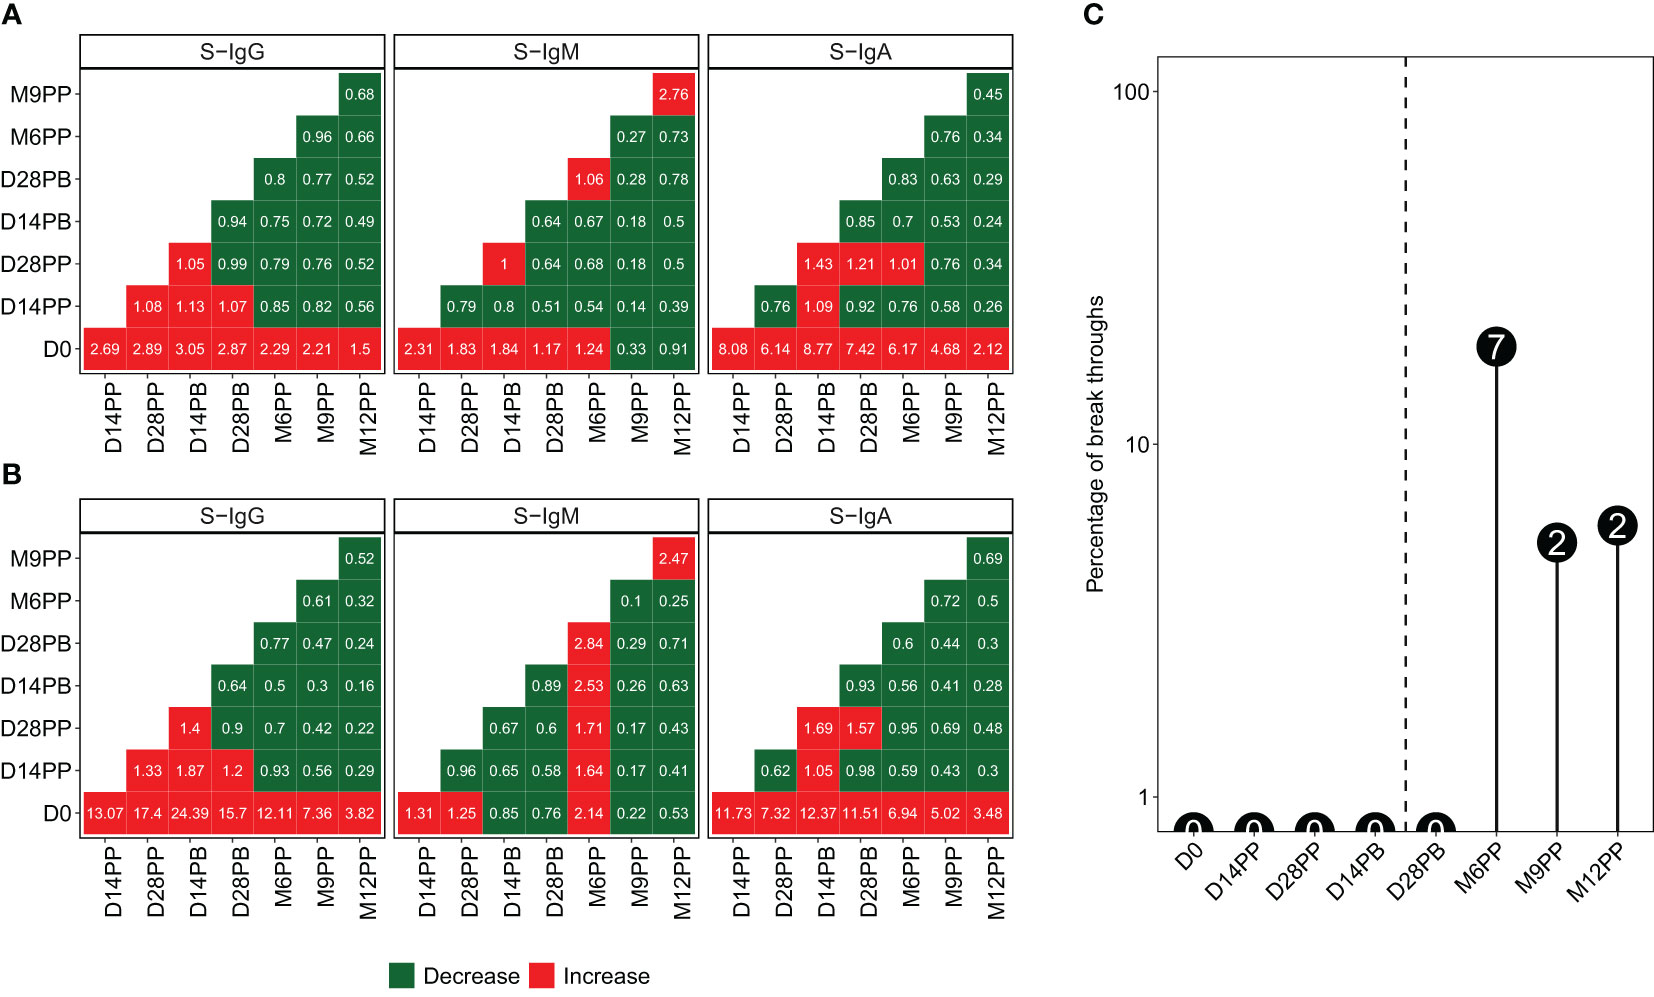
Figure 5 Variations in anti-Spike Antibody Levels and Incidence of Breakthrough Infections Following Pfizer-BioNTech COVID-19 (BNT162b2) Vaccination. Median antibody level changes over time, presented as optical density (OD) levels (A) and concentrations (B), using red for increases and green for decreases, alongside the percentage and number of breakthrough cases at each time point (C).
The early rise in S-IgG antibody responses in initially seronegative participants aligned with seropositive counterparts in the subsequent study duration
At the outset of the study (D0), among 48 participants, 23 exhibited S-IgG seropositivity, 20 were seronegative, and five lacked baseline specimens. Initially, individuals with baseline S-IgG seropositivity displayed high antibody concentrations, which remained elevated and generally stable over time (Figure 6A), with a notable significant decline in OD levels observed at 12 months post-prime compared to 9 months, depicted in Figure 6B. These participants exhibited suboptimal levels of S-IgM (Figures 6C, D), with a moderate increase in S-IgA from D0 to D14PP, which persisted until M9PP before a declining significantly, as illustrated in Figures 6E, F.
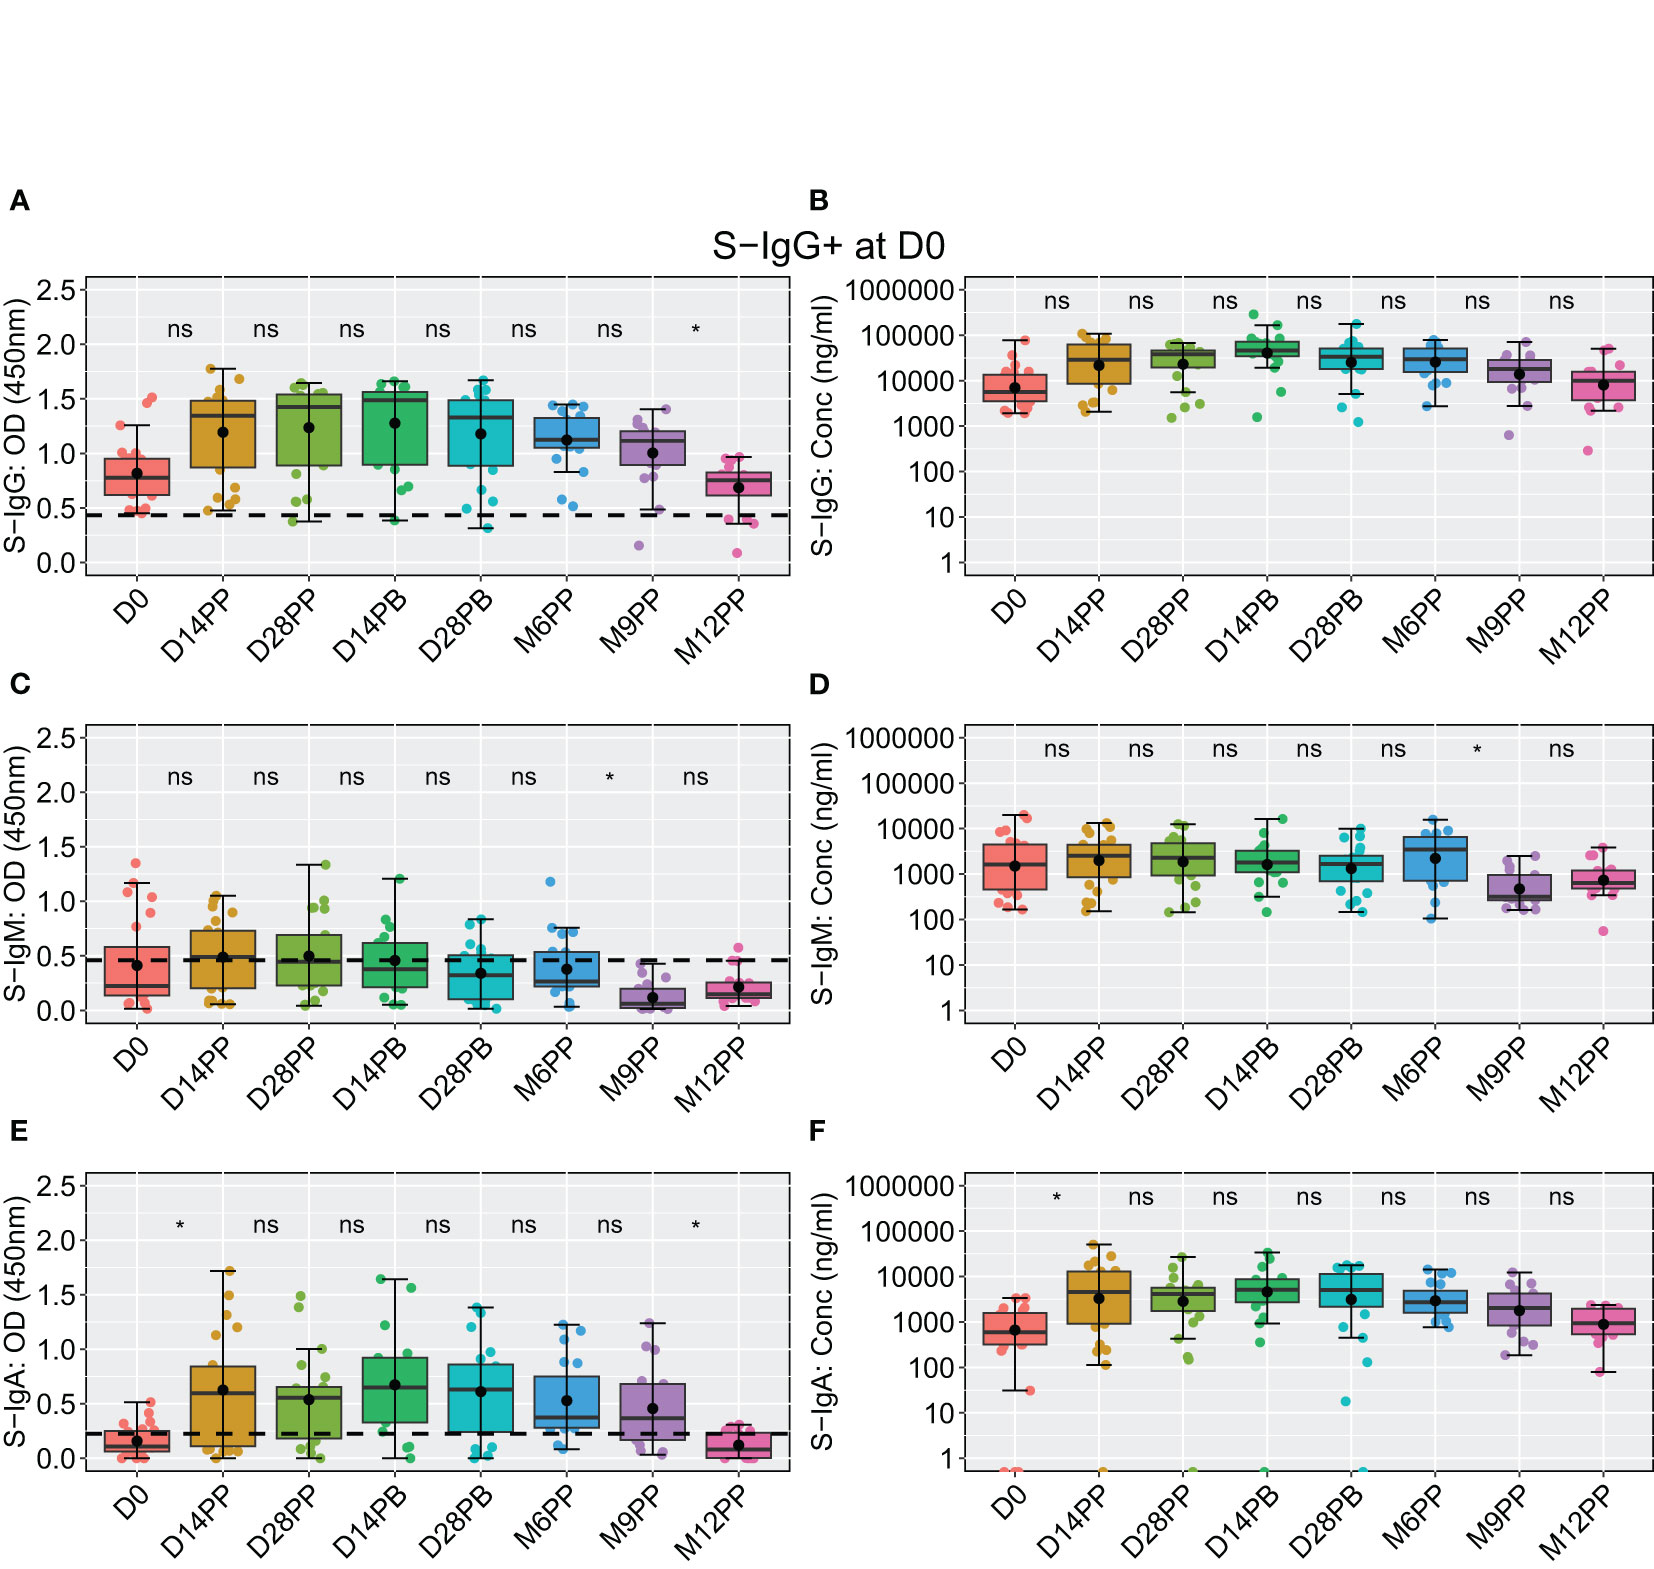
Figure 6 Longitudinal Analysis of BNT162b2-Induced Spike-Specific Antibody Responses in Baseline S-IgG Seropositive Individuals Over 12 months. Boxplots visually summarizing for 23 individuals that were seropositive for spike-directed IgG antibodies at baseline displaying temporal dynamics of spike-directed IgG (A, B), IgM (C, D), and IgA (E, F) antibody responses over the 12 months of follow up. in baseline S-IgG+ participants, with median lines, mean as black circles, and quartiles at box edges. Differences between time points were assessed using an unpaired Wilcoxon test with Bonferroni correction, denoted as ns (p > 0.05) and *(p ≤ 0.05).
Among the 20 participants lacking S-IgG antibodies at baseline, a significant rise in S-IgG levels was observed two weeks post-vaccination, with concentrations remaining statistically stable through the study period, including after boosting; however, at the six-month mark, a noticeable decline in optical density (OD) levels became evident, as depicted in Figures 7A, B. These participants consistently demonstrated suboptimal levels of S-IgM antibodies throughout the observation period (Figures 7C, D). At the same time, S-IgA responses exhibited an initial increase from D0 to D14 after the initial vaccination, followed by a gradual decline from two weeks after the booster shot and throughout subsequent visits, as indicated by optical densities and concentration measurements (Figures 7E, F).
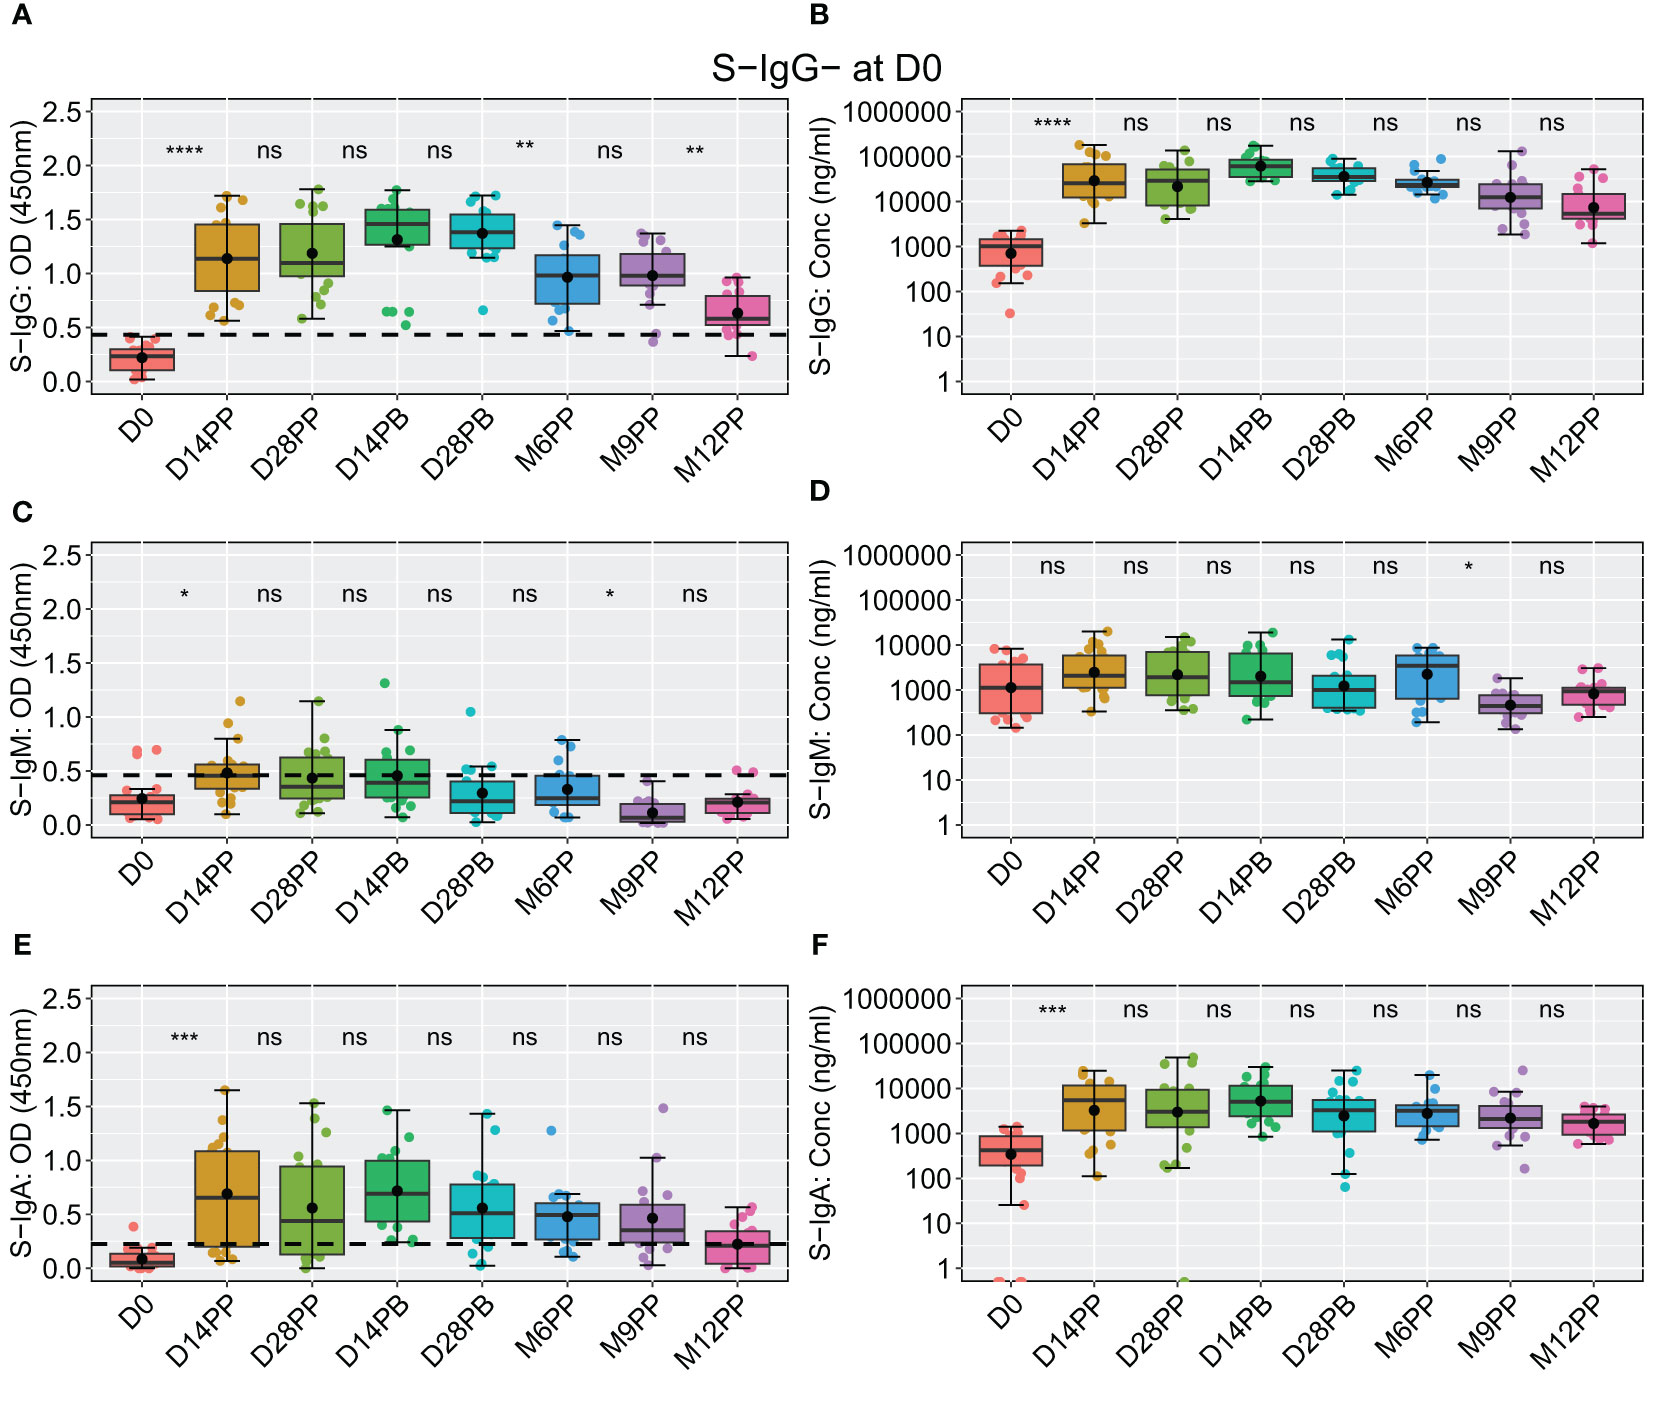
Figure 7 Comprehensive Analysis of the Pfizer-BioNTech BNT162b2 Vaccine-induced Spike-Directed Antibody Responses in S-IgG- Participants Over Time. Illustrates the dynamics of the Pfizer-BioNTech BNT162b2 vaccine-induced Spike-directed antibody responses (IgG, IgM, IgA) in 20 participants initially lacking anti-spike IgG (S-IgG) at baseline (Day 0). Panels (A–F) show the distribution of antibody optical density (OD) levels and concentrations in ng/ml across time points for IgG (A, B), IgM (C, D), and IgA (E, F). Statistical analysis involved the Wilcoxon test for unpaired pairwise comparisons, with Bonferroni correction for multiple testing, to address missing data points. Boxplots display median (line), mean (black circle), and quartile values (box edges). Significance levels are indicated as: ns (p > 0.05), *(p ≤ 0.05), **(p < 0.01), ***(p < 0.001), ****(p < 0.0001).
Discussion
In the global response to the SARS-CoV-2 pandemic, the Pfizer-BioNTech COVID-19 Vaccine (BNT162b2) was pivotal, showing notable efficacy in global populations (14). Despite its effectiveness, data on the Pfizer-BioNTech COVID-19 (BNT162b2) vaccine’s performance in the genetically diverse and distinct African demographic (15–17), with its prevalent activated microenvironments (1, 4, 18), known to impact vaccine-induced immunity (6, 19), remains notably scarce. This study was initiated in March 2021 alongside the first rollout of COVID-19 vaccines in Uganda. We navigated the pragmatic challenges of a national mass vaccination campaign during a lockdown, which prioritised broad coverage over the assessment of prior infections. Recognising established data indicating the more extended durability of spike-directed IgG antibodies compared to N-IgG antibodies in this population (20) and elsewhere (13), we used baseline levels of both as proxies for prior exposure, acknowledging earlier studies revealing low pre-epidemic cross-reactivity in this population (21). This enabled us to examine the enhancement of spike-directed antibody responses in the Ugandan population following vaccination, offering a realistic depiction of the vaccine’s performance in this demographic under real-life conditions. The rapid spike-directed IgG response within two weeks of the initial vaccine dose concurred with global trends and highlighted the vaccine’s effectiveness across varied demographics (22). We noted consistent levels of S-IgG antibodies after boosting, aligning with some populations (23), and with other vaccine types administered in this population (24, 25), but contrasts with others where levels distinctly declined 4-6 months post-vaccination (26–28). The antibody persistence in our Ugandan cohort suggests a potential benefit in modifying the boosting interval, as supported by mouse models (29), and the need to optimise vaccination strategies in this population.
The observed disparities may stem from factors such as genetic variations, unique HLA patterns in the African population affecting antigen processing (15), previous SARS-CoV-2 exposure potentially conferring immunity (30), and the consequences of premature boosting. The transient, subdued S-IgM response observed aligns with its typical early appearance and subsequent decline in favor of memory responses, as evidenced in natural infections within this population (20) and others (31, 32). S-IgA, essential in mucosal defence against SARS-CoV-2 (33), initially rose but declined by six months post-prime, providing insights into the temporal dynamics of mucosal immunity (23, 34), which is a crucial role against SARS-CoV-2 (35, 36). Breakthrough infections, uniformly distributed across groups irrespective of initial S-IgG levels, were asymptomatic, suggesting the effectiveness of the elicited immunity.
This study offers valuable insights but is limited by its small sample size (n=48), which may not fully represent the diverse SSA demographic (37–39). In line with this, our study’s limited sample size precluded an extensive stratification by gender. However, based on previous research into natural COVID-19 infections in this study setting, there was no substantial evidence to suggest gender-based differences in immunogenicity (20). Secondly, only binding antibody responses were examined, without their functional capacity (40) or T-cell-mediated immunity (41, 42), both of which are crucial for sustained viral defence. Also, there remains a need to fully reveal the long-term immune memory or responsiveness to evolving SARS-CoV-2 variants. Investigating the T-cell and genetic influences on the induced immunity will be crucial for optimising vaccination strategies. Consideration of the interplay between prior infections and dominant SARS-CoV-2 strains will inform optimisation of vaccine protocols for the region.
In conclusion, this study highlighted the antibody responses to the Pfizer-BioNTech COVID-19 vaccine in SSA, a demographic previously underrepresented in global datasets. We observed a strong S-IgG response, with notable differences in S-IgM and S-IgA dynamics and responses relative to baseline S-IgG serostatus. A post-boost surge was absent, emphasizing the need to re-evaluate the boosting strategies. Region-centric studies are vital to ensure that vaccination strategies resonate with diverse serological, environmental, and genetic contexts.
Data availability statement
The raw data supporting the conclusions of this article will be made available by the authors, without undue reservation.
Ethics statement
The studies involving humans were approved by Uganda Virus Research Institute’s Research and Ethics Committee (GC/127/833) and the Uganda National Council for Science and Technology (HS637ES). The studies were conducted in accordance with the local legislation and institutional requirements. The participants provided their written informed consent to participate in this study.
Author contributions
VA: Formal analysis, Validation, Writing – original draft, Writing – review & editing, Data curation, Software. JK: Data curation, Writing – review & editing, Investigation, Methodology. GKO: Data curation, Investigation, Methodology, Writing – review & editing. JaS: Investigation, Methodology, Writing – review & editing. CB: Writing – review & editing, Data curation, Investigation, Methodology. GO: Writing – review & editing, Investigation, Methodology. PE: Writing – review & editing, Investigation, Methodology. LK: Data curation, Investigation, Methodology, Writing – review & editing. PK: Conceptualization, Funding acquisition, Supervision, Writing – original draft, Writing – review & editing. JeS: Conceptualization, Data curation, Formal analysis, Funding acquisition, Investigation, Project administration, Resources, Supervision, Validation, Visualization, Writing – original draft, Writing – review & editing.
The COVID-19 immunoprofiling team
Christine Hermilia Akoli1, Angela Namuyanja1, Solomon Opio1, Arthur Watelo Kalyebi1, Ivan Ssali1, Ben Gombe1, Susan Mugaba1 and Hellen Nantambi2.
Funding
The author(s) declare financial support was received for the research, authorship, and/or publication of this article. The Government of Uganda supported this work through the Science, Technology, and Innovation Secretariat, Office of the President (STI-OP) under grant number MOSTI-PRESIDE-COVID-19-2020/15. Some objectives of this work were partially funded by the EDCTP2 program, backed by the European Union (grant number RIA2020EF-3008-COVAB). The research was carried out at the MRC/UVRI and LSHTM Uganda Research Unit, a collaboration between the UK Medical Research Council (MRC), an entity of UK Research and Innovation (UKRI), and the UK Foreign, Commonwealth, and Development Office (FCDO) under the MRC/FCDO Concordat agreement. This unit is also affiliated with the EDCTP2 programme supported by the European Union. The Bill & Melinda Gates Foundation partly funded this work through the GIISER Uganda Grant (Investment ID INV-036306). The conclusions and findings presented are solely those of the authors and do not represent the foundation’s positions or policies.
Acknowledgments
We sincerely thank all participants whose samples contributed to this longitudinal cohort study. The reagent, Monoclonal Anti-SARS Coronavirus Recombinant Human Antibody (Clone CR3022, produced in HEK293 Cells), was procured through BEI Resources, NIAID, NIH, and produced under HHSN272201400008C. The reagent, Monoclonal Anti-SARS Coronavirus Recombinant Human IgG1 (Clone CR3022), produced in Nicotiana benthamiana, was sourced from BEI Resources, NIAID, NIH (NR-52392). The Nucleoprotein mAb CR3009 (Product No. 101011) utilized as a positive control was sourced from the Centre for AIDS Reagents, NIBSC, UK.
Conflict of interest
The authors declare that the research was conducted in the absence of any commercial or financial relationships that could be construed as a potential conflict of interest.
Publisher’s note
All claims expressed in this article are solely those of the authors and do not necessarily represent those of their affiliated organizations, or those of the publisher, the editors and the reviewers. Any product that may be evaluated in this article, or claim that may be made by its manufacturer, is not guaranteed or endorsed by the publisher.
Supplementary material
The Supplementary Material for this article can be found online at: https://www.frontiersin.org/articles/10.3389/fimmu.2024.1325387/full#supplementary-material
Supplementary Figure 1 | Profile Plots Depicting Individual N-directed Responses of Antibodies and Seroconversion Across Different Time Points. Supplementary Figure 1 displays the profiles of nucleoprotein-directed IgG and IgM binding antibody responses among study participants, stratified by baseline spike-directed IgG seropositivity. Baseline S-IgG-positive individuals (S-IgG+) are represented in red, while S-IgG-negative individuals (S-IgG-) are in blue. Line graphs show individual participant profiles (light-coloured lines) along with the group median (thick, dark-coloured lines). Divergent bar graphs show the percentage of seroconversion at each follow-up time point. (A–C) illustrate IgG responses, while (D–F) represent IgM responses. Median antibody levels for S-IgG+ and S-IgG- baseline participants are compared in the line graphs, while N-seroconversion frequencies are highlighted in the diverging bar graphs.
Supplementary Figure 2 | Box plots illustrating the Longitudinal Assessment of Nucleoprotein Antibody Responses After Vaccination with no Breakthrough Participants. Supplementary Figure 2. illustrates the temporal profile of N-directed antibody responses across 12 months in the cohort. (A, B) display Nucleoprotein IgG optical density (OD) and concentrations, while IgM levels are depicted in (C, D). Data distributions are summarised using boxplots, with medians represented by lines, means indicated by black circles, and quartiles marked by box edges. Significance between consecutive time points was determined using an unpaired Wilcoxon test with Bonferroni correction, denoting non-significant differences as “ns” (p > 0.05), ** (p < 0.01).
Supplementary Figure 3 | Box Plots Demonstrating Longitudinal Spike-Directed Antibody Responses Post-Vaccination, Excluding Breakthrough Cases. Supplementary Figure 3 depicts the temporal profiles of antibody responses in Pfizer-BioNTech COVID-19 (BNT162b2) vaccine recipients without breakthrough infections over 12 months. (A, B) illustrate spike-directed IgG optical density (OD) levels and concentrations, respectively, while (C, D) show IgM antibodies, and (E, F) represent IgA. Boxplots are used to summarise the data distributions, with medians indicated by lines, means represented by black circles, and quartiles by box edges. Statistical significance between consecutive time points was assessed using an unpaired Wilcoxon test with Bonferroni correction, denoted as follows: (ns: p > 0.05; *: p ≤ 0.05; **: p < 0.01; ***: p < 0.001; ****: p < 0.0001).
References
1. Muyanja E, Ssemaganda A, Ngauv P, Cubas R, Perrin H, Srinivasan D, et al. Immune activation alters cellular and humoral responses to yellow fever 17D vaccine. J Clin Invest (2014) 124:3147–58. doi: 10.1172/JCI75429
2. Pasin C, Balelli I, Van Effelterre T, Bockstal V, Solforosi L, Prague M, et al. Dynamics of the humoral immune response to a prime-boost ebola vaccine: quantification and sources of variation. J Virol (2019) 93:e00579-19. doi: 10.1128/JVI.00579-19
3. Kabagenyi J, Natukunda A, Nassuuna J, Sanya RE, Nampijja M, Webb EL, et al. Urban-rural differences in immune responses to mycobacterial and tetanus vaccine antigens in a tropical setting: A role for helminths? Parasitol Int (2020) 78:102132. doi: 10.1016/j.parint.2020.102132
4. Muir R, Metcalf T, Fourati S, Bartsch Y, Kyosiimire-Lugemwa J, Canderan G, et al. Schistosoma mansoni infection alters the host pre-vaccination environment resulting in blunted Hepatitis B vaccination immune responses. PloS Negl Trop Dis (2023) 17:e0011089. doi: 10.1371/journal.pntd.0011089
5. Zimmermann P, Curtis N. Factors that influence the immune response to vaccination. Clin Microbiol Rev (2019) 32:e00084-18. doi: 10.1128/CMR.00084-18
6. Martin CA, Nazareth J, Jarkhi A, Pan D, Das M, Logan N, et al. Ethnic differences in cellular and humoral immune responses to SARS-CoV-2 vaccination in UK healthcare workers: a cross-sectional analysis. EClinicalMedicine (2023) 58:101926. doi: 10.1016/j.eclinm.2023.101926
7. Oluka GK, Namubiru P, Kato L, Ankunda V, Gombe B, Cotten M, et al. Optimisation and Validation of a conventional ELISA and cut-offs for detecting and quantifying anti-SARS-CoV-2 Spike, RBD, and Nucleoprotein IgG, IgM, and IgA antibodies in Uganda. Front Immunol (2023) 14:1113194. doi: 10.3389/fimmu.2023.1113194
8. Baine C, Jackson S, Oluka GK, Katende JS, Ankunda V, Serwanga J. An optimised indirect ELISA protocol for detection and quantification of anti-viral antibodies in human plasma or serum: A case study using SARS-CoV-2. Bio-protocol (2023) 13:e4905. doi: 10.21769/BioProtoc.4905
9. Siddiqui SM, Bowman KA, Zhu AL, Fischinger S, Beger S, Maron JS, et al. Serological markers of SARS-CoV-2 reinfection. mBio (2022) 13:e0214121. doi: 10.1128/mbio.02141-21
10. Abdullahi A, Oladele D, Owusu M, Kemp SA, Ayorinde J, Salako A, et al. SARS-COV-2 antibody responses to AZD1222 vaccination in West Africa. Nat Commun (2022) 13:6131. doi: 10.1038/s41467-022-33792-x
11. Manisty C, Otter AD, Treibel TA, McKnight A, Altmann DM, Brooks T, et al. Antibody response to first BNT162b2 dose in previously SARS-CoV-2-infected individuals. Lancet (2021) 397:1057–8. doi: 10.1016/S0140-6736(21)00501-8
12. Epsi NJ, Richard SA, Lindholm DA, Mende K, Ganesan A, Huprikar N, et al. Understanding "Hybrid immunity": comparison and predictors of humoral immune responses to severe acute respiratory syndrome coronavirus 2 infection (SARS-CoV-2) and coronavirus disease 2019 (COVID-19) vaccines. Clin Infect Dis (2023) 76:e439–49. doi: 0.1093/cid/ciac392
13. Erice A, Prieto L, Caballero C. Long-term analyses of sars-cov-2 humoral and t cell responses and breakthrough sars-cov-2 infections after two doses of bnt162b2 followed by mrna-1273 and bivalent omicron-adapted bnt162b2 vaccines: a prospective study over 2 years in non-immunocompromised individuals. Vaccines (2023) 11:1835. doi: 10.3390/vaccines11121835
14. Polack FP, Thomas SJ, Kitchin N, Absalon J, Gurtman A, Lockhart S, et al. Safety and efficacy of the BNT162b2 mRNA Covid-19 vaccine. N Engl J Med (2020) 383:2603–15. doi: 10.1056/NEJMoa2034577
15. Sirugo G, Hennig BJ, Adeyemo AA, Matimba A, Newport MJ, Ibrahim ME, et al. Genetic studies of African populations: an overview on disease susceptibility and response to vaccines and therapeutics. Hum Genet (2008) 123:557–98. doi: 10.1007/s00439-008-0511-y
16. Wolday D, Fung CYJ, Morgan G, Casalino S, Frangione E, Taher J, et al. HLA variation and SARS-CoV-2 specific antibody response. Viruses (2023) 15:906. doi: 10.3390/v15040906
17. Srivastava A, Hollenbach JA. The immunogenetics of COVID-19. Immunogenetics (2023) 75:309–20. doi: 10.1007/s00251-022-01284-3
18. Nono JK, Kamdem SD, Netongo PM, Dabee S, Schomaker M, Oumarou A, et al. Schistosomiasis burden and its association with lower measles vaccine responses in school children from rural Cameroon. Front Immunol (2018) 9:2295. doi: 10.3389/fimmu.2018.02295
19. Tukwasibwe S, Mboowa G, Sserwadda I, Nankabirwa JI, Arinaitwe E, Ssewanyana I, et al. Impact of high human genetic diversity in Africa on immunogenicity and efficacy of RTS,S/AS01 vaccine. Immunogenetics (2023) 75:207–14. doi: 10.1007/s00251-023-01306-8
20. Serwanga J, Ankunda V, Sembera J, Kato L, Oluka GK, Baine C, et al. “Rapid, early, and potent Spike-directed IgG, IgM, and IgA distinguish asymptomatic from mildly symptomatic COVID-19 in Uganda, with IgG persisting for 28 months. Front Immunol (2023) 14:1152522. doi: 10.3389/fimmu.2023.1152522
21. Nantambi H, Sembera J, Ankunda V, Ssali I, Kalyebi AW, Oluka GK, et al. Pre-pandemic SARS-CoV-2-specific IFN-gamma and antibody responses were low in Ugandan samples and significantly reduced in HIV-positive specimens. Front Immunol (2023) 14:1148877. doi: 10.3389/fimmu.2023.1148877
22. Walsh EE, Frenck RW Jr., Falsey AR, Kitchin N, Absalon J, Gurtman A, et al. Safety and immunogenicity of two RNA-based Covid-19 vaccine candidates. N Engl J Med (2020) 383:2439–50. doi: 10.1056/NEJMoa2027906
23. Moncunill G, Aguilar R, Ribes M, Ortega N, Rubio R, Salmerón G, et al. Determinants of early antibody responses to COVID-19 mRNA vaccines in a cohort of exposed and naïve healthcare workers. EBioMedicine (2022) 75:103805. doi: 10.1016/j.ebiom.2021.103805
24. Serwanga J, Baine C, Mugaba S, Ankunda V, Auma BO, Oluka GK, et al. Seroprevalence and durability of antibody responses to AstraZeneca vaccination in Ugandans with prior mild or asymptomatic COVID-19: implications for vaccine policy. Front Immunol (2023) 14:1183983. doi: 10.3389/fimmu.2023.1183983
25. Sembera J, Baine C, Ankunda V, Katende JS, Oluka GK, Akoli CH, et al. Sustained spike-specific IgG antibodies following CoronaVac (Sinovac) vaccination in sub-Saharan Africa, but increased breakthrough infections in baseline spike-naive individuals. Front Immunol (2023) 14. doi: 10.3389/fimmu.2023.1255676
26. Mulligan MJ, Lyke KE, Kitchin N, Absalon J, Gurtman A, Lockhart S, et al. Phase I/II study of COVID-19 RNA vaccine BNT162b1 in adults. Nature (2020) 586:589–93. doi: 10.1038/s41586-020-2639-4
27. Chu L, Vrbicky K, Montefiori D, Huang W, Nestorova B, Chang Y, et al. Immune response to SARS-CoV-2 after a booster of mRNA-1273: an open-label phase 2 trial. Nat Med (2022) 28:1042–9. doi: 10.1038/s41591-022-01739-w
28. Notarte KI, Guerrero-Arguero I, Velasco JV, Ver AT, Santos de Oliveira MH, Catahay JA, et al. Characterization of the significant decline in humoral immune response six months post-SARS-CoV-2 mRNA vaccination: A systematic review. J Med Virol (2022) 94:2939–61. doi: 10.1002/jmv.27688
29. Garcia-Dominguez D, Henry C, Ma L, Jani H, Amato NJ, Manning T, et al. Altering the mRNA-1273 dosing interval impacts the kinetics, quality, and magnitude of immune responses in mice. Front Immunol (2022) 13:948335. doi: 10.3389/fimmu.2022.948335
30. Lasrado N, Barouch DH. SARS-CoV-2 hybrid immunity: the best of both worlds. J Infect Dis (2023) 228(10):1311–3. doi: 10.1093/infdis/jiad353
31. Amellal H, Assaid N, Charoute H, Akarid K, Maaroufi A, Ezzikouri S, et al. Kinetics of specific anti-SARS-CoV-2 IgM, IgA, and IgG responses during the first 12 months after SARS-CoV-2 infection: A prospective longitudinal study. PloS One (2023) 18:e0288557. doi: 10.1371/journal.pone.0288557
32. Kurano M, Morita Y, Nakano Y, Yokoyama R, Shimura T, Qian C, et al. Response kinetics of different classes of antibodies to SARS-CoV2 infection in the Japanese population: The IgA and IgG titers increased earlier than the IgM titers. Int Immunopharmacol (2022) 103:108491. doi: 10.1016/j.intimp.2021.108491
33. Sterlin D, Mathian A, Miyara M, Mohr A, Anna F, Claër L, et al. IgA dominates the early neutralizing antibody response to SARS-CoV-2. Sci Transl Med (2021) 13:eabd2223. doi: 10.1126/scitranslmed.abd2223
34. Quinti I, Mortari EP, Fernandez Salinas A, Milito C, Carsetti R. IgA antibodies and IgA deficiency in SARS-CoV-2 infection. Front Cell Infect Microbiol (2021) 11:655896. doi: 10.3389/fcimb.2021.655896
35. Takamatsu Y, Omata K, Shimizu Y, Kinoshita-Iwamoto N, Terada M, Suzuki T, et al. SARS-CoV-2-neutralizing humoral iga response occurs earlier but is modest and diminishes faster than igg response. Microbiol Spectr (2022) 10:e0271622. doi: 10.1128/spectrum.02716-22
36. Wang X, Zhang J, Wu Y, Xu Y, Zheng J. SIgA in various pulmonary diseases. Eur J Med Res (2023) 28:299. doi: 10.1186/s40001-023-01282-5
37. Tukwasibwe S, Traherne JA, Chazara O, Jayaraman J, Trowsdale J, Moffett A, et al. Diversity of KIR genes and their HLA-C ligands in Ugandan populations with historically varied malaria transmission intensity. Malar J (2021) 20:111. doi: 10.1186/s12936-021-03652-y
38. Hill AV, Allsopp CE, Kwiatkowski D, Taylor TE, Yates SN, Anstey NM, et al. Extensive genetic diversity in the HLA class II region of Africans, with a focally predominant allele, DRB1*1304. Proc Natl Acad Sci U.S.A (1992) 89:2277–81. doi: 10.1073/pnas.89.6.2277
39. Pagkrati I, Duke JL, Mbunwe E, Mosbruger TL, Ferriola D, Wasserman J, et al. Genomic characterization of HLA class I and class II genes in ethnically diverse sub-Saharan African populations: A report on novel HLA alleles. Hla (2023) 102:192–205. doi: 10.1111/tan.15035
40. Li CJ, Chao TL, Chang TY, Hsiao CC, Lu DC, Chiang YW, et al. “Neutralizing monoclonal antibodies inhibit SARS-CoV-2 infection through blocking membrane fusion,”. Microbiol Spectr (2022) 10:e0181421. doi: 10.1128/spectrum.01814-21
41. Reimann H, Moosmann C, Schober K, Lang V, Verhagen J, Zeun J, et al. Identification and characterization of T-cell receptors with therapeutic potential showing conserved specificity against all SARS-CoV 2 strains. Immunobiology (2023) 228:152720. doi: 10.1016/j.imbio.2023.152720
42. Graça D, Brglez V, Allouche J, Zorzi K, Fernandez C, Teisseyre M, et al. Both humoral and cellular immune responses to SARS-CoV-2 are essential to prevent infection: a prospective study in a working vaccinated population from Southern France. J Clin Immunol (2023) 43(8):1724–1739. doi: 10.21203/rs.3.rs-2483361/v1
Keywords: Pfizer BioNTech BNT162b2 COVID-19 vaccine, longitudinal antibody responses, Sub-Saharan African populations, seropositivity classification, booster dose, breakthrough infections, Ugandan population, IgG IgM and IgA antibodies
Citation: Ankunda V, Katende JS, Oluka GK, Sembera J, Baine C, Odoch G, Ejou P, Kato L and The COVID-19 Immunoprofiling Team, Kaleebu P and Serwanga J (2024) The subdued post-boost spike-directed secondary IgG antibody response in Ugandan recipients of the Pfizer-BioNTech BNT162b2 vaccine has implications for local vaccination policies. Front. Immunol. 15:1325387. doi: 10.3389/fimmu.2024.1325387
Received: 21 October 2023; Accepted: 31 January 2024;
Published: 16 February 2024.
Edited by:
Albert Jonathan Auguste, Virginia Tech, United StatesReviewed by:
Aneesh Vijayan, Pharmaceutical Companies of Johnson and Johnson, NetherlandsJames Tristan Gordy, Johns Hopkins University, United States
Copyright © 2024 Ankunda, Katende, Oluka, Sembera, Baine, Odoch, Ejou, Kato, and The COVID-19 Immunoprofiling Team, Kaleebu and Serwanga. This is an open-access article distributed under the terms of the Creative Commons Attribution License (CC BY). The use, distribution or reproduction in other forums is permitted, provided the original author(s) and the copyright owner(s) are credited and that the original publication in this journal is cited, in accordance with accepted academic practice. No use, distribution or reproduction is permitted which does not comply with these terms.
*Correspondence: Jennifer Serwanga, SmVubmlmZXIuU2Vyd2FuZ2FAbXJjdWdhbmRhLm9yZw==