 Edia Stemmer
 Tamar Zahavi1
 Mali Salmon‐Divon
- 1Department of Molecular Biology, Ariel University, Ariel, Israel
- 2Kaleidoo, Bar Lev High Tech Park, Misgav, Israel
- 3Obstetrics, Gynecology and Infertility (OB&GYN) Department Maccabi Healthcare Services, Tel Aviv, Israel
- 4Adelson School of Medicine, Ariel University, Ariel, Israel
Background: Understanding the molecular pathogenesis of inflammatory bowel disease (IBD) has led to the discovery of new therapeutic targets that are more specific and effective. Our aim was to explore the molecular pathways and genes involved in IBD pathogenesis and to identify new therapeutic targets and novel biomarkers that can aid in the diagnosis of the disease.
Methods: To obtain the largest possible number of samples and analyze them comprehensively, we used a mega-analysis approach. This involved reprocessing raw data from multiple studies and analyzing them using bioinformatic and machine learning techniques.
Results: We analyzed a total of 697 intestinal biopsies of Ulcerative Colitis (n = 386), Crohn’s disease (n = 183) and non-IBD controls (n = 128). A machine learning analysis detected 34 genes whose collective expression effectively distinguishes inflamed biopsies of IBD patients from non-IBD control samples. Most of these genes were upregulated in IBD. Notably, among these genes, three novel lncRNAs have emerged as potential contributors to IBD development: ENSG00000285744, ENSG00000287626, and MIR4435-2HG. Furthermore, by examining the expression of 29 genes, among the 34, in blood samples from IBD patients, we detected a significant upregulation of 12 genes (p-value < 0.01), underscoring their potential utility as non-invasive diagnostic biomarkers. Finally, by utilizing the CMap library, we discovered potential compounds that should be explored in future studies for their therapeutic efficacy in IBD treatment.
Conclusion: Our findings contribute to the understanding of IBD pathogenesis, suggest novel biomarkers for IBD diagnosis and offer new prospects for therapeutic intervention.
Introduction
Ulcerative colitis (UC) and Crohn’s disease (CD), both forms of inflammatory bowel disease (IBD), are chronic immune-mediated inflammatory diseases that affect the digestive system, characterized by periodic episodes of relapse and remission and currently lacking a definitive cure (1, 2). While UC mainly targets the large intestine (colon), causing continuous surface inflammation, starting from the rectum and extends along the colon, CD can affect any part of the digestive tract, often exhibiting a patchy pattern and frequently occurring in the small intestine, particularly the terminal ileum (3). However, distinguishing between CD and UC in some cases can be challenging, leading to an interim diagnosis of “indeterminate” or “unclassified” colitis and potential treatment delays. Currently, indeterminate colitis remains unresolved in 5-15% of IBD patients (4).
The management of IBD has undergone significant transformation in the past two decades, thanks to the emergence of biological therapies. However, not all patients respond to these biological drugs, and the prevalence of IBD is on the rise globally (5). Hence, early diagnosis and prompt treatment initiation are pivotal strategies to enhance patient outcomes and overall well-being (6).
Upon initiating effective therapy, confirming remission using measurable endpoints is crucial. objective endpoints such as endoscopic, histological, and clinical measures, alongside surrogate biomarkers like blood CRP or fecal calprotectin levels are helping to evaluate and understand the state of the disease. However, the practical application of endoscopic and fecal measurements poses challenges in routine practice and lacks specificity for intestinal inflammation (7). Previous study has emphasized the development of a new molecular measurement, focusing on molecular signature of mucosal and peripheral blood components to enhance accuracy and predict relapse (8).
Recently, the understanding of the molecular pathogenesis of IBD has advanced significantly leading to enhanced disease management. Importantly, specific signaling pathways have emerged as having a pivotal role in the inflammatory process, contributing to dysregulated inflammatory responses and playing essential roles in the development of IBD (9). Key pathways involved in this process include NF-κB pathway, PI3K/Akt signaling pathway, and JAK/STAT signaling pathway (10). Additionally, MAPK signaling pathway, Chemokine signaling pathway, Cytokine-cytokine receptor interaction pathway are significant contributors to diseases associated with inflammation including IBD (11–13). A deeper investigation into these biological pathways may reveal new targets for therapeutic interventions and facilitate the discovering of diagnostic and monitoring biomarkers.
Over the years, extensive research has been conducted on transcriptomic data and gene signatures associated with IBD. The introduction of next-generation sequencing (NGS) has greatly improved our ability to study the disease by providing higher resolution, increased sensitivity, and the capacity to discover novel IBD-related molecular transcripts. Despite these advances, integrating findings from different studies has been challenging due to experimental variations and varying analytical methods. To overcome these challenges, we adopted a comprehensive mega-analysis approach that involved reprocessing and consolidating data from multiple sources. Through this large-scale analysis and the application of standardized methods across the combined dataset, we identified novel biomarkers for IBD diagnosis and offer new prospects for therapeutic intervention.
Materials and methods
To perform the mega-analysis, we conducted a thorough search in public databases for relevant studies. The datasets, which contained raw data, were then downloaded, and consistently reprocessed to facilitate subsequent analyses. The entire study design is visually depicted in Figure 1.
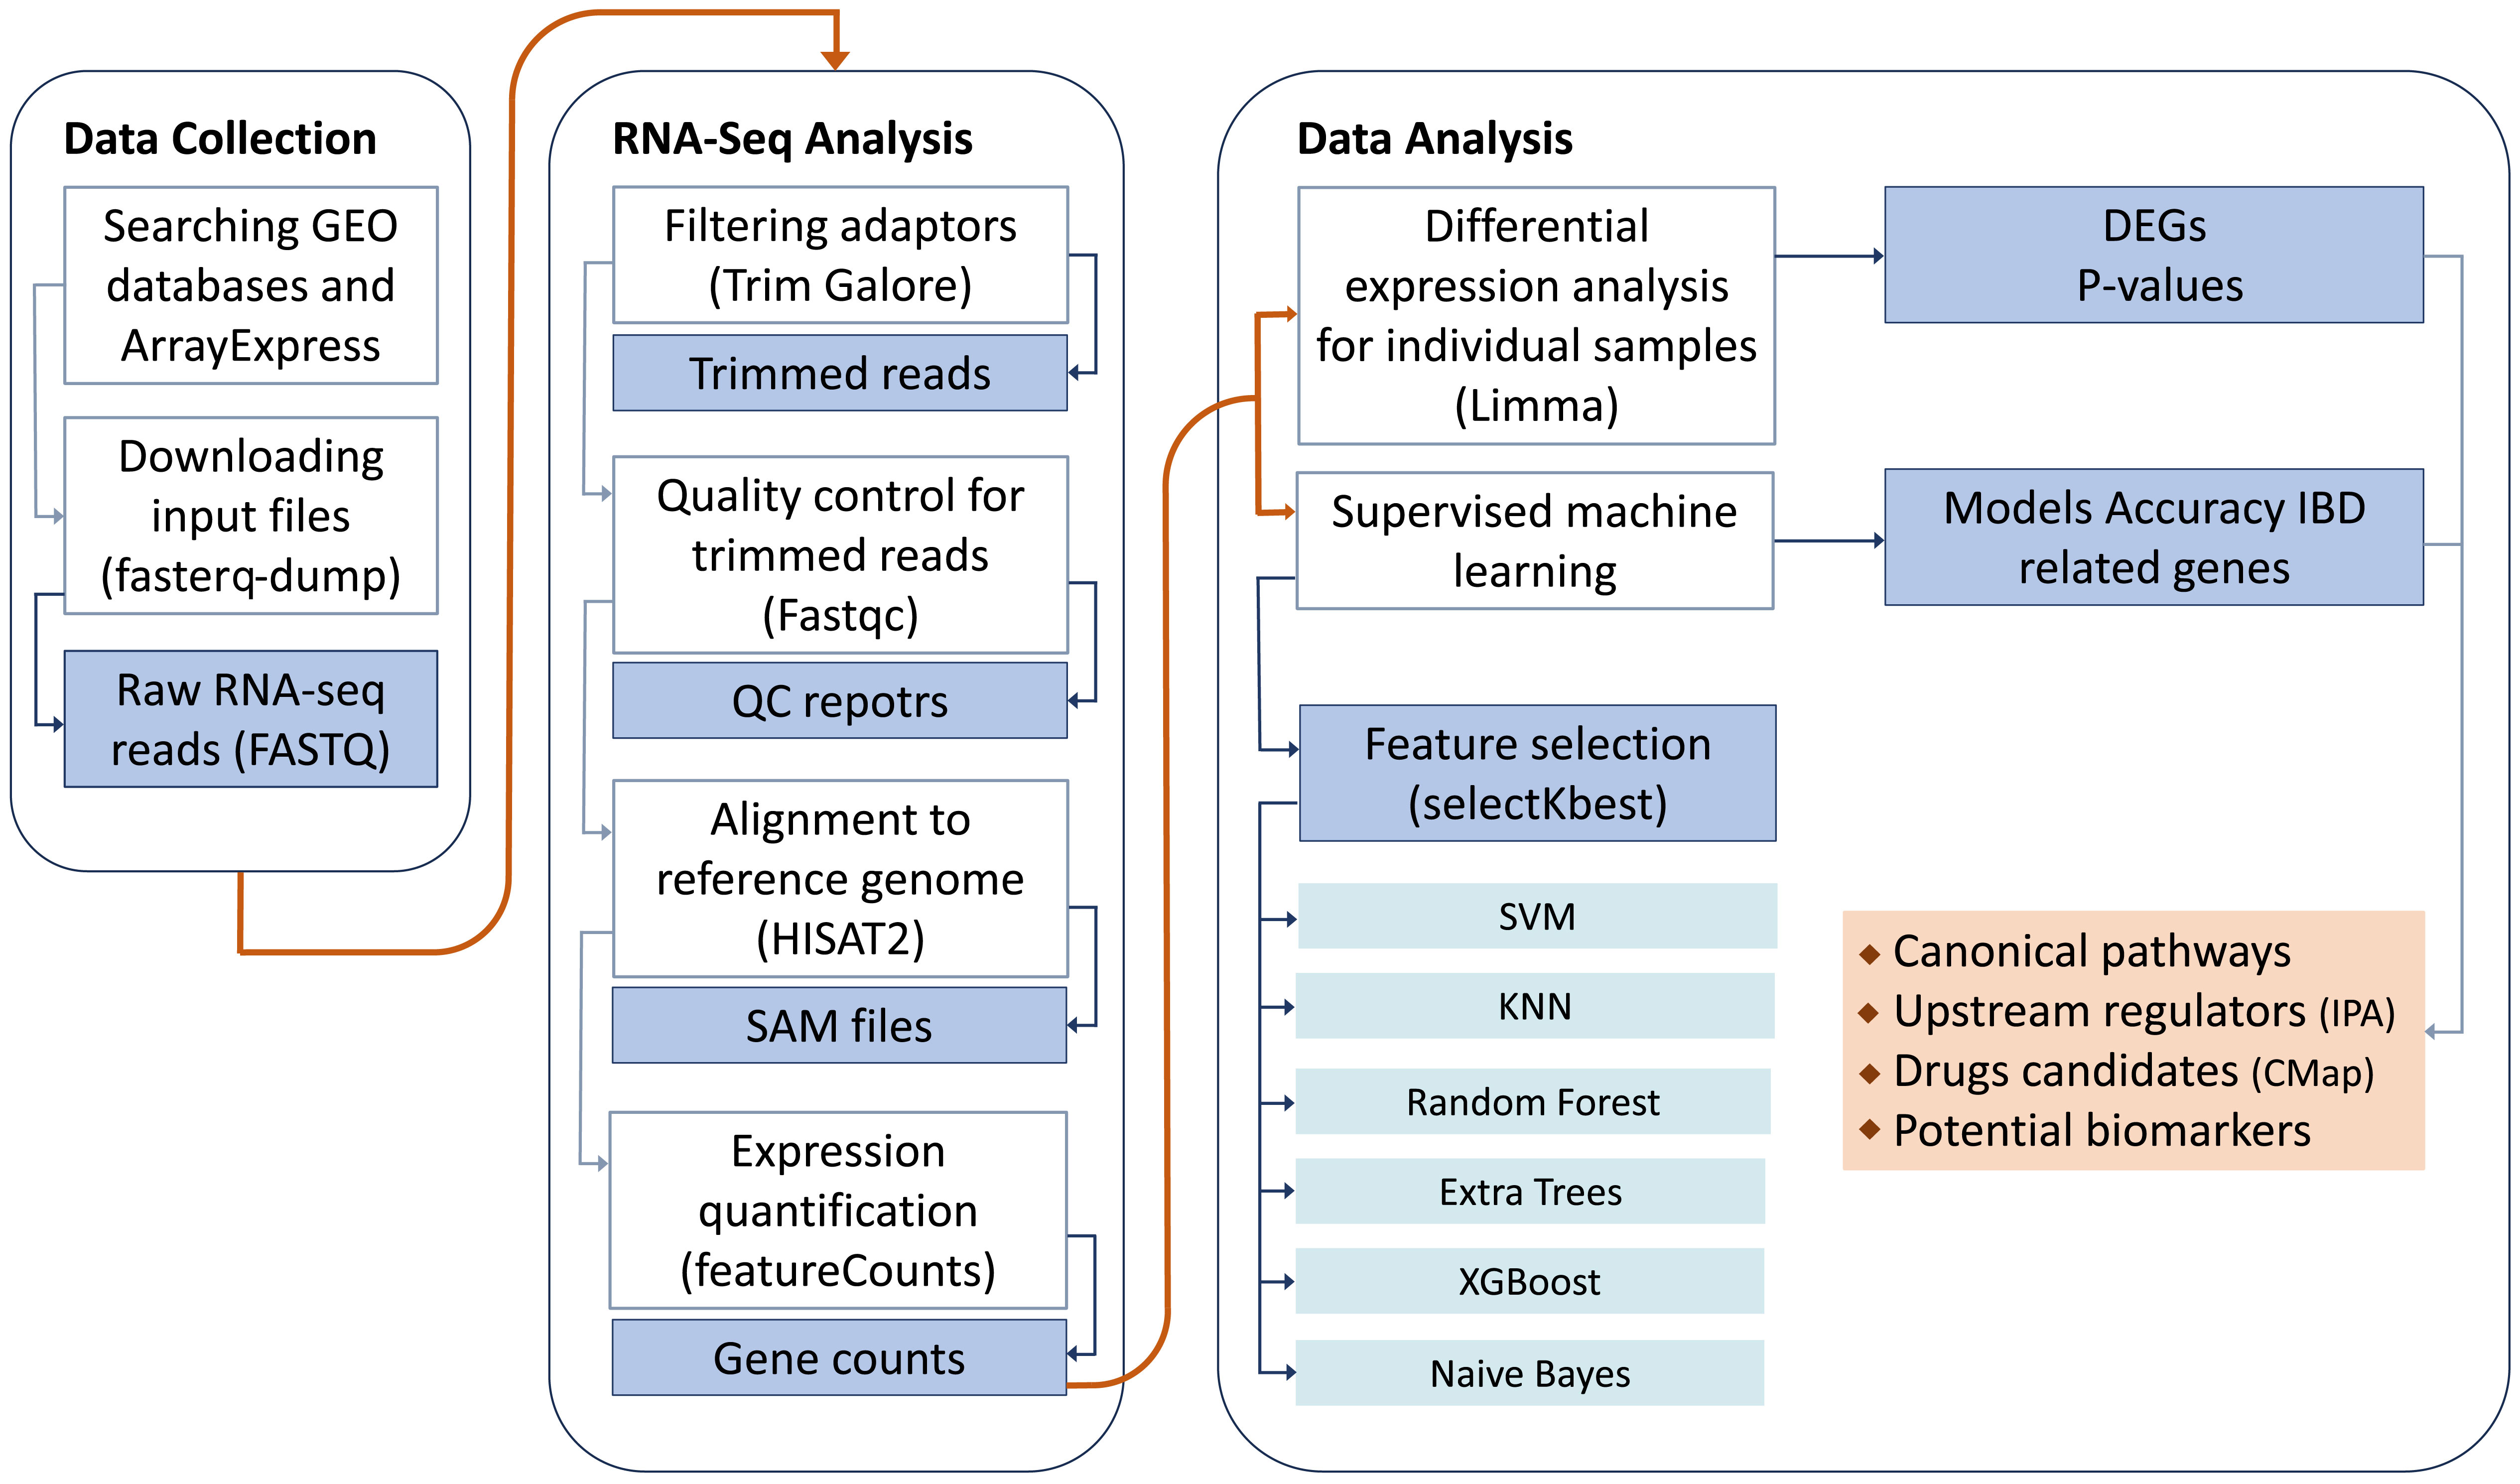
Figure 1 Study design.
Search strategy and study selection criteria
Comprehensive searches of Gene Expression Omnibus (GEO) (14) and ArrayEpress (AE) (15) databases were performed on October 5, 2021. The search terms were as follows: (“Inflammatory Bowel Disease”) OR (“Crohn’s disease”) OR (“Ulcerative colitis”) AND (“high throughput sequencing”[Platform Technology Type]) AND “homo sapiens”[Organism] AND (“RNA-seq” OR “RNAseq” OR “RNA sequencing”). This systematic review was performed according to the Preferred Reporting Items for Systematic Reviews and Meta-Analyses (PRISMA) guidelines (16). The flow chart for the selection of studies is shown in Figure 2.
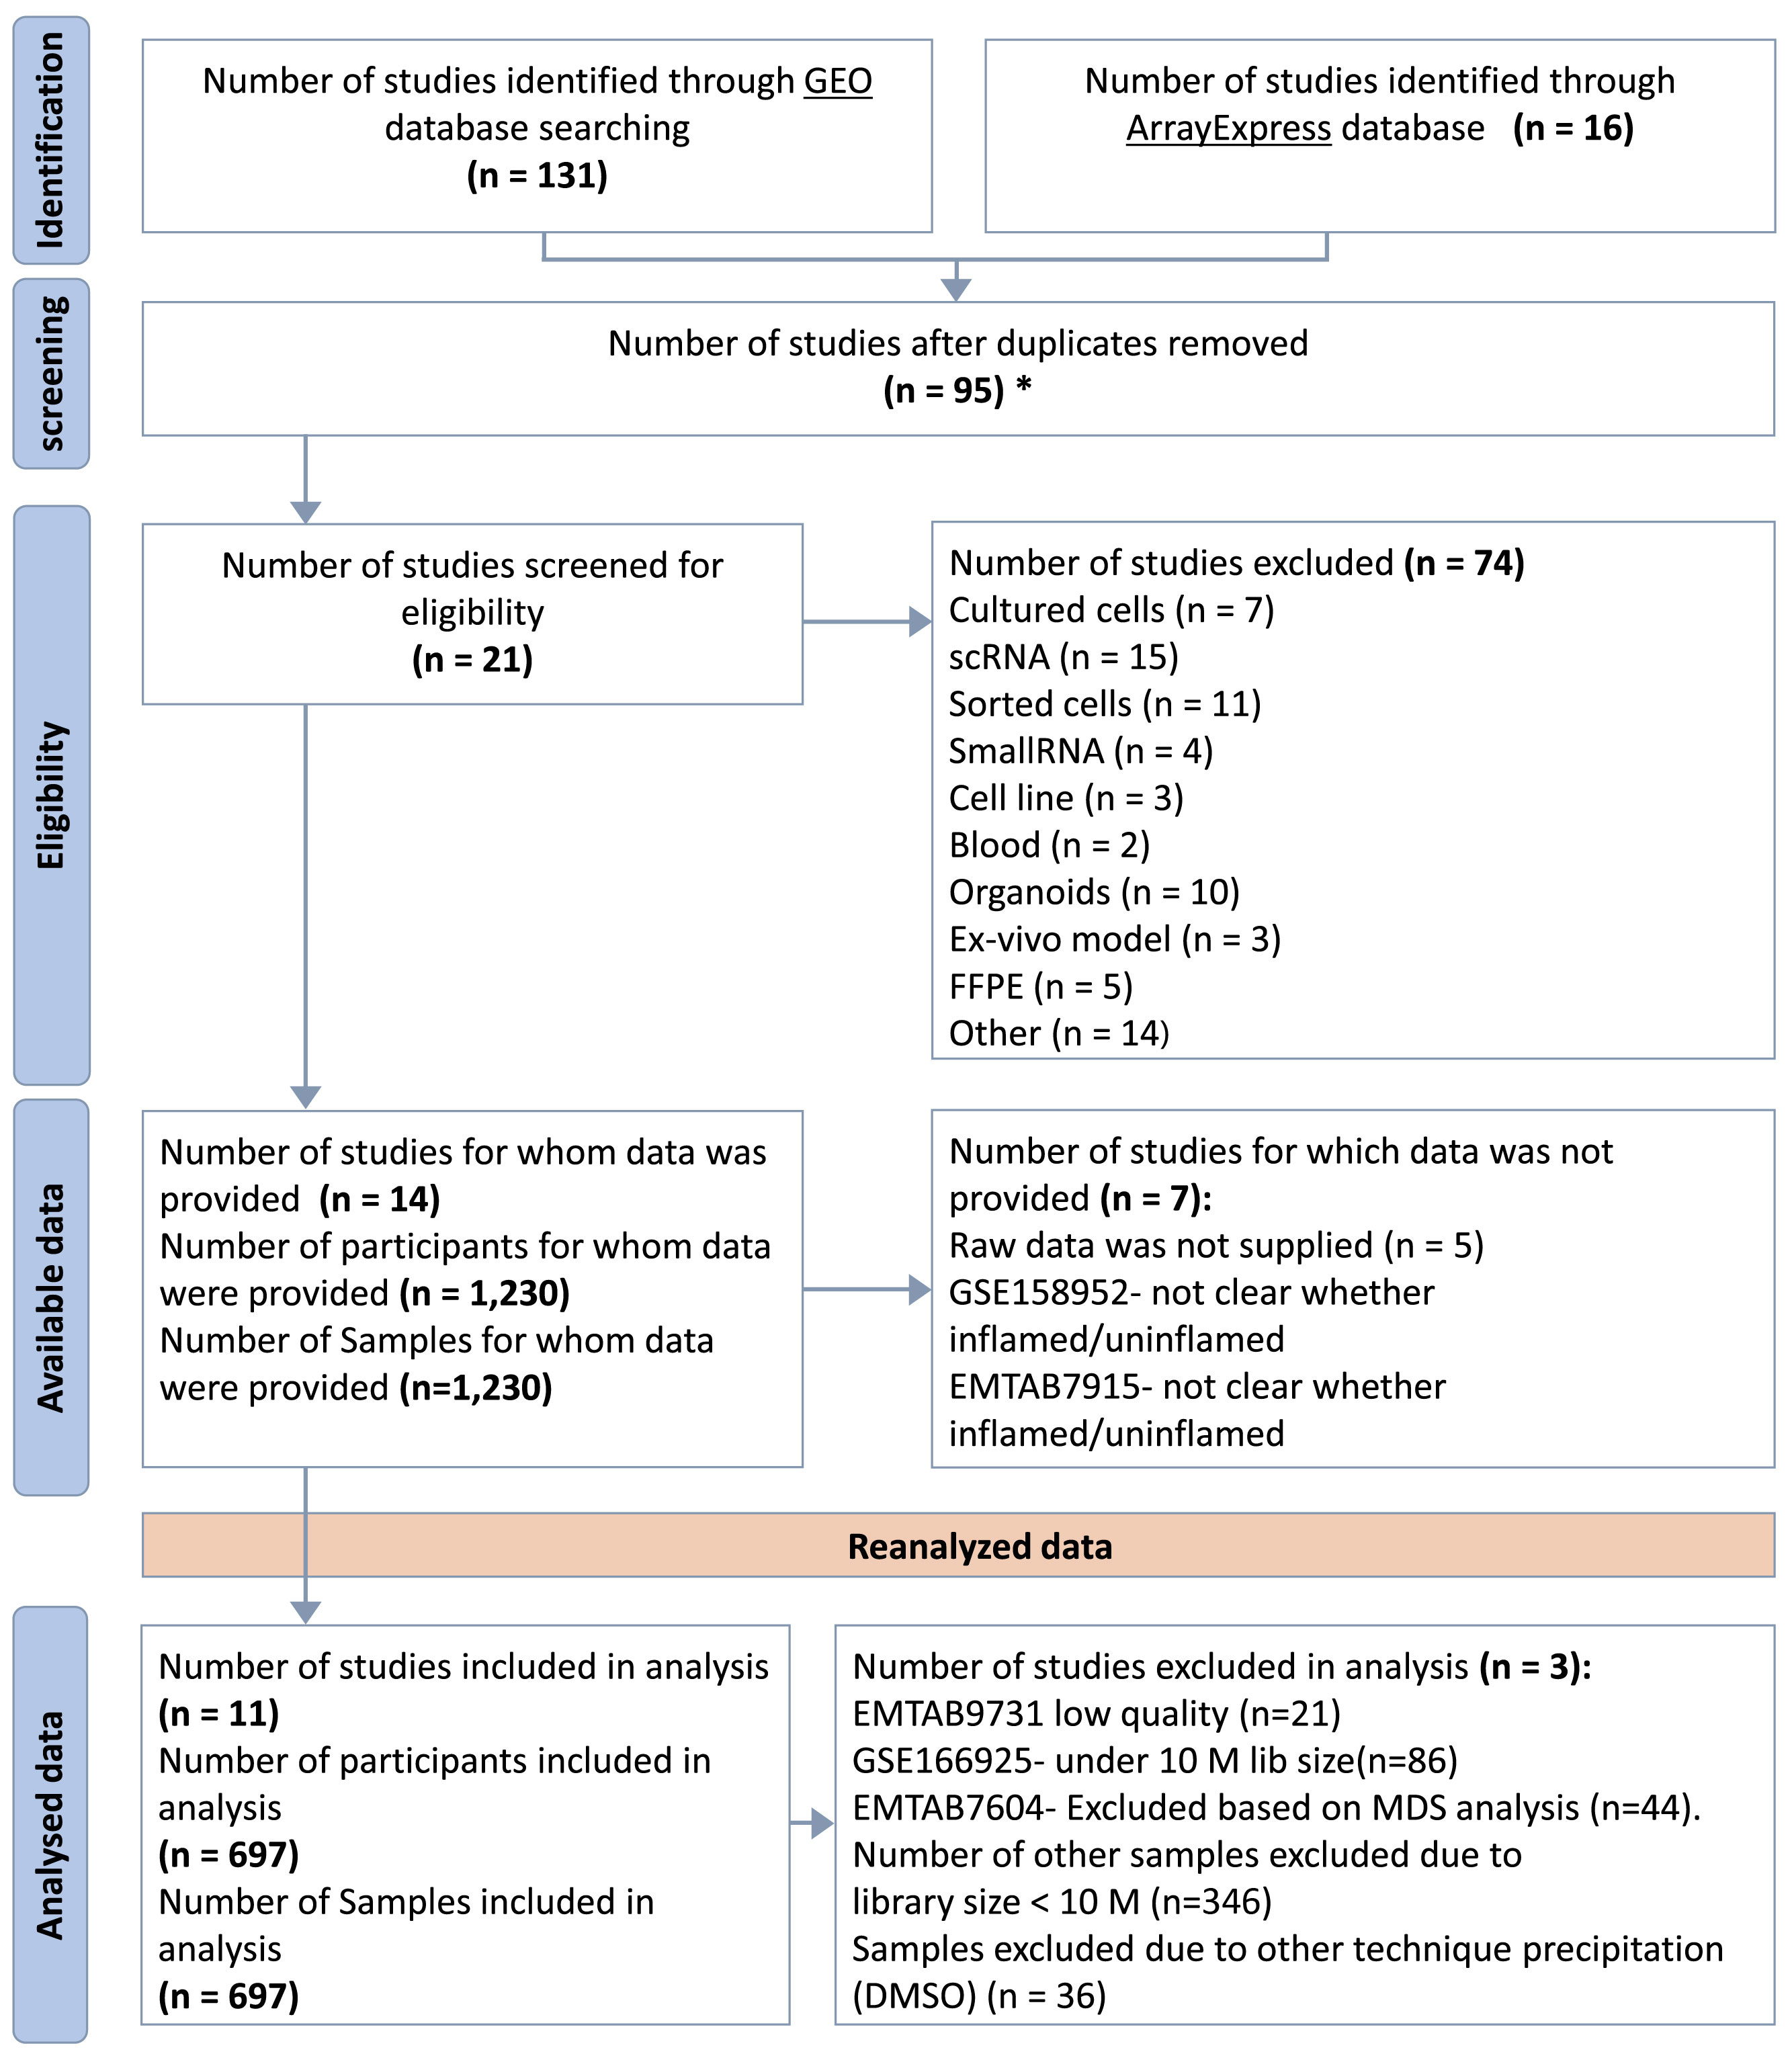
Figure 2 PRISMA Flow Diagram. *Duplicated samples have been removed. GSE62207, GSE93624 - used same patients taken from RISK project, duplicated with GSE101794. GSE150961- used same patients as in GSE109142 taken from the PROTECT.
Inclusion/exclusion criteria
Only studies meeting specific inclusion criteria were considered for the mega-analysis. These criteria included the availability of RNA-seq raw data, transcriptomes obtained from whole tissue samples (punch biopsy), direct sequencing without any further manipulations (e.g. tissue culture or isolated cells), the use of the illumina sequencing platform, and the availability of metadata. Studies based on microarray platform, single-cell RNA-seq and small RNA-seq were excluded from the analysis. Additionally, uninflamed biopsies were excluded due to the limited size of the retrieved cohort.
RNA sequencing data processing
We uniformly processed the RNA sequencing data from the selected eligible studies. Raw data were downloaded using the SRA-Toolkit (https://hpc.nih.gov/apps/sratoolkit.html). Briefly, we utilized the fasterq-dump tool to download FASTQ files, followed by adapter trimming using Trim Galore (https://www.bioinformatics.babraham.ac.uk/projects/trim_galore/) and quality checking with FASTQC (https://www.bioinformatics.babraham.ac.uk/projects/fastqc/). Next, we aligned the high-quality reads to the reference genome (GRCh38) using HISAT2 (17). The number of reads mapped to each annotated genes was then counted using featureCounts software (18). For the statistical analysis we retained only samples with a library size greater than 10 million counts, and genes with less than 1 count per million reads (CPM) across more than 90 samples were filtered out using the ‘filterByExpr’ function implemented in edgR package (19).
Differential expression analysis
Normalization and differential gene expression were conducted using the edgeR (19) and limma (20) R packages. In brief, raw read counts were normalized using the TMM method and then a voom transformation was applied to approximate a normal distribution, resulted in a dataset with logCPM values. Prior to initiating the differential expression analysis, we performed Multidimensional Scaling (MDS) analysis to represent the data in a reduced-dimensional space which enable the visualization of batch effects associated with the dataset. We found the “study source” factor to have the largest contribution to the variation, with a notable correlation to the tissue source (small intestine vs. large intestine) (Supplementary Figure 1). Following the consideration of study batch effects, we applied linear modelling to detect differential expression. Statistically significant differentially expressed genes (DEGs) were defined as those having fold change > 2 and False Discovery Rate (FDR) < 0.05.
To distinguish between UC and CD, we utilized samples from the large and small intestines, specifically from the Rectum (UC= 233, non-IBD control= 46) and from the Ileum (CD= 155, non-IBD control= 24), respectively. We added an interaction term to the linear model, in order to detect which genes respond differently to the disease in UC compared to CD. To model the tissue effect we added a comparison between the small intestine and the large intestine among the non-IBD control samples. The study feature was added as covariate to the model to account for its effect.
Linear equation used to distinguish between each disease type and control samples as well as analysis details are described in Supplementary Materials under methods section.
Pathway and upstream regulators analysis
To identify canonical pathways and upstream regulators, we used the Ingenuity Pathway Analysis (IPA) (21) based on list of DEGs. Briefly, we performed the core analysis to identify significant canonical pathways that were enriched among the DEGs and to predict significant activated upstream regulators. Negative z score value implies an overall pathway’s inhibition and a positive z-score value suggests an overall pathway’s activation. Pathways and upstream regulators having p-value < 0.05 and absolute z‐score ≥ 2 were considered statistically significant.
Machine learning
We employed supervised machine learning (ML) techniques on the gene expression data for classifying various diagnoses: UC (n= 233, Rectum) vs. non-IBD control (n= 46, Rectum), CD (n= 164, Small intestine) vs. non-IBD control (n= 33, Small intestine), and IBD (388 cases, including 233 UC rectum and 155 CD ileum) vs. non-IBD control (70 samples, including 46 rectum and 24 ileum). These diagnoses were treated as the output variables. Each diagnosis was subjected to separate analysis using various ML algorithms to develop a predictive model for classification.
To ensure an unbiased evaluation of the model’s performance, we split our data into training (80%) and test (20%) sets using the train_test_split function from the Scikit-learn (22) library in Python (23). After applying feature selection, we trained and tested different classifier models, followed by validation using the GSE193677 dataset as an external and independent data source (as detailed below).
1.Feature selection
To reduce the number of features and select input variables that have the strongest relationship with the output variables we utilized the SelectKBest algorithm from the Scikit-learn library. This algorithm ranks the features based on their individual ANOVA F-values and selects the top k features with the highest F-values as the most relevant for prediction. This approach is suitable for categorical output variables, as in our study. Evaluation of the selected features was performed using a Logistic Regression classifier with different random states and cross-validation. This allowed us to assess the effectiveness of the selected k features in accurately predicting the target variable. By iterating through different k values and random states, we were able to identify the combination that yielded the highest accuracy, indicating the optimal number and significance of features. The k values and random state are described in Supplementary Table 1.
2.Classifiers
In our analysis, we utilized six classifier models from the Scikit-learn (22) and xgboost (24) packages: SVM, KNN, Random Forest, Extra Trees, XGBoost and Naive Bayes. To optimize their performance, we implemented a nested loop to iterate over different hyperparameter values for each algorithm. These hyperparameters were tuned to enhance predictive capabilities and mitigate overfitting for each model (Supplementary Table 1).
To distinguish between UC and CD, we first run DE analysis as described above then, we selected genes meeting two criteria: 1) significant interaction (fold change > 2 and FDR < 0.05) and 2) non-significance in tissue comparison (defined as fold change < 1.3 and FDR > 0.5). This resulted in 365 genes. These genes were subsequently used as features in a ML analysis. The expression matrix used as input to ML analysis contained normalized expression values that were corrected for tissue and study batch effect using removeBatchEffect() function from the limma package (20). The ML analysis, included 233 UC-inflamed Rectum samples and 155 CD-inflamed Ileum samples for training the models. For validation, we utilized data from the GSE193677 dataset, which included 60 UC-inflamed Rectum samples, 68 CD-inflamed Rectum samples and 60 CD inflamed ileum. Feature selection and ML analysis was done as described above.
Independent validation data
As an independent validation dataset we used the transcriptomic data from the Argmann et al. study (8), available on GEO database (GSE193677). The raw data was downloaded and underwent reprocessing steps, including alignment to the GRCh38 reference genome and voom transformation. The dataset downloaded consisted of 240 samples. For our analysis, we included 60 samples from patients diagnosed with UC, showing severe to moderate inflammation, collected from the rectum, and 60 samples from patients with CD, exhibiting similar inflammation levels, obtained from the ileum. Additionally, we incorporated 120 samples from non-IBD control participants, 60 samples from the rectum and 60 samples from the ileum. We maintained an equal representation of male and female participants in all groups. The dataset was used to validate the six different classifier models. The accuracy and area under the ROC curve (AUC) were calculated to assess models’ performance.
Blood samples dataset
The blood samples dataset was obtained from the Argmann et al. study (8) available on GEO database (GSE186507) which comprises blood RNA-seq data collected from whole blood samples during the participant’s endoscopy visits, along with comprehensive clinical, and endoscopic evaluations. We downloaded and reanalyzed (as described above) a total of 111 samples collected from patients diagnosed with both UC and CD. These samples were from individuals exhibiting clinical symptoms along with either severe or inactive endoscopic states. Additionally, we included samples from patients without clinical symptoms and with an inactive endoscopic state, as well as samples from non-IBD controls.
Drug repurposing analysis
The drug repurposing analysis was conducted using the Connectivity Map (CMap) (25) through the web application CLUE (https://clue.io) (26). CMap is a collection of genome-wide transcriptional expression data responses from human cell lines that have been treated with chemical compounds known as perturbagens. These perturbagens induce changes in cellular gene expression patterns. Our aim was to identify perturbagens that induced opposing expression patterns, to the top significant 300 upregulated and downregulated genes within the IBD vs. non-IBD control DEGs, and within the comparison between each of the diseases and non-IBD control samples separately. Querying these expression patterns with the CMap reference, particularly the Gene Expression (L1000) Touchstone dataset, generated a heatmap displaying the connectivity score (tau) of 2837 small-molecule compounds as perturbagens. Our focus was on compounds demonstrating the highest anti-correlation and CMap median tau score below −95 in the HT-29 cell line column. These compounds are candidates for drug repurposing. We chose to look at HT-29 cells, since this cell line, originating from colon adenocarcinoma, serves as a relevant in-vitro model for studying processes like absorption, transport, and secretion by intestinal cells (27–29).
Statistical analysis
Statistical analyses were conducted using the R statistical framework (v.4.2.2) (30). Boxplots illustrating expression levels were generated using the ggplot2 R package (v.3.4.0) (31). Unless indicated otherwise, comparisons between different groups were calculated using t test or ANOVA, with a significance threshold set at p < 0.05. The statistical analysis involved training and evaluating six machine learning algorithms was done using Python (v.3.10.11) (23). Model performance was assessed using the accuracy_score function to compute classification accuracy, while Receiver Operating Characteristic (ROC) curves were utilized to evaluate the model’s ability to distinguish between classes, with the AUC (Area Under the Curve) serving as a measure of classifier performance. The scikit-learn (v.1.2.0) (22) library was employed for computation, and matplotlib (v.3.6.2) (32) for visualization.
Results
Datasets and cohorts analyzed in the study
Based on our inclusion criteria, 11 datasets were selected and subsequently were included in the mega-analysis. The datasets included clinical data and biopsy samples from the intestines of a total of 697 participants, comprising 569 IBD patients and 128 non-IBD controls (Figure 2). Distribution of expression data pre and post normalization is given in (Supplementary Figure 2).
The 11 eligible studies included in the analysis are described in Table 1. Within our UC cohort, which is derived from eight of these studies, we obtained a total of 386 inflamed biopsies specifically from the large intestine. For the CD cohort, which is derived from four studies, we identified 183 inflamed biopsies primarily from the small intestine. Among the included studies, five provided non-IBD control samples, mostly from subjects suspected of having IBD but with radiographic, endoscopic, and histologic findings. The remaining samples obtained from normal bowel sections, located more than 10 cm away from tumors in patients undergoing bowel resection for sporadic colon cancer. Overall, the control group included 95 samples from the large intestine and 33 samples from the small intestine.
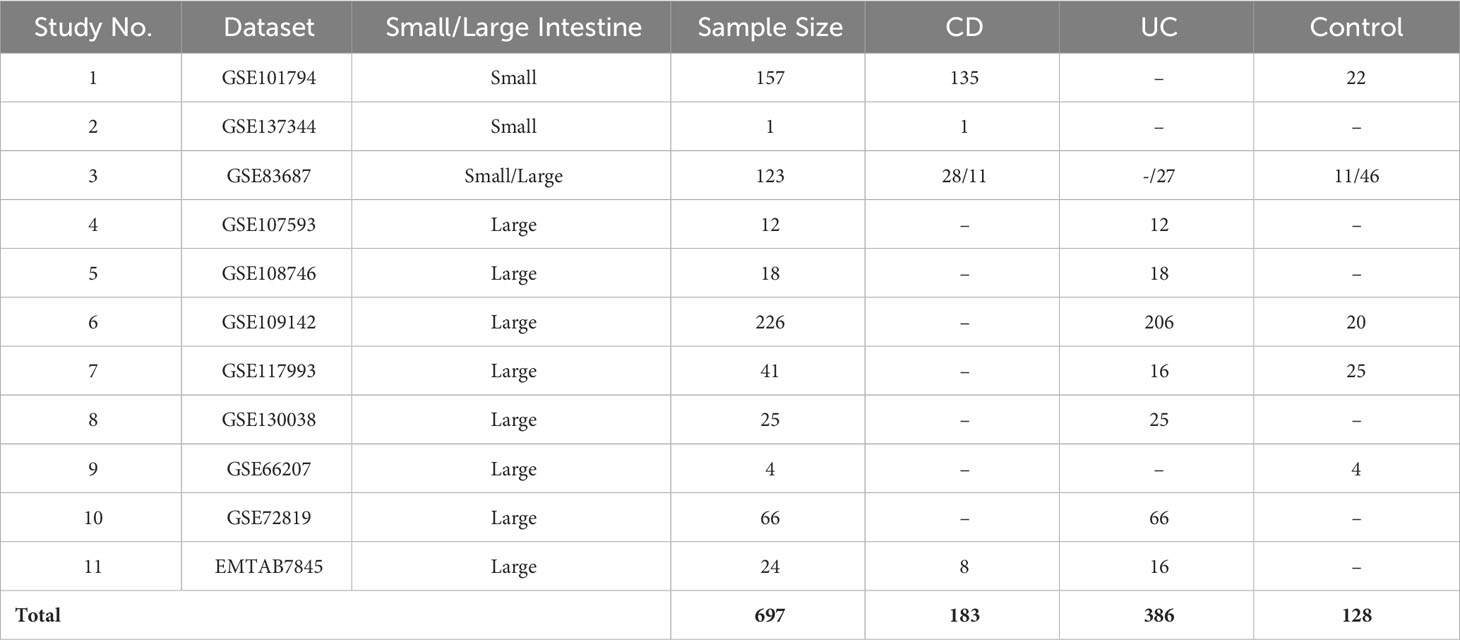
Table 1 Characteristic of datasets used for analysis.
Inflammatory pathways and upstream regulators common between UC and CD
We identified 4,027 DEGs (2396 upregulated and 1631 downregulated genes, Figure 3A) when comparing gene expression from inflamed biopsies of the UC group and the control group, both taken from the large intestine. Given the involvement of CD in both the small and large intestines, we merged data of the biopsies obtained from inflamed regions of both intestinal segments. We then compared this combined dataset to non-IBD control biopsies collected also from both the small and large intestines. By conducting this comparative analysis, we sought to gain insights into the gene expression patterns associated with CD across both tissues. We found 1,008 DEGs including 629 upregulated genes and 379 downregulated genes in inflamed samples vs. non-IBD controls (Figure 3B). Finally, we chose to investigate IBD as a unified group when compared to the control group. In the IBD vs. control group we identified 2099 DEGs including 1387 upregulated and 712 downregulated. (Figure 3C). The top ten up- and down-regulated genes are displayed in Figure 3D. Several genes consistently appear across all comparisons. Notably, a lncRNA ENSG00000254645, stands out as it ranks among the top ten downregulated genes in the IBD vs. Control comparison. This transcript has previously been associated with IBD (33). In our analysis, this transcript demonstrates significant downregulation in both the CD vs. Control and UC vs. Control comparisons (Supplementary Figure 3).
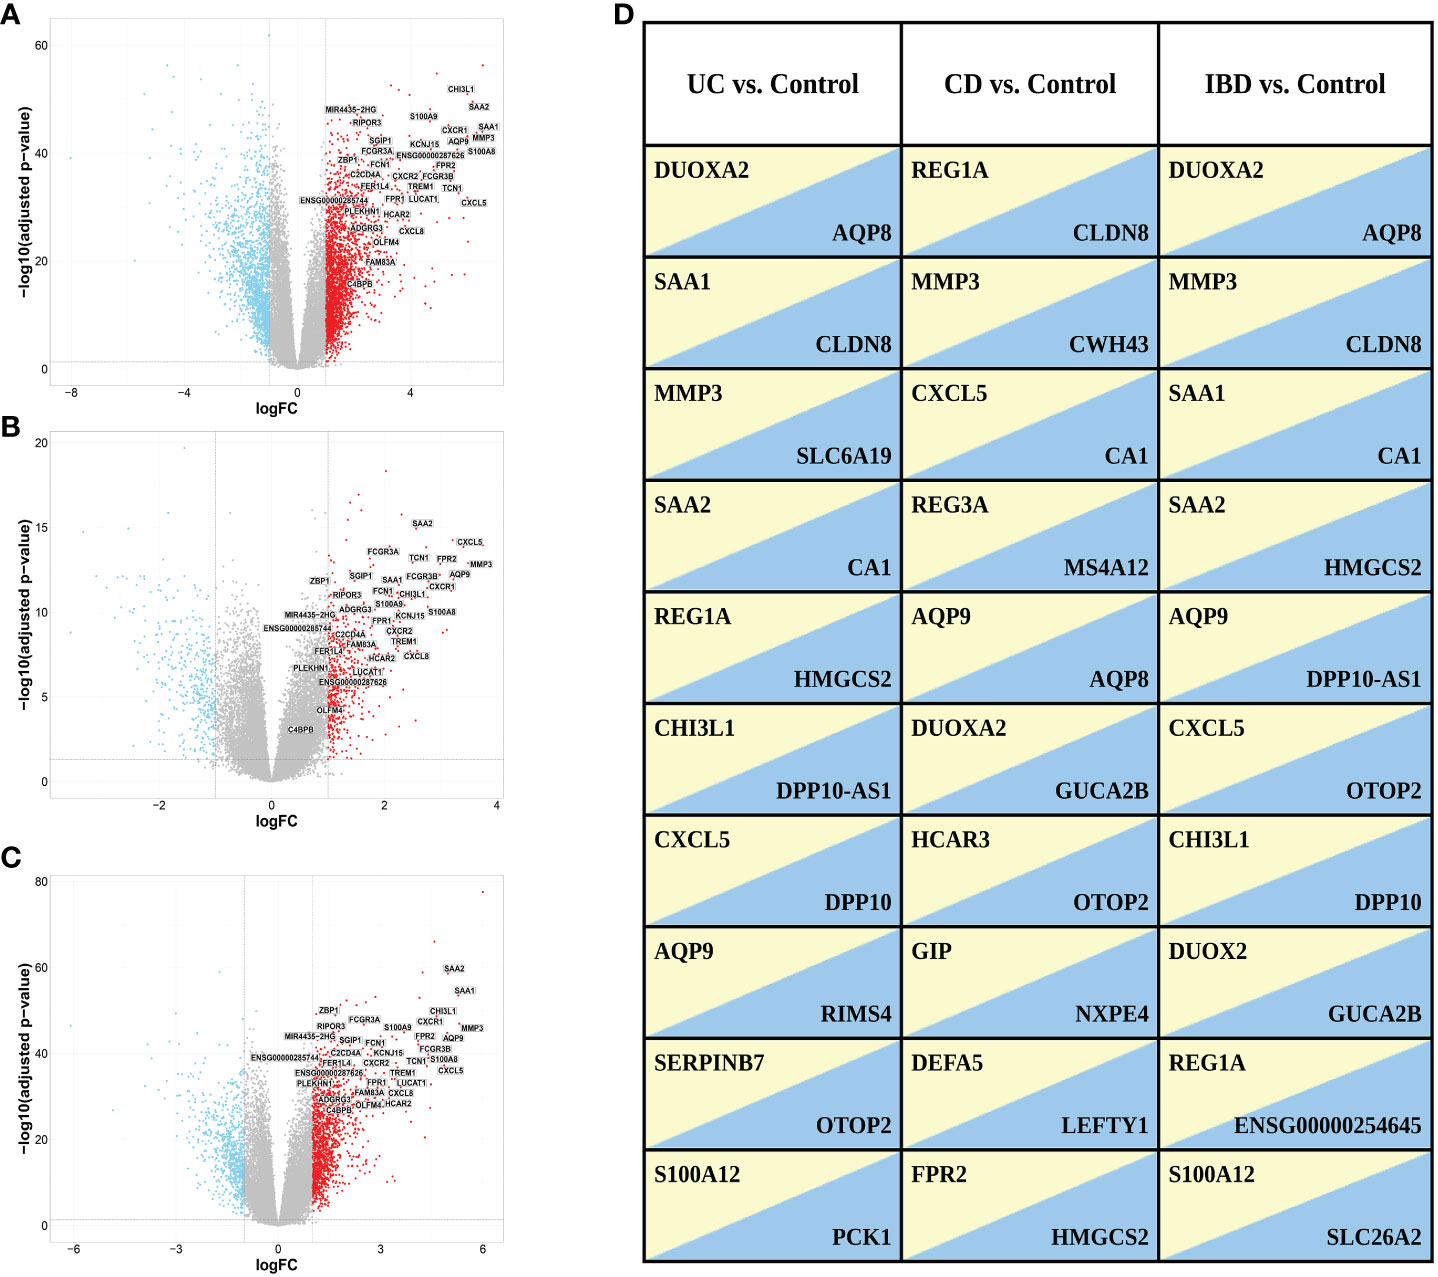
Figure 3 Volcano plots of DEGs selected with a threshold of adjusted p-value < 0.05 and fold-change >2 for the following comparisons: (A) UC vs. control, (B) CD vs. control and (C) IBD vs. control. Highlighted are the 34 genes found in ML analysis (see ML analysis section below). (D) Top ten up (yellow)- and down (blue)-regulated genes in the different comparisons. Genes with FDR < 0.05 were ranked based on fold change.
We utilized IPA to identify molecular pathways enriched within the list of DEGs obtained by comparing inflamed to non-IBD control tissues in the different comparisons (Figures 4A–C). As expected, activated pathways in all comparisons, were enriched in immune response pathways, including pathogen induced cytokine storm signaling, phagosome formation pathway and wound healing signaling. IL-17 was also upregulated in all comparisons, although did not rank in the top five upregulated pathways in CD and IBD comparisons. The downregulated pathways observed in all comparisons encompassed various metabolism and catabolism processes. For example; serotonin degradation, nicotine degradation III, thyroid hormone metabolism II (via conjugation and/or degradation), and melatonin degradation I. Along with the metabolism pathways there are also downregulated nuclear receptor (NR) pathways which related directly to gut microbiota and play protective roles in intestinal epithelial integrity (34). Notably, LXR/RXR Activation signaling, which is a NR pathway, was downregulated only in CD and IBD comparisons, but not in UC. IPA Comparison analyses revealed activated and inhibited upstream regulators (Figure 4D). Upon the common activated regulators we found pro-inflammatory cytokines (IL1B, TNF), and the NFkB complex which trigger immune responses. Upon the common inhibited regulators we identified alpha catenin and the IL10RA which their inhibition is known to increase intestinal permeability (35) and promotes inflammation (36), respectively. Overall, these results show that similar pathways and upstream-regulators are involved in both diseases and suggest that similar molecular mechanisms operate in both.
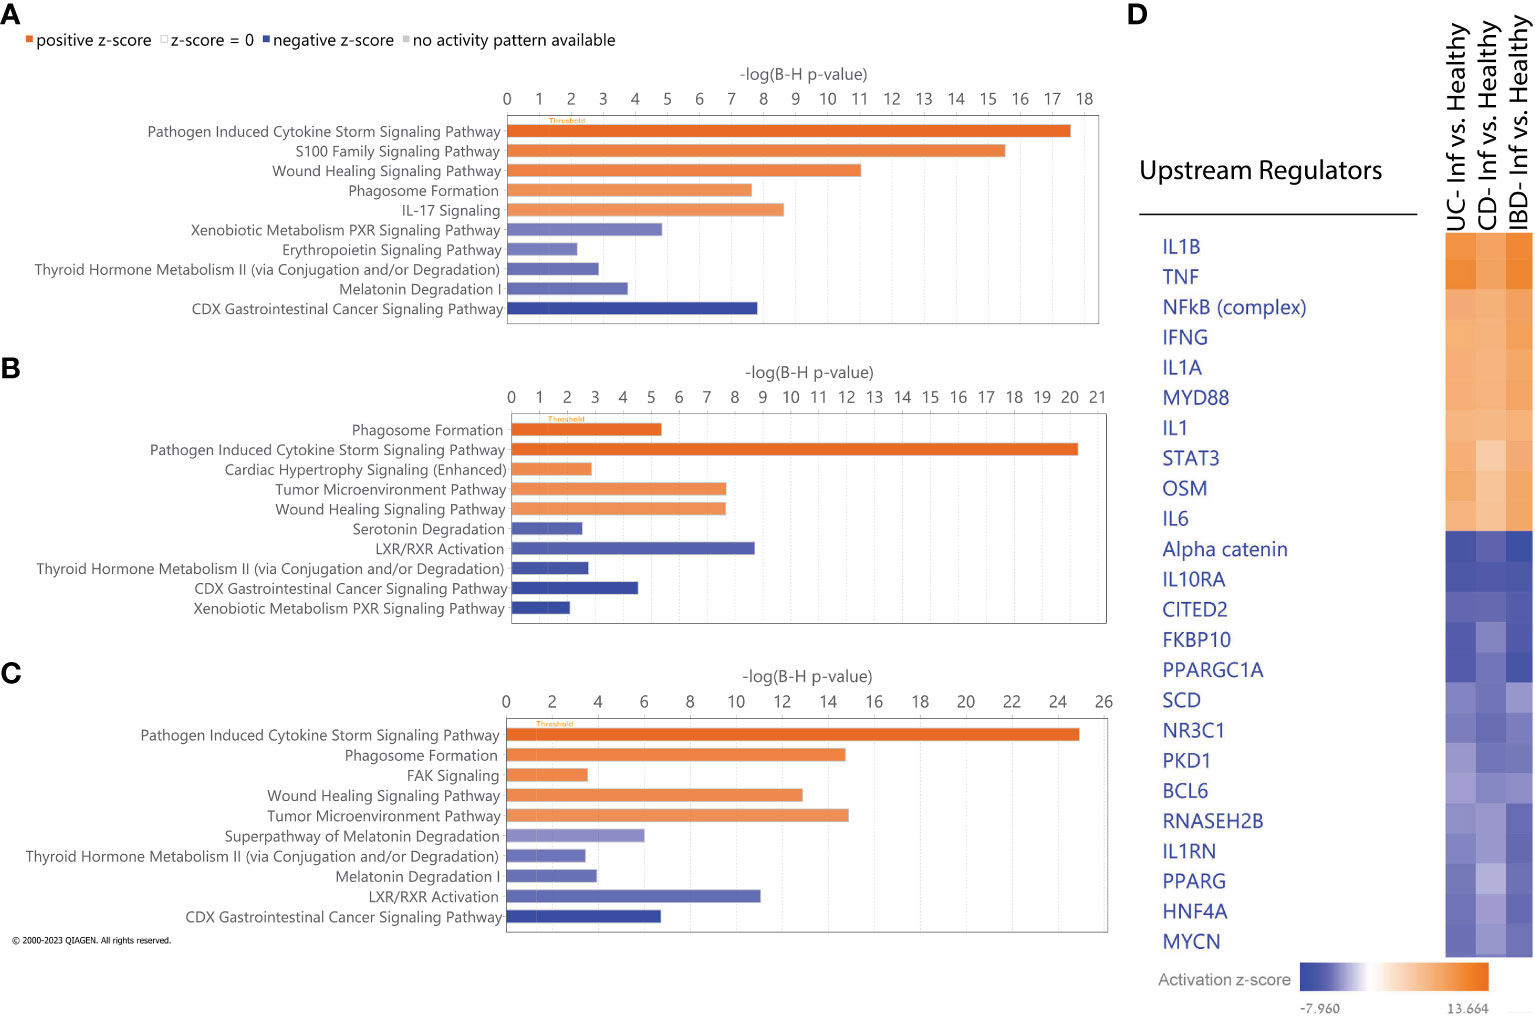
Figure 4 IPA Functional analysis. (A-C) Top five activated (orange) and inhibited (blue) canonical pathways based on absolute IPA’s activation z-score > 2 for the following comparisons: (A) UC vs non-IBD control, (B) CD vs non-IBD control, (C) IBD vs non-IBD control. Negative z score value implies an overall pathway's inhibition and a positive z-score value suggests an overall pathway's activation. All pathways had -log (B-H p-value) > 1.3 meaning FDR less than 0.05. (D) Hierarchical clustering of upstream regulators’ activation z score across all comparisons.
Machine learning prediction models for IBD
A machine learning analysis aimed at distinguishing between UC and CD identified ten genes (Supplementary Table 2). To verify the accuracy of the trained model, we employed two approaches. Initially, we utilized independent UC and CD samples collected from the same tissues used in the training set (rectum and ileum, respectively). This yielded an impressive AUC of 0.97 in ROC analysis (see Supplementary Figure 4A). However, validation failed when utilizing external data from the rectum, which represents the same tissue for both diseases, resulting in AUC scores hovering around 0.6 (see Supplementary Figure 4B). Acknowledging the limitations posed by tissue effects in discriminating between the diseases, we subsequently, developed diagnostic models to identify genes capable of effectively discriminating between inflamed samples of UC, CD and IBD each compared separately against non-IBD controls. Six ML algorithms were employed with hyperparameter tuning (see methods). We found ten genes distinguishing between UC and non-IBD samples, another 9 genes for the comparison between CD and non-IBD samples, and 34 genes for the differentiation between IBD and non-IBD samples (the genes are indicated in Figure 5A). The most accurate models were generated for the classification of UC from non-IBD control samples, followed by the IBD classification, and finally CD classification. Specifically, the highest accuracy scores were achieved with the validation data using KNN and Random Forest. In the UC analysis, Random Forest achieved 0.947 accuracy, KNN reached 0.933. For IBD, both models achieved 0.9 accuracy. In CD, KNN had the highest accuracy of 0.9, followed by Naive Bayes at 0.89. ROC curves were generated for all models and analyses on the validation data (Figures 5B–D), illustrating their performance in terms of the true positive rate versus the false positive rate. The curves demonstrated good discriminatory ability, with a notable separation between the diseased and non-IBD control samples in all comparisons. Overall, the results indicate that the classification models achieved a robust and reliable performance in distinguishing between different disease groups and non-IBD controls.
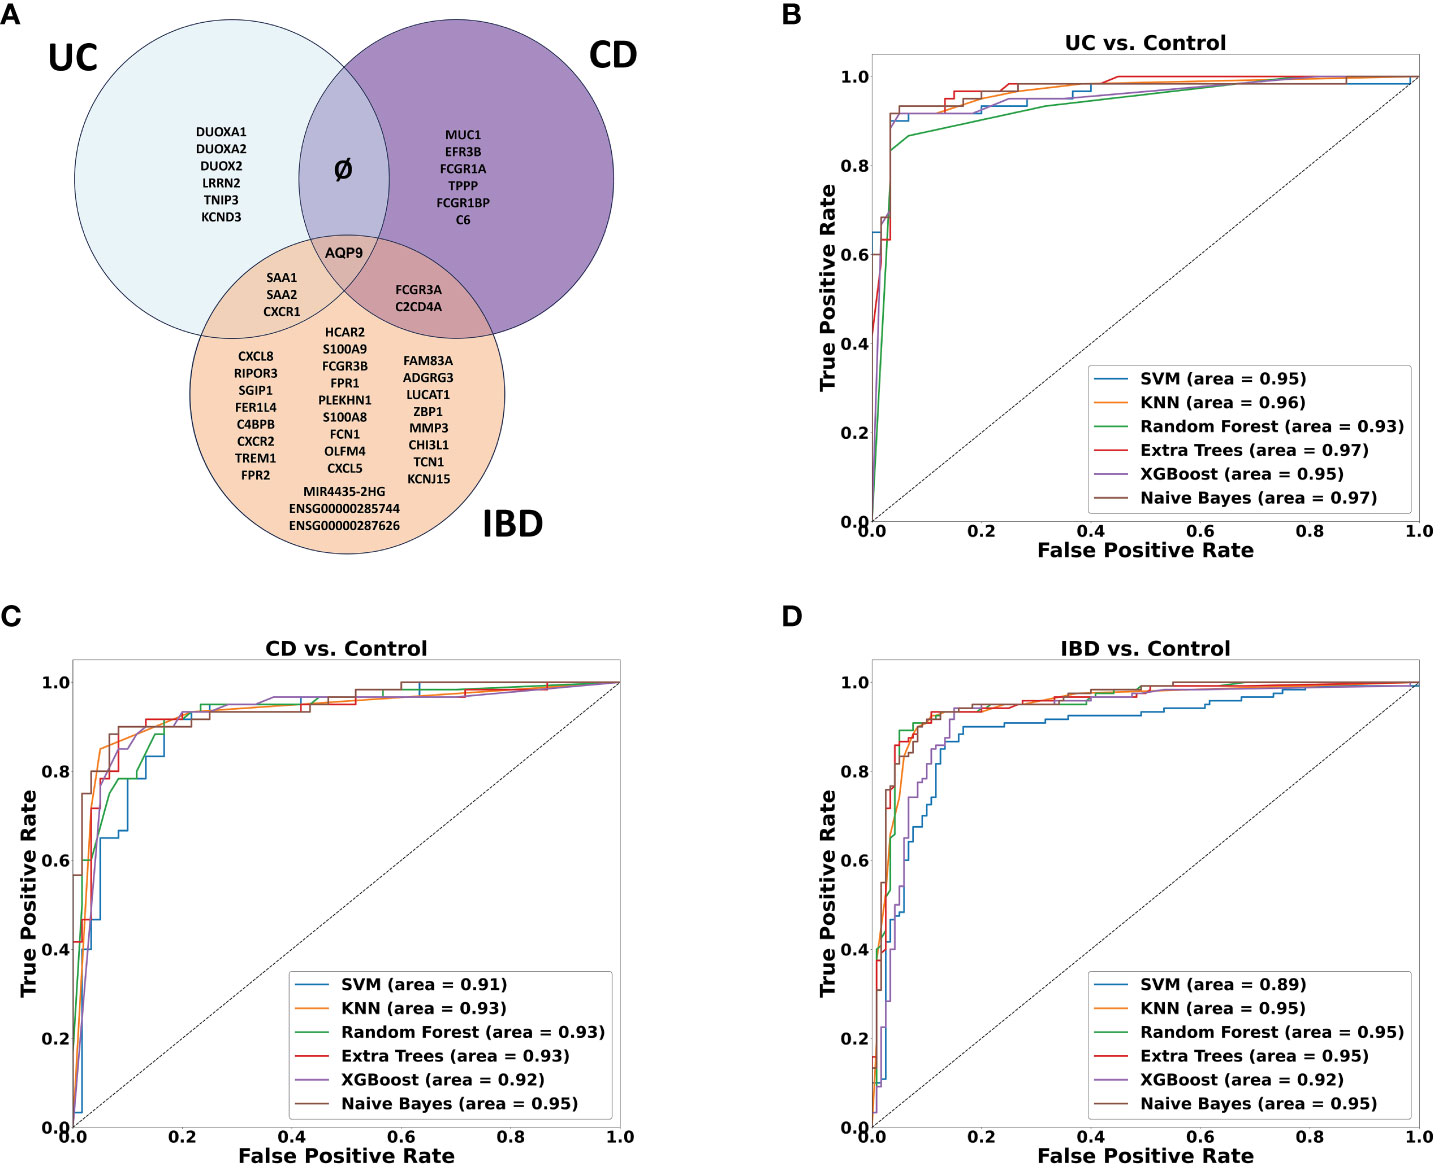
Figure 5 Machine learning results. (A) Venn diagram showing the overlap between ML-selected discriminative genes for the following comparisons: UC vs. Control, CD vs. Control and IBD vs. Control. (B–D) ROC curve of True positive rate vs. False positive rate at different six models on validation data GSE193677 for (B) UC (C) CD and (D) IBD analyses.
Novel non-coding RNAs in IBD
Among the genes identified through our ML analyses, we recognized known immune related genes and diagnostic markers. Some of the genes were common and intersected between the different models, with AQP9 present across all of them, FCGR3A is present in both CD and IBD analyses, while SAA1, SAA2, and KCNDA3 intersect between UC and IBD analyses (Figure 5A). Of particular interest, IBD analysis revealed three long non-coding RNA (lncRNA) genes, two are novel transcripts, ENSG00000285744 and ENSG00000287626, along with known lncRNA MIR4435-2HG. To verify the differential expression of the six intersected genes along with the lncRNAs, box plots were generated using the normalized data and significant expression level differences were observed in both our mega-analysis dataset and the GSE193677 validation dataset (Figures 6A, B), with lower expression of these genes in non-IBD control samples compared to CD and UC. Notably, all genes obtained from the ML analysis showed significant expression levels differences (Supplementary Figure 5).
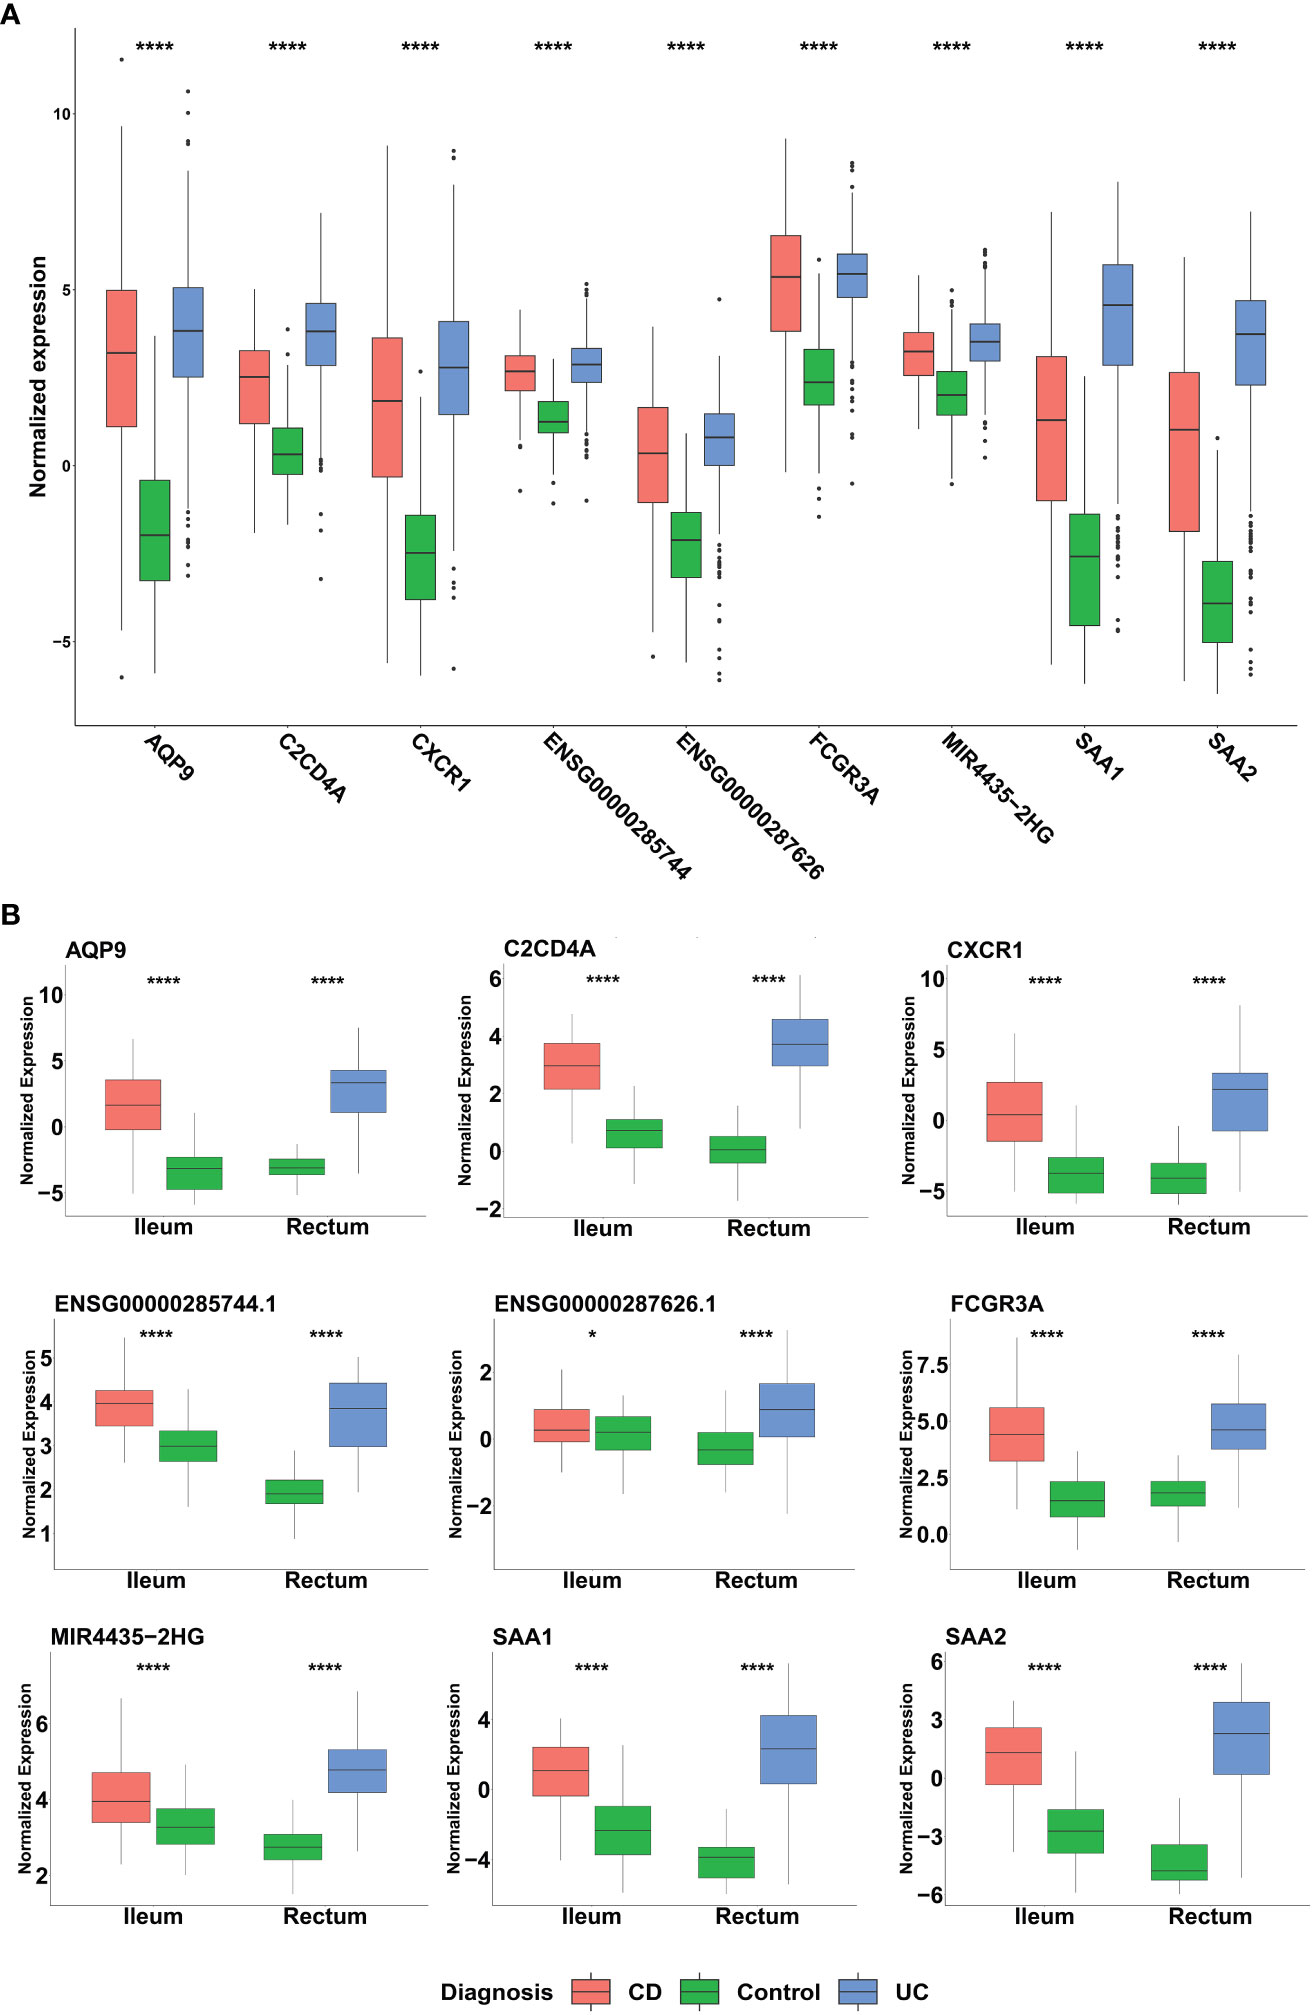
Figure 6 Distribution of the normalized expression of selected genes across UC, CD and non-IBD control samples in (A) Mega-analysis dataset: CD (n= 183), UC (n= 386) and control group (n=128). P-values were calculated using two-way analysis of variance (ANOVA). (B) GSE193677 validation dataset: The dataset includes inflamed samples from CD (n=60, ileum) and UC (n=60, rectum), along with non-IBD control samples from both the ileum (n=60) and rectum (n=60). Statistical significance was assessed using Student’s t-test. *p < 0.05, ****p < 0.0001 indicate the significance levels.
To evaluate the potential of the ML-selected genes as non-invasive biomarkers, we assessed their expression in blood samples from IBD patients (Supplementary Figure 6). Out of the 34 genes, 29 were available in the blood expression dataset. We observed a significant upregulation of 12 genes (p-value < 0.01) whose expression was higher in individuals with severe endoscopic manifestations of IBD when compared to the control group. The expression of six of these genes, namely ADGRG3, KCNJ15, AQP9, MIR4435-2HG, S100A8, and S100A9, which showed the most significant differences based on their p-values, are depicted in Figure 7.
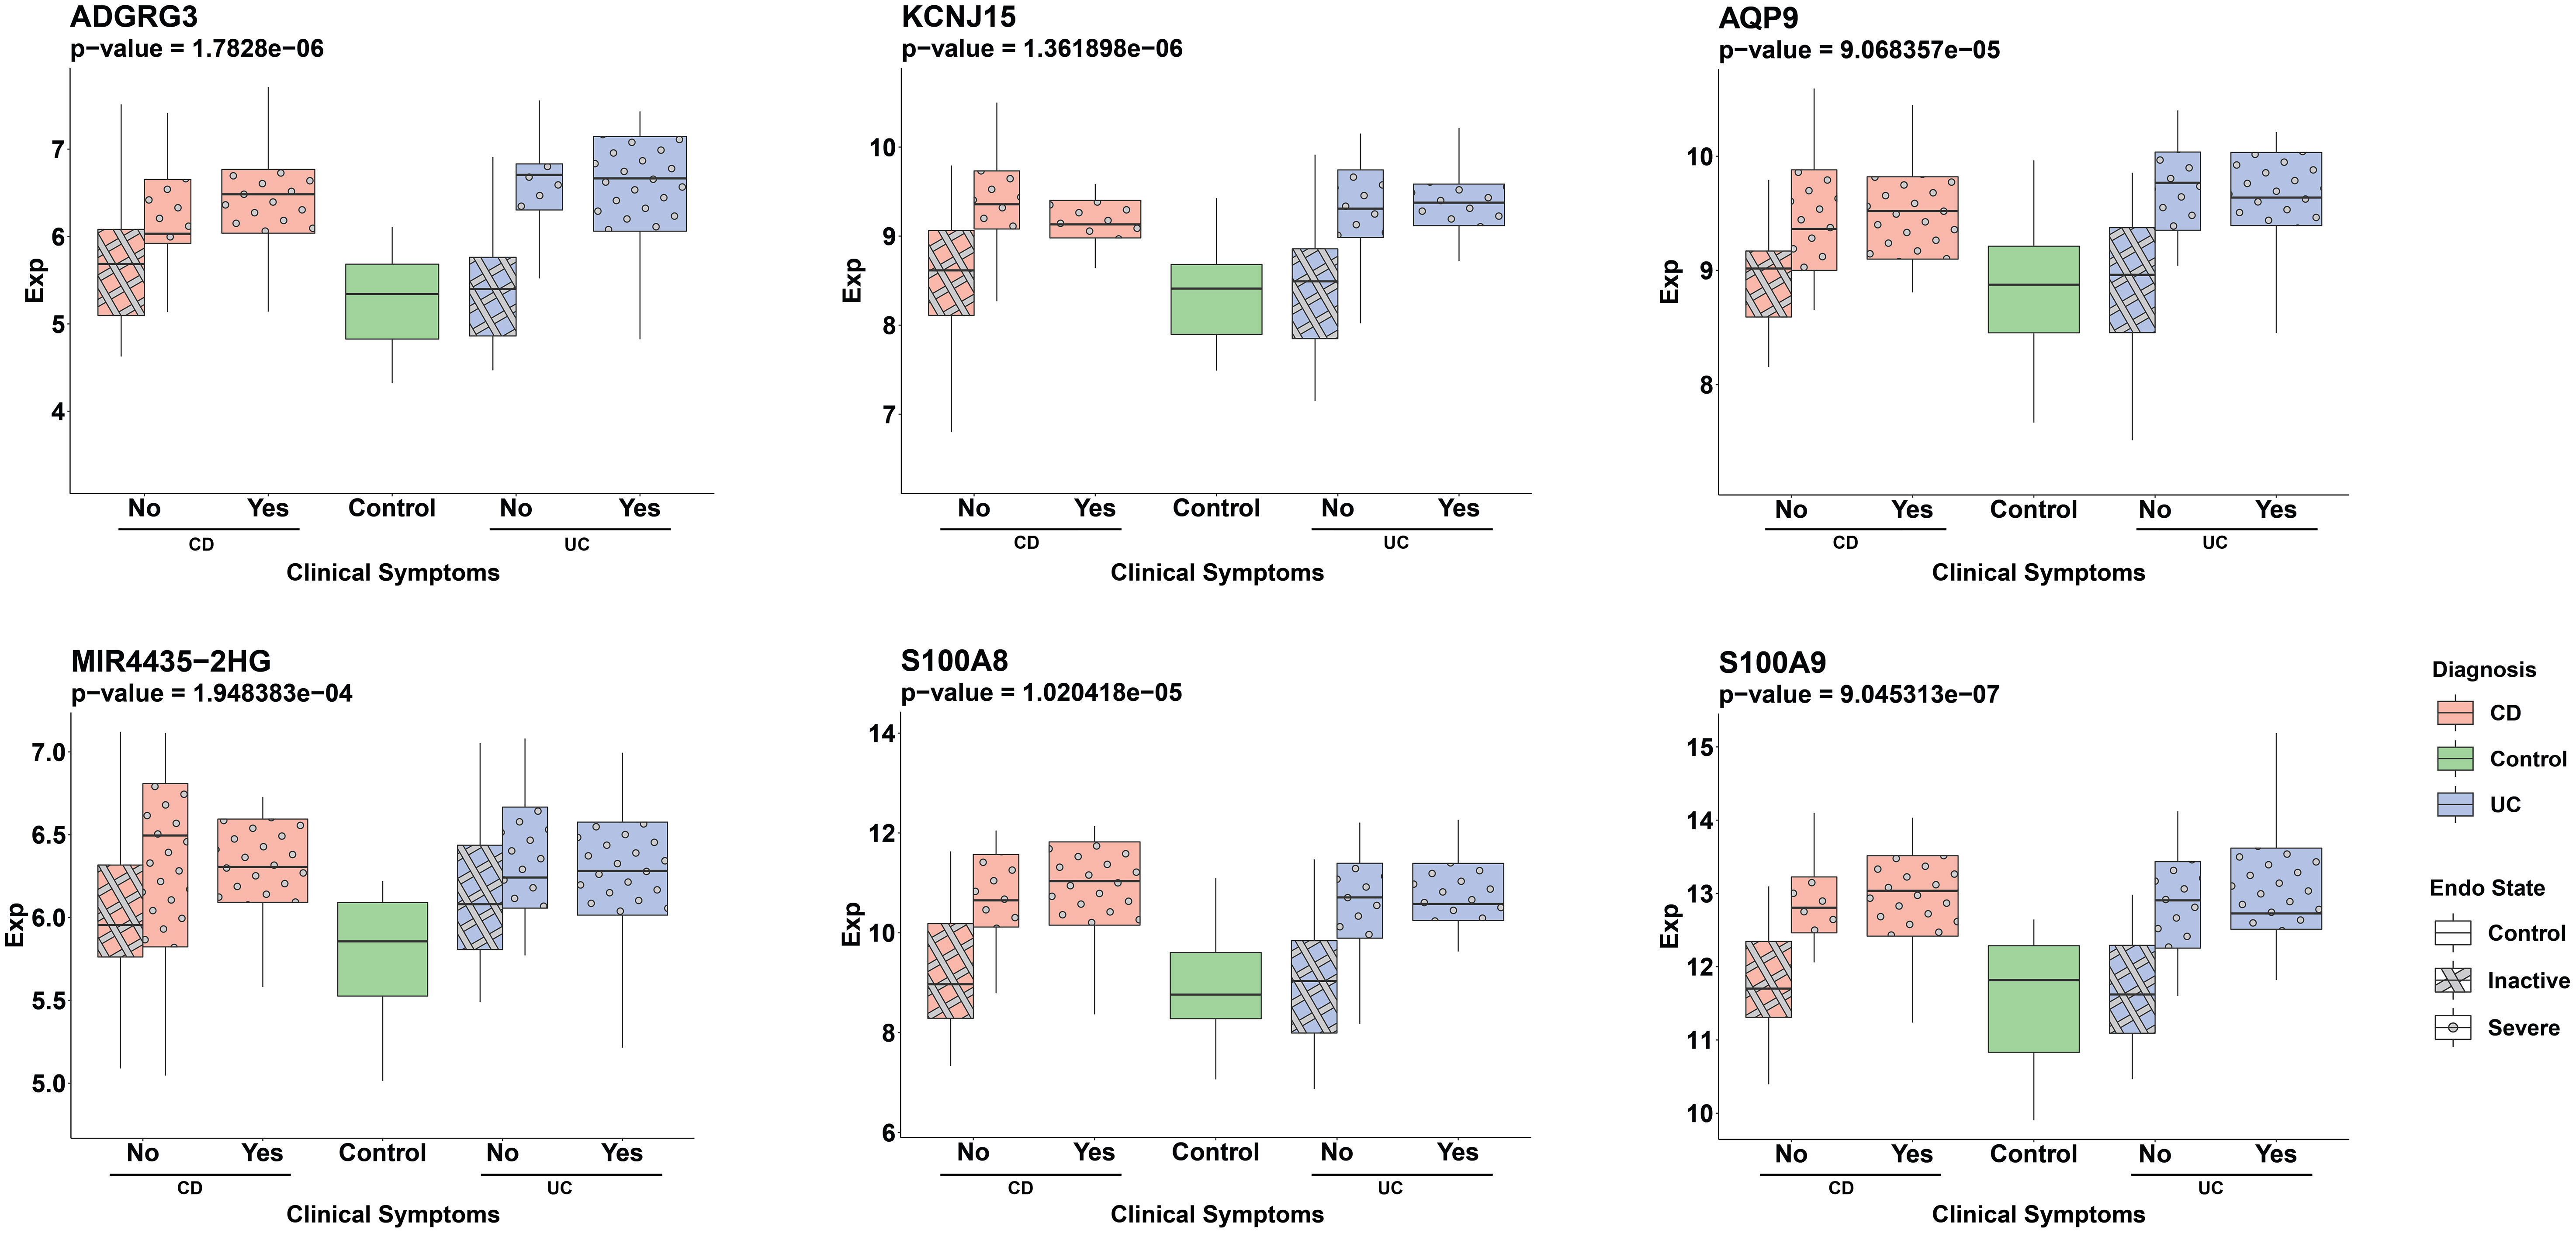
Figure 7 Distribution of ML detected genes’ normalized expression in serum samples across different patient groups. Pink and blue colors represent CD and UC patients, respectively. The pattern differentiation—crosshatch for an inactive endoscopic state and circles for a severe endoscopic state—reflects the severity of endoscopic conditions. The x-axis labels (‘Yes’ or ‘No’) distinguish between the presence or absence of clinical symptoms in patients, with ‘Yes’ indicating clinical symptoms and ‘No’ representing the absence of symptoms. The groups are: CD patients without clinical symptoms and either inactive (pink, crosshatch, n=20) or severe (pink, circle, n=15) endoscopic states, CD patients with clinical symptoms and severe endoscopic states (pink, circle, n=12), UC patients without clinical symptoms and either inactive (blue, crosshatch, n=20) or severe (blue, circle, n=13) endoscopic states, UC patients with clinical symptoms and severe endoscopic states (blue, circle, n=14) and the control group (green, n=17). The Wilcoxon test was used to assess statistical significance in the comparison between the severe endoscopic IBD groups and the control group.
Connection of drug-gene signature by CMap
Finally, we utilized the Broad Institute Connectivity Map (CMap) (25) to predict potential novel therapeutic compounds based on differential gene expression results. For each the three DEG comparisons described above, we run a separate CMap analysis. In each analysis we used the top 300 DEGs, comprising 150 upregulated and 150 downregulated genes as a query to the CMap system. In addition we run another query that contained the 34 genes selected in IBD ML analysis, 30 of them were recognized by the CMap tool. These four sets of genes were employed as queries in seeking potential connections or similarities in gene expression patterns with drug-induced gene signatures present in the CMap database. It’s worth noting that the CMap system employs different cell lines for its analyses. Given the intestinal nature of our diseases of interest, we placed a specific emphasis on results derived from the HT-29 cell line.
After the tool analyzed the valid genes, it revealed 22 compounds with median_tau_score values lower than -95. This indicates a strong and significantly opposing biological effect directed towards the gene signatures associated with the various diseases (as depicted in Figure 8). The compounds and various families identified in the CMap suggest potential implications for IBD treatment. Notably, Antimycin-A exhibits the highest connectivity score (-99.53), along with Histone deacetylase (HDAC) inhibitors (Pyroxamide, tacedinaline, and trichostatin-a),Monoamine oxidase inhibitor (Procarbazine), BCR-ABL kinase inhibitors (Dasatinib) and RAF inhibitors (Vemurafenib, AZ-628, PLX-4720) mTOR inhibitors (WYE-354) and SYK inhibitors (Fostamatinib) MEK inhibitors (PD-0325901, MEK1-2-inhibitor) Cannabinoid receptor antagonist (O-1918), cyclooxygenase inhibitor (Valdecoxib) and Histamine receptor antagonist (Loratadine).
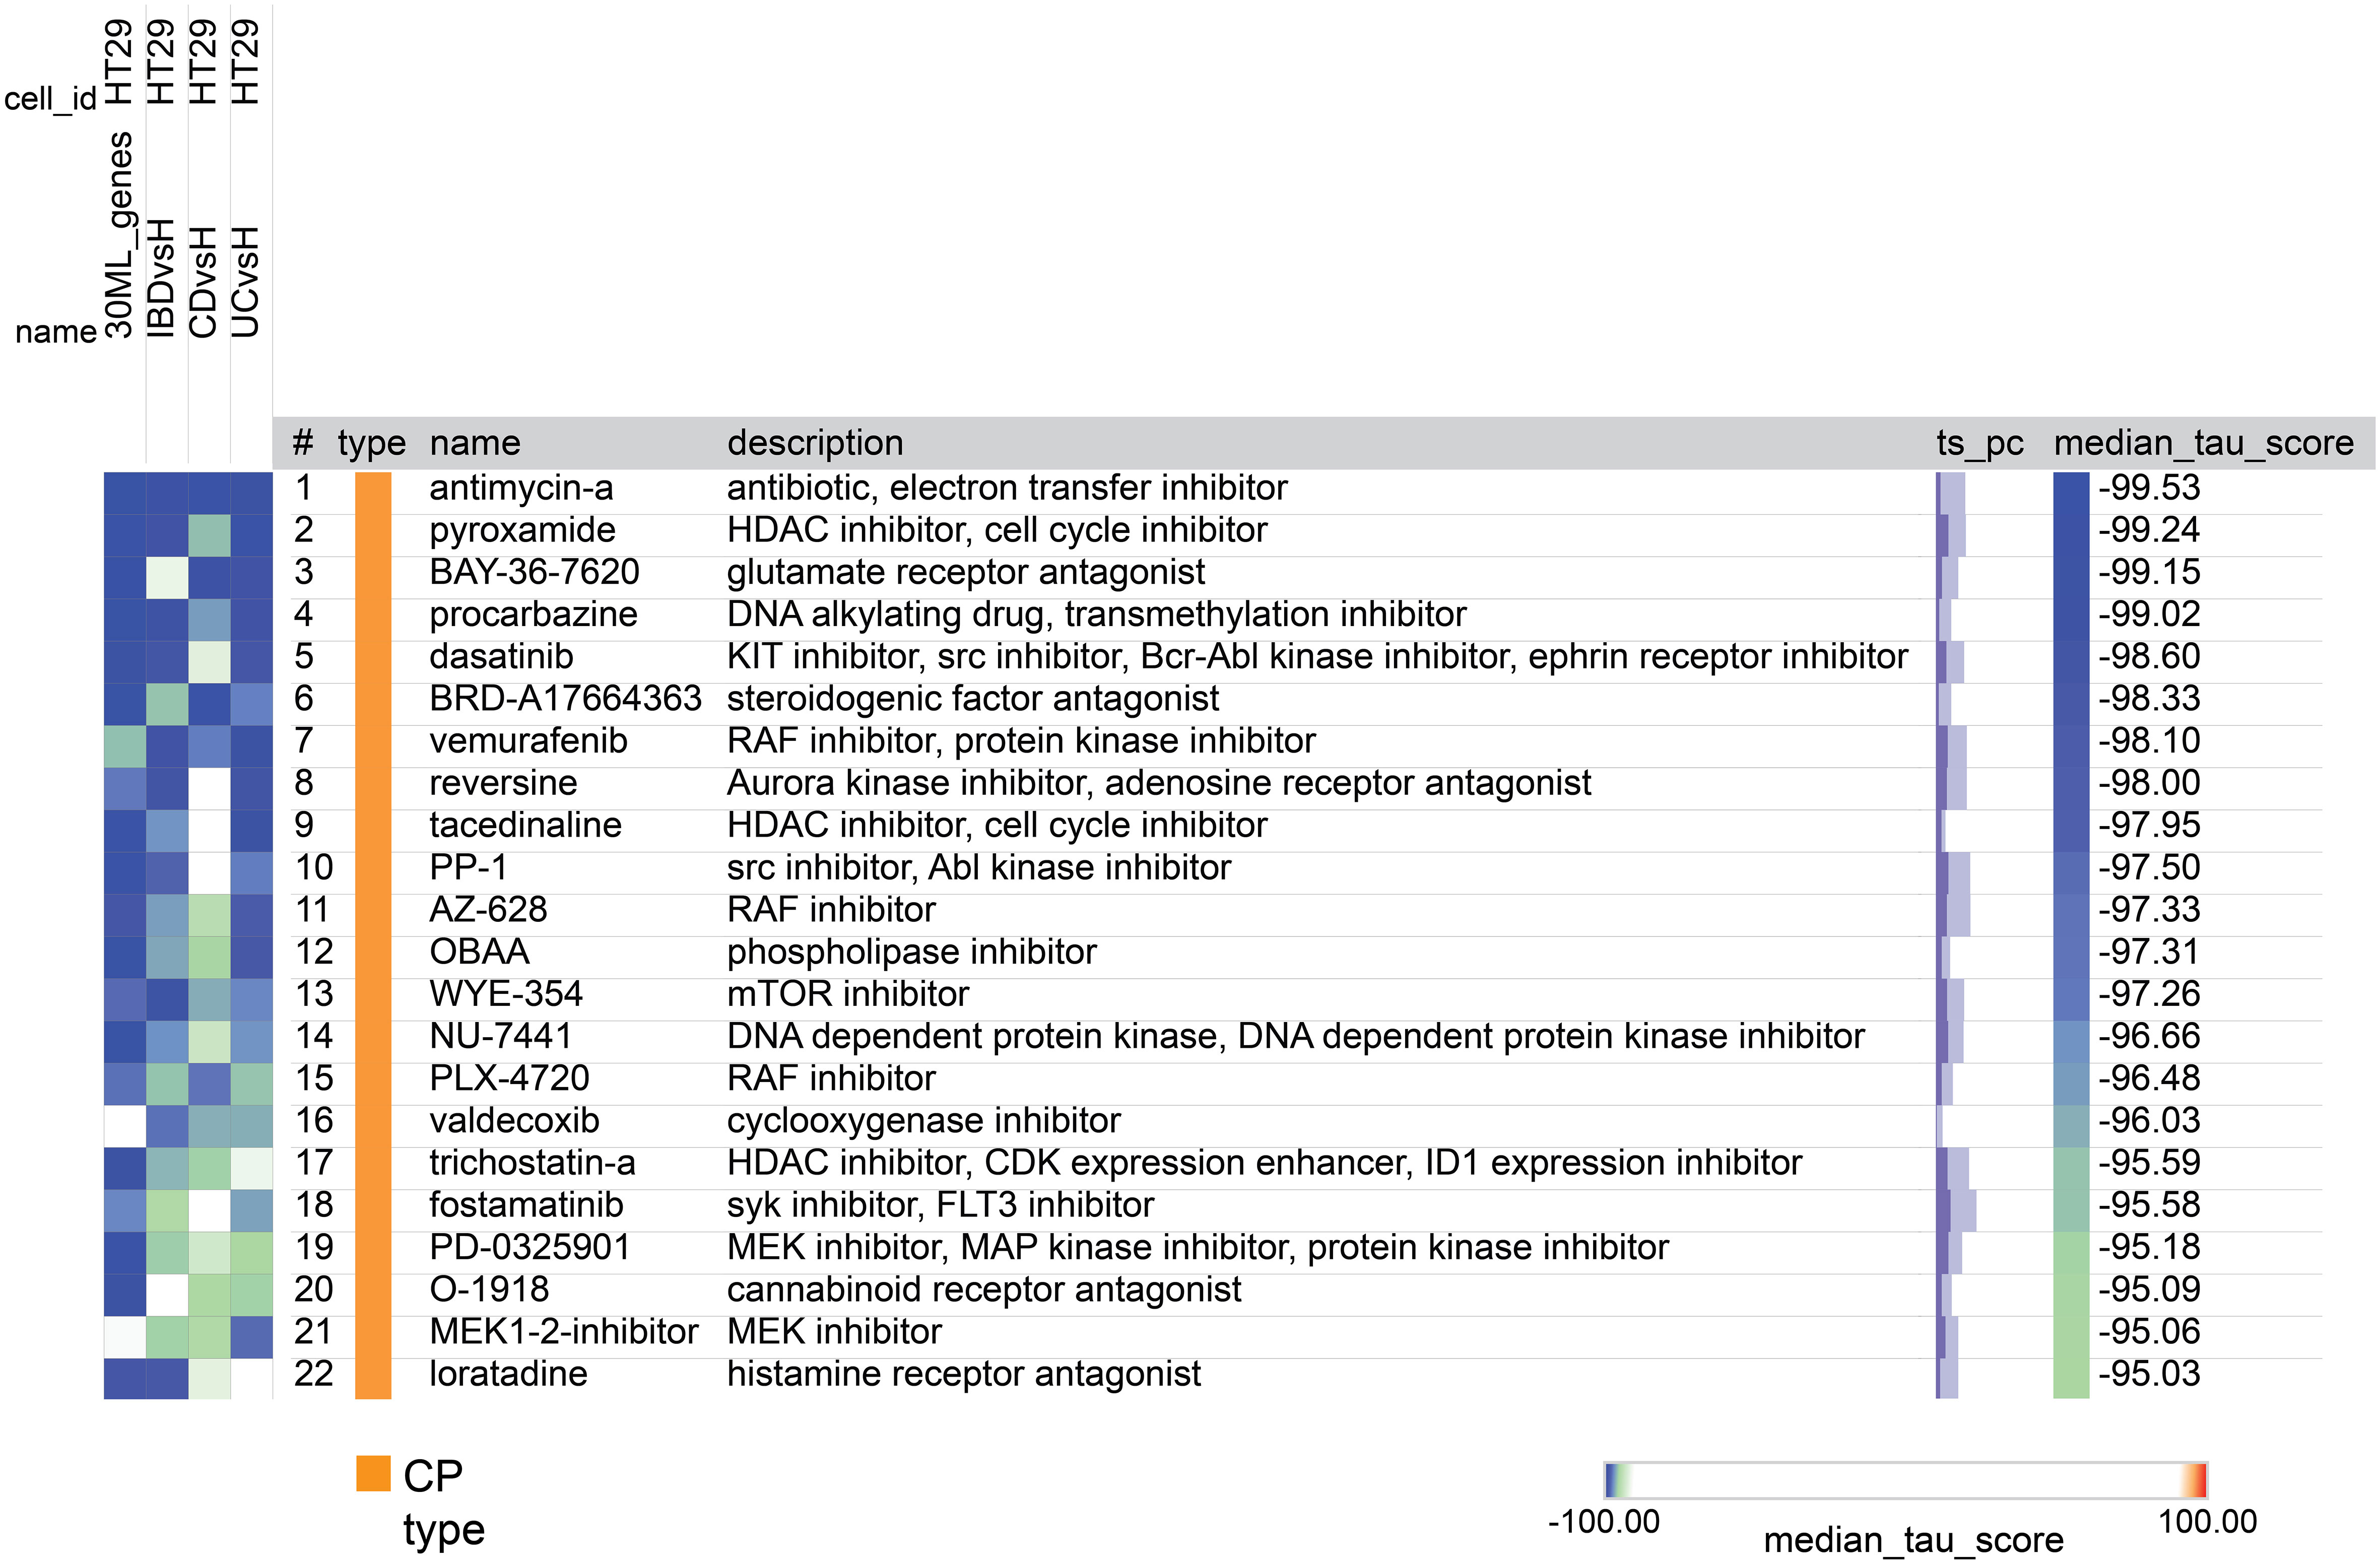
Figure 8 A heatmap generated by CMap showing the connection, assessed by connectivity score (tau score) between gene expression signature of the 4 groups (columns) and the compounds (rows). The score measures the strength of connection between the query signature and a compound. Compounds are sorted by decreasing order of median score across the four groups. Compounds with median score lower than -95 are considered significant.
Discussion
Whole-transcriptome analyses of IBD samples have been extensively performed over the years, but there is no conclusive understanding regard the mechanisms and expression pattern of specific genes underlying IBD. To gain a deeper insight into the mechanism of IBD, we conducted a mega-analysis, incorporating nearly 700 samples, along with reprocessing over 350 samples of validation data. Utilizing this comprehensive approach, we integrated data from multiple studies and applied unified bioinformatics methods to analyze the combined dataset thoroughly. By doing so, we have demonstrated the expression of genes that are already known to be related to the disease, as well as additional genes and novel transcripts whose expression is different in IBD and can potentially be exploited as a novel therapeutic target. We also characterized different pathways and upstream regulators, which are involved in the disease and can shed light on its underlying mechanism. Finally, using CMap, we presented new potential implications for the treatment of IBD.
In this work, we analyzed both CD and UC collectively as a group of IBD patients and assessed each disease individually. A search in the literature shows that many studies have already identified shared genetic risk factors and common pathways associated with both diseases (37). However, there’s also a growing interest in understanding the distinctions between UC and CD, as these differences can have clinical implications (4). In our attempt to detect genes that can distinguish between CD and UC, we encountered challenges due to tissue-specific effects. MDS analysis of the transcriptomes revealed that region of intestinal biopsy, colon or ileum, had significant effect on gene expression, overshadowing the discriminatory potential of inflammation status, with disease subtype (UC vs CD). We identified 10 genes that effectively distinguished between UC and CD, when testing our training model using samples originated from the same tissue source as used to train the model (UC from rectum and CD from ileum). However, validation using data from external samples obtained from the same tissue (CD and UC from the rectum) resulted in models failure. This aligns with the findings of Argmann et al. who similarly emphasized the dominant influence of the biopsy site on gene expression variation, with minimal divergence observed between UC and CD subtypes (8). To the best of our understanding, many of the differences in gene expression reported in the literature which were attributed to variations between the two diseases, can, in fact, be attributed to differences between the affected tissues rather than the disease themselves, since each of the diseases is mainly expressed in a different segment of the intestine (3). In light of these limitations, our primary focus was on identifying common molecular signatures associated with both UC and CD. We specifically emphasized shared biological pathways and mechanisms, aiming to enhance our understanding of the fundamental processes contributing to IBD. Furthermore, we sought to explore potential therapeutic targets that could be relevant for both diseases, regardless of the specific disease subtype or biopsy location.
Numerous published studies have consistently demonstrated differential gene expression in the inflamed intestinal tissues of individuals with IBD when compared to samples from healthy subjects. For instance, the Dual oxidase (DUOX) gene family, responsible for producing reactive oxygen species (ROS) (38) has been a subject of interest in these investigations. DUOX2 has been linked to very early onset IBD (39), and previous studies have reported overexpression of DUOX2 and DUOXA2 genes in UC (40). Our differential gene expression analysis supports these findings, highlighting DUOX2 and DUOXA2 among the top ten significantly upregulated genes in samples from IBD patients. Additionally, using ML algorithms, we showed that SAA1 and SAA2 discriminate between inflamed samples of UC, as well as IBD and non-IBD controls. This finding has already been published indicating that elevated levels of Serum Amyloid A (SAA) proteins, specifically SAA1 and SAA2, were consistently observed in IBD patients, particularly during active inflammation (41). We also identified MMP3 (Matrix Metalloproteinase 3), REG1A (Regenerating Islet-Derived Protein 1 Alpha), and CHI3L1 (Chitinase 3-Like 1) among the up-regulated genes in intestine samples of IBD patients. These genes are also known as upregulated in inflamed areas of colons of IBD patients compared to uninflamed tissues (42). Since these genes are involved in tissue remodeling (43–45), their aberrant expression may influence the extracellular matrix and tissue damage observed in IBD inflammation. Finally, of particular interest in our findings are the genes of the channels proteins AQP (Aquaporin) family, namely AQP9 and AQP8. AQP9 belongs to the aquaglyceroporins subfamily facilitates the membrane transport of water and glycerol and consistently displayed upregulation across UC, CD and IBD patients compared to non-IBD control subjects, demonstrating a commonality that also emerged in all our ML analyses. The exact mechanism of AQP9 in IBD remains unclear, but its increased expression in IBD has been observed in previous studies (46, 47). Recent research revealed that AQP9 is downregulated in IBD patients’ responders to infliximab compared to non-responders (48).
In contrast, AQP8, a member of the AQP8-Type Aquaammoniaporins, is associated with water absorption regulation, particularly in the duodenum, jejunum, and colon. It plays a role in water transport, however distinguishing itself with permeability to NH3/NH4+ (49). This gene exhibited pronounced downregulation across UC, CD and IBD patients compared to non-IBD control subjects. The observed decrease in its expression in IBD patients aligns with previous research findings (50, 51). However, it’s important to note that discovering inhibitors for AQP proteins poses a significant challenge due to their perceived ‘undruggable’ properties (52). Among other down regulated genes, CLDN8 (Claudin 8) a tight junction protein involved in maintaining the integrity of the intestinal barrier known to be down-regulated in both UC and CD (53). Additionally, CA1 (Carbonic Anhydrase 1) involved in pH regulation and mucosal protection (54) and other genes involved in transport (OTOP2 Otopetrin 2, SLC26A2 (Solute Carrier Family 26 Member 2), in metabolic process HMGCS2 (3-Hydroxy-3-Methylglutaryl-CoA Synthase 2) and immune regulation (DPP10 Dipeptidyl Peptidase 10) were also down-regulated. One notable discovery is a novel transcript, ENSG00000254645, which is downregulated in IBD patients compared to non-IBD subjects. Recently, this transcript was reported to be down regulated in CD (33). This transcript is a long non-coding RNA (lncRNA) located on chromosome 11, with the SOX6 (SRY-Box Transcription Factor 6) gene upstream and INSC (Inscuteable Spindle Orientation Adaptor) and the calcitonin genes (CALCa and CALCB) downstream (55–57).
Based on our DEGs analysis we also revealed pathways and upstream regulators associated with bacterial response and the activation of the NFκB transcription factor. These pathways promote the production of pro-inflammatory molecules, including tumor necrosis factor (TNF), interleukins (IL)-1, IL-6, IL-1B, and interferon (IFN-γ) (58). One significant pathway that stood out was the S100 family signaling pathway. It was notably activated in the UC vs. control comparison and ranked among the top ten activated signaling pathways in the CD comparison (data not shown). This pathway plays a crucial role in IBD, particularly through the involvement of S100A8 and S100A9 proteins, collectively known as calprotectin. These proteins are highly expressed by neutrophils and immune cells during inflammation and serve as a fecal calprotectin marker for inflammation and disease activity in UC (59). Another pathway enriched in UC was the IL-17 signaling. This pathway was also ranked in the top 20 pathways in CD and IBD comparisons (data not shown). Elevated IL-17 levels in active IBD patients’ blood and inflamed mucosa underline its role in disease inflammation (60, 61). However, caution is warranted in targeting this pathway for treatment, as observed in clinical studies using IL-17 inhibitors. These trials revealed heightened risks, including increased Candida albicans infections in IBD patients’ intestinal mucosa and severe adverse events leading to the premature cessation of an anti-IL-17 treatment trial for CD (60, 61). Clinical trials targeting the IL17 pathways show improvement in other inflammatory conditions, such as psoriasis, however, their administration has shown links to both new-onset and exacerbation of IBD, emphasizing the complexity and potential risks associated with manipulating this pathway in IBD therapy (62, 63). It’s noteworthy that to date, there are no ongoing clinical trials specifically targeting the IL-17 pathway for inflammatory bowel disease, signifying the need for further research to understand its role and develop safer, more effective treatments tailored to these diseases.
The pathways undergoing downregulation, encompassing metabolic, catabolic, and NR pathways, play a critical role in immune cell functions (64). Among these pathways, the LXR/RXR pathway has role in attenuating proinflammatory responses by modulating NFκB activity (65). Notably, in CD and IBD, we observed downregulation of this pathway alongside activation of the upstream regulator NFκB complex. In UC, while NFκB activation was also evident, the LXR/RXR pathway did not rank among the top 20 downregulated pathways. However, upon closer examination of the downregulated pathways in UC, the LXR/RXR pathway fell just slightly below the significance Z-score cutoff (data not shown). Furthermore, other immunometabolism pathways such as PXR/RXR Activation and the xenobiotic metabolism PXR signaling pathway, which also modulate NFκB activity (66), are downregulated in UC. Notably, NR pathways are significantly influenced by gut microbes (67) and can be a pharmacologically target for autoimmune treatment (34, 68).
Our ML analysis revealed three long non-coding RNAs (lncRNAs) including two novel transcripts, ENSG00000285744 and ENSG00000287626, along with MIR4435-2HG. These lncRNAs effectively distinguish between inflamed samples of IBD and non-IBD controls. The ENSG00000285744 transcript is located on chromosome 8 in proximity to IL-7, a cytokine known to play a role in the inflammatory response (69). The ENSG00000287626 transcript is located on chromosome 6 and overlaps with DTNBP1, a gene associated with the genetic disorder Hermansky–Pudlak syndrome (HPS), which has been reported to affect some patients with IBD (70). Finally, it is worth noting that the lncRNA MIR4435-2HG is already known to be associated with the immune system. The suppression of MIR4435-2HG has been shown to inhibit macrophage M1 polarization while promoting M2 polarization. This effect contributes to the alleviation of intestinal inflammation in mice with ulcerative colitis through the JAK1/STAT1 signaling pathway (71). Notably, our IPA analysis revealed the activation of both JAK1 and STAT1 upstream regulators in IBD. In addition, MIR4435-2HG was found to directly bind to EZH2 (72), the catalytic subunit of the polycomb repression complex 2 (PRC2). Epithelial EZH2 serves as an epigenetic determinant in experimental UC by inhibiting TNFα-mediated inflammation and apoptosis (73). In addition, it was shown that EZH2 suppression ameliorate intestinal inflammation and delay the onset of colitis associated cancer, suggesting the feasibility of EZH2 inhibitor for the control of IBD (74). Finally, the expression of MIR4435-2HG has been found to correlate with the size of intestinal polyps in Colorectal Cancer (CRC) (75) suggesting MIR4435-2HG to play a role in colorectal health. Collectively, these observations suggest that MIR4435-2HG may serve as a common molecular marker for inflammation-mediated processes and intestinal health.
Given the absence of specific serum markers for the diagnosis and management of IBD, it has become crucial to identify significant differences in serum levels among genes showing substantial expression in mucosal biopsies during severe endoscopic activity, regardless of the state of clinical symptoms. Notably, ADGRG3, KCNJ15, AQP9, MIR4435-2HG, S100A8, and S100A9 have demonstrated such variations. While S100A8 and S100A9 calprotectin have exhibited correlations with serum CRP, suggesting systemic inflammation, their utility might be limited to reflect intestinal inflammation (76). KCNJ15, identified as a common marker for UC and ankylosing spondylitis, shows promise as a potential diagnostic marker (77). Given the roles of all genes mentioned in the immune system, further validation is essential for their specific implications in IBD.
We performed data-driven analysis based on CMap for identifying new candidate compounds for IBD therapy. As the cell lines used to create the CMap reference database did not include UC or CD cells, we used HT-29 cells, the only intestinal cells in this database. We identified several potential candidate compounds from thousands of options for IBD therapy. Among them, one standout candidate is Antimycin-A boasting the highest connectivity score. This compound, an ATP synthase inhibitor, is recognized for its influence on mitochondrial dysfunction, a hallmark associated with IBD pathogenesis (78). Other compounds identified are Histone deacetylase (HDAC) inhibitors, like Pyroxamide, tacedinaline and trichostatin-a, as potential IBD treatment options. Notably, these compounds are known for their anti-inflammatory properties, offering promise in regulating inflammation linked to IBD (79). Likewise, the Monoamine oxidase inhibitor Procarbazine may have the potential to modulate neurotransmitters and immune responses and BCR-ABL kinase inhibitors such as Dasatinib and RAF inhibitors like Vemurafenib, AZ-628, and PLX-4720 might indirectly impact immune pathways, offering insights into IBD modulation (80, 81). Additionally, mTOR inhibitors, represented by WYE-354, and SYK inhibitors like Fostamatinib are under investigation for their anti-inflammatory effects (82, 83) and MEK inhibitors, including PD-0325901 and MEK1-2-inhibitor, target pathways associated with inflammation and immune responses (84). It’s worth acknowledging the dichotomous findings regarding the impact on IBD as certain reports suggested RAF/MEK inhibitors to potentially promote IBD in humans and mice (85, 86), while others have indicated that MEK inhibitors hold promise in improving diarrhea and histological scores in a murine colitis model (84), and RAF inhibition has induced clinical remission in CD patients (87). Lastly, compounds such as the Cannabinoid receptor antagonist O-1918, cyclooxygenase inhibitor Valdecoxib, and Histamine receptor antagonist Loratadine are all associated with anti-inflammatory pathways (88–90). These findings open new treatment strategies for future studies in IBD management.
In conclusion, our observations of an association between IBD and different candidate genes, specifically the novel transcripts ENSG00000285744, ENSG00000287626, and the MIR4435-2HG, needs to be further validated and interrogated functionally. MIR4435-2HG shows promise as a diagnostic tool using a simple blood test and may even serve as a therapeutic target. Finally, the identification of new candidate compounds for IBD therapy shed light on potential avenues for IBD treatment and warrant further investigation.
Data availability statement
The original data used in the study are included in the article. Further inquiries can be directed to the corresponding author.
Ethics statement
Ethical approval was not required for the study involving humans in accordance with the local legislation and institutional requirements. Written informed consent to participate in this study was not required from the participants or the participants’ legal guardians/next of kin in accordance with the national legislation and the institutional requirements.
Author contributions
ES: Investigation, Methodology, Formal analysis, Writing – original draft. TZ: Investigation, Methodology, Conceptualization, Supervision, Writing – review & editing. MK: Writing – review & editing, Formal analysis. LS: Formal analysis, Writing – review & editing. GS: Writing – review & editing, Investigation. MS-D: Investigation, Writing – review & editing, Conceptualization, Methodology, Supervision.
Funding
The author(s) declare that no financial support was received for the research, authorship, and/or publication of this article.
Conflict of interest
The authors declare that the research was conducted in the absence of any commercial or financial relationships that could be construed as a potential conflict of interest.
Publisher’s note
All claims expressed in this article are solely those of the authors and do not necessarily represent those of their affiliated organizations, or those of the publisher, the editors and the reviewers. Any product that may be evaluated in this article, or claim that may be made by its manufacturer, is not guaranteed or endorsed by the publisher.
Supplementary material
The Supplementary Material for this article can be found online at: https://www.frontiersin.org/articles/10.3389/fimmu.2024.1353402/full#supplementary-material
References
1. McInnes IB, Gravallese EM. Immune-mediated inflammatory disease therapeutics: past, present and future. Nat Rev Immunol. (2021) 21:680–6. doi: 10.1038/s41577-021-00603-1
2. Agrawal M, Spencer EA, Colombel J-F, Ungaro RC. Approach to the management of recently diagnosed inflammatory bowel disease patients: A user’s guide for adult and pediatric gastroenterologists. Gastroenterology. (2021) 161:47–65. doi: 10.1053/j.gastro.2021.04.063
3. Maaser C, Sturm A, Vavricka SR, Kucharzik T, Fiorino G, Annese V, et al. ECCO-ESGAR Guideline for Diagnostic Assessment in IBD Part 1: Initial diagnosis, monitoring of known IBD, detection of complications. J Crohns Colitis. (2019) 13:144–64. doi: 10.1093/ecco-jcc/jjy113
4. Venkateswaran N, Weismiller S, Clarke K. Indeterminate colitis - update on treatment options. J Inflammation Res. (2021) 14:6383–95. doi: 10.2147/JIR.S268262
5. Wang R, Li Z, Liu S, Zhang D. Global, regional and national burden of inflammatory bowel disease in 204 countries and territories from 1990 to 2019: a systematic analysis based on the Global Burden of Disease Study 2019. BMJ Open. (2023) 13:e065186. doi: 10.1136/bmjopen-2022-065186
6. Schoepfer A, Santos J, Fournier N, Schibli S, Spalinger J, Vavricka S, et al. Systematic analysis of the impact of diagnostic delay on bowel damage in paediatric versus adult onset crohn’s disease. J Crohns Colitis. (2019) 13:1334–42. doi: 10.1093/ecco-jcc/jjz065
7. Jukic A, Bakiri L, Wagner EF, Tilg H, Adolph TE. Calprotectin: from biomarker to biological function. Gut. (2021) 70:1978–88. doi: 10.1136/gutjnl-2021-324855
8. Argmann C, Hou R, Ungaro RC, Irizar H, Al-Taie Z, Huang R, et al. Biopsy and blood-based molecular biomarker of inflammation in IBD. Gut. (2023) 72:1271–87. doi: 10.1136/gutjnl-2021-326451
9. Wei J, Feng J. Signaling pathways associated with inflammatory bowel disease. Recent Pat Inflammation Allergy Drug Discovery. (2010) 4:105–17. doi: 10.2174/187221310791163071
10. Lei H, Crawford MS, McCole DF. JAK-STAT pathway regulation of intestinal permeability: pathogenic roles and therapeutic opportunities in inflammatory bowel disease. Pharm (Basel). (2021) 14. doi: 10.3390/ph14090840
11. Coskun M, Olsen J, Seidelin JB, Nielsen OH. MAP kinases in inflammatory bowel disease. Clin Chim Acta. (2011) 412:513–20. doi: 10.1016/j.cca.2010.12.020
12. Camba-Gómez M, Arosa L, Gualillo O, Conde-Aranda J. Chemokines and chemokine receptors in inflammatory bowel disease: Recent findings and future perspectives. Drug Discovery Today. (2022) 27:1167–75. doi: 10.1016/j.drudis.2021.12.004
13. Marafini I, Sedda S, Dinallo V, Monteleone G. Inflammatory cytokines: from discoveries to therapies in IBD. Expert Opin Biol Ther. (2019) 19:1207–17. doi: 10.1080/14712598.2019.1652267
14. Edgar R, Domrachev M, Lash AE. Gene Expression Omnibus: NCBI gene expression and hybridization array data repository. Nucleic Acids Res. (2002) 30:207–10. doi: 10.1093/nar/30.1.207
15. Brazma A, Parkinson H, Sarkans U, Shojatalab M, Vilo J, Abeygunawardena N, et al. ArrayExpress–a public repository for microarray gene expression data at the EBI. Nucleic Acids Res. (2003) 31:68–71. doi: 10.1093/nar/gkg091
16. Page MJ, McKenzie JE, Bossuyt PM, Boutron I, Hoffmann TC, Mulrow CD, et al. The PRISMA 2020 statement: an updated guideline for reporting systematic reviews. BMJ. (2021) 372:n71. doi: 10.1136/bmj.n71
17. Kim D, Paggi JM, Park C, Bennett C, Salzberg SL. Graph-based genome alignment and genotyping with HISAT2 and HISAT-genotype. Nat Biotechnol. (2019) 37:907–15. doi: 10.1038/s41587-019-0201-4
18. Liao Y, Smyth GK, Shi W. featureCounts: an efficient general purpose program for assigning sequence reads to genomic features. Bioinformatics. (2014) 30:923–30. doi: 10.1093/bioinformatics/btt656
19. Chen Y, Lun ATL, Smyth GK. From reads to genes to pathways: differential expression analysis of RNA-Seq experiments using Rsubread and the edgeR quasi-likelihood pipeline. F1000Research. (2016) 5:1438. doi: 10.12688/f1000research.8987.2
20. Ritchie ME, Phipson B, Wu D, Hu Y, Law CW, Shi W, et al. limma powers differential expression analyses for RNA-sequencing and microarray studies. Nucleic Acids Res. (2015) 43:e47. doi: 10.1093/nar/gkv007
21. Krämer A, Green J, Pollard J, Tugendreich S. Causal analysis approaches in Ingenuity Pathway Analysis. Bioinformatics. (2014) 30:523–30. doi: 10.1093/bioinformatics/btt703
22. Pedregosa F, Varoquaux G, Gramfort A, Michel V, Thirion B, Grisel O, et al. Scikit-learn machine learning in python. J Mach Learn Res. (2011) 12:2825–30.
23. Van Rossum G, Drake FL. Python 3 Reference Manual. Scotts Valley, CA: CreateSpace, 100 Enterprise Way, Suite A200 (2009).
24. Chen T, Guestrin C. XGBoost: A scalable tree boosting system. in Proceedings of the 22nd ACM SIGKDD international conference on knowledge discovery and data mining. 785–94 New York, NY, USA: ACM. doi: 10.1145/2939672
25. Lamb J, Crawford ED, Peck D, Modell JW, Blat IC, Wrobel MJ, et al. The Connectivity Map: using gene-expression signatures to connect small molecules, genes, and disease. Science. (2006) 313:1929–35. doi: 10.1126/science.1132939
26. Subramanian A, Narayan R, Corsello SM, Peck DD, Natoli TE, Lu X, et al. A next generation connectivity map: L1000 platform and the first 1,000,000 profiles. Cell. (2017) 171:1437–1452.e17. doi: 10.1016/j.cell.2017.10.049
27. Fogh J, Fogh JM, Orfeo T. One hundred and twenty-seven cultured human tumor cell lines producing tumors in nude mice. J Natl Cancer Inst. (1977) 59:221–6. doi: 10.1093/jnci/59.1.221
28. Cohen E, Ophir I, Shaul YB. Induced differentiation in HT29, a human colon adenocarcinoma cell line. J Cell Sci. (1999) 112:2657–66. doi: 10.1242/jcs.112.16.2657
29. Nautiyal J, Kanwar SS, Yu Y, Majumdar AP. Combination of dasatinib and curcumin eliminates chemo-resistant colon cancer cells. J Mol Signal. (2011) 6:7. doi: 10.1186/1750-2187-6-7
30. R Core Team. R: A language and environment for statistical computing. Vienna: R Foundation for Statistical Computing. (2022).
33. Triantaphyllopoulos KA. Long non-coding RNAs and their “Discrete” Contribution to IBD and johne’s disease-what stands out in the current picture? A comprehensive review. Int J Mol Sci. (2023) 24. doi: 10.3390/ijms241713566
34. Klepsch V, Moschen AR, Tilg H, Baier G, Hermann-Kleiter N. Nuclear receptors regulate intestinal inflammation in the context of IBD. Front Immunol. (2019) 10:1070. doi: 10.3389/fimmu.2019.01070
35. Jin Y, Blikslager AT. The regulation of intestinal mucosal barrier by myosin light chain kinase/rho kinases. Int J Mol Sci. (2020) 21. doi: 10.3390/ijms21103550
36. Wang X, Wong K, Ouyang W, Rutz S. Targeting IL-10 family cytokines for the treatment of human diseases. Cold Spring Harb Perspect Biol. (2019) 11. doi: 10.1101/cshperspect.a028548
37. Annese V. Genetics and epigenetics of IBD. Pharmacol Res. (2020) 159:104892. doi: 10.1016/J.PHRS.2020.104892
38. Bedard K, Krause K-H. The NOX family of ROS-generating NADPH oxidases: physiology and pathophysiology. Physiol Rev. (2007) 87:245–313. doi: 10.1152/physrev.00044.2005
39. Kyodo R, Takeuchi I, Narumi S, Shimizu H, Hata K, Yoshioka T, et al. Novel biallelic mutations in the DUOX2 gene underlying very early-onset inflammatory bowel disease: A case report. Clin Immunol. (2022) 238:109015. doi: 10.1016/j.clim.2022.109015
40. MacFie TS, Poulsom R, Parker A, Warnes G, Boitsova T, Nijhuis A, et al. DUOX2 and DUOXA2 form the predominant enzyme system capable of producing the reactive oxygen species H2O2 in active ulcerative colitis and are modulated by 5-aminosalicylic acid. Inflammation Bowel Dis. (2014) 20:514–24. doi: 10.1097/01.MIB.0000442012.45038.0e
41. Chen R, Chen Q, Zheng J, Zeng Z, Chen M, Li L, et al. Serum amyloid protein A in inflammatory bowel disease: from bench to bedside. Cell Death Discovery. (2023) 9:154. doi: 10.1038/s41420-023-01455-5
42. Galamb O, Sipos F, Solymosi N, Spisák S, Krenács T, Tóth K, et al. Diagnostic mRNA expression patterns of inflamed, benign, and Malignant colorectal biopsy specimen and their correlation with peripheral blood results. Cancer Epidemiol Biomarkers Prev. (2008) 17:2835–45. doi: 10.1158/1055-9965.EPI-08-0231
43. Mao H, Jia J, Sheng J, Zhang S, Huang K, Li H, et al. Protective and anti-inflammatory role of REG1A in inflammatory bowel disease induced by JAK/STAT3 signaling axis. Int Immunopharmacol. (2021) 92:107304. doi: 10.1016/j.intimp.2020.107304
44. Deutschmann C, Sowa M, Murugaiyan J, Roesler U, Röber N, Conrad K, et al. Identification of chitinase-3-like protein 1 as a novel neutrophil antigenic target in crohn’s disease. J Crohns Colitis. (2019) 13:894–904. doi: 10.1093/ecco-jcc/jjz012
45. Gill SE, Parks WC. Metalloproteinases and their inhibitors: regulators of wound healing. Int J Biochem Cell Biol. (2008) 40:1334–47. doi: 10.1016/j.biocel.2007.10.024
46. Chen Z-A, Ma H-H, Wang Y, Tian H, Mi J-W, Yao D-M, et al. Integrated multiple microarray studies by robust rank aggregation to identify immune-associated biomarkers in Crohn’s disease based on three machine learning methods. Sci Rep. (2023) 13:2694. doi: 10.1038/s41598-022-26345-1
47. Taman H, Fenton CG, Hensel IV, Anderssen E, Florholmen J, Paulssen RH. Transcriptomic landscape of treatment-naïve ulcerative colitis. J Crohns Colitis. (2018) 12:327–36. doi: 10.1093/ecco-jcc/jjx139
48. Kaddoura R, Ghelani H, Alqutami F, Altaher H, Hachim M, Jan RK. Identification of specific biomarkers and pathways in the treatment response of infliximab for inflammatory bowel disease: in-silico analysis. Life (Basel Switzerland). (2023) 13. doi: 10.3390/life13030680
49. Takata K, Matsuzaki T, Tajika Y. Aquaporins: water channel proteins of the cell membrane. Prog Histochem Cytochem. (2004) 39:1–83. doi: 10.1016/j.proghi.2004.03.001
50. Linggi B, Jairath V, Zou G, Shackelton LM, McGovern DPB, Salas A, et al. Meta-analysis of gene expression disease signatures in colonic biopsy tissue from patients with ulcerative colitis. Sci Rep. (2021) 11:18243. doi: 10.1038/s41598-021-97366-5
51. Zhao X-H, Zhao P, Deng Z, Yang T, Qi Y-X, An L-Y, et al. Integrative analysis reveals marker genes for intestinal mucosa barrier repairing in clinical patients. iScience. (2023) 26:106831. doi: 10.1016/j.isci.2023.106831
52. Wang S, Solenov EI, Yang B. Aquaporin inhibitors. Adv Exp Med Biol. (2023) 1398:317–30. doi: 10.1007/978-981-19-7415-1_22
53. Wang H, Chao K, Ng SC, Bai AH, Yu Q, Yu J, et al. Pro-inflammatory miR-223 mediates the cross-talk between the IL23 pathway and the intestinal barrier in inflammatory bowel disease. Genome Biol. (2016) 17:58. doi: 10.1186/s13059-016-0901-8
54. Schniers A, Goll R, Pasing Y, Sørbye SW, Florholmen J, Hansen T. Ulcerative colitis: functional analysis of the in-depth proteome. Clin Proteomics. (2019) 16:4. doi: 10.1186/s12014-019-9224-6
55. Lai NY, Mills K, Chiu IM. Sensory neuron regulation of gastrointestinal inflammation and bacterial host defence. J Intern Med. (2017) 282:5–23. doi: 10.1111/joim.12591
56. Yu T, Li D, Zeng Z, Xu X, Zhang H, Wu J, et al. INSC is down-regulated in colon cancer and correlated to immune infiltration. Front Genet. (2022) 13:821826. doi: 10.3389/fgene.2022.821826
57. Kinchen J, Chen HH, Parikh K, Antanaviciute A, Jagielowicz M, Fawkner-Corbett D, et al. Structural remodeling of the human colonic mesenchyme in inflammatory bowel disease. Cell. (2018) 175:372–386.e17. doi: 10.1016/j.cell.2018.08.067
58. Tang X-D, Ji T-T, Dong J-R, Feng H, Chen F-Q, Chen X, et al. Pathogenesis and treatment of cytokine storm induced by infectious diseases. Int J Mol Sci. (2021) 22. doi: 10.3390/ijms222313009
59. Costa F, Mumolo MG, Ceccarelli L, Bellini M, Romano MR, Sterpi C, et al. Calprotectin is a stronger predictive marker of relapse in ulcerative colitis than in Crohn’s disease. Gut. (2005) 54:364–8. doi: 10.1136/gut.2004.043406
60. Targan SR, Feagan B, Vermeire S, Panaccione R, Melmed GY, Landers C, et al. A randomized, double-blind, placebo-controlled phase 2 study of brodalumab in patients with moderate-to-severe crohn’s disease. Am J Gastroenterol. (2016) 111:1599–607. doi: 10.1038/ajg.2016.298
61. Hueber W, Sands BE, Lewitzky S, Vandemeulebroecke M, Reinisch W, Higgins PDR, et al. Secukinumab, a human anti-IL-17A monoclonal antibody, for moderate to severe Crohn’s disease: unexpected results of a randomised, double-blind placebo-controlled trial. Gut. (2012) 61:1693–700. doi: 10.1136/gutjnl-2011-301668
62. Noviello D, Mager R, Roda G, Borroni RG, Fiorino G, Vetrano S. The IL23-IL17 immune axis in the treatment of ulcerative colitis: successes, defeats, and ongoing challenges. Front Immunol. (2021) 12:611256. doi: 10.3389/fimmu.2021.611256
63. Huangfu L, Li R, Huang Y, Wang S. The IL-17 family in diseases: from bench to bedside. Signal Transduct Target Ther. (2023) 8:402. doi: 10.1038/s41392-023-01620-3
64. Wculek SK, Dunphy G, Heras-Murillo I, Mastrangelo A, Sancho D. Metabolism of tissue macrophages in homeostasis and pathology. Cell Mol Immunol. (2022) 19:384–408. doi: 10.1038/s41423-021-00791-9
65. Alatshan A, Benkő S. Nuclear receptors as multiple regulators of NLRP3 inflammasome function. Front Immunol. (2021) 12:630569. doi: 10.3389/fimmu.2021.630569
66. Bautista-Olivier CD, Elizondo G. PXR as the tipping point between innate immune response, microbial infections, and drug metabolism. Biochem Pharmacol. (2022) 202:115147. doi: 10.1016/j.bcp.2022.115147
67. Michaels M, Madsen KL. Immunometabolism and microbial metabolites at the gut barrier: Lessons for therapeutic intervention in inflammatory bowel disease. Mucosal Immunol. (2023) 16:72–85. doi: 10.1016/j.mucimm.2022.11.001
68. Fiocchi C, Iliopoulos D. Inflammatory bowel disease therapy: beyond the immunome. Front Immunol. (2022) 13:864762. doi: 10.3389/fimmu.2022.864762
69. Nakase H, Sato N, Mizuno N, Ikawa Y. The influence of cytokines on the complex pathology of ulcerative colitis. Autoimmun Rev. (2022) 21:103017. doi: 10.1016/j.autrev.2021.103017
70. O’Brien KJ, Parisi X, Shelman NR, Merideth MA, Introne WJ, Heller T, et al. Inflammatory bowel disease in Hermansky-Pudlak syndrome: a retrospective single-centre cohort study. J Intern Med. (2021) 290:129–40. doi: 10.1111/joim.13224
71. Cao L, Tan Q, Zhu R, Ye L, Shi G, Yuan Z. LncRNA MIR4435-2HG suppression regulates macrophage M1/M2 polarization and reduces intestinal inflammation in mice with ulcerative colitis. Cytokine. (2023) 170:156338. doi: 10.1016/j.cyto.2023.156338
72. Xu X, Gu J, Ding X, Ge G, Zang X, Ji R, et al. LINC00978 promotes the progression of hepatocellular carcinoma by regulating EZH2-mediated silencing of p21 and E-cadherin expression. Cell Death Dis. (2019) 10:752. doi: 10.1038/s41419-019-1990-6
73. Liu Y, Peng J, Sun T, Li N, Zhang L, Ren J, et al. Epithelial EZH2 serves as an epigenetic determinant in experimental colitis by inhibiting TNFα-mediated inflammation and apoptosis. Proc Natl Acad Sci U.S.A. (2017) 114:E3796–805. doi: 10.1073/pnas.1700909114
74. Zhou J, Huang S, Wang Z, Huang J, Xu L, Tang X, et al. Targeting EZH2 histone methyltransferase activity alleviates experimental intestinal inflammation. Nat Commun. (2019) 10:2427. doi: 10.1038/s41467-019-10176-2
75. Zhu D, Guo P, Jin XY, Zhang R, Ji G, Yang Z, et al. Long-chain non-coding RNA MIR4435-2HG expression correlates with size of intestinal polyps in children and with metastasis of colon cancer. Anticancer Res. (2022) 42:4707–14. doi: 10.21873/anticanres.15975
76. Azramezani Kopi T, Shahrokh S, Mirzaei S, Asadzadeh Aghdaei H, Amini Kadijani A. The role of serum calprotectin as a novel biomarker in inflammatory bowel diseases: a review study. Gastroenterol Hepatol Bed to Bench. (2019) 12:183–9.
77. Zhou S-Z, Shen L, Fu Z-B, Li H, Pan Y-L, Yu R-Z. Exploring the common diagnostic gene KCNJ15 and shared pathway of ankylosing spondylitis and ulcerative colitis through integrated bioinformatics. Front Physiol. (2023) 14:1146538. doi: 10.3389/fphys.2023.1146538
78. Ho G-T, Theiss AL. Mitochondria and inflammatory bowel diseases: toward a stratified therapeutic intervention. Annu Rev Physiol. (2022) 84:435–59. doi: 10.1146/annurev-physiol-060821-083306
79. Gerbeth L, Glauben R. Histone deacetylases in the inflamed intestinal epithelium-promises of new therapeutic strategies. Front Med. (2021) 8:655956. doi: 10.3389/fmed.2021.655956
80. Can G, Ayvaz S, Can H, Karaboğa İ, Demirtaş S, Akşit H, et al. The efficacy of tyrosine kinase inhibitor dasatinib on colonic mucosal damage in murine model of colitis. Clin Res Hepatol Gastroenterol. (2016) 40:504–16. doi: 10.1016/j.clinre.2015.12.006
81. Zhang C, Luo Y, He Q, Liu S, He A, Yan J. A pan-RAF inhibitor LY3009120 inhibits necroptosis by preventing phosphorylation of RIPK1 and alleviates dextran sulfate sodium-induced colitis. Clin Sci (Lond). (2019) 133:919–32. doi: 10.1042/CS20181081
82. Issara-Amphorn J, Chancharoenthana W, Visitchanakun P, Leelahavanichkul A. Syk inhibitor attenuates polymicrobial sepsis in fcgRIIb-deficient lupus mouse model, the impact of lupus characteristics in sepsis. J Innate Immun. (2020) 12:461–79. doi: 10.1159/000509111
83. Mao B, Zhang Q, Ma L, Zhao D-S, Zhao P, Yan P. Overview of Research into mTOR Inhibitors. Molecules. (2022) 27. doi: 10.3390/molecules27165295
84. Gamo K, Okuzono Y, Yabuki M, Ochi T, Sugimura K, Sato Y, et al. Gene signature-based approach identified MEK1/2 as a potential target associated with relapse after anti-TNFα Treatment for crohn’s disease. Inflammation Bowel Dis. (2018) 24:1251–65. doi: 10.1093/ibd/izy079
85. Lin W, Ma C, Su F, Jiang Y, Lai R, Zhang T, et al. Raf kinase inhibitor protein mediates intestinal epithelial cell apoptosis and promotes IBDs in humans and mice. Gut. (2017) 66:597–610. doi: 10.1136/gutjnl-2015-310096
86. Kuang AG, Mohajir W, Panneerselvam K, McQuade JL, Oliva ICG, Khan MA, et al. Diarrhea and colitis related to immune checkpoint inhibitor and BRAF/MEK inhibitor therapy. Ann Gastroenterol. (2023) 36:45–53. doi: 10.20524/aog.2023.0762
87. Löwenberg M, Verhaar A, van den Blink B, ten Kate F, van Deventer S, Peppelenbosch M, et al. Specific inhibition of c-Raf activity by semapimod induces clinical remission in severe Crohn’s disease. J Immunol. (2005) 175:2293–300. doi: 10.4049/jimmunol.175.4.2293
88. Gao F, Zhang S. Loratadine alleviates advanced glycation end product-induced activation of NLRP3 inflammasome in human chondrocytes. Drug Des Devel Ther. (2020) 14:2899–908. doi: 10.2147/DDDT.S243512
89. Smith CJ, Zhang Y, Koboldt CM, Muhammad J, Zweifel BS, Shaffer A, et al. Pharmacological analysis of cyclooxygenase-1 in inflammation. Proc Natl Acad Sci U.S.A. (1998) 95:13313–8. doi: 10.1073/pnas.95.22.13313
Keywords: inflammatory bowel disease, ulcerative colitis, Crohn’s disease, biomarkers, mega-analysis, machine learning
Citation: Stemmer E, Zahavi T, Kellerman M, Sinberger LA, Shrem G and Salmon‐Divon M (2024) Exploring potential biomarkers and therapeutic targets in inflammatory bowel disease: insights from a mega-analysis approach. Front. Immunol. 15:1353402. doi: 10.3389/fimmu.2024.1353402
Received: 11 December 2023; Accepted: 20 February 2024;
Published: 06 March 2024.
Edited by:
Liu Changhui, Guangzhou University of Chinese Medicine, ChinaReviewed by:
Mathieu Garand, Washington University in St. Louis, United StatesJie Wang, Xinxiang Medical University, China
Copyright © 2024 Stemmer, Zahavi, Kellerman, Sinberger, Shrem and Salmon‐Divon. This is an open-access article distributed under the terms of the Creative Commons Attribution License (CC BY). The use, distribution or reproduction in other forums is permitted, provided the original author(s) and the copyright owner(s) are credited and that the original publication in this journal is cited, in accordance with accepted academic practice. No use, distribution or reproduction is permitted which does not comply with these terms.
*Correspondence: Mali Salmon-Divon, bWFsaXNhQGFyaWVsLmFjLmls