 Tanya Tripathi
 Carsten Carlberg
- 1Institute of Animal Reproduction and Food Research, Polish Academy of Sciences, Olsztyn, Poland
- 2Institute of Biomedicine, School of Medicine, University of Eastern Finland, Kuopio, Finland
Introduction: Vitamin D plays a vital role in modulating innate and adaptive immunity. This study investigated the gene regulatory mechanisms underlying this modulation in vivo.
Methods: We conducted a proof-of-principle intervention in which a participant received a bolus of vitamin D3 (80,000 IU) monthly for three months. Peripheral blood mononuclear cells (PBMCs) were collected immediately before and at 4, 24, and 48 hours post-supplementation for transcriptome-wide differential gene expression analysis.
Results: We identified 570 genes significantly responsive to vitamin D3 (p < 0.05) at one or more timepoints. In vitro experiments using PBMCs of the 0-hour time point of the same individual validated 303 of these as targets of the vitamin D receptor ligand 1α,25-dihydroxyvitamin D3. Among these, 55 primary target genes exhibited significant changes as early as 4 hours post-supplementation, including genes like SELENOS (selenoprotein S), which plays a key role in the selenium micronutrient network. Moreover, genes such as PRDX1 (peroxiredoxin 1), TXNRD1 (thioredoxin reductase 1), and SOD2 (superoxide dismutase 2), involved in antioxidant defense, were prominently regulated.
Discussion: These findings highlight a potential early and primary role for vitamin D in regulating detoxification processes, suggesting its critical involvement in maintaining redox homeostasis in immune cells of healthy individuals.
1 Introduction
Vitamin D3 is a vital micronutrient that can either be synthesized endogenously in the skin upon exposure to UV-B radiation (1, 2) or obtained through dietary sources and supplementation (3). One of the most ancient evolutionary roles of vitamin D is maintaining energetic and survival homeostasis, such as detoxification (4, 5). However, its most well-known physiological function is regulating calcium homeostasis, which is crucial for bone mineralization (6). Beyond these roles, vitamin D also plays a critical part in modulating the immune system (7–12). It supports the innate immune response to infectious diseases, such as tuberculosis (13) and COVID-19 (coronavirus disease) (14), while also preventing overactivation of the adaptive immune system. This dual function is essential for reducing the risk of autoimmune diseases, such as multiple sclerosis (15, 16), and for mitigating severe immune responses, such as those observed in critical cases of COVID-19 (17).
The vitamin D3 metabolite 1,25-dihydroxyvitamin D3 (1,25(OH)2D3) binds to and activates the transcription factor and the (vitamin D receptor) (18–20), thereby exerting direct effects on gene regulation (21). VDR, a member of the nuclear receptor superfamily (22), regulates several hundred specific target genes across approximately half of human tissues and cell types (23, 24). As a result, the biological functions of vitamin D3 in health and disease are intrinsically linked to 1,25(OH)2D3-mediated changes in the transcriptome of VDR-expressing cells (23). The vitamin D-regulated transcriptome has been extensively studied using various in vitro cell culture models (9, 25–27), including THP-1 monocytic leukemia cells (28). However, primary cells, which more closely mimic the human in vivo context, offer a more physiologically relevant alternative. PBMCs are particularly attractive for such studies, as they can be obtained from donors with minimal invasiveness (29). PBMCs consist of a diverse population of innate and adaptive immune cells, including monocytes, natural killer cells, and T and B lymphocytes. Among these, monocytes are the most responsive to vitamin D (30). The genome-wide binding pattern of VDR has been characterized in various human in vitro cell culture systems (31). In monocytes, the VDR cistrome comprises over 10,000 loci, although only a few hundred persistent VDR binding sites are consistently occupied (32). These persistent sites serve as the primary genomic contact points for 1,25(OH)2D3, orchestrating its spatiotemporal response as a nuclear hormone. The chromatin model of vitamin D signaling (33, 34), derived primarily from studies in THP-1 cells stimulated for 24 hours with 1,25(OH)2D3, proposes that the regulation of a primary vitamin D target gene depends on the presence of a prominent VDR binding site within its TAD (topologically associated domain). Since TADs range in size from 100 kb to 2 Mb, this defines the maximum distance between a VDR-binding enhancer and the TSS (transcription start site) of its corresponding target gene (35).
This study investigates transcriptomic changes in PBMCs at 4, 24, and 48 hours following vitamin D3 supplementation in a healthy individual. These in vivo data were compared with previously published (36) in vitro data obtained from PBMCs of the same individual. The time-resolved analysis provides a comprehensive view of the dynamic effects of vitamin D on these immune cells and highlights the stimulation of detoxification processes as early response to the prohormone.
2 Materials and methods
2.1 Sample collection
Peripheral blood samples were obtained from a single healthy participant (male, age 57) enrolled in the VitDHiD trial (NCT03537027, ClinicalTrials.gov) (37), which had been classified as a high vitamin D responder. The vitamin D status, expressed by 25-hydroxyvitamin D3 (25(OH)D3) serum levels, as well as the vitamin D3 concentration was measured using UPLC (1290 Infinity II LC (liquid chromatography) System, Agilent) coupled with MS (mass spectroscopy) detection (API 4000 LC-MS/MS System, SCIEX). The study protocol was approved by the Ethics Committee of the Northern Savo Hospital District (Approval #515/2018). Written informed consent was obtained from the participant, and all experiments were conducted in compliance with applicable ethical guidelines and regulations.
2.2 PBMC isolation
Peripheral blood samples (8 ml) were collected immediately before (0 hours) and at 4, 24, and 48 hours following a vitamin D3 bolus supplementation (80,000 IU). PBMCs were isolated within one hour of collection using Vacutainer CPT Cell Preparation Tubes with sodium citrate (Becton Dickinson) according to the manufacturer’s protocol. After isolation, the cells were washed with phosphate-buffered saline, aliquoted at a concentration of 4 million cells per ml, and stored at -80°C for subsequent RNA isolation. This experiment was repeated across three consecutive months using the same individual. In a previously published study (36), PBMCs isolated from the same individual at the 0-hour timepoint of each of the three biological replicates of the in vivo experiment were stimulated in vitro with 1,25(OH)2D3 for 4, 24, and 48 hours. This paired design ensured that the starting conditions of the present in vivo study were directly aligned with those of the in vitro experiment, enabling meaningful comparison between the two settings.
2.3 Transcriptome analysis
Total RNA was extracted from PBMCs using the High Pure RNA Isolation Kit (Roche) according to the manufacturer’s instructions. RNA quality was assessed using the Agilent 2100 Bioanalyzer system, ensuring a RNA integrity number ≥ 8. Library preparation was performed after rRNA depletion using kits and protocols from New England Biolabs. RNA-seq libraries underwent quality control on the Agilent 2100 Bioanalyzer before sequencing on a NextSeq 500 system (Illumina) with a 75 bp read length, following standard protocols at the EMBL Gene Core facility in Heidelberg, Germany. All samples were processed and sequenced in a single batch. Fastq files for the 12 libraries have been deposited in the Gene Expression Omnibus (GEO) under accession number GSE283231 and the raw data of the in vitro samples are available under accession number GSE189984. Sequencing quality was evaluated using FastQC (version 0.12.1, www.bioinformatics.babraham.ac.uk/projects/fastqc), with results summarized in Supplementary Table S1. In parallel, raw data from a previously published time-course experiment using PBMCs from the same individual, stimulated in vitro with 10 nM (36) (OH)2D3 for 4, 24, and 48 hours (36), were reanalyzed using the latest version of the human genome. Reads were aligned to the GRCh38 reference genome (Ensembl version 111.38) using the STAR aligner (38) (version 2.7.10b), and quantification was performed with FeatureCounts (39) (version 2.16.0) using default parameters. To ensure consistency in gene nomenclature, Human Gene Nomenclature Committee (HGNC) symbols were updated using the R package HGNChelper (version 0.8.1, https://CRAN.R-project.org/package=HGNChelper). Annotation, including gene identifiers, descriptions, genomic locations, and biotypes, was integrated from the Ensembl database (release 109) using the R package BiomaRt (40) (version 2.58.2). Entrez Gene identifiers were added using the R package org.Hs.eg.db (version 3.18.0), and any incomplete mappings for target genes were manually verified and retrieved from NCBI (www.ncbi.nlm.nih.gov/home/genes). Genes without genomic position information or those encoded in mitochondrial DNA were excluded from further analysis.
2.4 Differential gene expression analysis
Differential gene expression analysis was conducted in R (version 4.3.1) on MacOS 13 (Ventura) using the DESeq package (version 4.0.16) for robust assessment. To reduce transcriptional noise associated with non-coding genes, the analysis focused on 19,272 protein-coding genes. Read counts were normalized to counts per million (CPM) to account for library size differences. Genes with low expression levels (CPM < 15 in in vivo samples and CPM < 9 in in vitro samples) were filtered out to reduce the multiple testing burden and enhance statistical accuracy. Additionally, to account for variability (“wobbling”) in both datasets, the average standard deviation and mean of expression levels across in vivo samples for each timepoint were calculated, and genes with values exceeding 0.25 were filtered out. The transcriptome data structure was explored using multidimensional scaling (MDS) via EdgeR’s plotMDS() function, where distances approximate typical log2 fold changes (FC) between samples. These distances were calculated as the root mean square deviation (Euclidean distance) of log2FC values for genes showing significant changes (p-value < 0.05 or Benjamini-Hochberg adjusted p-value = FDR (false discovery rate) < 0.05)) post-vitamin D3 supplementation (Supplementary Tables S2, S3). Mean-Difference (MA) plots were generated using the DESeq2 package (version 1.42.1). Differential gene expression was analyzed through the DESeq2 pipeline, which is based on a generalized linear model framework. Gene-wise dispersion estimates were calculated using maximum a posteriori estimation, incorporating empirical Bayes shrinkage for improved precision. Normalization was performed using the median-of-ratios method to account for differences in library size. The Wald test was employed to evaluate the significance of differential expression, and p-values were adjusted for multiple testing using the Benjamini-Hochberg procedure.
2.5 Analysis of genomic regions for key vitamin D target genes
The genomic regions of key in vivo vitamin D target genes were analyzed to identify VDR-binding enhancers and TSS regions using epigenome-wide data from THP-1 cells stimulated for 2 and 24 hours with either 10 nM 1,25(OH)2D3 or a solvent control (0.1% ethanol). This analysis incorporated ChIP-seq (chromatin immunoprecipitation sequencing) datasets for VDR binding (32). Additionally, FAIRE-seq (26) (formaldehyde-assisted isolation of regulatory elements followed by sequencing) data were utilized to further define regulatory regions via chromatin accessibility. The datasets were visualized using the IGV browser (41), highlighting VDR binding enhancer and TSS regions within accessible chromatin, which show responsiveness to 1,25(OH)2D3 within the TAD regions of vitamin D target genes. A region spanning 0.5 Mb upstream and downstream of each target gene’s TSS was screened; however, only the essential regions are presented in the analysis.
3 Results
3.1 In vivo and in vitro transcriptome changes of PBMCs in response to vitamin D
To compare the transcriptomic response of PBMCs to vitamin D under both in vivo and in vitro conditions, we utilized the design of the VitDHiD vitamin D intervention trial (37), in which individuals were supplemented with a single bolus of vitamin D3 (80,000 IU). In this study, the bolus experiment was repeated over three consecutive months (Figure 1A) with one VitDHiD study participant who had been classified as a high responder (42). Blood samples were collected at baseline (prior to supplementation) and at 4, 24, and 48 hours post-supplementation. On average, this resulted in an increase in 25(OH)D3 serum levels from 35.5 to 41.9 ng/ml within 48 hours (Table 1). Circulating vitamin D3 levels rose from 2.6 to 64.8 ng/ml within the first 24 hours and declined to 35.1 ng/ml over the following 24 hours. From each blood sample PBMCs were isolated without further in vitro culture (Figure 1A, left). In parallel, aliquots of PBMCs collected at baseline (timepoint 0 hours, three biological repeats) had been stimulated in vitro with 10 nM 1,25(OH)2D3 or a solvent control (0.1% EtOH) for 4, 24, and 48 hours (Figure 1A, right). The results of the in vitro experiment had been published previously (36) and were re-analyzed in the present study using the latest version of the human genome and analysis thresholds standardized across both the in vivo and in vitro experiments.
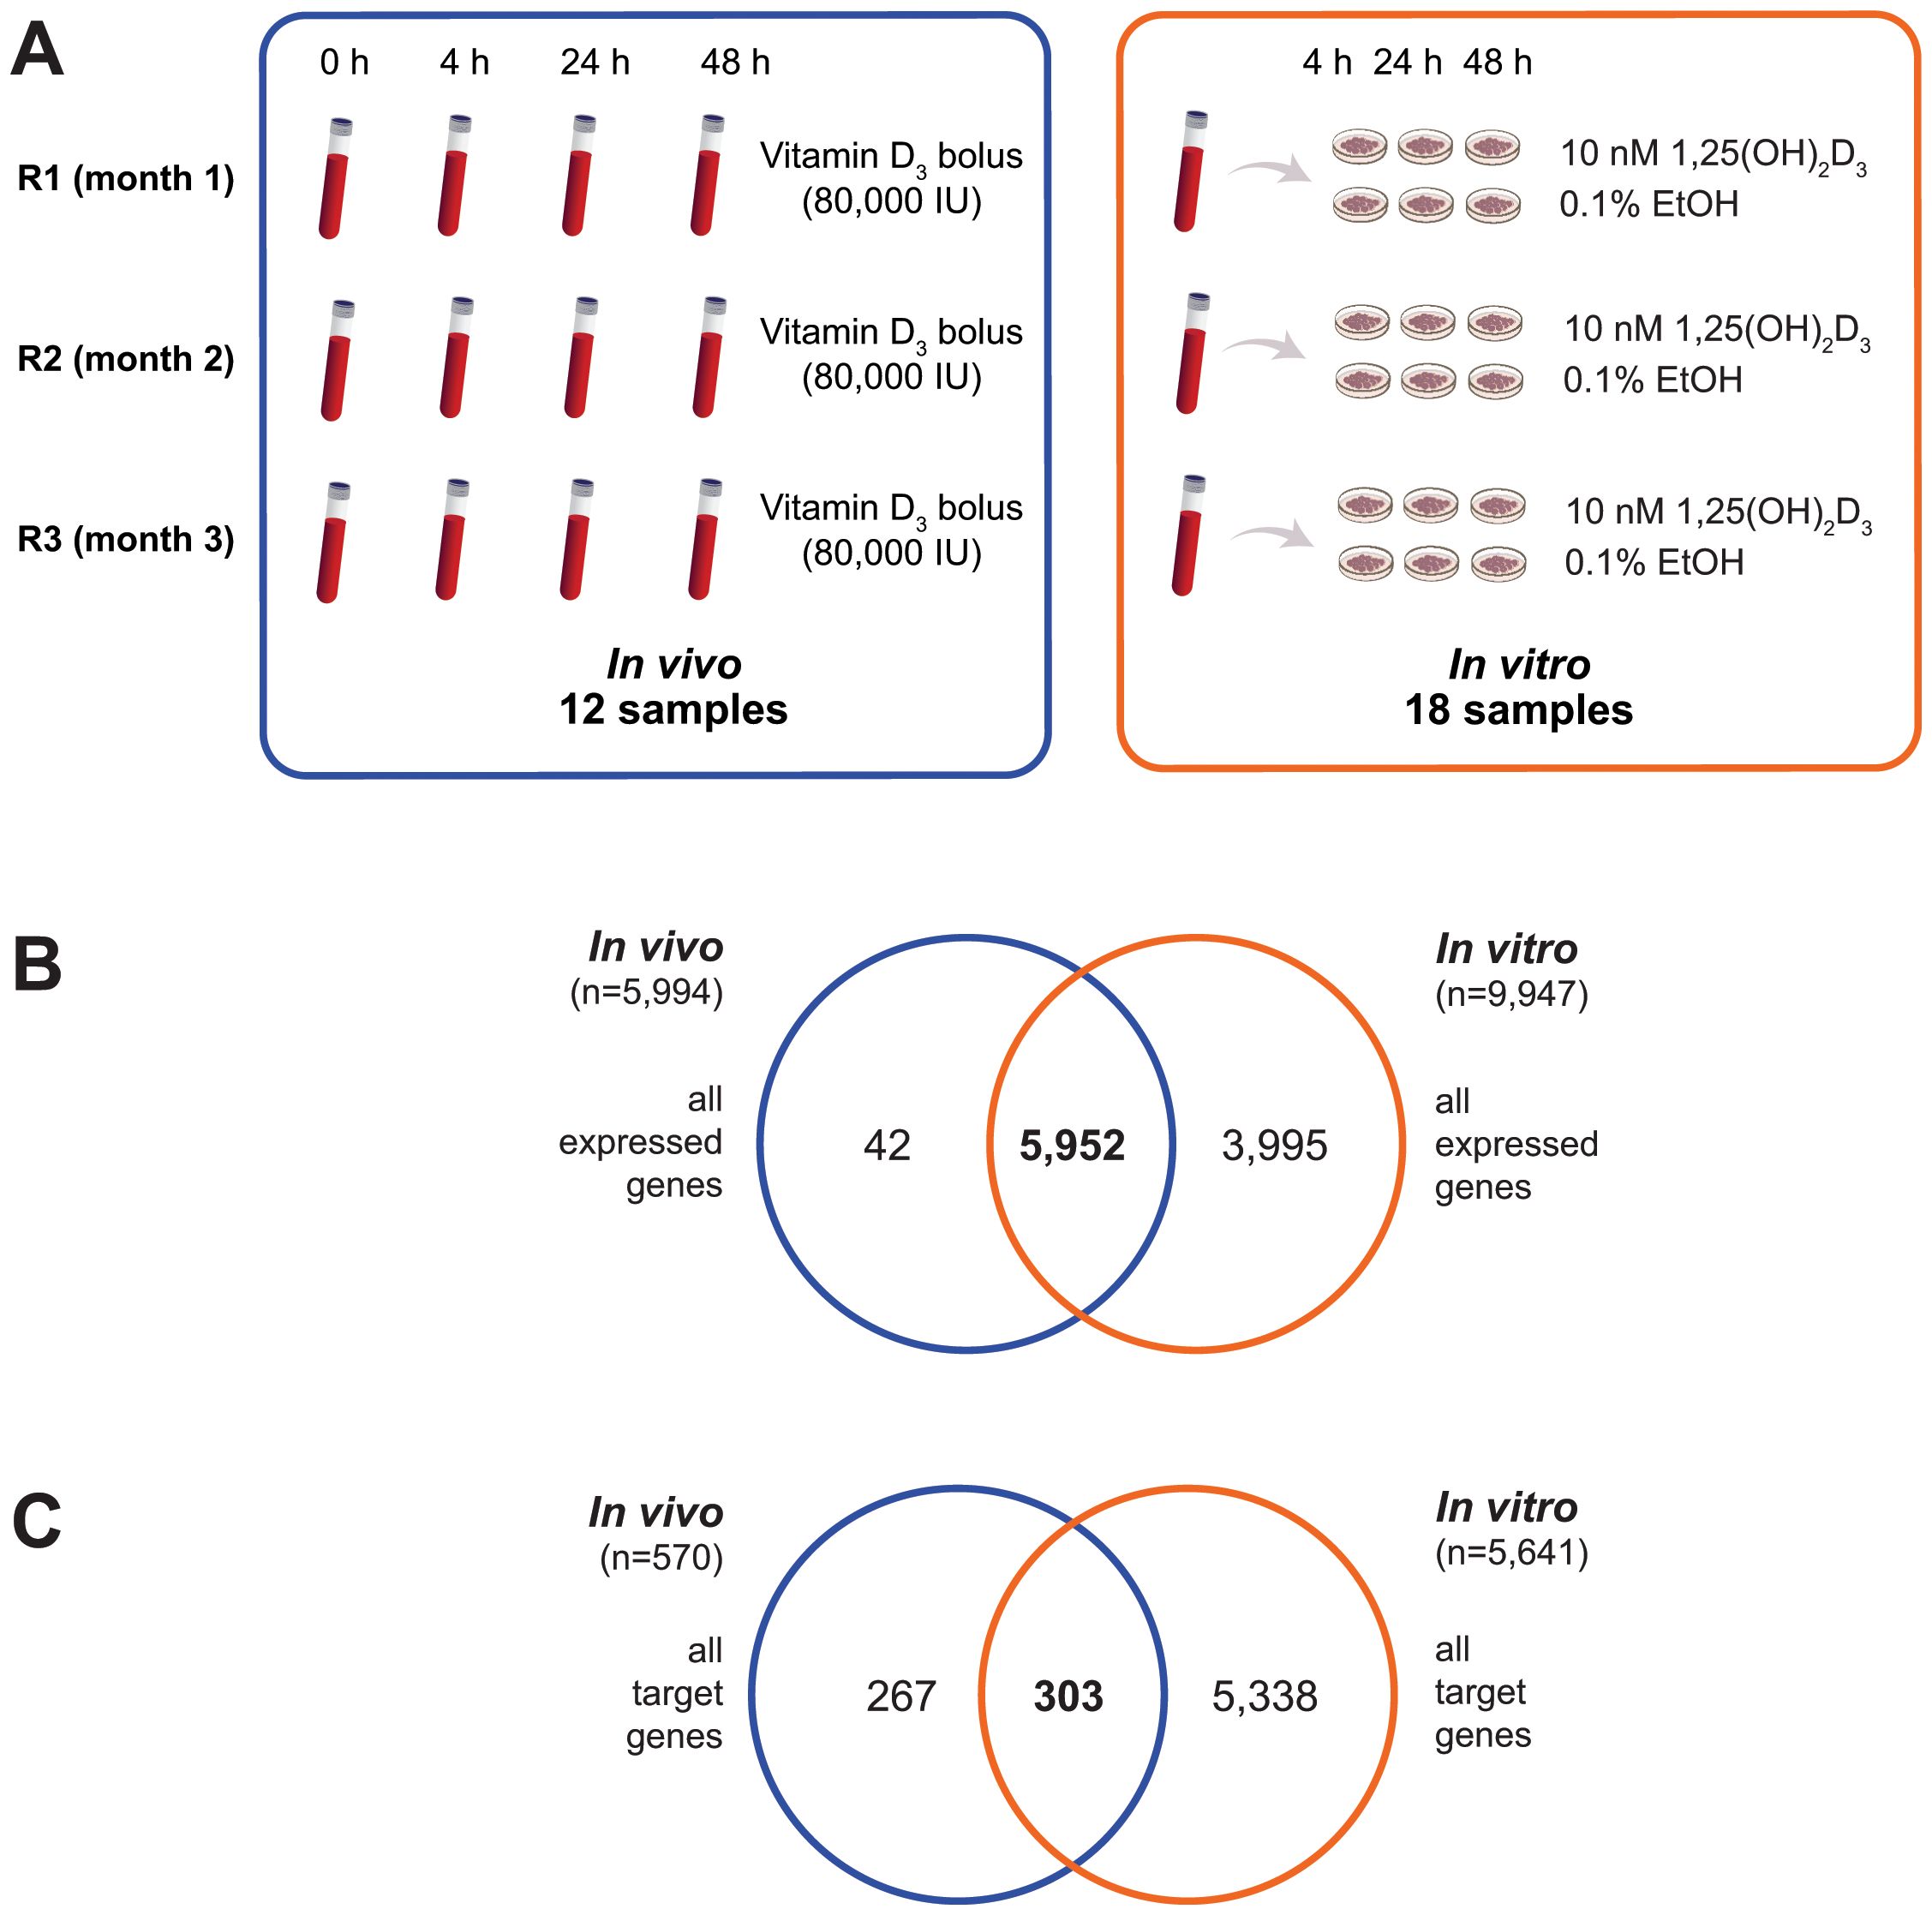
Figure 1. Identification of in vivo and in vitro vitamin D target genes. The experimental design for identifying vitamin D target genes in both in vivo (boxed blue) and in vitro (boxed orange) settings is illustrated (A). Venn diagrams are used to depict the overlap between the expressed genes from the in vivo study and those from the in vitro analysis (B), as well as the overlap between the vitamin D target genes identified in vivo and in vitro (C).

Table 1. Serum values.
RNA-seq analysis revealed that 5,994 protein-coding genes were commonly expressed in the 12 in vivo samples (Supplementary Table S2), while 9,947 genes were detected in the 18 in vitro samples (Supplementary Table S3). Of these, 5,952 genes were shared between both datasets, with 42 genes exclusively expressed in vivo and 3,995 uniquely expressed in vitro (Figure 1B).
Dimensionality reduction using MDS plots highlighted distinct effects of vitamin D. In vivo, the second leading dimension showed a clear separation across all three post-supplementation timepoints when analyzing all expressed genes (Figure 2A). Notably, when focusing on vitamin D target genes, even the first leading dimension reflected the supplementation effect (Figure 2B). In comparison, the in vitro samples demonstrated based on all expressed genes a clear distinction between 1,25(OH)2D3 treatment and solvent control at 24 and 48 hours, but not at 4 hours of stimulation (Figure 2C).
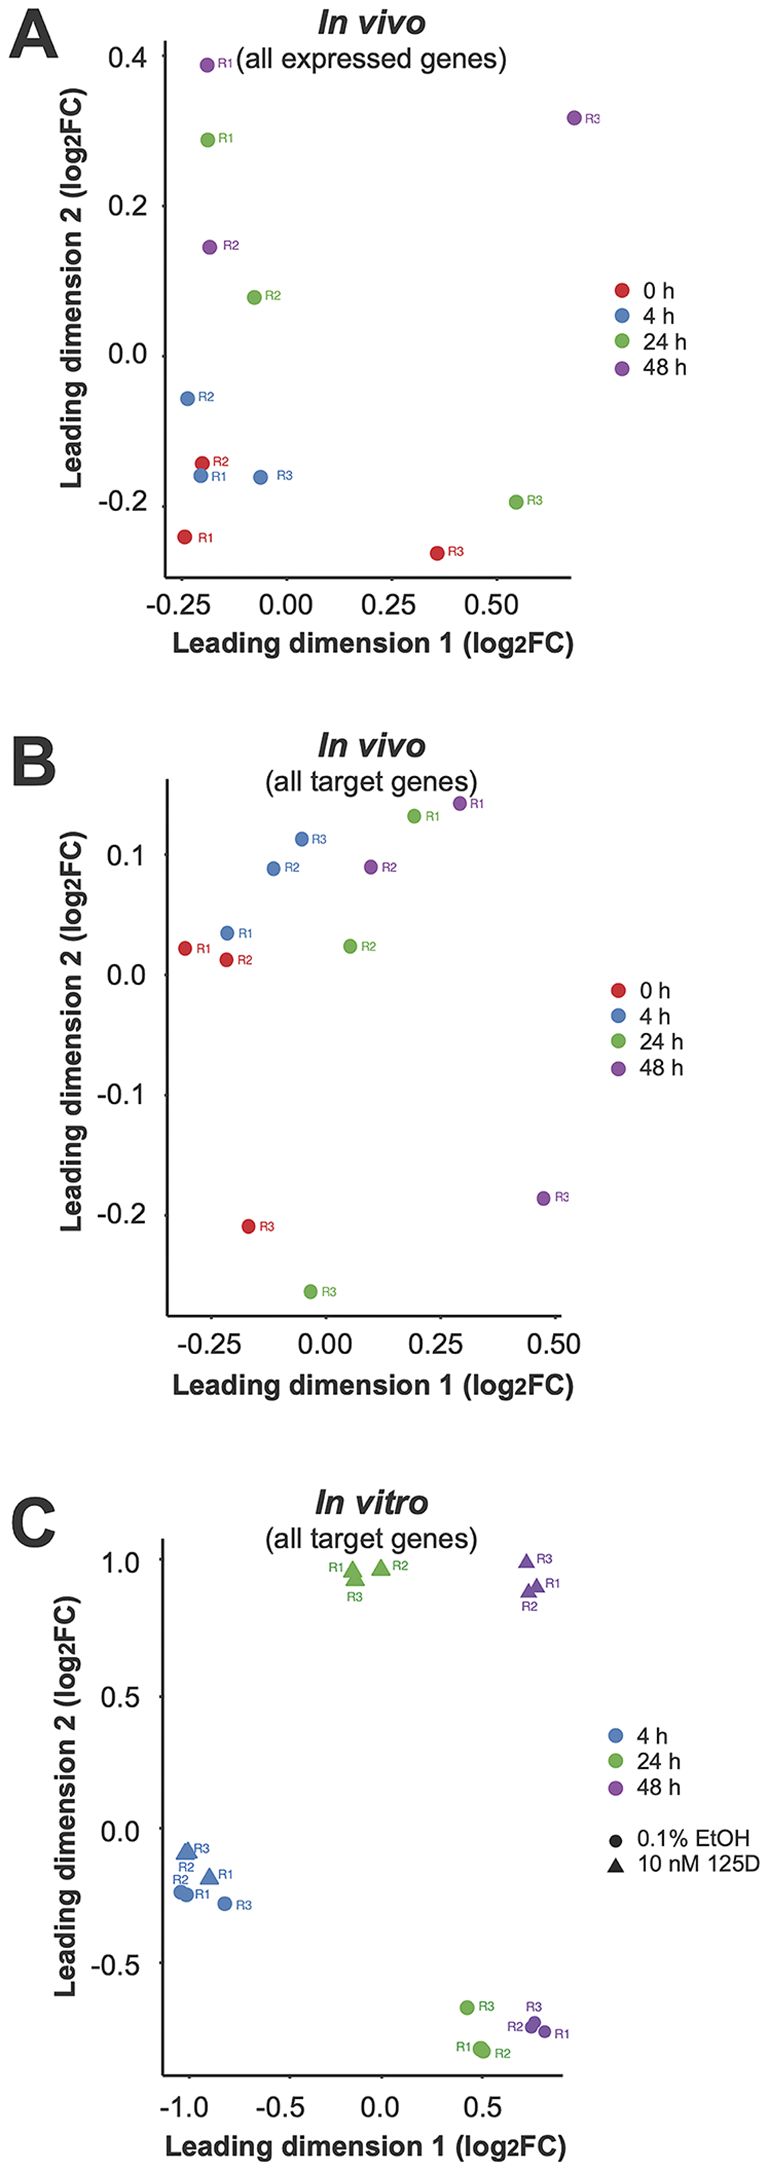
Figure 2. Sample quality assessment via MDS. To assess sample quality, MDS was applied to visualize the similarities among the 12 in vivo samples (A, B) and 18 in vitro samples (C). The MDS plots were generated using two different gene sets: all expressed genes (A, C) and the 570 in vivo target genes (B). These analyses provide insight into the clustering of samples based on overall gene expression patterns and highlight the distinct regulatory effects observed in the identified vitamin D target genes.
Interestingly, differential gene expression analysis identified 570 genes significantly regulated (p < 0.05) by vitamin D3 supplementation across at least one of the three in vivo timepoints compared to baseline (Figure 1C). In contrast, in vitro stimulation with 1,25(OH)2D3 identified a substantial number of 5,641 target genes (p < 0.05), 303 of which overlapped with the in vivo target genes. When applying more stringent criteria, such as FDR < 0.05, the number of in vitro vitamin D target genes was reduced to 945, with 90 genes overlapping between the in vivo and in vitro target lists.
In summary, we present a paired study design that allows the parallel investigation of the transcriptomic response of PBMCs from the same individual to vitamin D under both in vivo and in vitro conditions. Based on p-value significance, 303 protein-coding genes were found to respond significantly to vitamin D within 4–48 hours in both the in vivo and in vitro settings.
3.2 Dynamic response target genes to vitamin D in vivo and in vitro
A detailed analysis of the dynamic response of PBMCs to vitamin D in the in vivo dataset (Supplementary Table S2) compared to the in vitro dataset (Supplementary Table S3) revealed that as early as 4 hours after the start of the experiment, 55 genes were significantly regulated (p < 0.05, absolute log2FC > 0.25) by vitamin D3 supplementation in vivo. In comparison, at this timepoint already 159 genes were regulated by 1,25(OH)2D3 stimulation in vitro (Figure 3A). Notably, the two lists of genes share only six in common: ALCAM (activated leukocyte cell adhesion molecule), FLVCR2 (FLVCR choline and putative heme transporter 2), NINJ1 (ninjurin 1), PPARGC1B (PPARG coactivator 1 beta), SRGN (serglycin), and TXNRD1. Among the 55 early in vivo vitamin D-responsive genes, 34 (61.8%) were upregulated and 21 were downregulated (Figure 4A). Similarly, among the 159 in vitro targets, 103 (64.8%) were upregulated and 56 were downregulated. Analysis using the STRING database (43) revealed that 28 of the proteins encoded by these 55 in vivo genes are known to functionally interact (Figure 5). Among the overlapping genes, TXNRD1 appears to play a central role within this interaction network of genes and proteins.
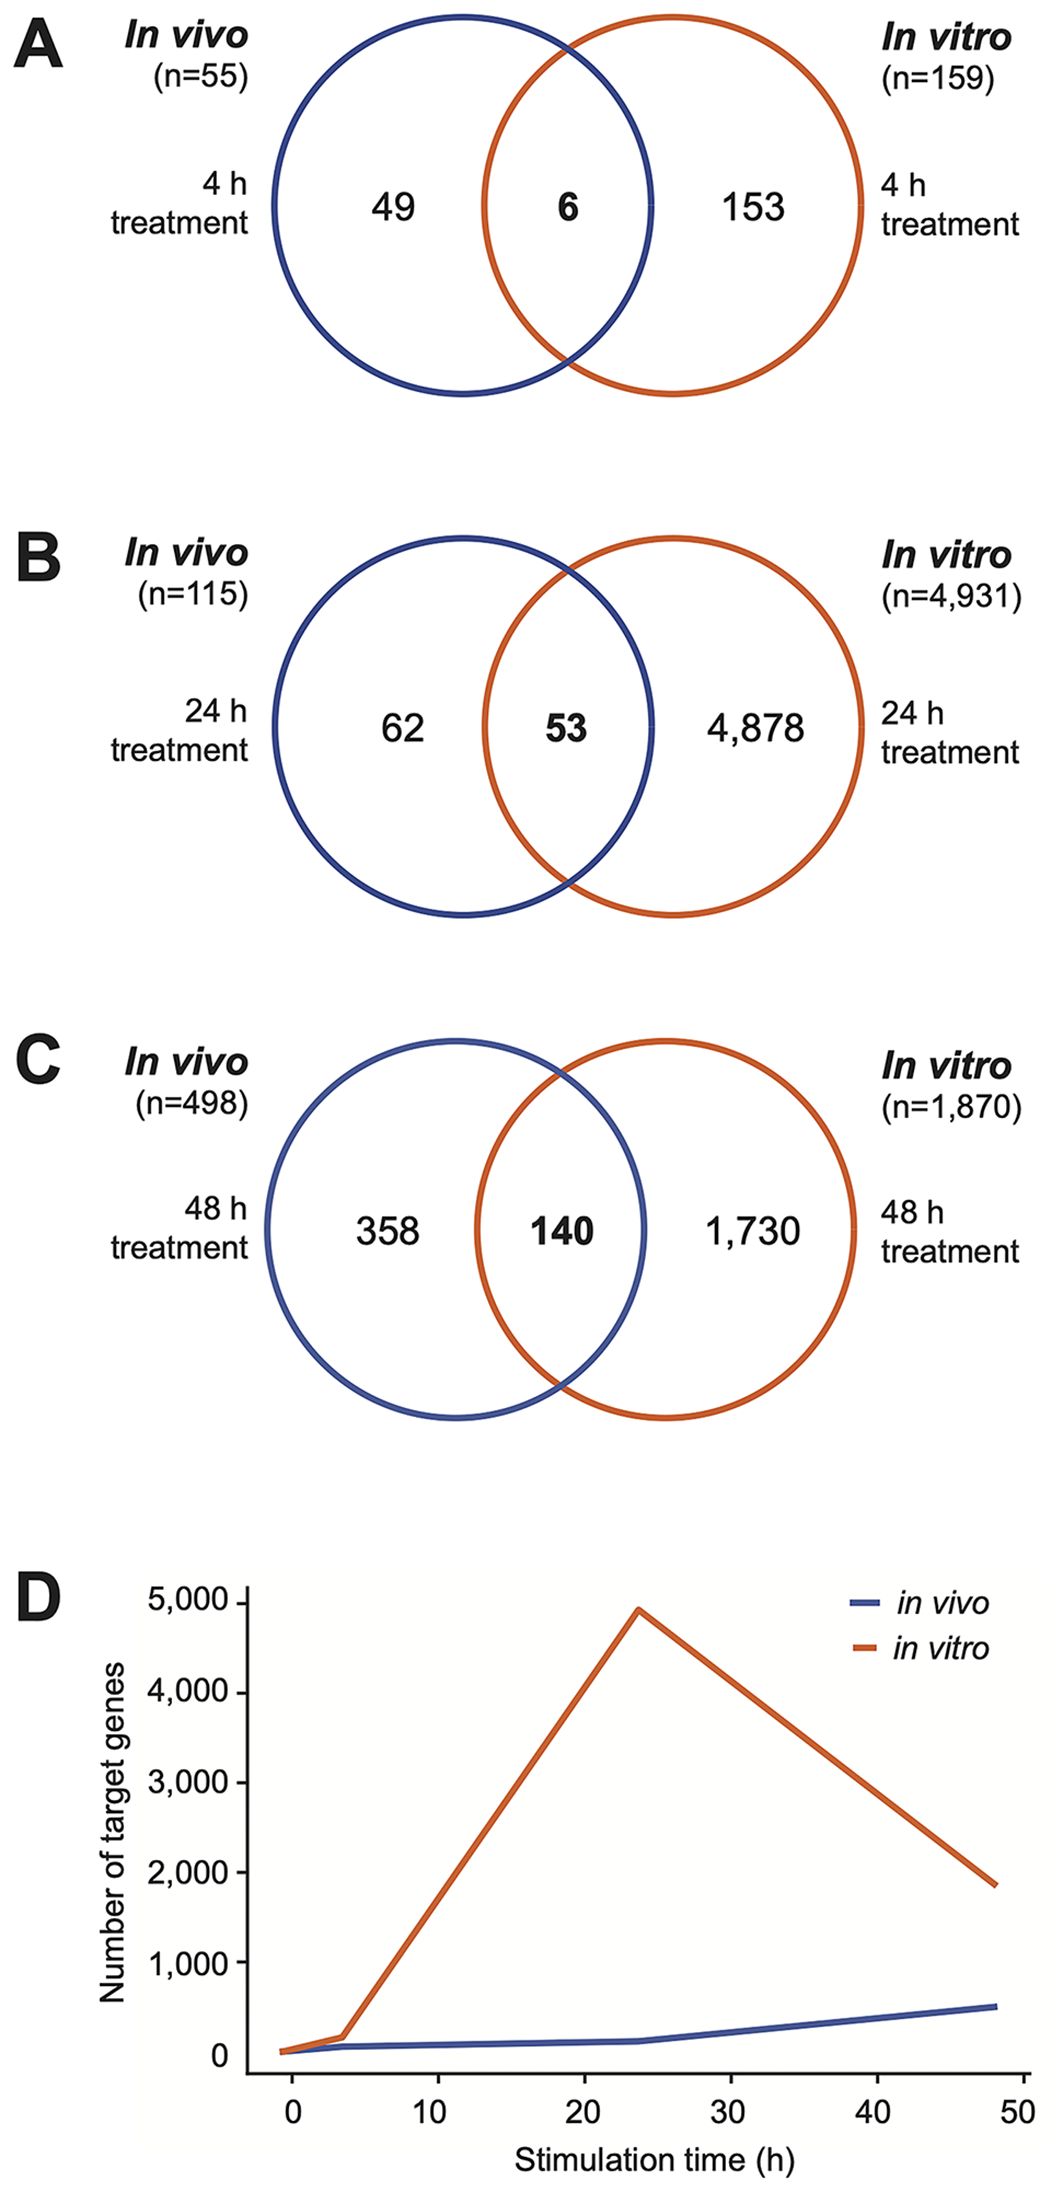
Figure 3. Temporal dynamics of vitamin D target genes. Venn diagrams illustrate the overlap between in vivo (blue) and in vitro (orange) vitamin D target genes at 4 hours (A), 24 hours (B), and 48 hours (C) following the start of the experiments. Additionally, a graph displays the temporal progression in the number of target genes, highlighting the dynamic nature of gene regulation over time in both in vivo and in vitro contexts (D).
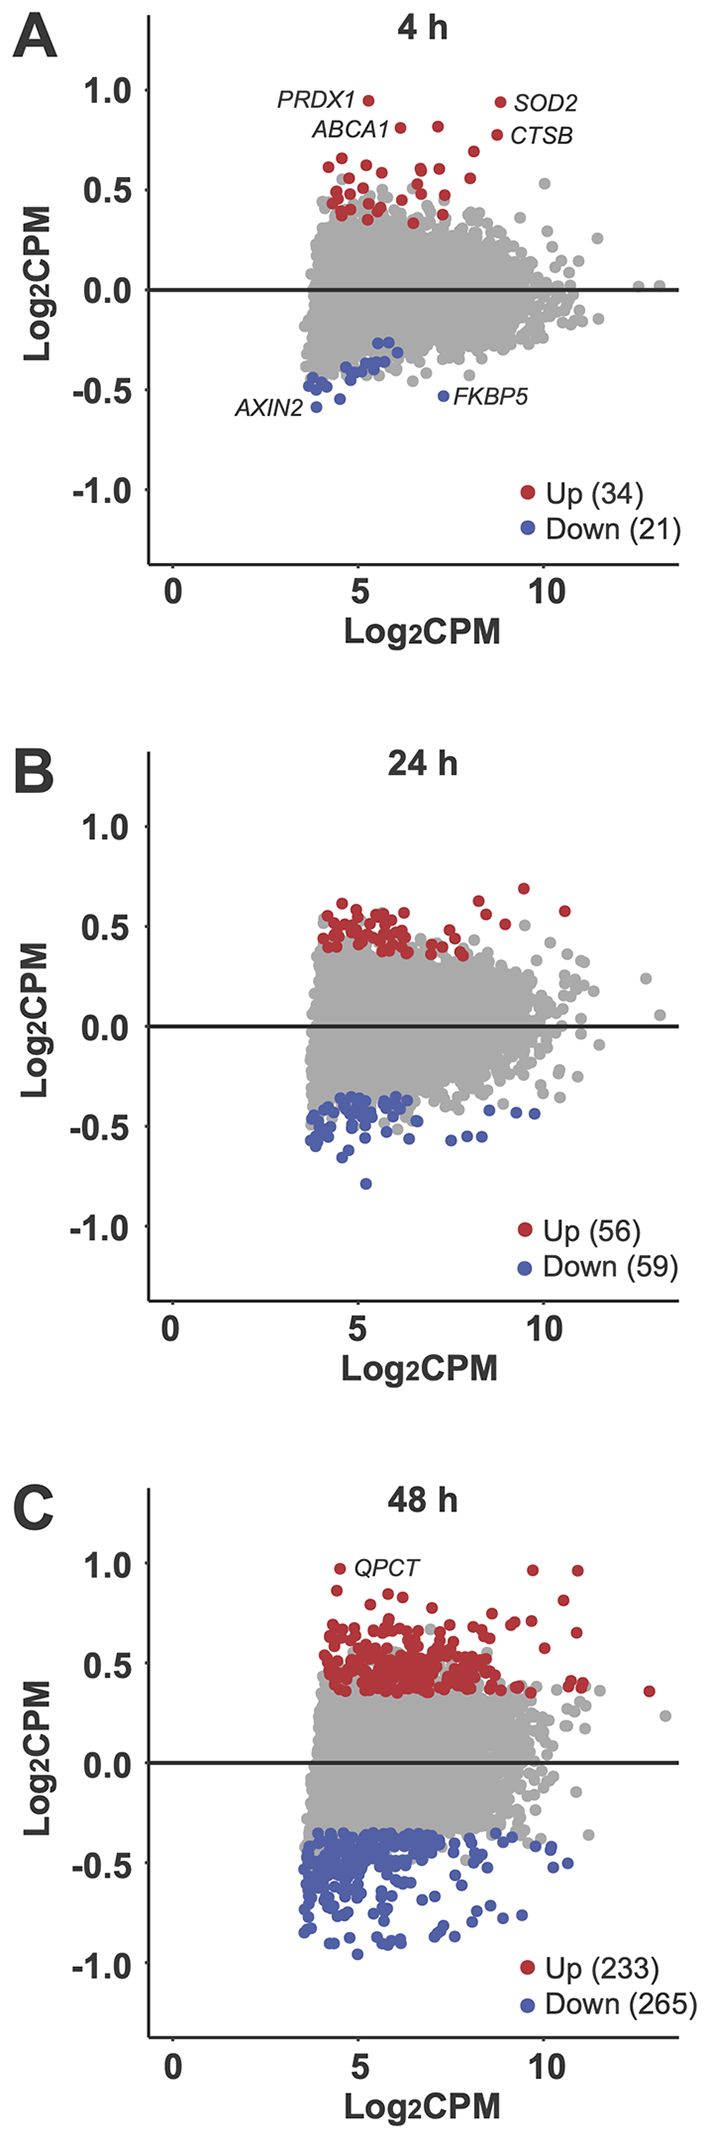
Figure 4. Differential gene expression. MA plots illustrate the impact of vitamin D3 supplementation on all 5,994 commonly expressed genes (CPM > 15) at 4 hours (A), 24 hours (B), and 48 hours (C). Each plot compares the change in expression (log2FC) for each gene with its mean expression level across the compared groups (log2CPM). Genes with significant upregulation (p < 0.05) are highlighted in red, while significantly downregulated genes are shown in blue. Selected genes are labeled for emphasis.
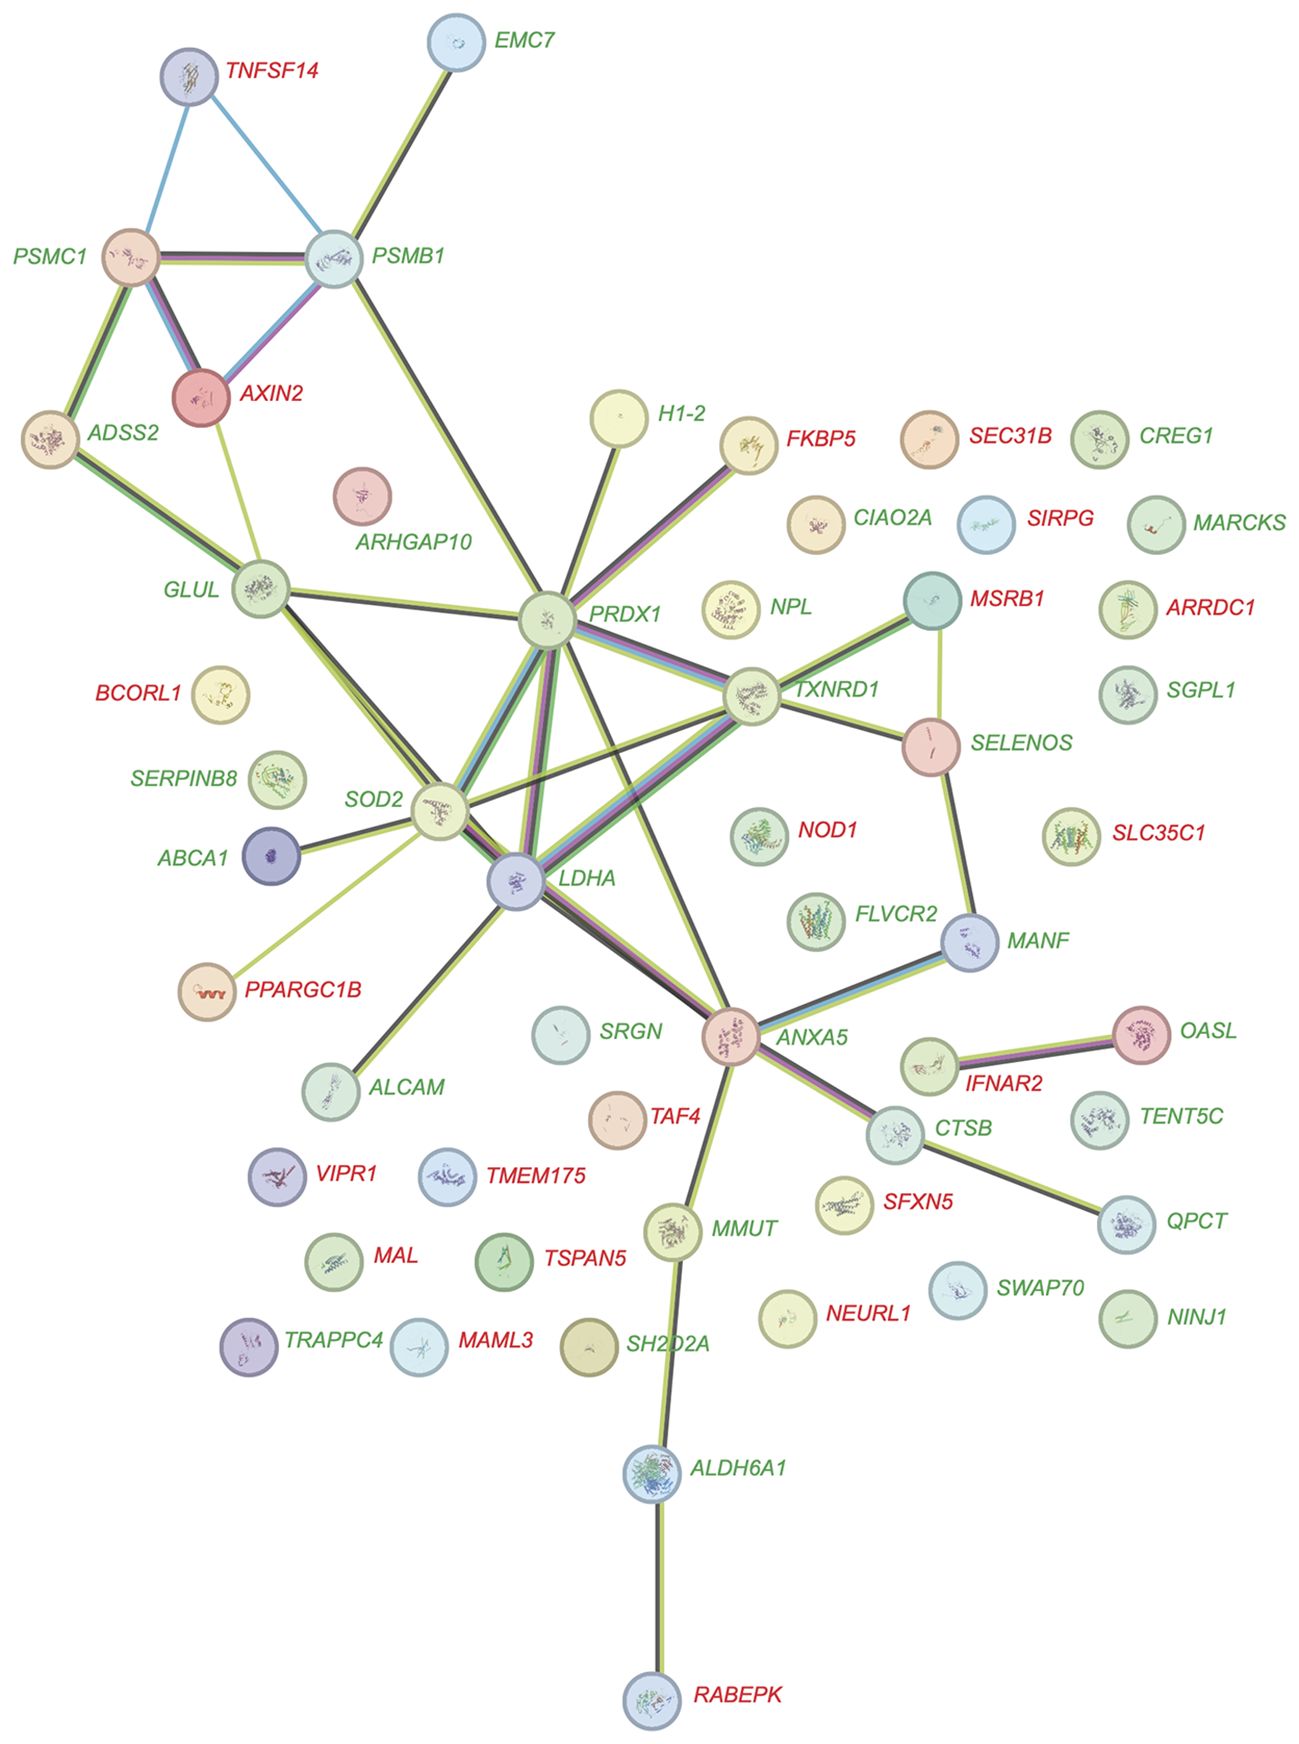
Figure 5. Protein-protein interaction network of in vivo vitamin D target genes. The network diagram depicts the interactions among proteins encoded by 55 in vivo vitamin D target genes, visualized using the STRING database. Of these genes, 34 are upregulated (green) and 21 are downregulated (red). Each node represents a protein, while edges signify functional and physical associations between them. The thickness of the edges indicates the strength of evidence supporting each interaction, offering insights into the interconnected roles and pathways of these target genes.
At 24 hours after vitamin D3 supplementation, 115 genes exhibit significant changes in expression (p < 0.05, absolute log2FC > 0.25), with 56 genes upregulated and 59 downregulated (Figure 5B). In contrast, under the same statistical criteria, 1,25(OH)2D3 regulates the expression of 4,931 genes in vitro (Figure 3B). Notably, only 53 genes overlap between the two datasets. By 48 hours, the number of genes regulated in vivo by vitamin D3 supplementation increases to 498, comprising 233 upregulated and 265 downregulated genes (Figure 4C). Among these, 140 genes overlap with the 1,870 genes regulated by 1,25(OH)2D3 in vitro (Figure 3C).
Taken together, the data indicate a steady increase in the number of in vivo target genes over time, rising from 55 at 4 hours to 498 at 48 hours following vitamin D3 supplementation. In contrast, the in vitro experiments reveal a far greater number of targets, peaking at 24 hours (Figure 3D).
3.3 Functional profile of early in vivo vitamin D target genes
Functional profiling of 55 early in vivo vitamin D target genes using EnrichR (44, 45) identified the “Selenium Micronutrient Network” from WikiPathways (46) as the top-scoring pathway. This result is primarily due to the inclusion of the early vitamin D target genes ABCA1 (ATP-binding cassette transporter 1), MSRB1 (methionine sulfoxide reductase B1), PRDX1, SELENOS (selenoprotein S), SOD2, and TXNRD1. Further analysis with STRING, focusing on genes with an absolute log2FC change greater than 0.5 at 4 hours post-vitamin D3 supplementation, revealed a protein-protein interaction network comprising ABCA1, ANXA5 (annexin A5), CTSB (cathepsin B), FKBP5 (FKBP prolyl isomerase 5), PRDX1, QPCT (glutaminyl-peptide cyclotransferase), SOD2 and TXNRD1 (Figure 6A). This network represents a subset of the more extensive protein interaction network depicted in Figure 5.
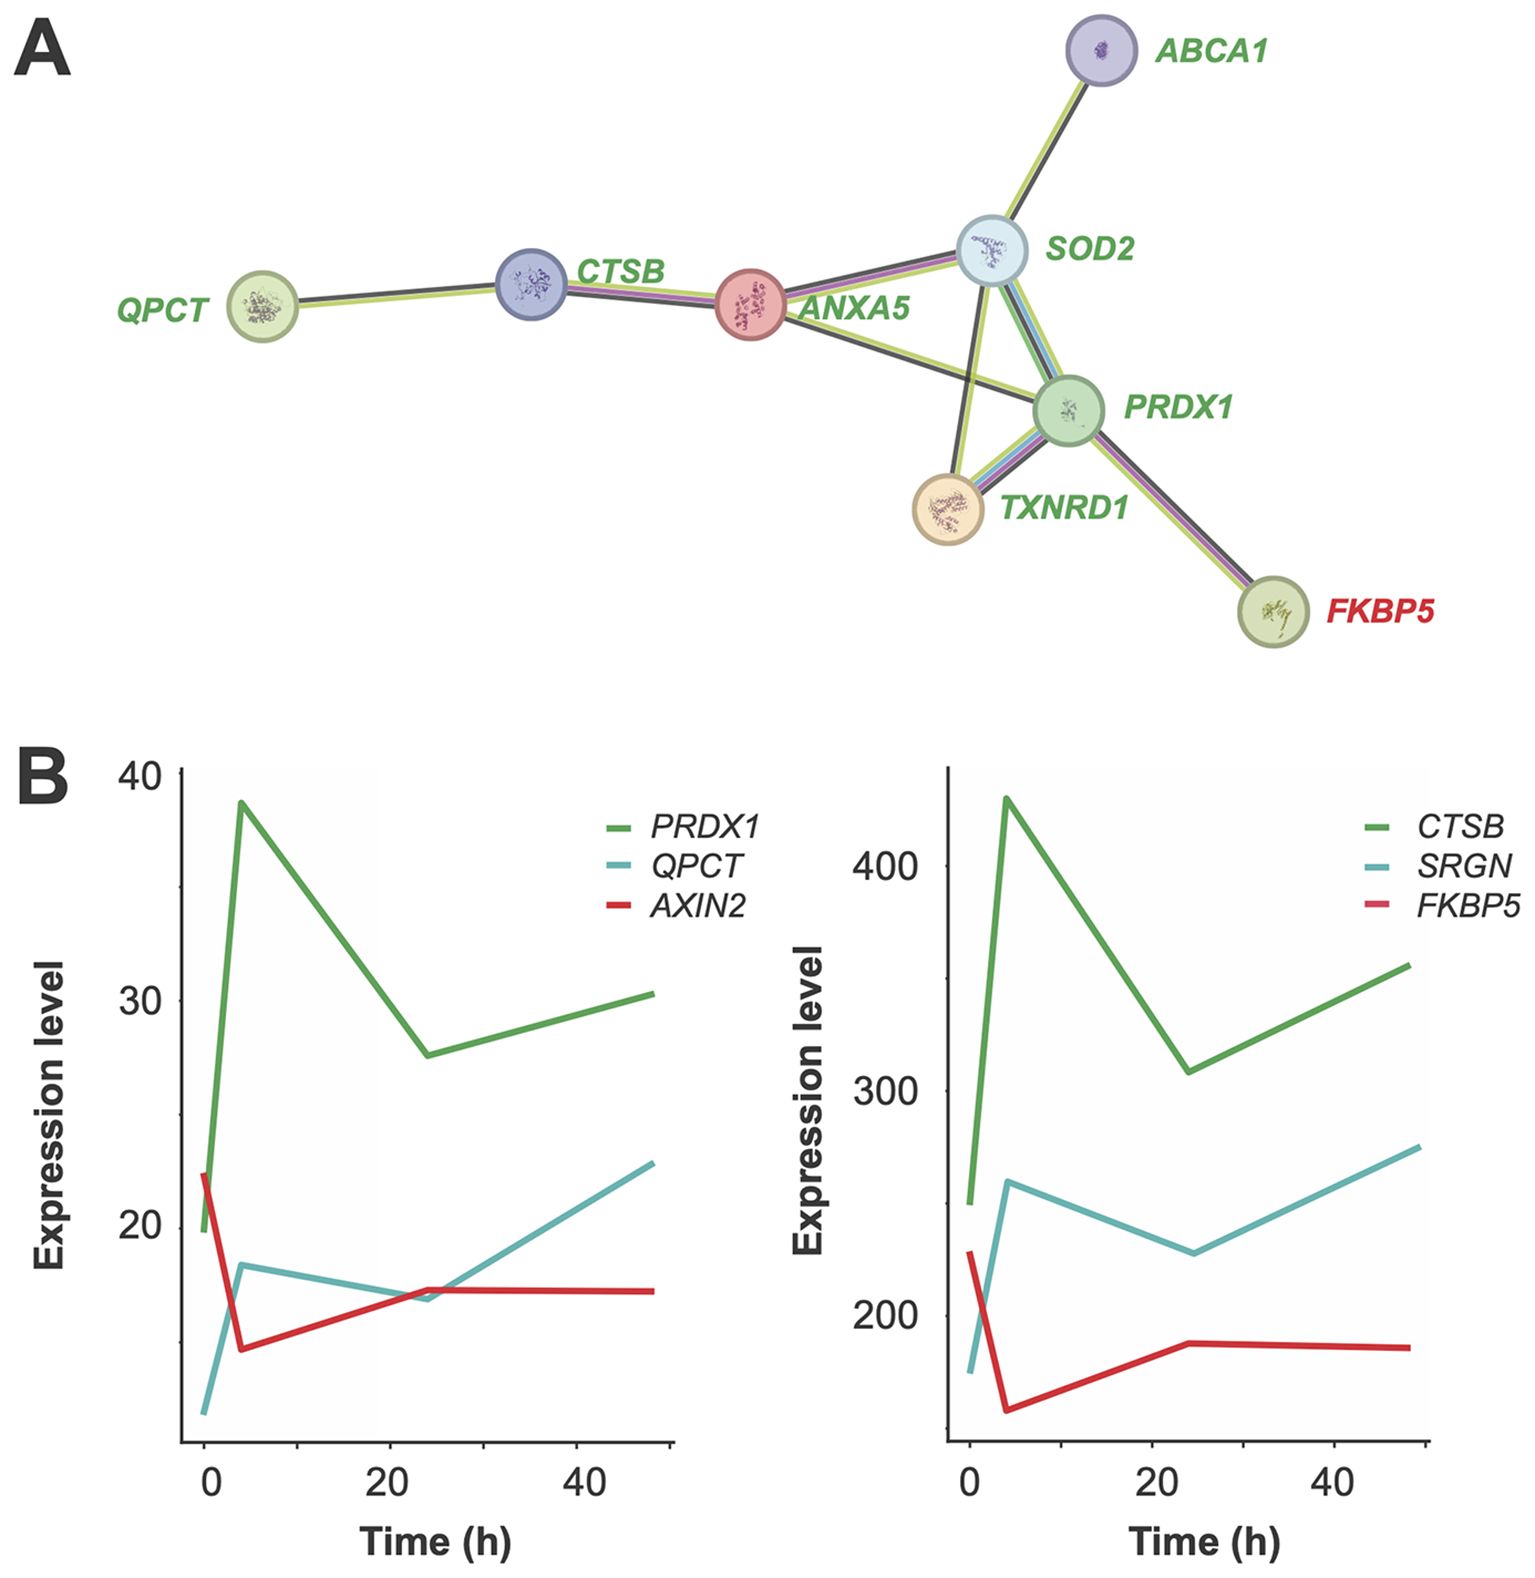
Figure 6. Functional analysis of early in vivo vitamin D target genes. A network diagram illustrates interactions among proteins encoded by eight key early in vivo vitamin D target genes, visualized using the STRING database (A). Seven of these genes are upregulated (green) and one is downregulated (red). Each node represents a protein, and edges indicate functional or physical associations. The thickness of edges reflects the strength of evidence supporting the interactions, providing insights into the interconnected roles and pathways of these target genes. Graphs depict the expression profiles of representative early in vivo vitamin D target genes (B). Genes upregulated with a peak at 4 hours are shown in green, those continuously upregulated in blue, and those downregulated with a peak at 4 hours in red.
The expression profile of 46 out of the 55 early-responding in vivo vitamin D target genes reached maximal up- or downregulation at the 4-hour timepoint (Supplementary Table S2). Examples include the upregulated genes PRDX1 and CTSB, as well as the downregulated genes AXIN2 and FKBP5 (Figure 6B). Additionally, nine genes, such as QPCT and SRGN, exhibit persistent upregulation.
To investigate potential regulatory mechanisms, the genomic regions within ±500 kb of the TSS of these 55 early target genes were screened for experimentally confirmed VDR binding sites located within accessible chromatin. For this analysis, previously published datasets from VDR ChIP-seq (32) and FAIRE-seq (26) experiments in THP-1 cells, treated with either solvent or 10 nM 1,25(OH)2D3 for 2 or 24 hours, were utilized. This screening identified at least one VDR-binding enhancer within accessible chromatin for 51 of the 55 genes at a single time point, and for 33 genes at both time points (Supplementary Table S2). These enhancers were positioned close enough to the TSS to potentially regulate the corresponding genes. Representative examples include the genes PRDX1 (Figure 7A), FKBP5 (Figure 7B), CTSB (Figure 7C), QPCT (Figure 7D), and SRGN (Figure 7E). Only for the genes ABCA1, EMC7 (ER membrane protein complex subunit 7), MAL (mal, T cell differentiation protein), and RABEPK (Rab9 effector protein with kelch motifs) no VDR-binding enhancer has been identified.
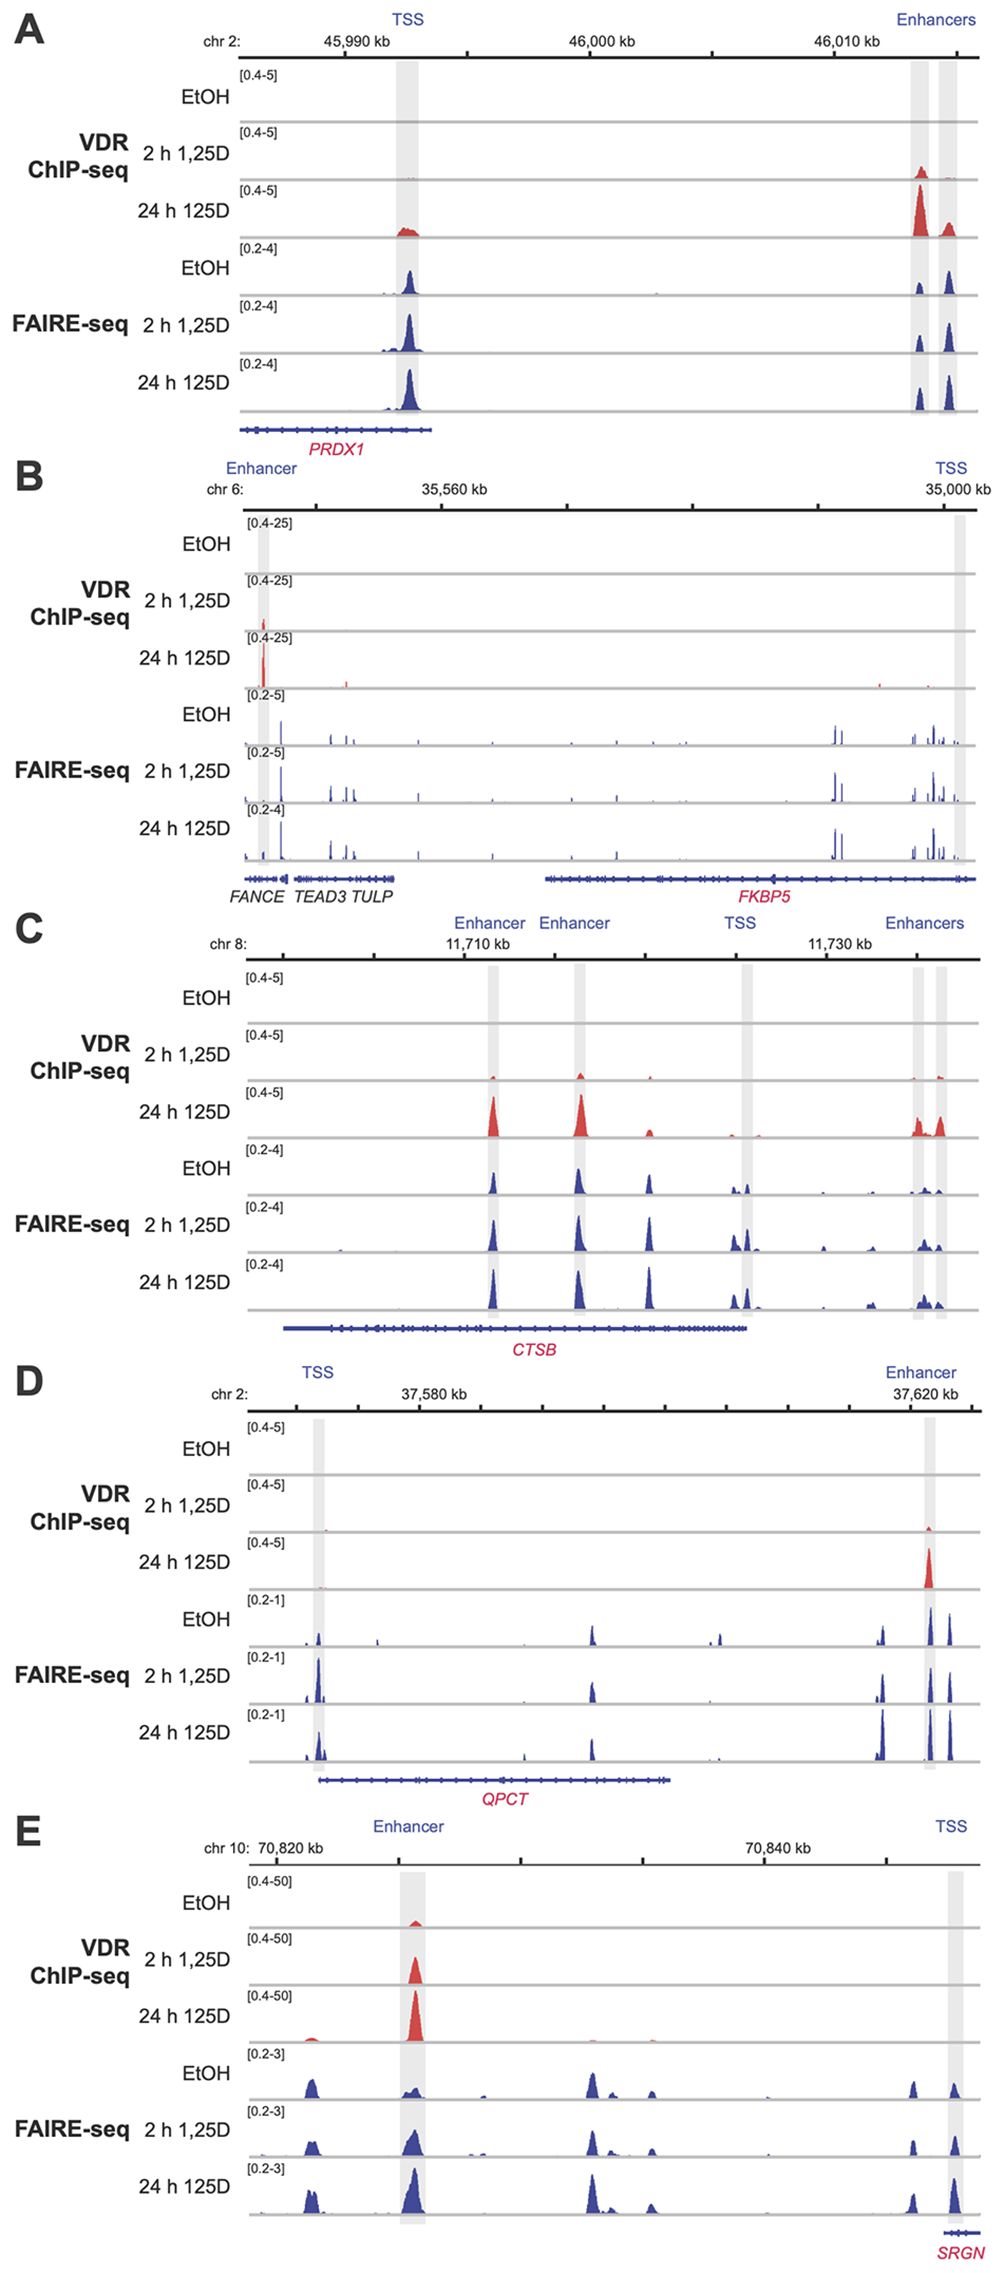
Figure 7. Genomic regions of vitamin D target genes. ChIP-seq results for VDR (red (32)) and FAIRE-seq data (blue (32)) were visualized using the IGV browser, based on experiments conducted in THP-1 cells treated with either solvent (EtOH) or 10 nM 1,25(OH)2D3 (1,25D) for 2 and 24 hours. The peak tracks represent merged data from three biological replicates. Gene structures are shown in blue, while the vitamin D target genes PRDX1 (A), FKBP5 (B), CTSB (C), QPCT (D), and SRGN (E) are highlighted in red. Enhancer and TSS regions are shaded in gray. Although genomic regions spanning 0.5 Mb upstream and downstream of each gene’s TSS were examined, only areas relevant to 1,25(OH)2D3-dependent regulation are displayed.
In summary, six early vitamin D target genes associated with the selenium micronutrient network emerged as key members of the top-scoring pathways. Among these, four genes (ABCA1, PRDX1, SOD2, and TXNRD1) were validated through protein-network analysis. Additionally, for the majority of the 55 early in vivo target genes, VDR binding enhancers within accessible chromatin regions were identified, highlighting their potential regulatory mechanisms.
4 Discussion
This proof-of-principle study explores the temporal transcriptomic changes in human PBMCs from 4 to 48 hours following a single vitamin D3 bolus supplementation. The study design builds on our previous VitDbol (47, 48) and VitDHiD (37, 42) investigations, with key differences: the bolus was administered over three consecutive months, and the first blood samples were collected as early as 4 hours post-supplementation. The triple biological replicate design of this in vivo experiment facilitates robust statistical analysis of gene expression changes at the individual level. This contrasts with the cohort design of the VitDbol and VitDHiD studies, in which each participant received a single vitamin D3 bolus, and statistical analysis was enabled through the inclusion of multiple individuals. Importantly, the inclusion of the 4-hour time point allows for differentiation between primary and secondary vitamin D target genes. Additionally, in vitro stimulation of PBMCs from the same individual with the biologically active form of vitamin D3, 1,25(OH)2D3, serves as a critical reference point, bridging findings from this study to the extensive body of cell culture research that has dominated vitamin D-related gene regulation studies over the past three decades (9, 10, 49, 50).
Across all three timepoints, we identified a total of 570 in vivo vitamin D target genes, of which the majority (53.2%) were also detected through in vitro stimulation with 1,25(OH)2D3 of PBMCs of the same individual. As 1,25(OH)2D3 is a nuclear hormone and classified as a medical compound, direct intervention studies using this vitamin D metabolite in healthy individuals are not allowed. Moreover, it is ethically prohibited to induce severe vitamin D deficiency in humans by prolonged deprivation. Therefore, in vivo vitamin D studies in healthy individuals can only be conducted within the range of vitamin D sufficiency to avoid potential harm to participants. Vitamin D3 is rapidly absorbed in the intestine, as evidenced by an increase in serum levels from 2.6 to 21.0 ng/ml within 4 hours post-supplementation. It is subsequently converted in the liver and kidneys into 25(OH)D3 and 1,25(OH)2D3, respectively (51). This is reflected by a 6.3 ng/ml rise in 25(OH)D3 levels within 24 hours. Notably, in the context of our VitDbol study, we demonstrated that an oral vitamin D3 bolus also significantly elevates serum 1,25(OH)2D3 levels, thereby validating the use of its precursor, vitamin D3, for investigating downstream gene regulatory effects in vivo (47). Basal in vivo serum levels of 1,25(OH)2D3 are approximately 0.1 nM, and a vitamin D3 bolus increases these levels by 20–30% (47). In contrast, in vitro experiments typically involve stimulations with 10 nM 1,25(OH)2D3 compared to a vitamin D-free solvent control (26). Furthermore, in vitro studies are conducted under highly controlled and standardized conditions with minimal external interference, whereas in vivo setups are subject to significant environmental and lifestyle variability. These factors contribute to the observed differences: despite using identical statistical thresholds and restrictions, we identified significantly more vitamin D target genes in vitro across all three timepoints than under in vivo conditions. Moreover, genes commonly used as in vitro markers, are either not expressed like in the case of CAMP (cathelicidin antimicrobial peptide) (52) due to the absence of bacterial infection in the study participant, or not significantly induced, as with CYP24A1 (cytochrome P450 family 24 subfamily A member 1) (10), which may reflect its higher basal expression in vivo and the comparatively modest increase in 1,25(OH)2D3 levels. This discrepancy emphasizes the challenges inherent in translating in vitro findings to the more complex in vivo environment.
Since the 24- and 48-hour time points have already been extensively studied in the context of identifying in vivo vitamin D target genes, our work focuses on early responding genes (42, 47, 48). We identified 55 genes that showed a significant response as early as 4 hours after vitamin D3 supplementation in vivo. Notably, half of these genes encode a protein network, with its core components linked to the micronutrient selenium. EnrichR analysis suggests that SELENOS is among the key target genes that elucidate the functional role of vitamin D in the early hours following supplementation. The SELENOS protein is essential for maintaining endoplasmic reticulum function by promoting the removal of misfolded proteins, thereby playing a critical role in key processes such as inflammation regulation and antioxidative defense (53). Vitamin D has established roles in modulating antioxidant pathways, including those involving glutathione metabolism (54). Our findings suggest that vitamin D enhances SELENOS-mediated processes, offering cellular protection against damage from free radicals. Interestingly, both vitamin D deficiency and SELENOS dysfunction have been linked to chronic conditions such as type 2 diabetes, cardiovascular diseases, and neurodegenerative disorders (55). This overlap highlights the possibility of a collaborative influence of vitamin D and SELENOS on metabolic pathways essential for preventing these diseases.
A primary vitamin D target gene is defined by the presence of an enhancer with a VDR binding site within the same TAD. This criterion is met by 51 of the 55 genes that respond within just 4 hours of vitamin D3 supplementation. In contrast, a secondary vitamin D target gene does not require a VDR-containing enhancer for its regulation. Instead, its transcriptional activity is modulated by transcription factors, cofactors, or chromatin modifiers encoded by primary vitamin D target genes. Notably, among the identified primary in vivo vitamin D target genes, only a few, such as BCORL1 (BCL6 corepressor-like 1), CREG1 (cellular repressor of E1A-stimulated genes 1), MAML3 (mastermind-like transcriptional coactivator 3), PPARGC1A, and TAF4 (TATA-box binding protein-associated factor 4), appear to have the capacity to mediate the secondary effects of vitamin D.
The primary in vivo vitamin D target genes PRDX1, SOD2, and TXNRD1 encode enzymes that play essential roles in the cellular antioxidant defense system, primarily by managing oxidative stress and maintaining redox homeostasis (56). PRDX1 functions as a peroxidase, reducing hydrogen peroxide and organic hydroperoxides to water and alcohol, respectively. This activity mitigates oxidative damage and protects cellular components from reactive oxygen species (57). SOD2 catalyzes the dismutation of superoxide radicals into hydrogen peroxide and oxygen, serving as a critical defense against oxidative damage caused by superoxide radicals generated during mitochondrial respiration. TXNRD1 is responsible for regenerating the reduced form of thioredoxin, which subsequently reduces disulfide bonds and scavenges reactive oxygen species, thus contributing to cellular redox balance. By upregulating the genes PRDX1, SOD2, and TXNRD1, vitamin D enhances the cell’s ability to combat oxidative stress, reinforcing a robust antioxidant defense system critical for cellular integrity and function.
The present conclusion that vitamin D modulates the redox response of immune cells aligns with a growing body of evidence linking vitamin D to cellular defense mechanisms against various forms of stress and intoxication, including damage from prolonged UV exposure. For instance, vitamin D3 and its hydroxy-derivatives produced via the CYP11A1 pathway have demonstrated significant protective effects against UVB-induced cellular injury, primarily through activation of the redox-sensitive transcription factor NFE2L2 (NFE2 like BZIP transcription factor 2, also known as NRF2) (58). NFE2L2 plays a central role in orchestrating the antioxidant defense system by regulating the expression of key detoxifying and antioxidant enzymes such as glutathione reductase, heme oxygenase 1, catalase, and SODs. While these protective mechanisms have been well-documented in human keratinocytes, their relevance to immune cells, particularly PBMCs, remains to be validated. Notably, in the time frame analyzed in this study (0–48 hours), vitamin D3 supplementation did not result in significant changes in NFE2L2 expression in immune cells. Based on a meta-analysis of transcriptomic datasets, a core set of 14 target genes of NFE2L2 has been identified (59), but none of them overlap with the 570 high-confidence in vivo vitamin D target genes reported in this study. In contrast, 10 of the 14 genes are found among the 5,461 in vitro targets of 1,25(OH)2D3. Nevertheless, a hypergeometric test revealed that this overlap is not statistically significant (p = 0.201). While the potential crosstalk between vitamin D and NFE2L2 signaling remains an interesting hypothesis, our findings do not provide statistically significant evidence to support a functional connection.
Based on a meta-analysis of transcriptome datasets of NFE2L2 targets a core list of 14 genes have been identified (59). However, none of these 14 belongs to the 570 in vivo vitamin D target. In contrast, 10 of the genes are contain in the list of 5,461 in vitro targets of 1,25(OH)2D3. However, a hypergeometric test indicates that this finding is not significant (p=0.201). Although this topic should be further explored, our study does not provide any significant evidence for a functional inferences between the signaling of vitamin D and NFE2L2.
This study has several limitations. First, this proof-of-principle trial was conducted with a single individual and should therefore be considered a case study, from which only limited conclusions can be drawn for the general population. Consequently, the findings need to be validated in a larger cohort. Second, in order to investigate the effects of vitamin D on PBMCs under human in vivo conditions, we limited the handling of PBMCs and avoided additional in vitro stressors, such as monocyte isolation or single-cell isolation methods (60). Third, the study focuses on the transcriptome, which serves only as a partial proxy for protein levels (61), limits the interpretation of functional outcomes. Therefore, the findings and their functional implications require validation through proteome-wide data and functional assays. Finally, a denser sampling schedule at earlier time points would provide a more precise distinction between primary and secondary targets.
In conclusion, this study uniquely identifies a set of 55 early in vivo vitamin D target genes in human PBMCs, with 51 of them confirmed as primary targets through the presence of VDR-binding enhancers. Notable members of this gene set include SELENOS, PRDX1, SOD2, and TXNRD1, which encode proteins central to antioxidant defense. These findings establish a connection to detoxification, one of the most ancient evolutionary functions of vitamin D (5, 62) having a central role in modulating innate immunity.
Data availability statement
The datasets presented in this study can be found in online repositories. The names of the repository/repositories and accession number(s) can be found in the article/Supplementary Material.
Ethics statement
The studies involving humans were approved by Ethics Committee of the Northern Savo Hospital District (Approval #515/2018). The studies were conducted in accordance with the local legislation and institutional requirements. The participants provided their written informed consent to participate in this study.
Author contributions
TT: Data curation, Formal analysis, Visualization, Writing – review & editing, Investigation, Methodology. CC: Conceptualization, Funding acquisition, Investigation, Methodology, Supervision, Visualization, Writing – original draft, Writing – review & editing.
Funding
The author(s) declare that financial support was received for the research and/or publication of this article. This publication is part of a project that has received funding from the European Union’s Horizon2020 research and innovation program under grant agreement no. 952601, from the David and Amy Fulton Foundation, Seattle, US and from the National Science Centre (Poland), project number 2023/49/B/NZ9/00402.
Acknowledgments
Kind thanks to the Gene Core Facility at the EMBL in Heidelberg, Germany, for massively parallel sequencing services and the Centre of Informatics Tricity Academic Supercomputer and Network of the Technical University of Gdansk (https://task.gda.pl/en) for the use of their the supercomputers for sequence alignment.
Conflict of interest
The authors declare that the research was conducted in the absence of any commercial or financial relationships that could be construed as a potential conflict of interest.
The author(s) declared that they were an editorial board member of Frontiers, at the time of submission. This had no impact on the peer review process and the final decision.
Generative AI statement
The author(s) declare that no Generative AI was used in the creation of this manuscript.
Publisher’s note
All claims expressed in this article are solely those of the authors and do not necessarily represent those of their affiliated organizations, or those of the publisher, the editors and the reviewers. Any product that may be evaluated in this article, or claim that may be made by its manufacturer, is not guaranteed or endorsed by the publisher.
Supplementary material
The Supplementary Material for this article can be found online at: https://www.frontiersin.org/articles/10.3389/fimmu.2025.1559486/full#supplementary-material
References
2. Holick MF, MacLaughlin JA, and Doppelt SH. Regulation of cutaneous previtamin D3 photosynthesis in man: skin pigment is not an essential regulator. Science. (1981) 211:590–3. doi: 10.1126/science.6256855
3. Bendik I, Friedel A, Roos FF, Weber P, and Eggersdorfer M. Vitamin D: a critical and essential micronutrient for human health. Front Physiol. (2014) 5:248. doi: 10.3389/fphys.2014.00248
4. Chirumbolo S, Bjorklund G, Sboarina A, and Vella A. The role of vitamin D in the immune system as a pro-survival molecule. Clin Ther. (2017) 39:894–916. doi: 10.1016/j.clinthera.2017.03.021
5. Carlberg C. Vitamin D in the context of evolution. Nutrients. (2022) 14:3018. doi: 10.3390/nu14153018
6. van de Peppel J, van Leeuwen JP, and Vitamin D. and gene networks in human osteoblasts. Front Physiol. (2014) 5:137. doi: 10.3389/fphys.2014.00137
7. Baeke F, Takiishi T, Korf H, Gysemans C, Mathieu C, and Vitamin D. modulator of the immune system. Curr Opin Pharmacol. (2010) 10:482–96. doi: 10.1016/j.coph.2010.04.001
8. Martens PJ, Gysemans C, Verstuyf A, and Mathieu AC. Vitamin D's effect on immune function. Nutrients. (2020) 12:1248. doi: 10.3390/nu12051248
9. Verway M, Bouttier M, Wang TT, Carrier M, Calderon M, An BS, et al. Vitamin D induces interleukin-1beta expression: paracrine macrophage epithelial signaling controls M. tuberculosis infection. PloS Pathog. (2013) 9:e1003407. doi: 10.1371/journal.ppat.1003407
10. Dimitrov V, Barbier C, Ismailova A, Wang Y, Dmowski K, Salehi-Tabar R, et al. Vitamin D-regulated gene expression profiles: species-specificity and cell-specific effects on metabolism and immunity. Endocrinology. (2021) 162:bqaa218. doi: 10.1210/endocr/bqaa218
11. Bishop E, Ismailova A, Dimeloe SK, Hewison M, White JH, and Vitamin D. and immune regulation: antibacterial, antiviral, anti-inflammatory. JBMR Plus. (2021) 5:e10405. doi: 10.1002/jbm4.10405
12. Harrison SR, Li D, Jeffery LE, Raza K, Hewison M, and Vitamin D. autoimmune disease and rheumatoid arthritis. Calcif Tissue Int. (2020) 106:58–75. doi: 10.1007/s00223-019-00577-2
13. Sita-Lumsden A, Lapthorn G, Swaminathan R, and Milburn HJ. Reactivation of tuberculosis and vitamin D deficiency: the contribution of diet and exposure to sunlight. Thorax. (2007) 62:1003–7. doi: 10.1136/thx.2006.070060
14. Bilezikian JP, Bikle D, Hewison M, Lazaretti-Castro M, Formenti AM, Gupta A, et al. and COVID-19. Eur J Endocrinol. (2020) 183:R133–47. doi: 10.1530/EJE-20-0665
15. Munger KL, Levin LI, Hollis BW, Howard NS, and Ascherio A. Serum 25-hydroxyvitamin D levels and risk of multiple sclerosis. Jama. (2006) 296:2832–8. doi: 10.1001/jama.296.23.2832
16. Sintzel MB, Rametta M, Reder AT, and Vitamin D. and multiple sclerosis: a comprehensive review. Neurol Ther. (2018) 7:59–85. doi: 10.1007/s40120-017-0086-4
17. Weir EK, Thenappan T, Bhargava M, and Chen Y. Does vitamin D deficiency increase the severity of COVID-19? Clin Med (Lond). (2020) 20:e107–8. doi: 10.7861/clinmed.2020-0301
19. Haussler MR, Haussler CA, Bartik L, Whitfield GK, Hsieh JC, Slater S, et al. Vitamin D receptor: molecular signaling and actions of nutritional ligands in disease prevention. Nutr Rev. (2008) 66:S98–112. doi: 10.1111/j.1753-4887.2008.00093.x
20. Whitfield GK, Dang HT, Schluter SF, Bernstein RM, Bunag T, Manzon LA, et al. Cloning of a functional vitamin D receptor from the lamprey (Petromyzon marinus), an ancient vertebrate lacking a calcified skeleton and teeth. Endocrinology. (2003) 144:2704–16. doi: 10.1210/en.2002-221101
21. Carlberg C. Genome-wide (over)view on the actions of vitamin D. Front Physiol. (2014) 5:167. doi: 10.3389/fphys.2014.00167
22. Evans RM. The nuclear receptor superfamily: a rosetta stone for physiology. Mol Endocrinol. (2005) 19:1429–38. doi: 10.1210/me.2005-0046
23. Campbell MJ. Vitamin D and the RNA transcriptome: more than mRNA regulation. Front Physiol. (2014) 5:181. doi: 10.3389/fphys.2014.00181
24. Carlberg C. Vitamin D genomics: from in vitro to in vivo. Front Endocrinol. (2018) 9:250. doi: 10.3389/fendo.2018.00250
25. Heikkinen S, Väisänen S, Pehkonen P, Seuter S, Benes V, and Carlberg C. Nuclear hormone 1α,25-dihydroxyvitamin D3 elicits a genome-wide shift in the locations of VDR chromatin occupancy. Nucleic Acids Res. (2011) 39:9181–93. doi: 10.1093/nar/gkr654
26. Seuter S, Neme A, and Carlberg C. Epigenome-wide effects of vitamin D and their impact on the transcriptome of human monocytes involve CTCF. Nucleic Acids Res. (2016) 44:4090–104. doi: 10.1093/nar/gkv1519
27. Nurminen V, Neme A, Seuter S, and Carlberg C. Modulation of vitamin D signaling by the pioneer factor CEBPA. Biochim Biophys Acta. (2019) 1862:96–106. doi: 10.1016/j.bbagrm.2018.12.004
28. Carlberg C. Vitamin D signaling in the context of innate immunity: focus on human monocytes. Front Immunol. (2019) 10:2211. doi: 10.3389/fimmu.2019.02211
29. Neme A, Seuter S, Malinen M, Nurmi T, Tuomainen TP, Virtanen JK, et al. In vivo transcriptome changes of human white blood cells in response to vitamin D. J Steroid Biochem Mol Biol. (2019) 188:71–6. doi: 10.1016/j.jsbmb.2018.11.019
30. Carlberg C. Molecular approaches for optimizing vitamin D supplementation. Vitamins hormones. (2016) 100:255–71. doi: 10.1016/bs.vh.2015.10.001
31. Tuoresmäki P, Väisänen S, Neme A, Heikkinen S, and Carlberg C. Patterns of genome-wide VDR locations. PloS One. (2014) 9:e96105. doi: 10.1371/journal.pone.0096105
32. Neme A, Seuter S, and Carlberg C. Selective regulation of biological processes by vitamin D based on the spatio-temporal cistrome of its receptor. Biochim Biophys Acta. (2017) 1860:952–61. doi: 10.1016/j.bbagrm.2017.07.002
33. Carlberg C. Molecular endocrinology of vitamin D on the epigenome level. Mol Cell Endocrinol. (2017) 453:14–21. doi: 10.1016/j.mce.2017.03.016
34. Carlberg C and Neme A. Machine learning approaches infer vitamin D signaling: critical impact of vitamin D receptor binding within topologically associated domains. J Steroid Biochem Mol Biol. (2019) 185:103–9. doi: 10.1016/j.jsbmb.2018.07.015
35. Nurminen V, Seuter S, and Carlberg C. Primary vitamin D target genes of human monocytes. Front Physiol. (2019) 10:194. doi: 10.3389/fphys.2019.00194
36. Hanel A and Carlberg C. Time-resolved gene expression analysis monitors the regulation of inflammatory mediators and attenuation of adaptive immune response by vitamin D. Int J Mol Sci. (2022) 23:911. doi: 10.3390/ijms23020911
37. Hanel A, Neme A, Malinen M, Hamalainen E, Malmberg HR, Etheve S, et al. Common and personal target genes of the micronutrient vitamin D in primary immune cells from human peripheral blood. Sci Rep. (2020) 10:21051. doi: 10.1038/s41598-020-78288-0
38. Dobin A, Davis CA, Schlesinger F, Drenkow J, Zaleski C, Jha S, et al. STAR: ultrafast universal RNA-seq aligner. Bioinformatics. (2013) 29:15–21. doi: 10.1093/bioinformatics/bts635
39. Liao Y, Smyth GK, and Shi W. featureCounts: an efficient general purpose program for assigning sequence reads to genomic features. Bioinformatics. (2014) 30:923–30. doi: 10.1093/bioinformatics/btt656
40. Durinck S, Spellman PT, Birney E, and Huber W. Mapping identifiers for the integration of genomic datasets with the R/Bioconductor package biomaRt. Nat Protoc. (2009) 4:1184–91. doi: 10.1038/nprot.2009.97
41. Thorvaldsdottir H, Robinson JT, and Mesirov JP. Integrative Genomics Viewer (IGV): high-performance genomics data visualization and exploration. Briefings Bioinf. (2013) 14:178–92. doi: 10.1093/bib/bbs017
42. Ghosh Dastidar R, Jaroslawska J, Malinen M, Tuomainen TP, Virtanen JK, Bendik I, et al. In vivo vitamin D targets reveal the upregulation of focal adhesion-related genes in primary immune cells of healthy individuals. Sci Rep. (2024) 14:17552. doi: 10.1038/s41598-024-68741-9
43. Szklarczyk D, Kirsch R, Koutrouli M, Nastou K, Mehryary F, Hachilif R, et al. The STRING database in 2023: protein-protein association networks and functional enrichment analyses for any sequenced genome of interest. Nucleic Acids Res. (2023) 51:D638–46. doi: 10.1093/nar/gkac1000
44. Chen EY, Tan CM, Kou Y, Duan Q, Wang Z, Meirelles GV, et al. Enrichr: interactive and collaborative HTML5 gene list enrichment analysis tool. BMC Bioinf. (2013) 14:128. doi: 10.1186/1471-2105-14-128
45. Kuleshov MV, Jones MR, Rouillard AD, Fernandez NF, Duan Q, Wang Z, et al. Enrichr: a comprehensive gene set enrichment analysis web server 2016 update. Nucleic Acids Res. (2016) 44:W90–7. doi: 10.1093/nar/gkw377
46. Kutmon M, Riutta A, Nunes N, Hanspers K, Willighagen EL, Bohler A, et al. WikiPathways: capturing the full diversity of pathway knowledge. Nucleic Acids Res. (2016) 44:D488–94. doi: 10.1093/nar/gkv1024
47. Seuter S, Virtanen JK, Nurmi T, Pihlajamaki J, Mursu J, Voutilainen S, et al. Molecular evaluation of vitamin D responsiveness of healthy young adults. J Steroid Biochem Mol Biol. (2017) 174:314–21. doi: 10.1016/j.jsbmb.2016.06.003
48. Vukic M, Neme A, Seuter S, Saksa N, de Mello VD, Nurmi T, et al. Relevance of vitamin D receptor target genes for monitoring the vitamin D responsiveness of primary human cells. PloS One. (2015) 10:e0124339. doi: 10.1371/journal.pone.0124339
49. Pike JW. Genome-wide principles of gene regulation by the vitamin D receptor and its activating ligand. Mol Cell Endocrinol. (2011) 347:3–10. doi: 10.1016/j.mce.2011.05.012
50. Haussler MR, Haussler CA, Jurutka PW, Thompson PD, Hsieh JC, Remus LS, et al. The vitamin D hormone and its nuclear receptor: molecular actions and disease states. J Endocrinol. (1997) 154 Suppl:S57–73.
51. Bikle DD. Vitamin D metabolism, mechanism of action, and clinical applications. Chem Biol. (2014) 21:319–29. doi: 10.1016/j.chembiol.2013.12.016
52. Gombart AF, Borregaard N, and Koeffler HP. Human cathelicidin antimicrobial peptide (CAMP) gene is a direct target of the vitamin D receptor and is strongly up-regulated in myeloid cells by 1,25-dihydroxyvitamin D3. FASEB J. (2005) 19:1067–77. doi: 10.1096/fj.04-3284com
53. Zoidis E, Seremelis I, Kontopoulos N, and Danezis GP. Selenium-dependent antioxidant enzymes: actions and properties of selenoproteins. Antioxidants (Basel). (2018) 7:66. doi: 10.3390/antiox7050066
54. Jain SK, Parsanathan R, Achari AE, Kanikarla-Marie P, and Bocchini JA Jr. Glutathione stimulates vitamin D regulatory and glucose-metabolism genes, lowers oxidative stress and inflammation, and Increases 25-hydroxyvitamin D levels in blood: a novel approach to treat 25-hydroxyvitamin D deficiency. Antioxid Redox Signal. (2018) 29:1792–807. doi: 10.1089/ars.2017.7462
55. Yu SS and Du JL. Current views on selenoprotein S in the pathophysiological processes of diabetes-induced atherosclerosis: potential therapeutics and underlying biomarkers. Diabetol Metab Syndr. (2024) 16:5. doi: 10.1186/s13098-023-01247-y
56. Lei XG, Zhu JH, Cheng WH, Bao Y, Ho YS, Reddi AR, et al. Paradoxical roles of antioxidant enzymes: basic mechanisms and health implications. Physiol Rev. (2016) 96:307–64. doi: 10.1152/physrev.00010.2014
57. Wen XY, Yang N, Gao Y, Ma WN, Fu Y, Geng RF, et al. PRDX1 exerts a photoprotection effect by inhibiting oxidative stress and regulating MAPK signaling on retinal pigment epithelium. BMC Ophthalmol. (2024) 24:237. doi: 10.1186/s12886-024-03489-4
58. Chaiprasongsuk A, Janjetovic Z, Kim TK, Jarrett SG, D'Orazio JA, Holick MF, et al. Protective effects of novel derivatives of vitamin D3 and lumisterol against UVB-induced damage in human keratinocytes involve activation of Nrf2 and p53 defense mechanisms. Redox Biol. (2019) 24:101206. doi: 10.1016/j.redox.2019.101206
59. Luo G, Kumar H, Aldridge K, Rieger S, Han E, Jiang E, et al. A core NRF2 gene set defined through comprehensive transcriptomic analysis predicts selective drug resistance and poor multicancer prognosis. Antioxid Redox Signal. (2024) 41:1031–50. doi: 10.1089/ars.2023.0409
60. Monaco G, Lee B, Xu W, Mustafah S, Hwang YY, Carre C, et al. RNA-Seq signatures normalized by mRNA abundance allow absolute deconvolution of human immune cell types. Cell Rep. (2019) 26:1627–1640 e7. doi: 10.1016/j.celrep.2019.01.041
61. Liu Y, Beyer A, and Aebersold R. On the dependency of cellular protein levels on mRNA abundance. Cell. (2016) 165:535–50. doi: 10.1016/j.cell.2016.03.014
Keywords: vitamin D, transcriptome, PBMCs, vitamin D target genes, immune system, detoxification
Citation: Tripathi T and Carlberg C (2025) Early in vivo target genes in human immune cells highlight vitamin D’s role in antioxidant defense. Front. Immunol. 16:1559486. doi: 10.3389/fimmu.2025.1559486
Received: 12 January 2025; Accepted: 27 June 2025;
Published: 15 July 2025.
Edited by:
Willem Van Eden, Utrecht University, NetherlandsReviewed by:
Michael Danilenko, Ben-Gurion University of the Negev, IsraelGiacomina Brunetti, University of Bari Aldo Moro, Italy
Copyright © 2025 Tripathi and Carlberg. This is an open-access article distributed under the terms of the Creative Commons Attribution License (CC BY). The use, distribution or reproduction in other forums is permitted, provided the original author(s) and the copyright owner(s) are credited and that the original publication in this journal is cited, in accordance with accepted academic practice. No use, distribution or reproduction is permitted which does not comply with these terms.
*Correspondence: Carsten Carlberg, Yy5jYXJsYmVyZ0BwYW4ub2xzenR5bi5wbA==