 Anjing Wang1,2†
 Yunlong Qin1,3†
 Yan Xing1
 Zixian Yu1Liuyifei Huang1Jinguo Yuan1Yueqing Hui1Mei Han1
 Guoshuang Xu1
 Jin Zhao1*
 Shiren Sun1*
- 1Department of Nephrology, Xijing Hospital, The Fourth Military Medical University, Xi’an, Shaanxi, China
- 2Department of Postgraduate Student, Xi’an Medical University, Xi’an, Shaanxi, China
- 3Department of Nephrology, Bethune International Peace Hospital, Shijiazhuang, China
Objective: The objective of this study is to compare the clinical features and survival outcomes of class IV ± V lupus nephritis (LN) patients, identify risk factors, and develop an accurate prognostic model.
Methods: This study enrolled patients diagnosed with class IV ± V LN by renal biopsy at Xijing Hospital from December 2013 to June 2023. The composite endpoint of the study was defined as a decline in the estimated glomerular filtration rate (eGFR) by more than 50%, progression to end stage renal disease, or death, whichever came first. The eGFR was calculated utilizing the Chronic Kidney Disease Epidemiology Collaboration (CKD-EPI) formula. ESRD is defined as an eGFR less than 15ml/min/1.73m2, necessitating the commencement of chronic dialysis (hemodialysis or peritoneal dialysis) or kidney transplantation. We compared the baseline features and survival prognosis between patients with class IV ± V LN. The prognostic model was developed using machine learning algorithms and Cox regression. The model’s performance was evaluated in terms of discrimination, calibration, and risk classification using the concordance index (C-index), integrated brier score (IBS), net reclassification index (NRI), and integrated discrimination improvement (IDI), respectively.
Results: A total of 313 patients were enrolled for this study, including 156 class IV and 157 class IV+V LN. During the median follow-up period of 42.6 (17.0, 83.4) months, 35 (22.4%) class IV and 38 (24.2%) class IV+V LN patients experienced combined events. Class IV and class IV+V patients have similar clinical manifestations, treatment strategies, and long-term prognosis, despite class IV having a higher chronic index (CI) score (P < 0.001). Seven eligible variables (eGFR, CI, age, basophil percentage, red blood cell count, mean arterial blood pressure, and uric acid) were selected to develop the random survival forest (RSF) model. This model demonstrated the best performance with a C-index of 0.771 (0.667, 0.848) and an IBS of 0.144 (0.132, 0.154). The IDI and NRI in the testing set further confirmed that the RSF model exhibited superior risk classification and discrimination capabilities.
Conclusion: Class IV ± V LN was similar in clinical manifestations, treatment strategies, and long-term prognosis, despite differences in pathological features. The RSF model we established for class IV ± V LN patients, incorporating seven risk factors, exhibits superior survival prediction and provides more precise prognostic stratification.
1 Introduction
Systemic Lupus Erythematosus (SLE) is a complicated autoimmune disease characterized by its multisystem involvement and diverse clinical manifestations (1, 2). Lupus nephritis (LN) is one of the most severe organ manifestations of SLE (3). The incidence of LN among adult SLE patients ranges from approximately 30% to 60% (3, 4). The pathogenesis of LN is primarily manifested through the deposition of autoantibodies and immune complexes, activation and/or proliferation of infiltrating immune cells, as well as kidney resident cells (4). The presence of LN can significantly increase SLE-associated mortality and morbidity (5). Between 5 and 30% of patients progress to end-stage renal disease (ESRD) within a decade following the initial diagnosis of LN (6). Despite the ongoing development of immunomodulatory agents and supportive care, the prognosis of LN has not seen substantial improvement over the past 10 years (7).
The renal pathological features of LN play a crucial role in guiding therapeutic strategies and providing prognostic information (8). The 2003 International Society of Nephrology/Renal Pathology Society (ISN/RPS) classification system categorizes LN into six pathological types, which has been widely accepted (9, 10). Notably, class V may present simultaneously with class III or IV, known as class III/IV+V, and these are associated with severe symptoms that require intensive therapy (11). Among these, patients with class IV ± V LN tend to have the worst renal outcomes, but the prognosis and clinical features between class IV and class IV+V are inconsistent across various studies (12–14). However, the treatment guidelines for the treatment of class IV ± V patients are similar (15, 16). Therefore, it is necessary to compare the clinical features and further evaluate the prognosis of class IV ± V. Various investigations have explored clinical and serological markers such as serum creatinine levels, proteinuria levels, haematuria, and hypertension as predictors of the prognosis of LN (17–20). Unfortunately, there are limited retrospective studies that focus solely on the prognosis of class IV ± V, which leads to an incomplete understanding of the risk factors influencing disease progression and a lack of comprehensive clinical guidance for the prognosis of class IV ± V.
Machine Learning (ML) is currently receiving increasing attention in clinical prediction modelling (21). The random survival forest (RSF) is a ML algorithm specifically designed for predicting survival outcomes (22). eXtreme Gradient boosting (XGboost) has gained widespread recognition in numerous ML and data mining challenges (23). However, ML has not yet been applied to the prediction of long-term prognosis of class IV ± V LN patients. Therefore, this study aims to compare the clinical features and prognosis, explore the risk factors impacting the long-term prognosis of class IV ± V LN patients diagnosed through renal biopsy, and establish an accurate prognostic model by employing ML algorithms, which providing valuable insights for early disease intervention and aiding physicians in decision-making.
2 Materials and methods
2.1 Study population
We gathered the clinical and pathological information of patients who underwent renal biopsy and were subsequently diagnosed with class IV ± V LN at Xijing Hospital of The Fourth Military Medical University from December 2013 to June 2023. The inclusion criteria encompassed the following: (1) age 18 years or older; (2) a diagnosis of class IV ± V LN confirmed by renal biopsy with complete follow-up records. The exclusion criteria encompassed the following: (1) patients with complications of other secondary nephropathies, such as diabetic nephropathy; (2) biopsy specimens with less than 8 glomeruli detected or absence of original pathological reports; (3) presence of other serious diseases with a life expectancy of less than 1 year; (4) unavailable outcome data. This study complied with the reporting guidelines for the Transparent Reporting of a Multivariable Prediction Model for Individual Prognosis or Diagnosis (TRIPOD) (24) (Supplementary Table S1). The retrospective design of this study made patient informed consent unnecessary, as approved by the Ethics Committee of Xijing Hospital (ethical number: KY20213027-1).
2.2 Outcomes
In this study, the endpoint was the composite outcome of decline in estimated glomerular filtration rate (eGFR) of more than 50%, ESRD, or death, whichever came first. The eGFR was calculated utilizing the Chronic Kidney Disease Epidemiology Collaboration (CKD-EPI) formula (25). ESRD is defined as an eGFR less than 15ml/min/1.73m2, necessitating the commencement of chronic dialysis (hemodialysis or peritoneal dialysis) or kidney transplantation (26). Follow-up duration was the time interval between renal biopsy and the final outpatient visit or telephone follow-up.
2.3 Data collection
Two researchers (Wang and Zhao) collected the demographic, clinical, and pathological data at baseline from the electronic medical record information system (Supplementary Table S2). We compared the baseline data between the class IV and IV+V LN patients (Table 1). The treatment methods employed in this study were categorized into four types: (1) corticosteroids monotherapy, (2) combination therapy with corticosteroids and immunosuppressants, (3) combination therapy with corticosteroids, immunosuppressants, and novel biological agents, and (4) other treatments. Comorbidity or other diseases were documented based on the diagnostic results of patients. Patients with a follow-up duration of at least 6 months were included in the analysis, unless they reached the predefined endpoints. During follow-up, we evaluated the survival status of patients, progression to ESRD, initiation of dialysis, and laboratory examination data. Rigorous safeguards were implemented to guarantee the privacy of patients’ information throughout the data collection process and all subsequent stages.
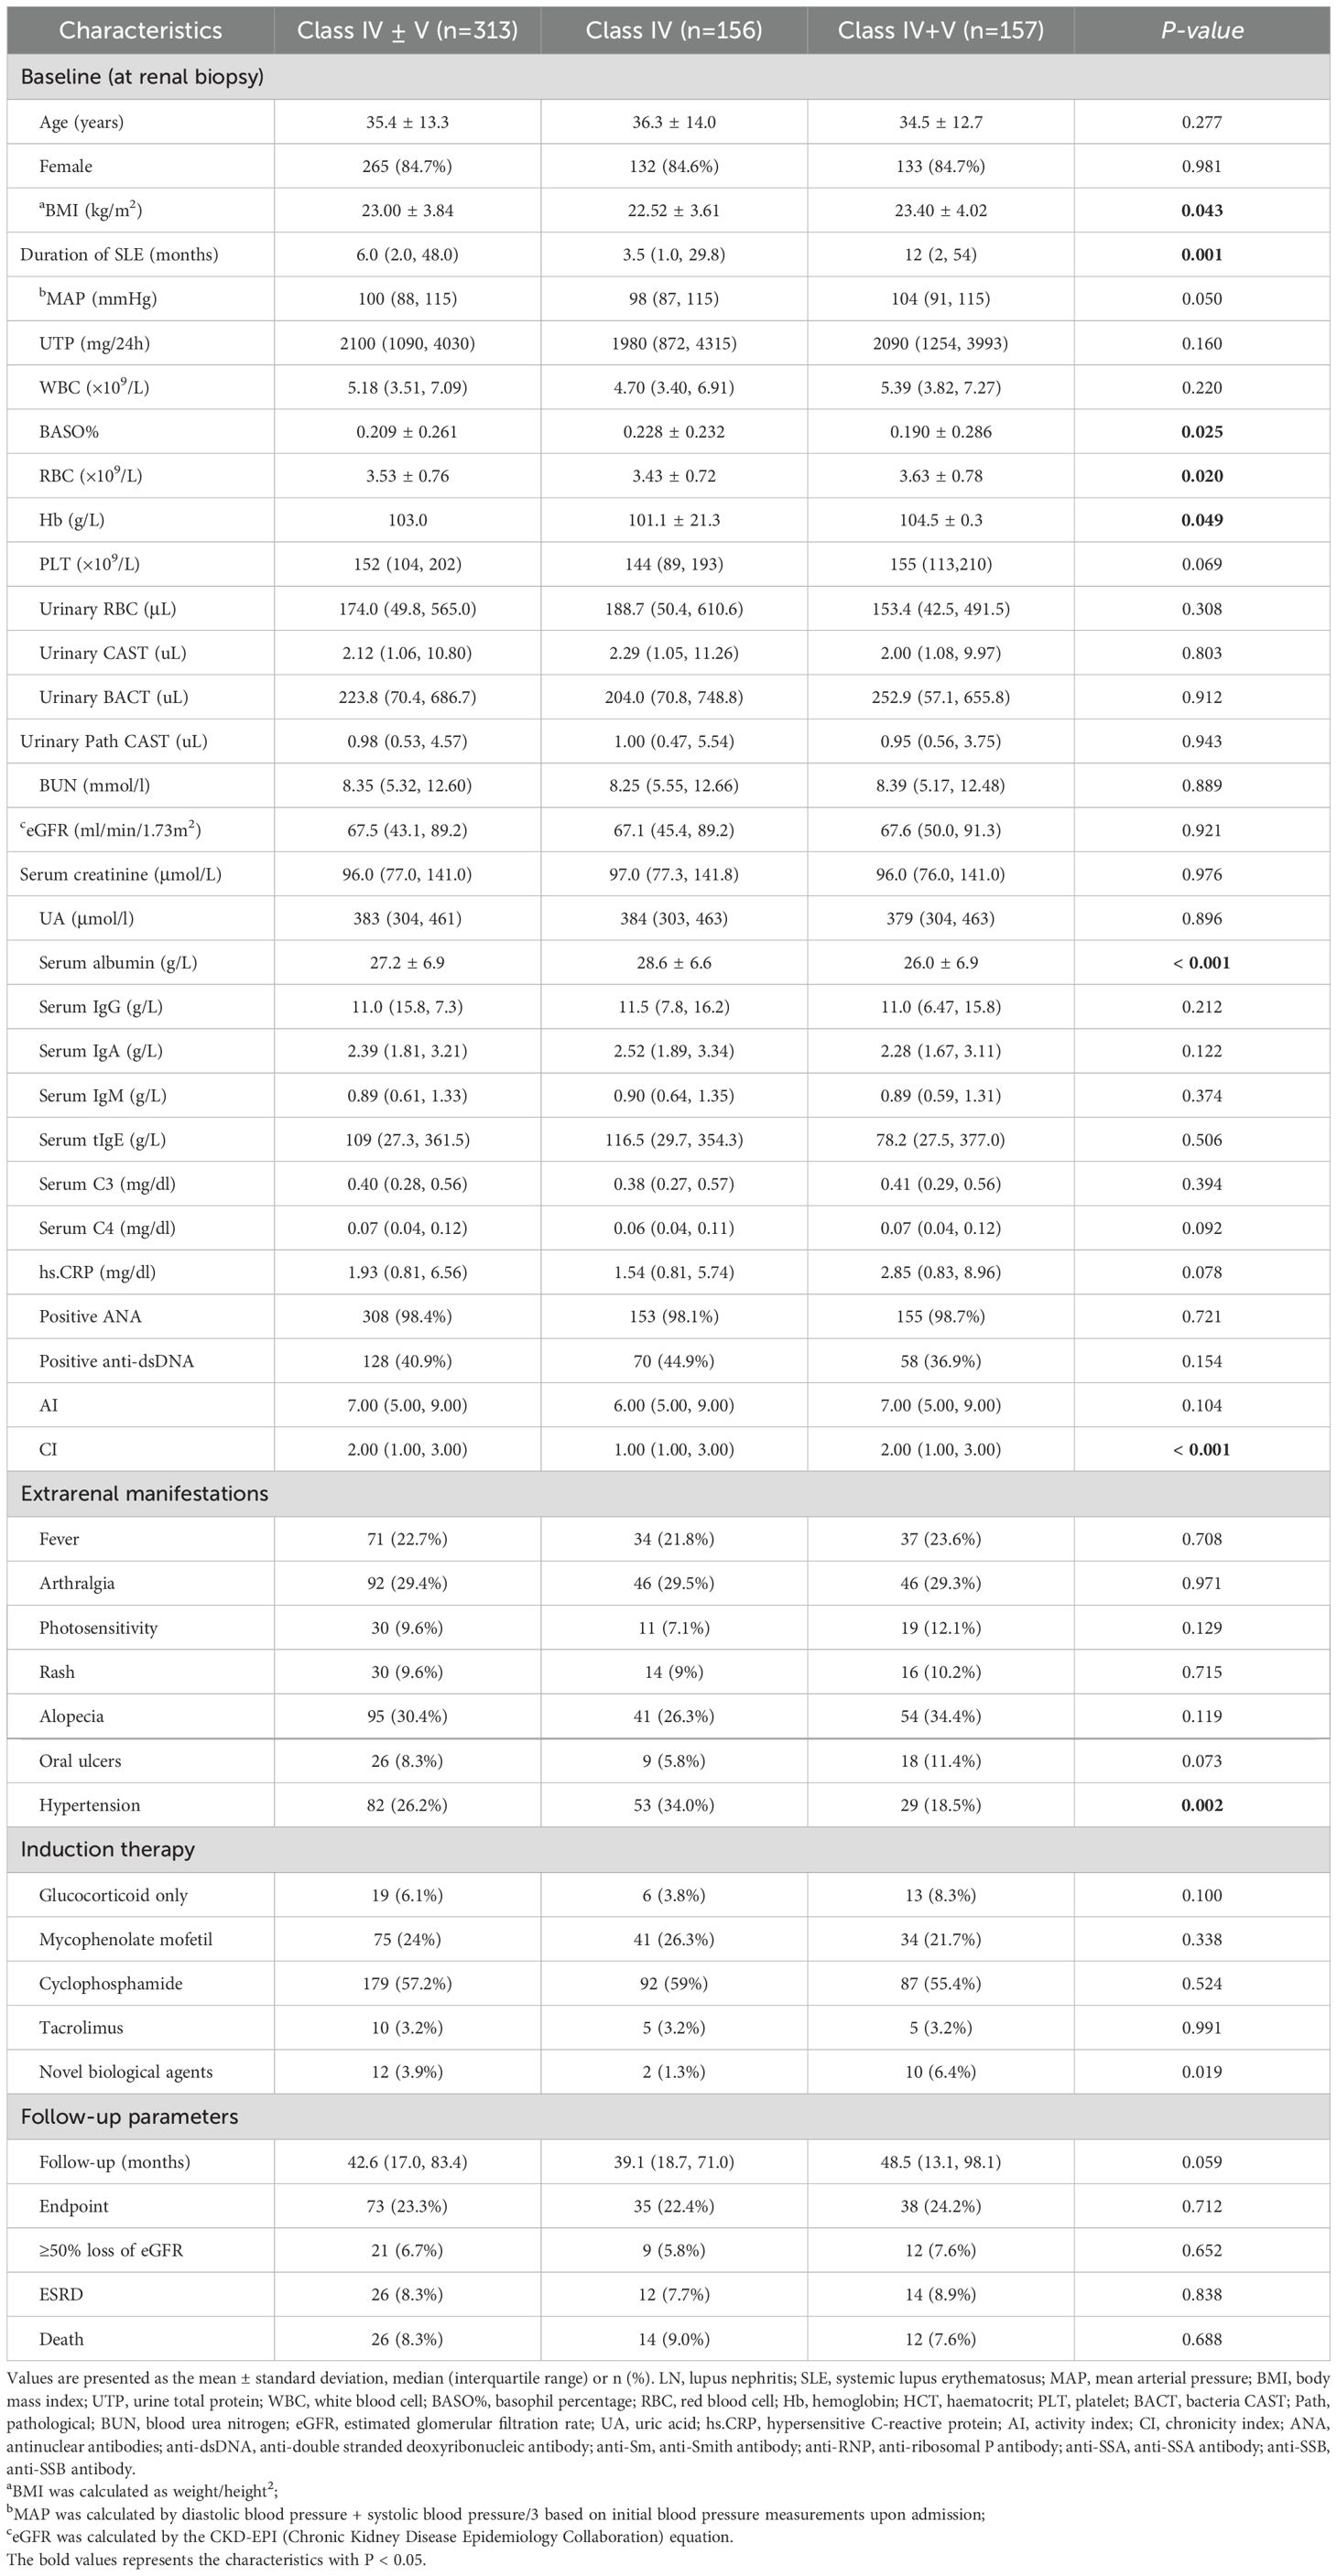
Table 1. Comparison of baseline characteristics between class IV and class IV+V.
2.4 Renal pathological assessment
Experienced pathologists at this center conducted a review of the pathological characteristics of LN. The pathological index of LN refers to the activity index (AI) and chronic index (CI) scoring system of the National Institutes of Health (NIH) (27). The AI score comprises six components: endocapillary hypercellularity, fibrinoid necrosis, cellular/fibrocellular crescents, neutrophils/karyorrhexis, interstitial inflammation, and hyaline deposits. The CI score consists of four components: interstitial fibrosis, fibrous crescents, total glomerulosclerosis score, and tubular atrophy. Each component is assigned a score of 0 to 3 based on the percentage of glomeruli or the affected cortex area. It is noteworthy that cellular/fibrocellular crescents and fibrinoid necrosis are given double weight. By summing the scores of the individual components, we obtained a cumulative AI score of 24 and a CI score of 12, respectively.
2.5 Model development and performance
Model development and internal validation were conducted using R software (Version 4.3.2).The primary basis for variables selection was variable importance (VIMP), an internal statistic of the RSF algorithm (28). Bootstrapping resampling with 1000 replications was conducted, and the 95% confidence interval (CI) of VIMP was calculated. Variables with a mean VIMP exceeding 0.02 were considered as RSF prognostic variables. Additionally, univariate and multivariate Cox regression analyses were employed for variable selection. The final selection of variables was determined by integrating the results of these two methods with clinical experience. The dataset was randomly divided into a training set and a testing set at a ratio of 6:4. The optimal parameters for each model were chosen through the method of grid search. For the RSF model, the parameters were set as follows: the ntree to 800, the mtry to 2, and the nodesize to 3 (Supplementary Figure S1). For the XGboost model, For the XGboost model, the parameters were: learning rate at 0.01, tree depth at 1, subsample at 1, colsample_bytree at 1, and gamma at 0.5. The specific R packages utilized were “survival”, “MASS” “randomForestSRC”, “survivalsvm”, and “XGboost”.
The discriminative capacity of the model was evaluated using the area under the receiver operating characteristic curve (AUC) and the concordance index (C-index). To assess the model’s discriminative capacity throughout the entire study duration, we computed the area under the time-dependent curve (tAUC). The integrated brier score (IBS) was calculated and Calibration plots were generated to estimate the calibration ability of ML models. Additionally, the decision curve analysis (DCA) was performed to further assess model performance. The integrated discrimination improvement (IDI) and net reclassification improvement (NRI) were also determined to evaluate the risk reclassification. A higher NRI value indicates that the newly established models demonstrated superior performance compared to the Cox model in reducing the risk of misclassifying individuals. Meanwhile, a higher IDI value suggests a more significant improvement in the predictive accuracy of the newly established models.
2.6 Statistical analysis
Variables with missing data rates above 20% and with a correlation coefficient surpassing 0.75 were eliminated from the analysis. Random forest imputation was utilized to compensate for missing data. Categorical variables were reported as frequencies and percentages, and comparisons were made using the χ2 test or Fisher’s exact test, as appropriate. Continuous variables that were normally distributed were reported as mean ± standard deviation (SD), while those with non-normal distributions were reported as median (interquartile ranges). Comparisons between groups were performed utilizing the Mann-Whitney U test or Student’s t-test. Optimal cut-off points for continuous variables were determined using the Jsurvival-Survival Module in the ClinicoPath software suite in Jamovi, which was used to identify significant correlations with survival outcomes (29). Kaplan-Meier curves were adopted for cumulative survival analysis and group comparisons were made via the log-rank test. The two-tailed test was utilized to calculated P values, and a P-value less than 0.05 was designated as indicative of statistical significance. All statistical analyses were executed in R (Version 4.3.2), SPSS (IBM Version 27.0), and Jamovi (Version 2.3, Sydney, Australia).
3 Results
3.1 Patient characteristics
A total of 313 eligible class IV ± V LN patients were included from a pool of 615 biopsy-proven LN patients, consisting of 156 with class IV and 157 with class IV+V LN (Figure 1). During the median follow-up duration of 42.6 (17.0, 83.4) months, 35 (22.4%) class IV and 38 (24.2%) LN patients experienced combined events with no statistically significant (P = 0.712). In detail, 9 (5.8%) class IV and 38 (24.2%) LN patients experienced a decline of eGFR more than 50%, 12 (7.7%) class IV and 14 (8.9%) LN patients progress to ESRD, and 14 (9.0%) class IV and 12 (7.6%) LN patients occurred death. Between the two group, the three events were all with no statistically significant (P = 0.652, P = 0.838, P = 0.688). The platelet was 152 (104, 202) × 109/L, the white blood cell was 5.18 (3.51, 7.09) × 109/L, the hypersensitive C-reactive protein was 1.93 (0.81, 6.54) mg/L, the MAP was 100 (88.0, 115) mmHg, the urinary total protein (UTP) was 2100 (1090, 4030) mg/24h, and the eGFR was 67.5 (43.1, 89.2) mL/min/1.73 m2. The AI score was 7.00 (5.00, 9.00) and CI score was 2.00 (1.00, 3.00) (Table 1).
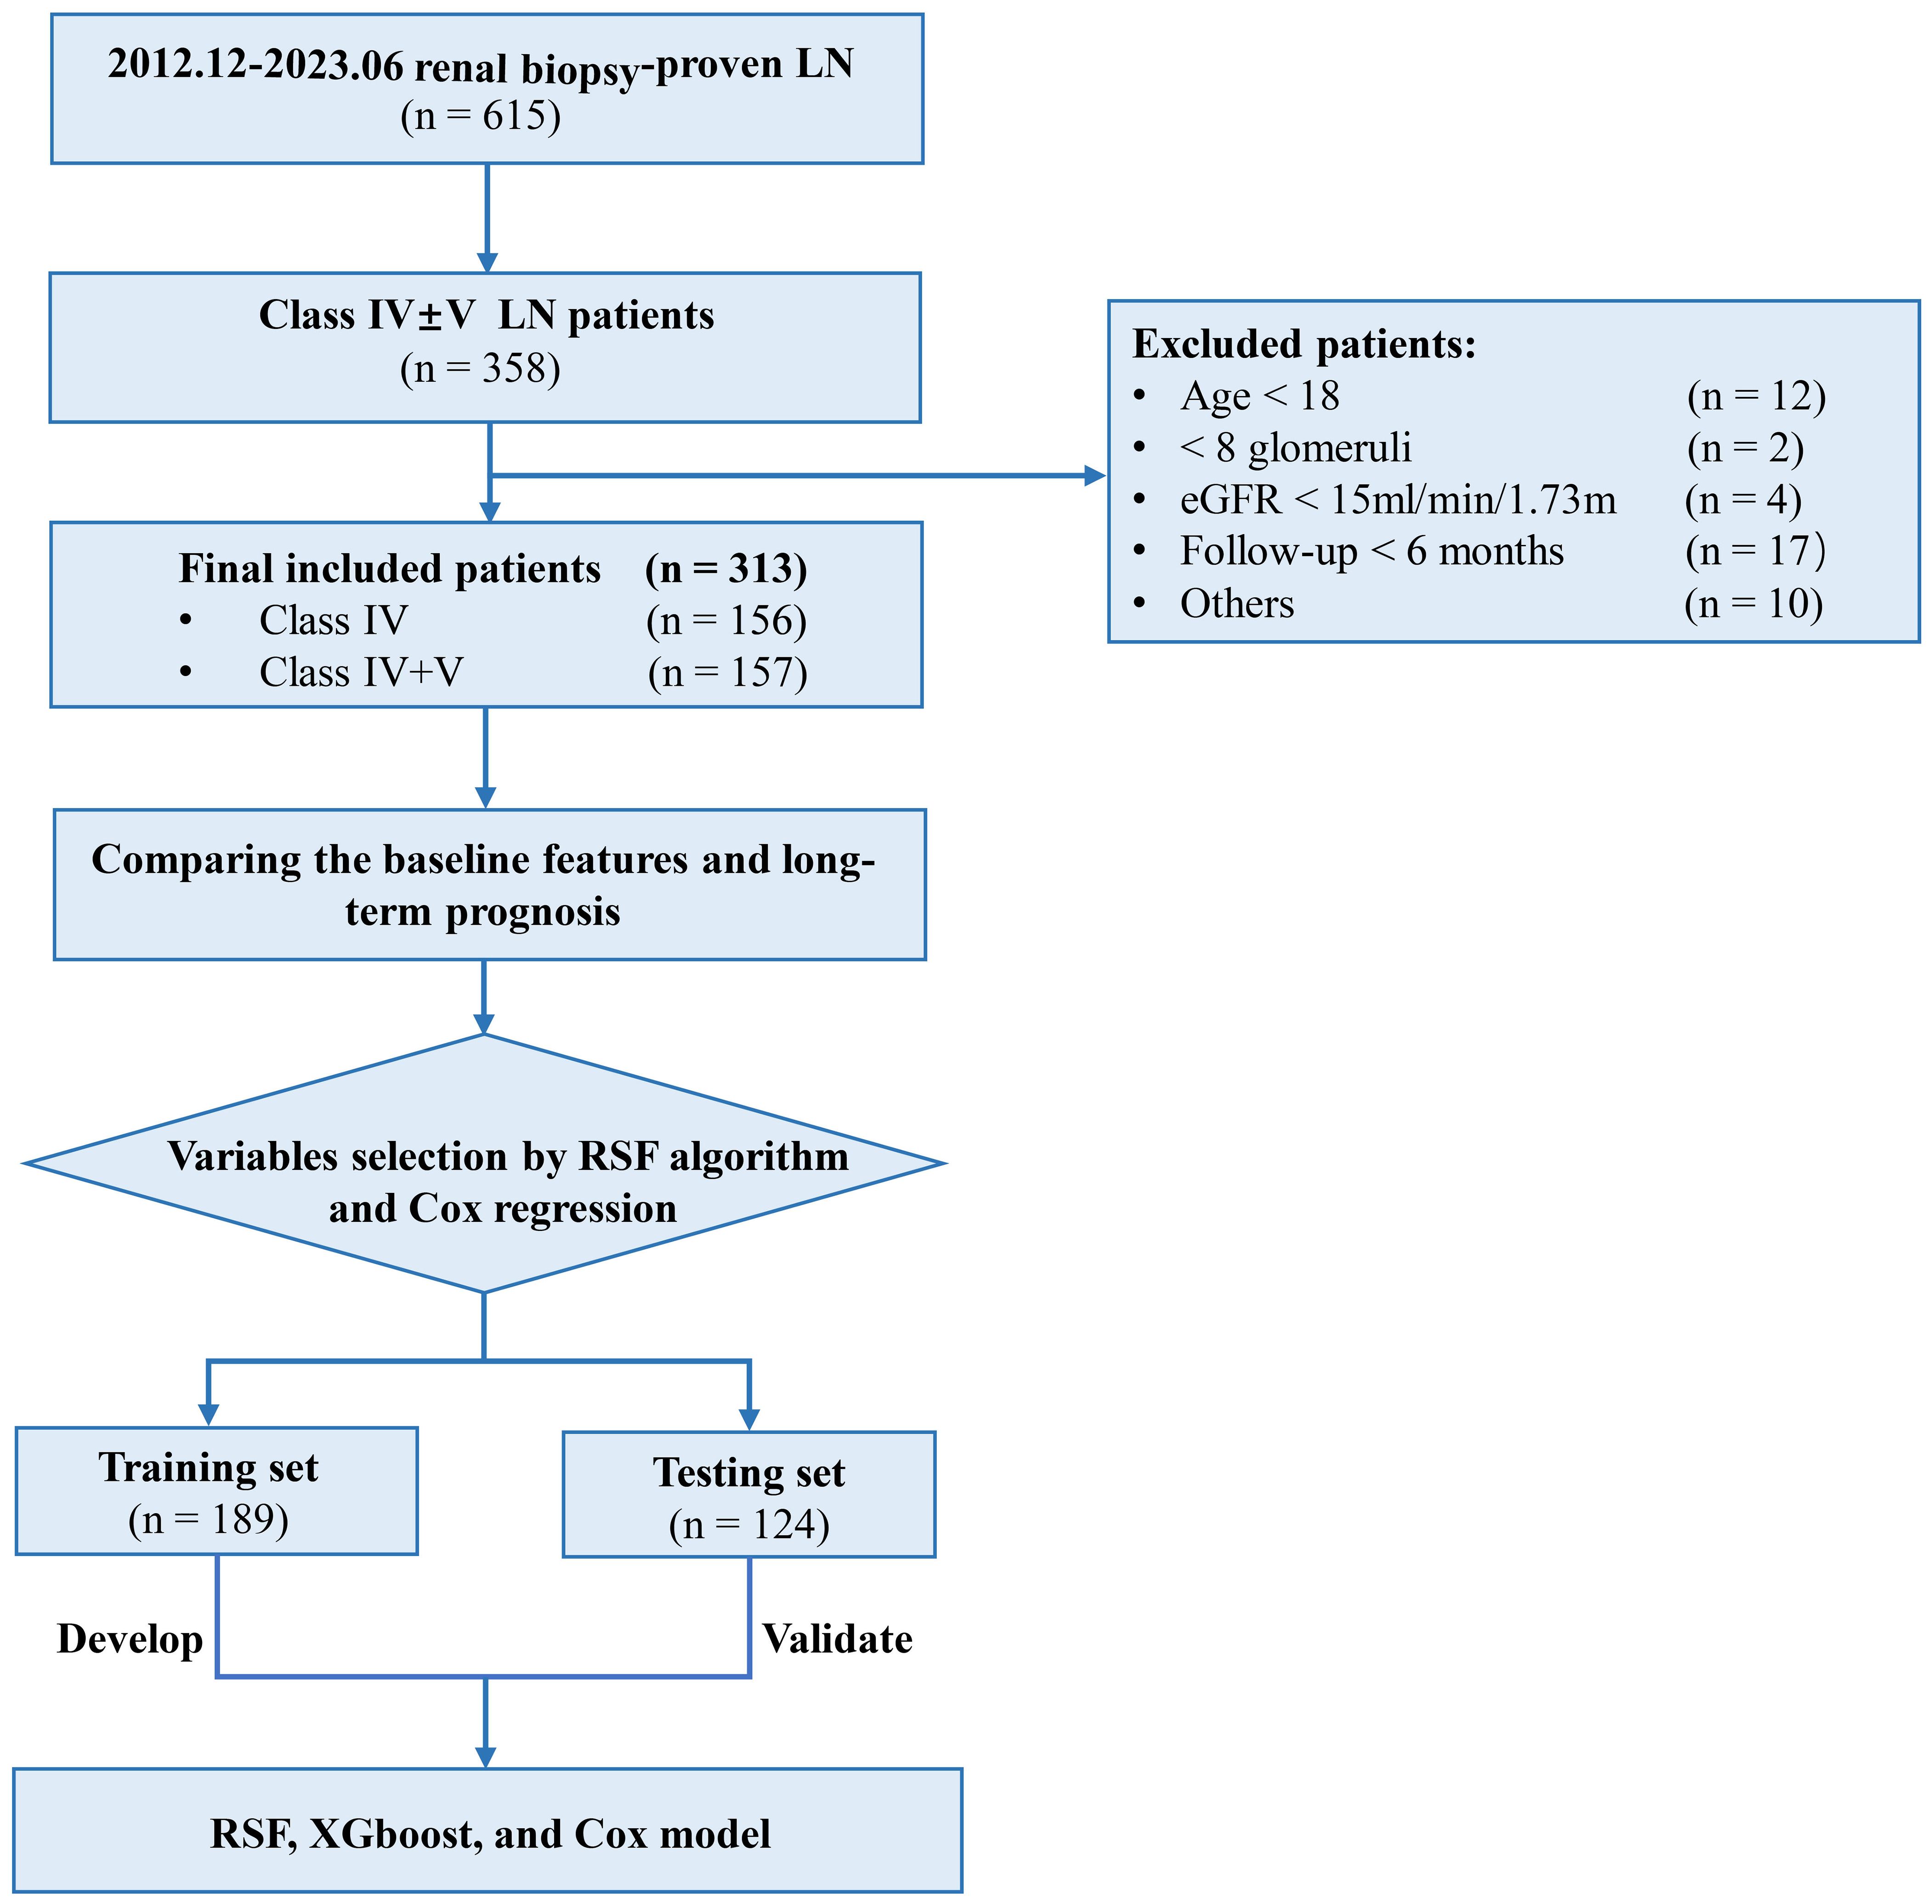
Figure 1. Study flowchart. LN, lupus nephritis; eGFR, estimated glomerular filtration rate; RSF, random survival forest; XGboost, eXtreme Gradient Boosting.
3.2 Comparisons of the baseline data and prognosis of class IV ± V LN patients
Class IV and class IV+V LN exhibited similar clinical manifestations in terms of the UTP (P = 0.160), eGFR (P = 0.921), urinary red blood cell (RBC) (P = 0.308), and anti-dsDNA positivity rate (P = 0.154) and similar initial therapeutic regimen primarily including glucocorticoid combined with mycophenolate mofetil (P = 0.338) or cyclophosphamide (P = 0.991). Regarding the pathological features, there was no significant difference in the AI score between the two groups (P = 0.104), although the CI score (P < 0.001) was significant higher in class IV+V. Laboratory examinations revealed that class IV LN patients have higher levels of albumin (P = 0.049) and basophil percentage (BASO%) (P = 0.025) and lower levels of RBC (P = 0.020) and hemoglobin (P = 0.049). Kaplan-Meier survival curve analysis revealed no significant difference in renal survival rates between class IV and class IV+V LN patients (P = 0.710) (Supplementary Figure S2).
3.3 Screening of variables
After applying the RSF algorithm for data imputation and eliminating collinear data, 99 covariates were chosen from an initial pool of 114 variables for subsequent analysis. 11 important prognostic variables were filtered out as RSF prognostic variables based on VIMP scores (Supplementary Table S3). In addition, multifactor Cox regression analysis identified age, eGFR, uric acid (UA), BASO%, RBC, CI, and prothrombin activity ratio as independent risk factors impacting the outcome of class IV ± V LN patients. Combining these findings with clinical experience, seven prognostic variables were determined eGFR, CI, age, BASO%, RBC, MAP, and UA based on the VIMP value sorting. These variables were then integrated into the final model as the ultimate variables (Figure 2).
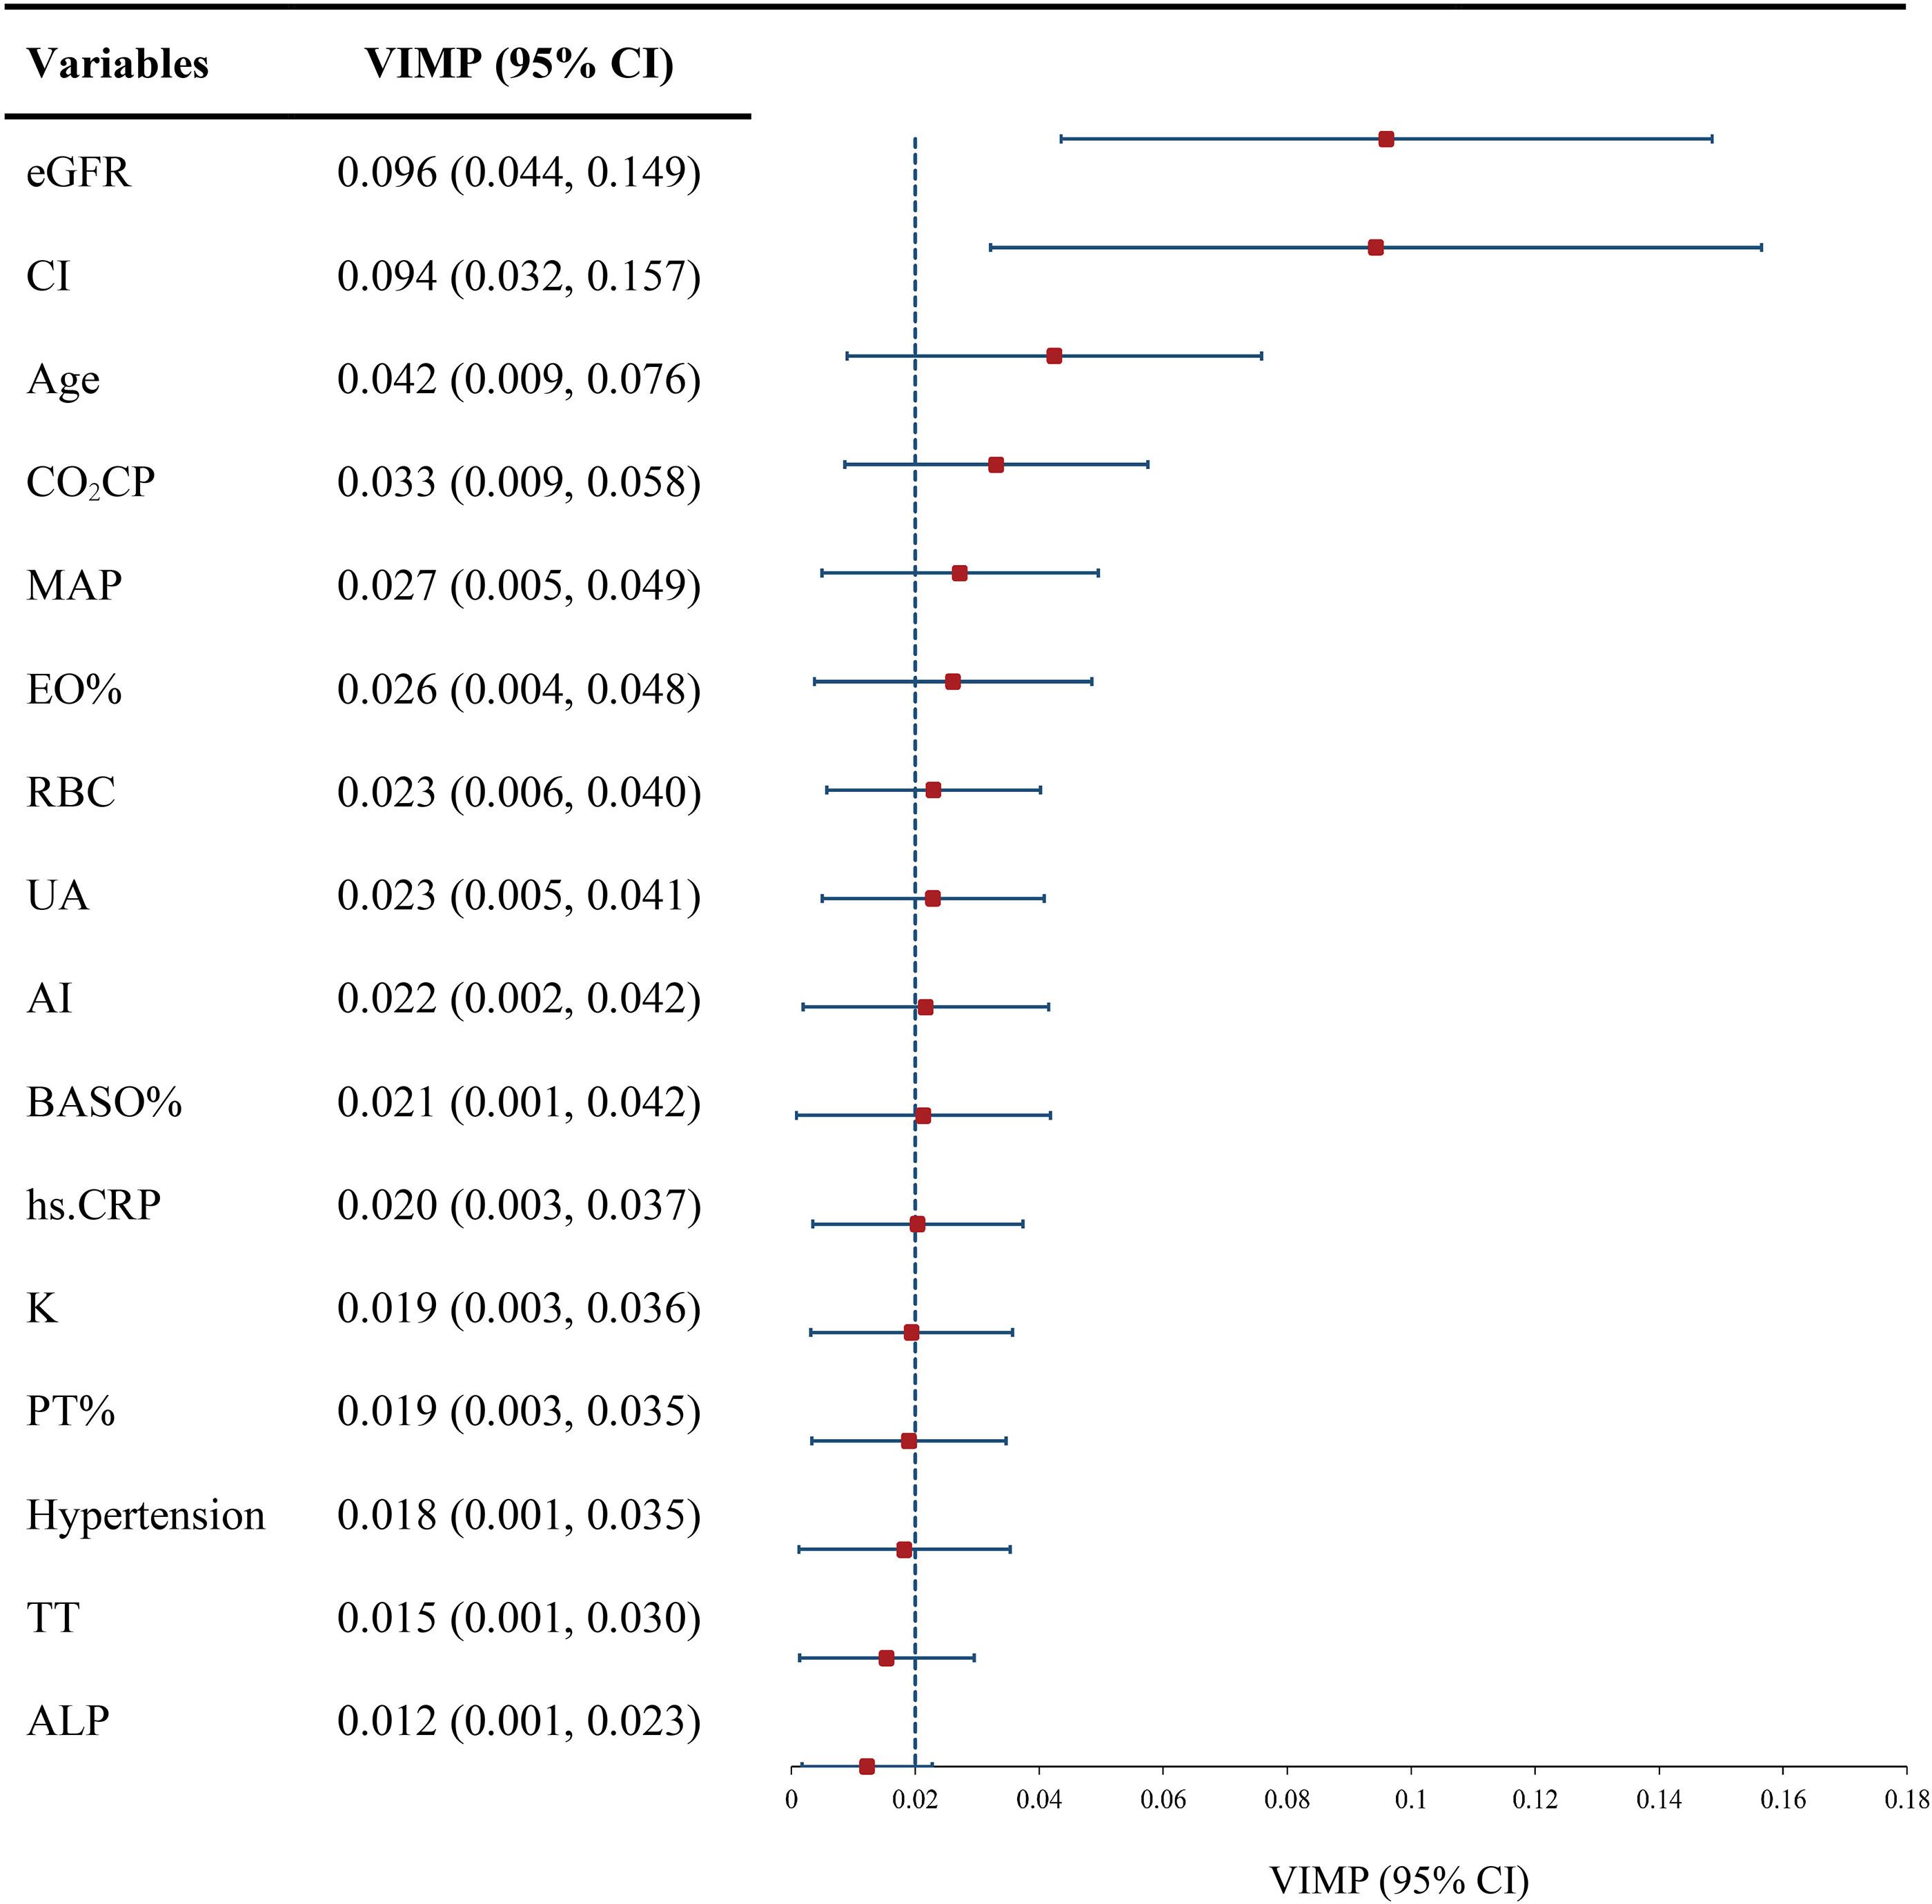
Figure 2. VIMP of indicators for developing model. eGFR, estimated glomerular filtration rate; CI, chronic index; MAP, mean arterial blood pressure; EO%, eosinophil percentage; RBC, red blood cell; UA, uric acid; AI, activity index; BASO%, basophil percentage; hs.CRP, hypersensitive C-reactive protein; PT%, prothrombin time percentage; TT, thrombin time; ALP, alkaline phosphatase; VIMP, variable importance; Dotted line, mean VIMP.
3.4 Model development and performance
3.4.1 Comparison of the discriminatory capabilities of RSF, XGboost, and Cox model
All patients were randomly divided into 189 training samples and 124 testing samples (Table 2). The clinical and pathological variables as well as the follow-up data were well-balanced between the training and testing cohorts, indicating a robust study design. After 12 months, tAUC was consistently higher compare to the RSF model than in the Cox model and XGboost model in both the training and testing cohort.
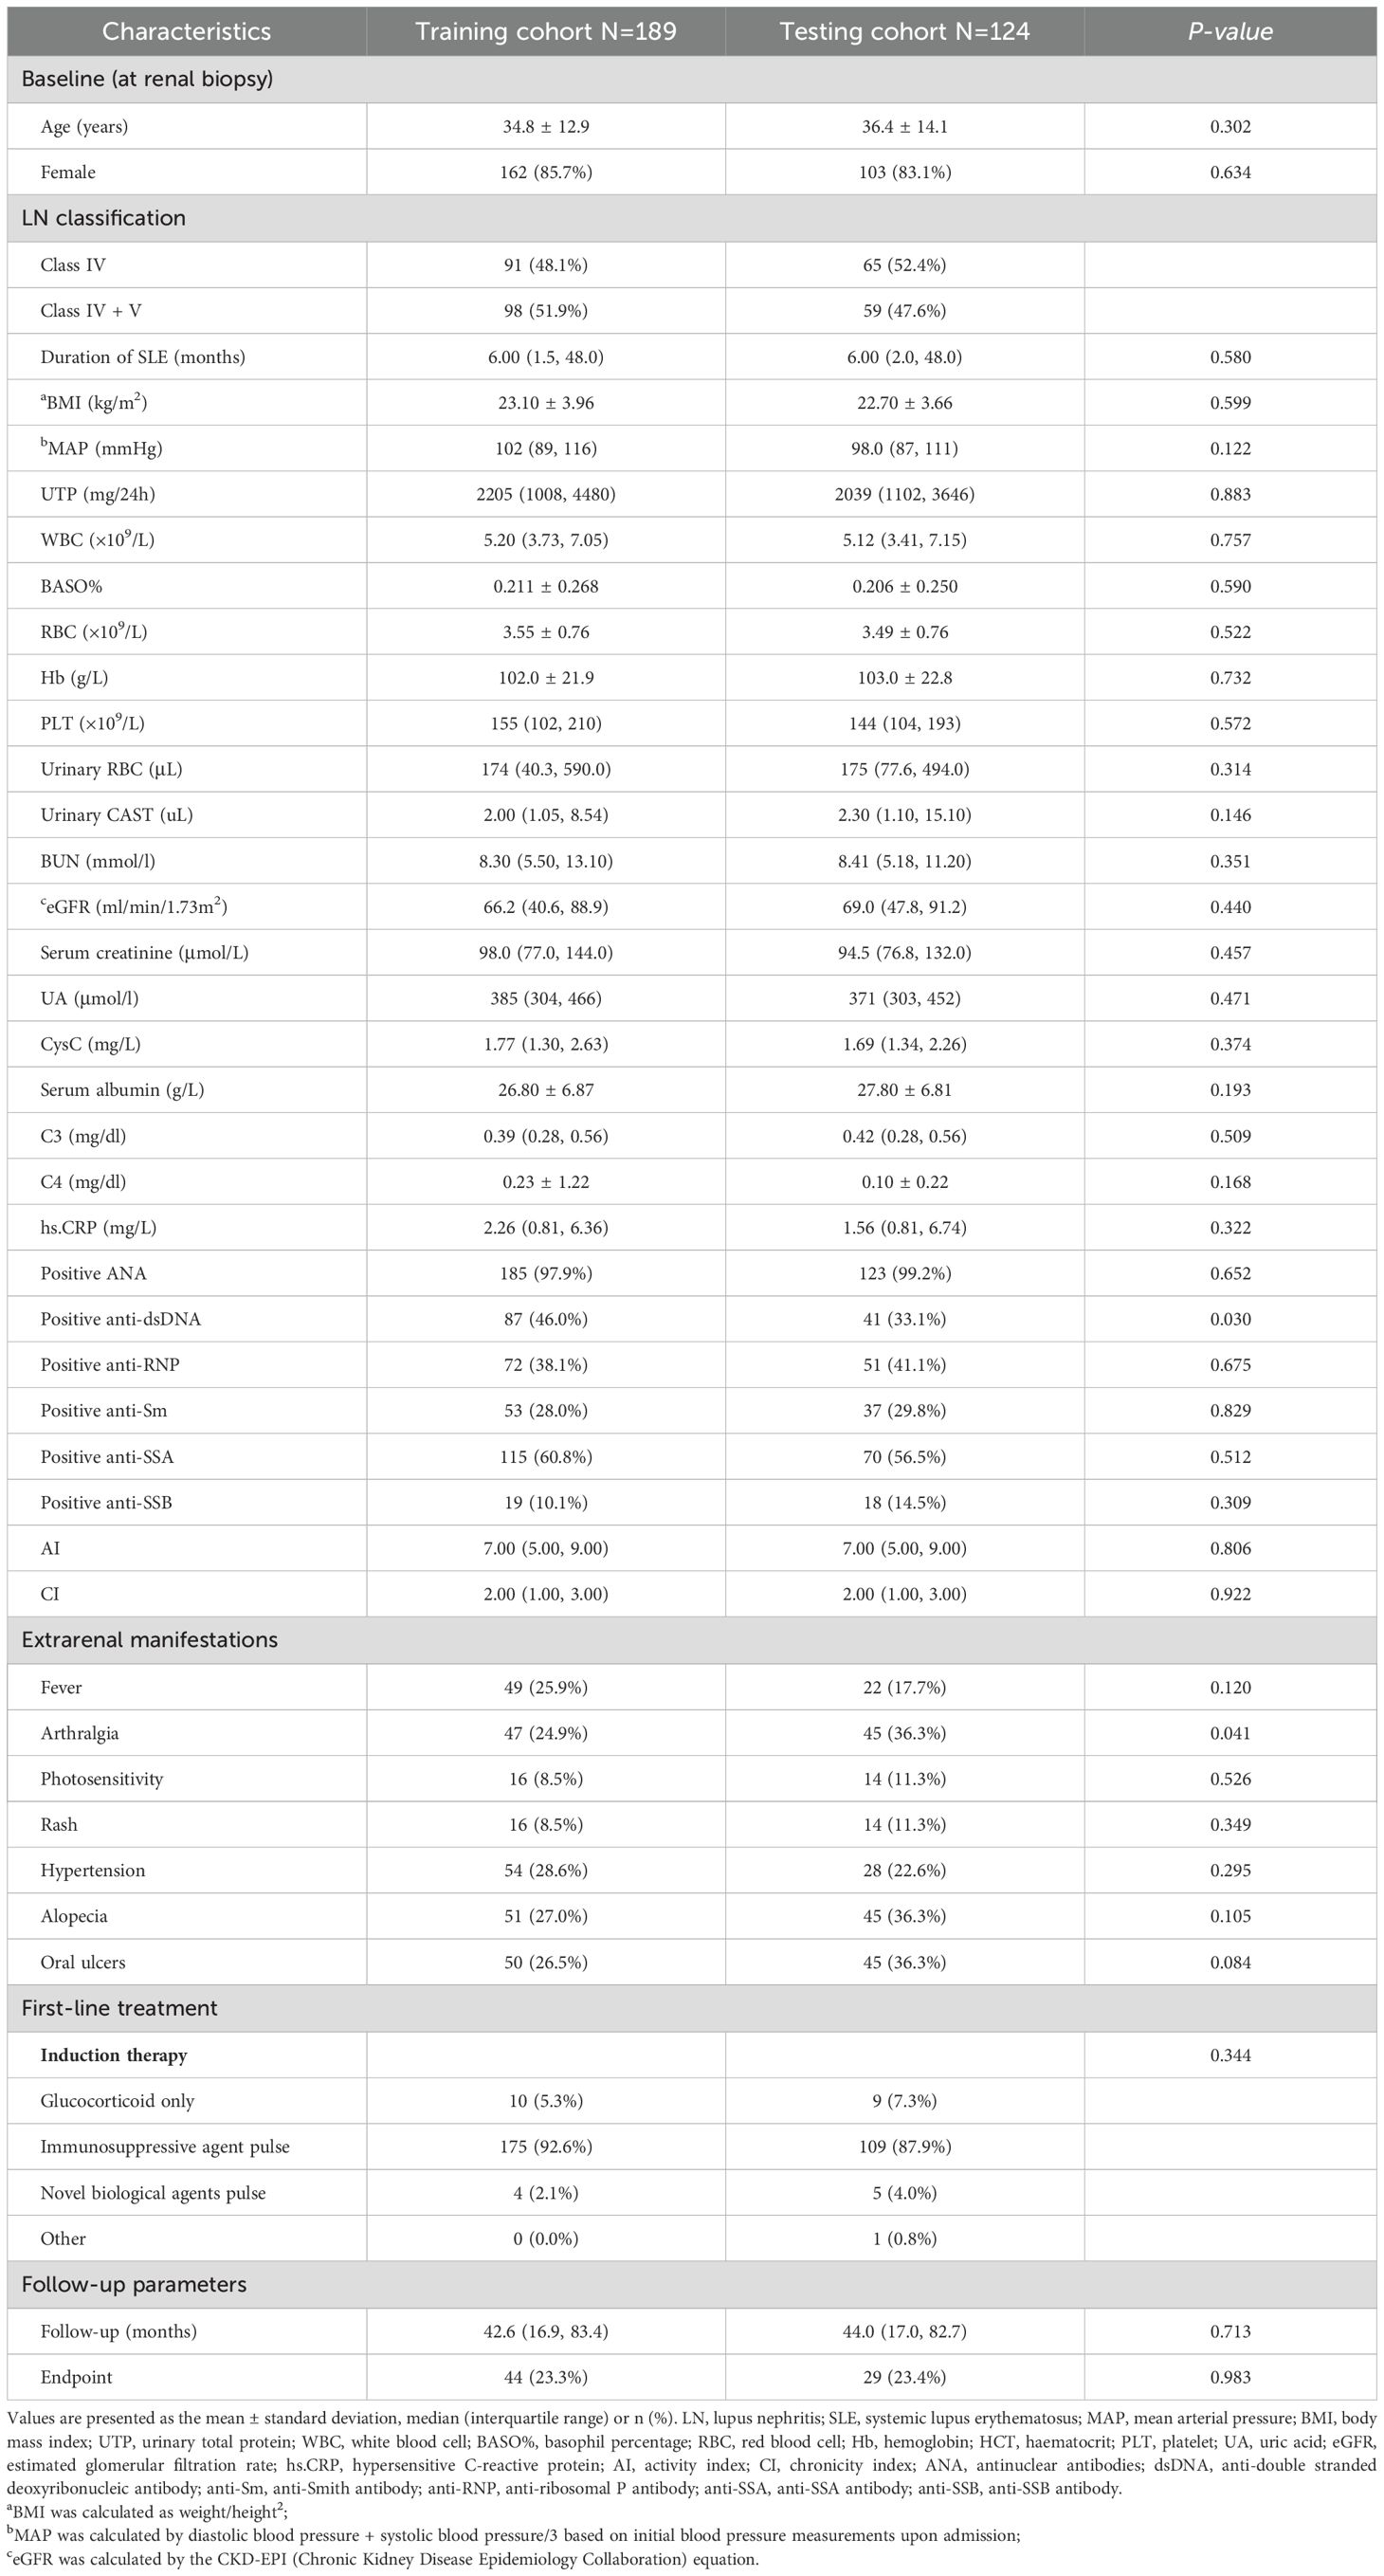
Table 2. Comparison of baseline and follow-up characteristics between the training and testing cohorts.
In the training cohort, the RSF model demonstrated superior discrimination with AUCs of 0.965 (0.939, 0.991), 0.984 (0.967, 1.00) and 0.972 (0.944, 1.00) at 12-, 36-, and 60-months, respectively. The XGboost model with AUCs of 0.826 (0.745, 0.908), 0.867 (0.798, 0.936) and 0.858 (0.771, 0.945), and Cox model with AUCs of 0.882 (0.815, 0.949), 0.859 (0.776, 0.942), 0.787 (0.689, 0.886) at the same time intervals (Figure 3). In the testing set, the RSF model also demonstrated great discrimination with an AUC of 0.855 (0.720, 0.991), 0.781 (0.665, 0.908), and 0.789 (0.673, 0.905) at 12-, 36- and 60-months. By contrast, the AUCs for the XGboost model at the same time intervals were 0.753 (0.528, 0.979), 0.668 (0.516, 0.820), and 0.715 (0.578, 0.852) as well as the Cox model were 0.828 (0.667, 0.989), 0.724 (0.586, 0.862), and 0.784 (0.668, 0.900), respectively (Figure 4). Moreover, the RSF model had the higher C-index in both the training [0.950 (0.928, 0.965) vs 0.790 (0.707, 0.847) vs 0.803 (0.723, 0.860), P < 0.001] and testing set [0.771 (0.667, 0.848) vs 0.683 (0.543, 0.784) vs 0.727 (0.615, 0.809), P < 0.001] (Table 3).
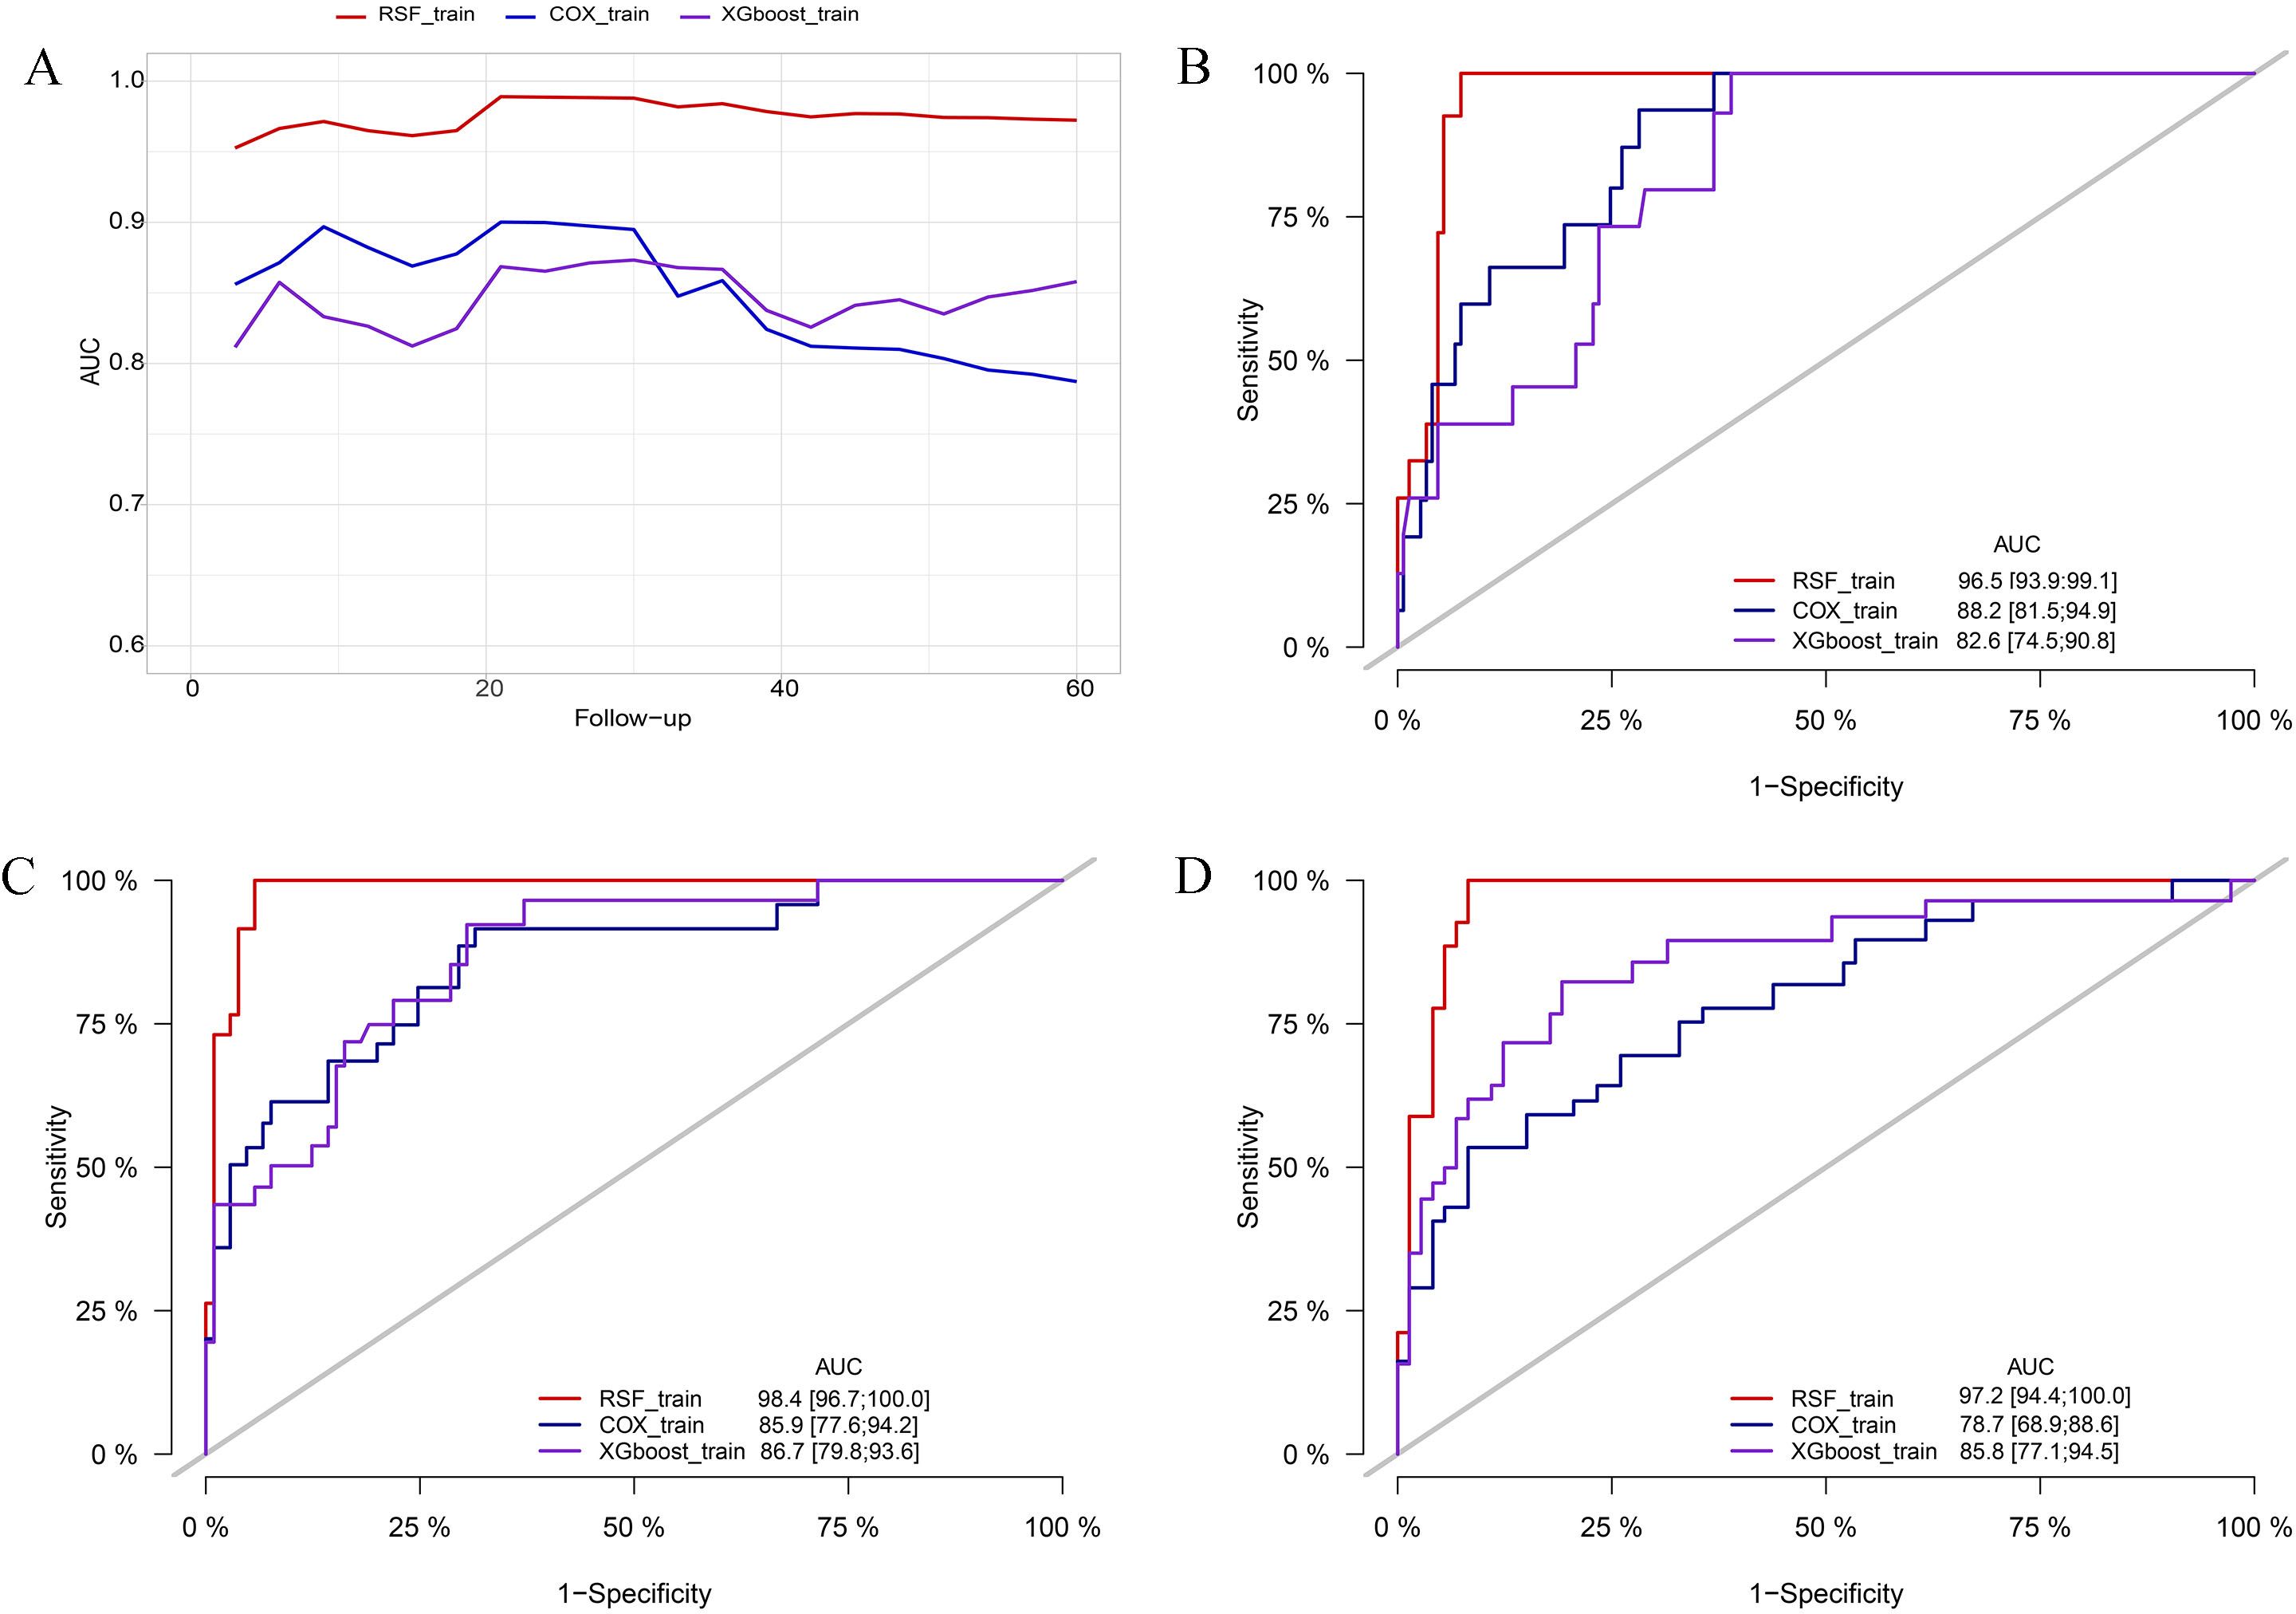
Figure 3. Comparison of AUC among the RSF, XGboost, and Cox model in the training cohort. (A) comparison of tAUC among the RSF, XGboost, and Cox model. (B) AUC at 12 months. (C) AUC at 36 months. (D) AUC at 60 months. tAUC, time-independent area under curve; RSF, random survival forest; XGboost, eXtreme Gradient Boosting; Cox, cox regression model; AUC, area under curve.
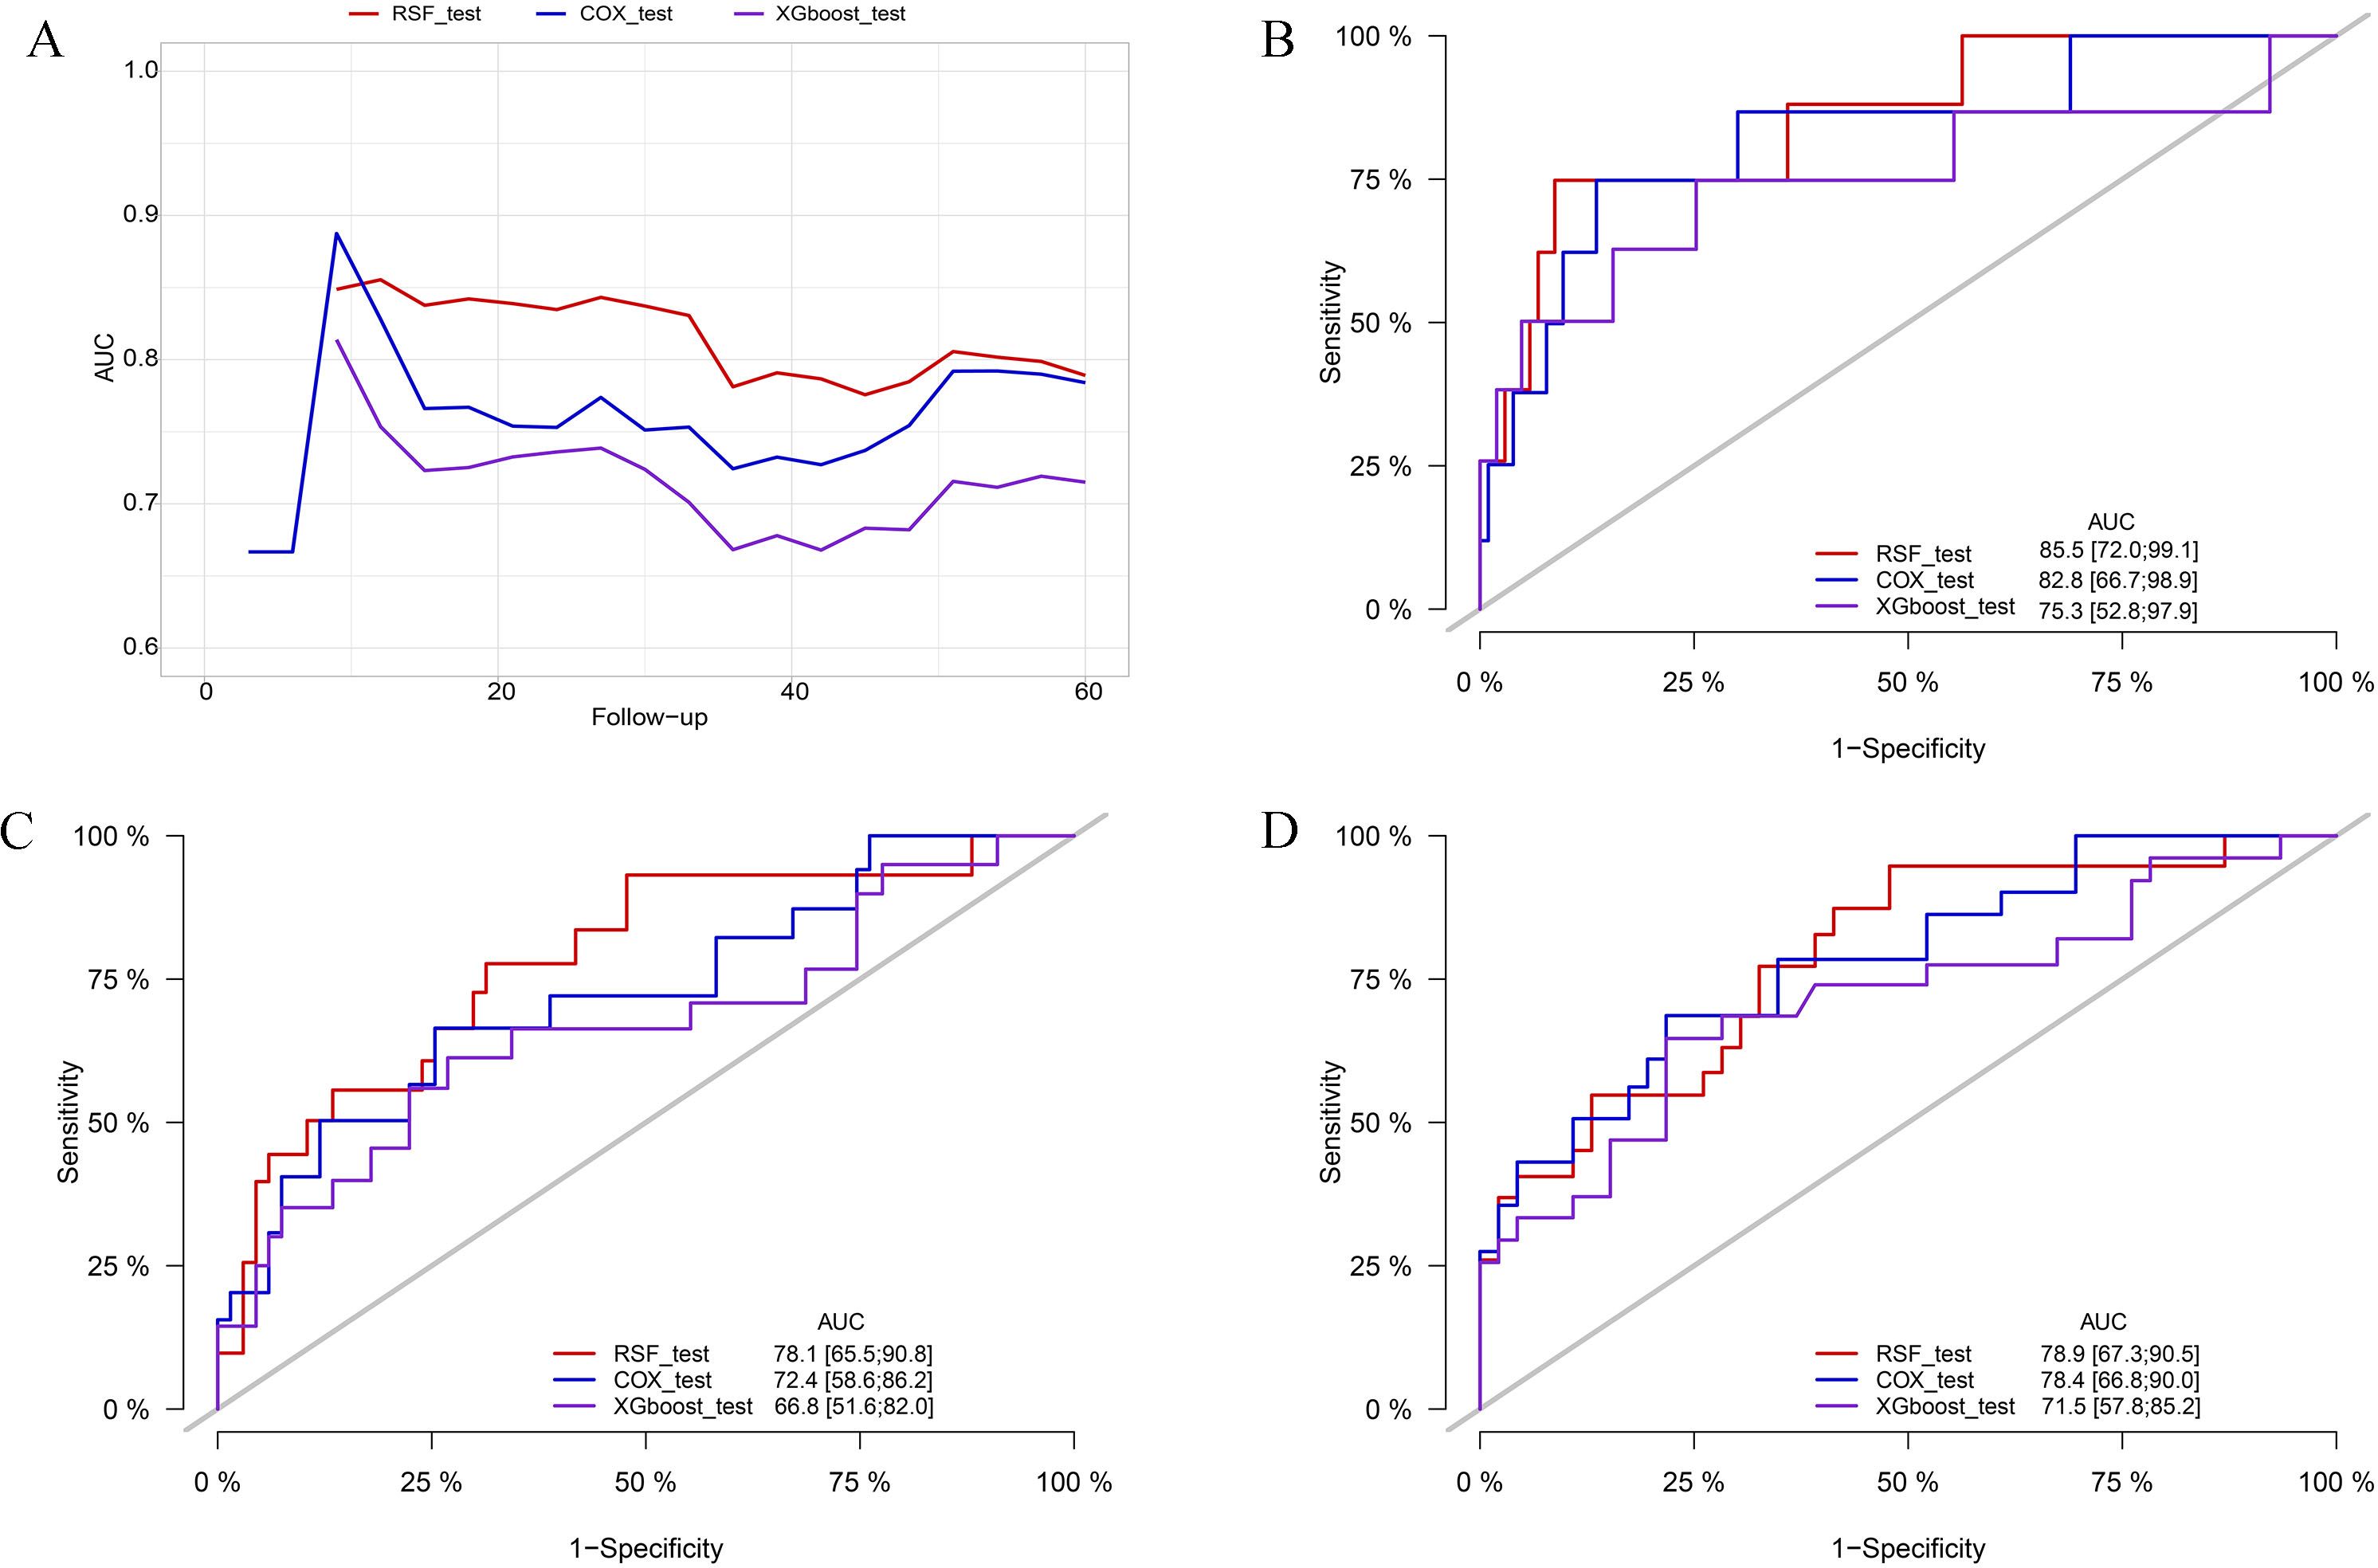
Figure 4. Comparison of AUC among the RSF, XGboost, and Cox model in the testing cohort. (A) comparison of tAUC among the RSF, XGboost, and Cox model. (B) AUC at 12 months. (C) AUC at 36 months. (D) AUC at 60 months. tAUC, time-independent area under curve; RSF, random survival forest; XGboost, eXtreme Gradient Boosting; Cox, cox regression model; AUC, area under curve.
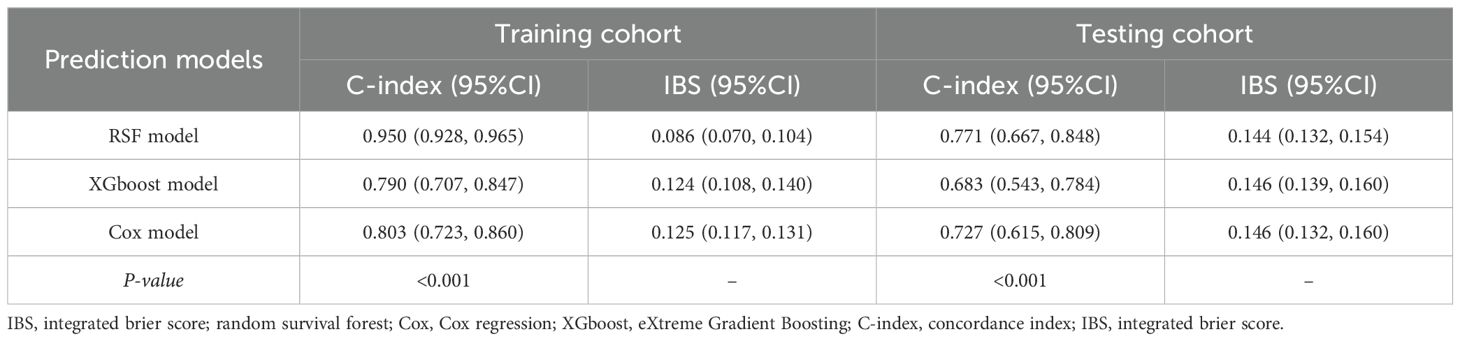
Table 3. The C-index and IBS score in the training and testing cohort.
3.4.2 Comparison of the calibration accuracy of the RSF, XGboost, and Cox model
The IBS was used to assess the calibration of RSF, XGboost, and Cox model. Among them, in the testing cohorts, the RSF model showed the lowest IBS with 0.144 (0.132, 0.154), followed by the XGboost model with an IBS of 0.146 (0.139, 0.160), and the Cox model with an IBS of 0.146 (0.132, 0.160) (Table 3). In addition, calibration plots of the RSF model demonstrated that the observed and predicted risks were generally concordant across the entire range of predicted risks, which validated the excellent performance of the RSF model (Supplementary Figure S3).
3.4.3 Comparison of prediction efficiency of RSF, XGboost, and Cox model
Compared with the Cox model, the categorical NRI of the RSF model for the 12-, 36-, and 60-months occurrence of combined events were 0.460 (0.137, 0.688), 0.375 (0.146, 0.591) and 0.357 (0.106, 0.557), respectively. For the XGboost model, the NRI values were -0.019 (-0.299, 0.196), -0.053 (-0.266, 0.055) and -0.092 (-0.295, 0.011). The RSF model had an IDI of 0.173 (0.064, 0.268), 0.182 (0.094, 0.264), and 0.158 (0.076, 0.230) at 12-, 36-, and 60-months, respectively. The XGboost model showed an IDI of 0.021 (-0.082, 0.121), -0.017 (-0.102, 0.059) and -0.023 (-0.104, 0.053). These results indicated that the RSF model exhibited superior predictive capability compare to the Cox model (Table 4).
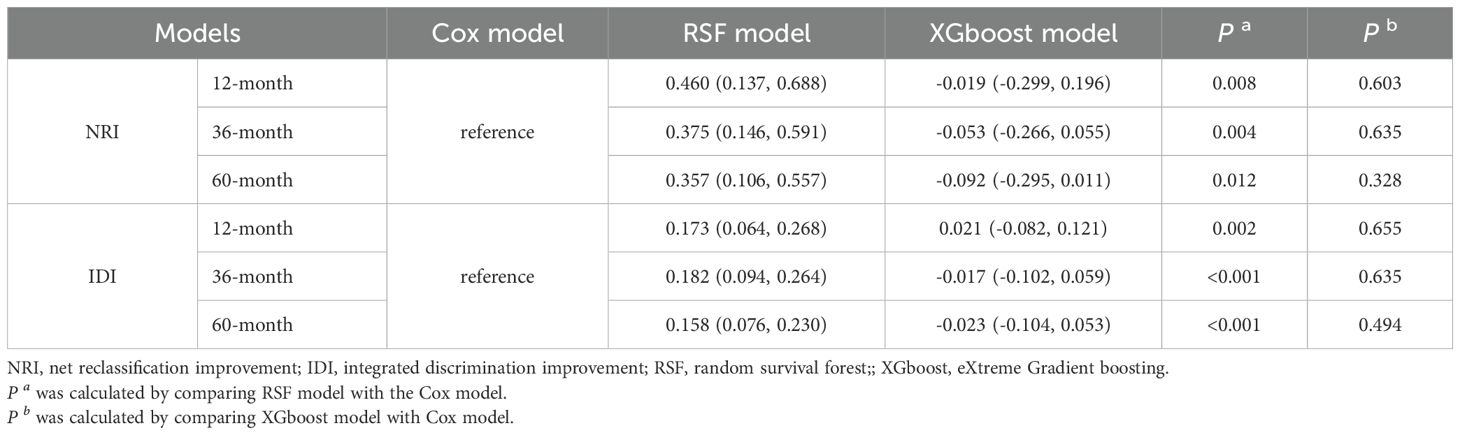
Table 4. NRI and IDI of prediction models compared with reference model.
3.4.4 Decision curve analysis of RSF, XGboost, and Cox model
The DCA offers a graphical representation to visualize the practical applicability of each model. As shown in Figure 5, the RSF model exhibits a higher net benefit than the XGboost model and Cox model across all threshold probabilities, including the 12-, 36-, and 60-month thresholds. This suggests that the RSF model may offer greater clinical benefit than the XGboost model and Cox model.
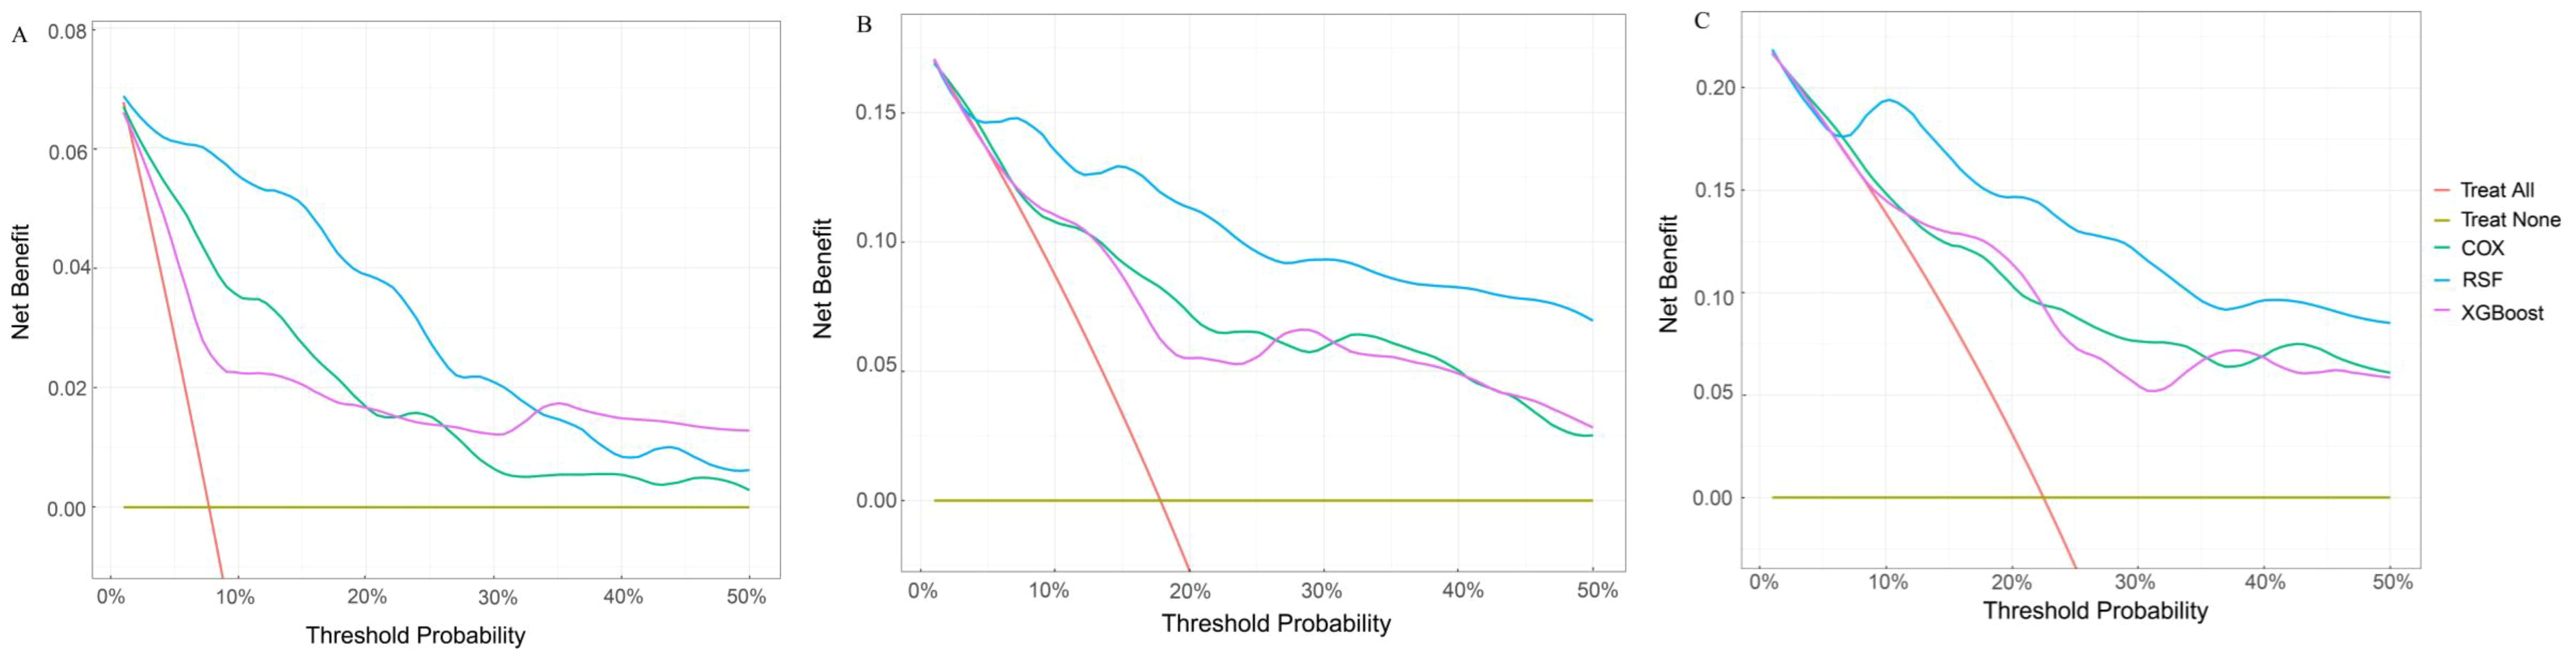
Figure 5. Comparison of DCA plots among the RSF, XGboost, and Cox model. (A) DCA plots at 12 months. (B) DCA plots at 36 months. (C) DCA plots at 60 months. DCA, decision curve analysis. The X-axis is the threshold probability for clinical intervention (range: 0-50%). Y-axis is the net benefit. The red line represents “treat all” that means the assumption that all patients receive intervention. The yellow line represents “treat none” representing the assumption that no patients receive intervention. The green line represents the Cox model. The blue line represents the RSF model. The purple line represents the XGBoost model. DCA, decision curve analysis; RSF, random survival forest; XGboost, eXtreme Gradient Boosting; Cox, cox regression model.
3.5 Renal outcomes of class IV ± V LN patients under CI scores
CI is the variable with the highest VIMP value following eGFR. To further assess the impact of kidney pathology on the patient renal outcomes, we conducted survival analyses stratified by CI scores. Based on the MSRSM (Supplementary Figure S4), the optimal cutoff value for the CI score was determined to be 4. Using this optimal cutoff value, patients with class IV ± V LN were categorized into high and low risk groups, and Kaplan-Meier survival curves revealed that patients with elevated CI scores exhibited a poorer renal prognosis (Figure 6).
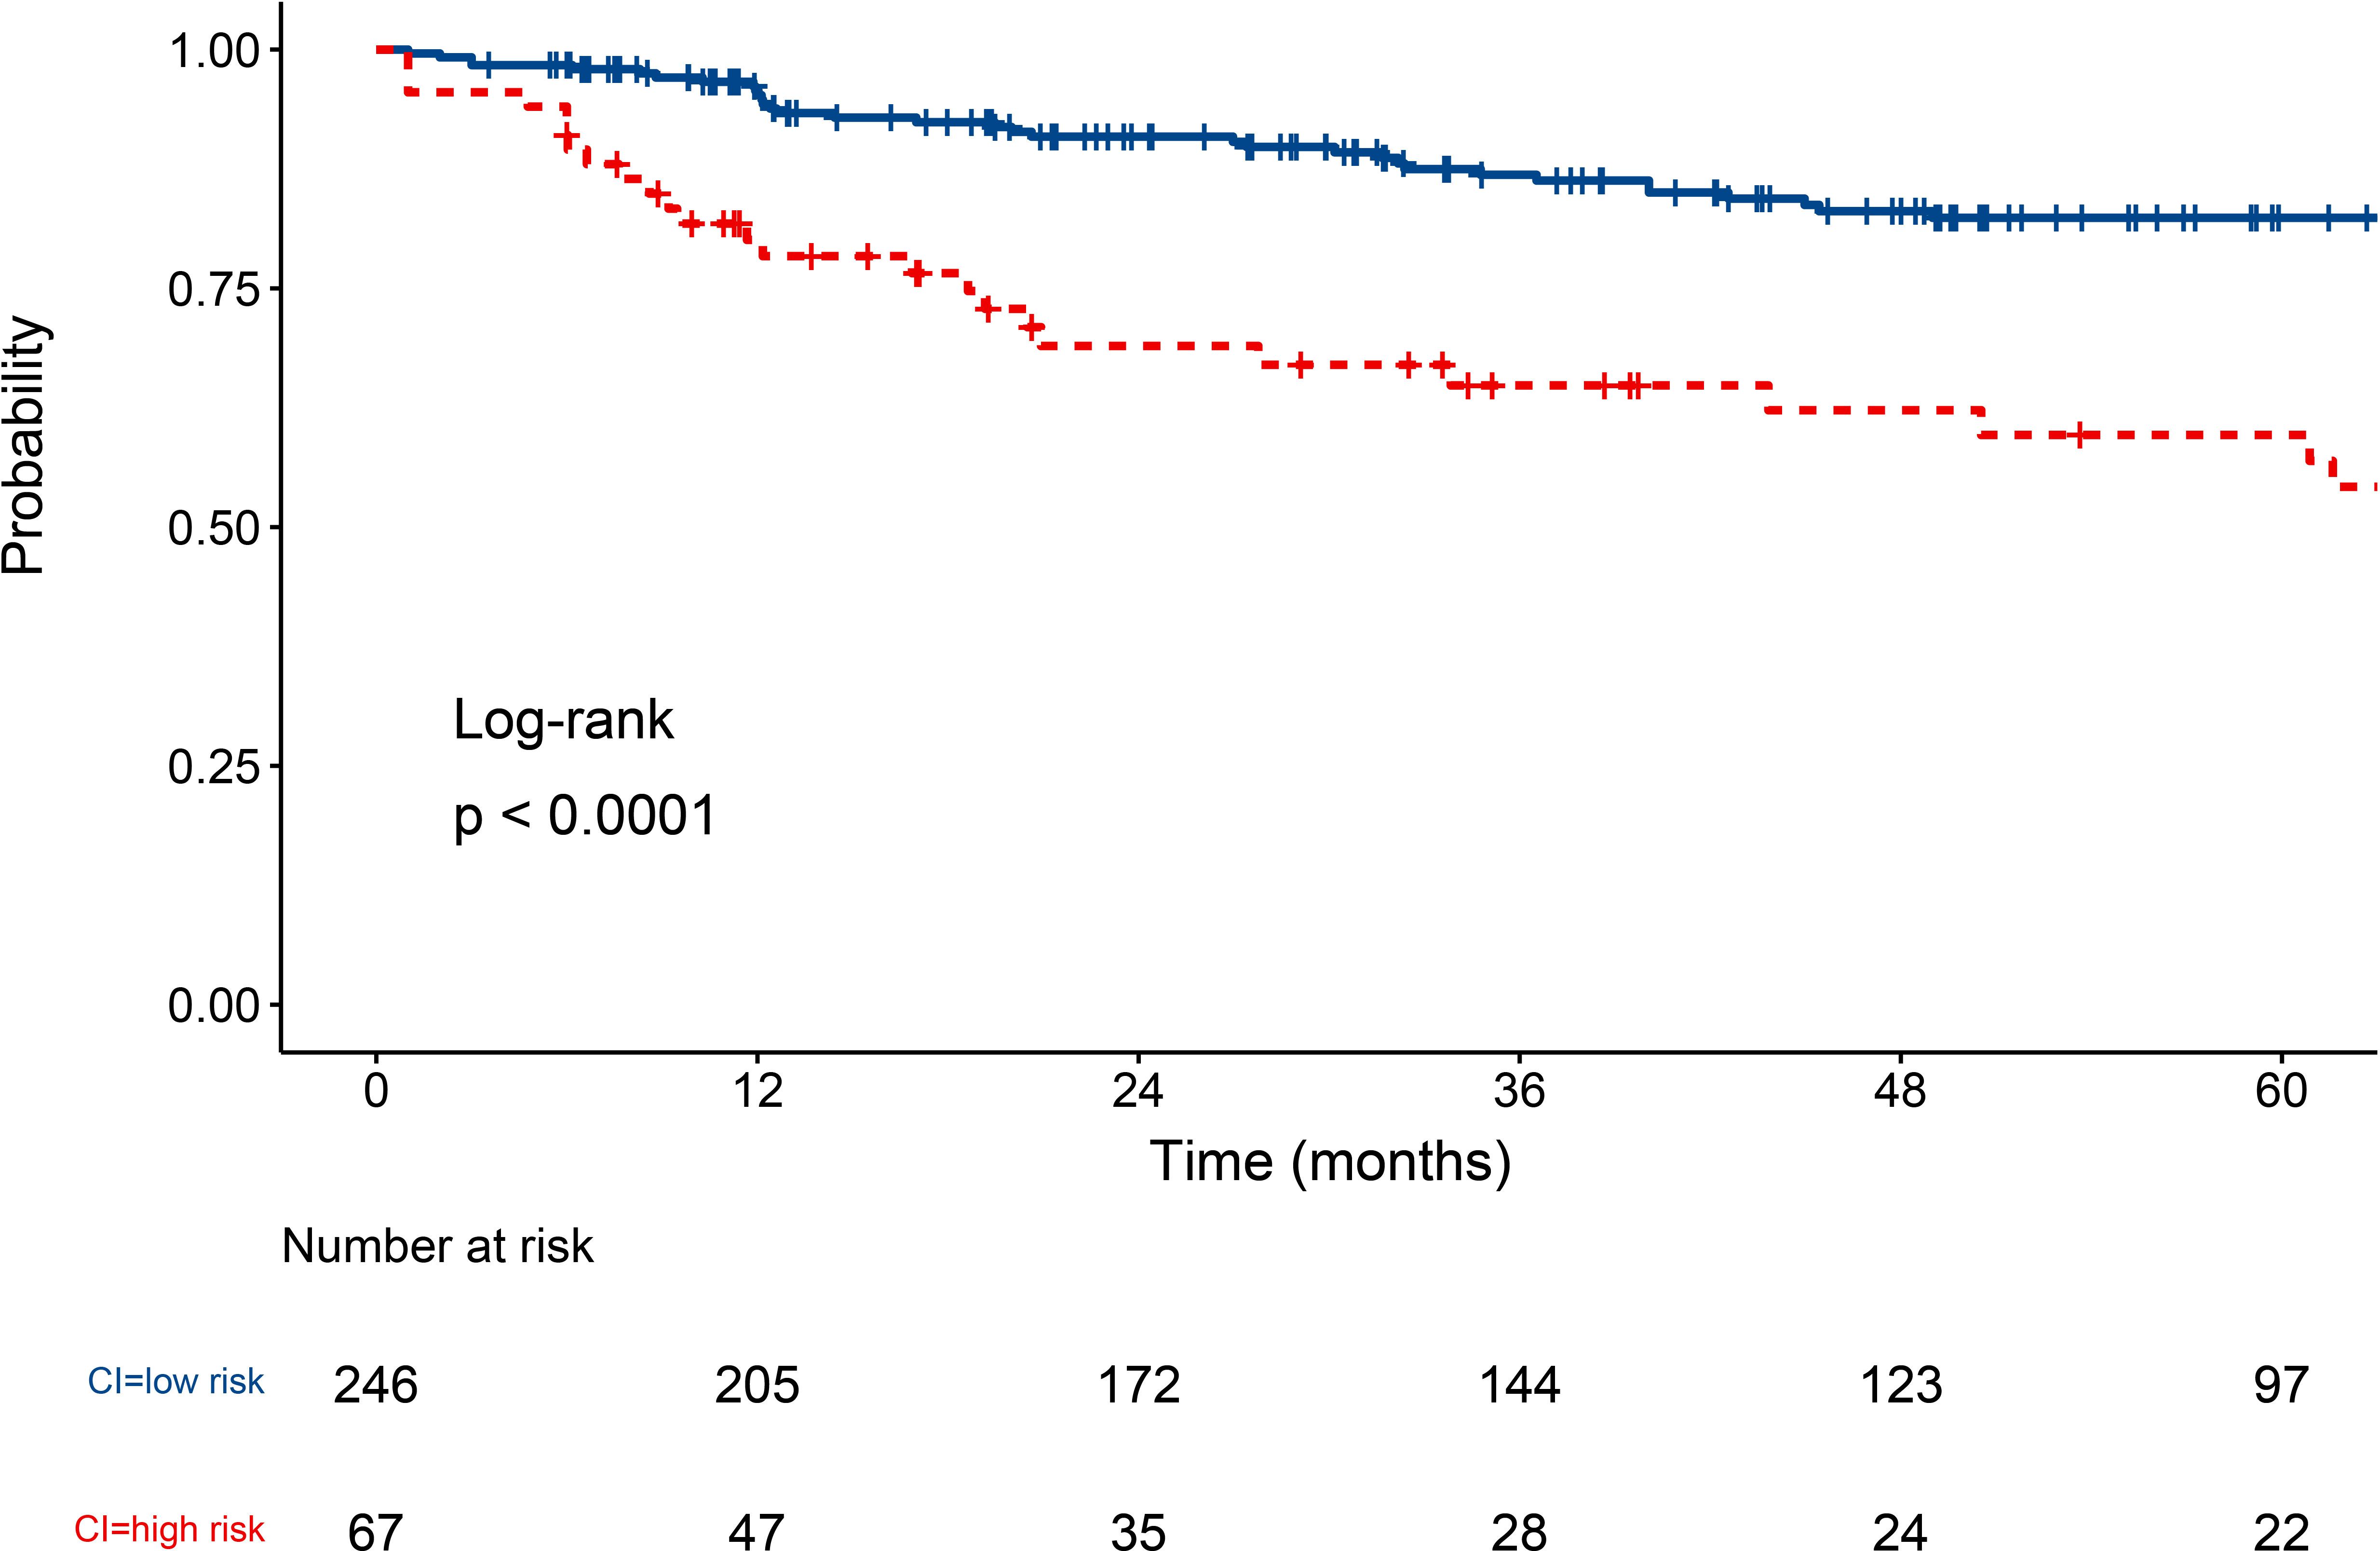
Figure 6. Survival curve of class IV ± V LN patients under CI score. LN, lupus nephritis; CI, chronic index.
4 Discussion
In this study, we conducted a comparative analysis of the clinical features between patients with class IV and IV+V LN, followed by survival analyses to assess the prognosis. Subsequently, we assessed the critical risk factors influencing the prognosis of class IV ± V LN who underwent renal biopsy over a nearly 10-year period and developed novel prognostic prediction models. Class IV ± V LN patients exhibit distinct pathological features, yet they demonstrate comparable clinical manifestations, treatment strategies, and long-term prognosis. eGFR, CI, age, BASO%, RBC, MAP, and UA were identified as the risk variables. In terms of discriminatory capability and clinical applicability, the RSF model showed superior predictive prowess compared to the XGboost and Cox regression models.
In this study, we hold that there is no difference in prognosis of class IV and IV+V LN patients. Indeed, previous studies comparing the prognosis between pure class IV and mixed class IV+V LN have yielded conflicting results. While some studies supported that class IV+V LN with significantly worse renal outcomes (12, 14, 30), others supported no statistically significant differences in renal survival between class IV and IV+V LN (13, 31). Most studies grouped class III/IV+V as “mixed proliferative” and class III/IV as “pure proliferative”, without isolating comparisons between class IV and IV+V LN. Moreover, small sample sizes or imbalanced proportions of mixed and pure proliferative LN cohorts, which may limit statistical power and result the different conclusion. In our study, we focused on class IV+V and IV LN patients and conducted a comparison of class IV+V and IV LN patients with a balanced cohort ratio (approximately 1:1), which can increase the reliability of the research results. We demonstrated that patients with class IV+V LN were found to be similar to those with class IV in terms of clinical manifestations, treatment strategies, and long-term prognosis, despite having more severe chronic kidney damage. These findings support the advice of the existing guidelines that the mixed proliferative LN should be managed similarly to pure proliferative LN (15). In addition, class IV LN patients tend to exhibit higher levels of albumin and BASO%, as well as lower levels of RBC and hemoglobin, which does not necessarily result in differences in the prognosis of class IV ± V LN patients. Therefore, class IV and class IV+V can be studied together and result in the same clinical management decision in clinical practice.
Our findings indicate that compared to the Cox and XGboost model, the RSF model exhibits strong robustness in predicting the progression of class IV ± V LN patients and provides more precise probability estimates over time. In terms of predictive accuracy, the RSF model demonstrates a higher C-index and AUC values. Additionally, the RSF model exhibits lower IBS, indicating superior calibration ability. Furthermore, the RSF model has higher NRI and IDI values, indicating superior discrimination ability. The RSF algorithm has the ability to mitigate overfitting through two random sampling processes, without the constraints of assumptions such as proportional hazards and log-linear relationships (32, 33). XGboost can train weak classifiers using the negative gradient information of the loss function, effectively preventing overfitting and improving model performance (34). Both XGboost and RSF have strong nonlinear variable processing capabilities (35). In contrast, the Cox model only identifies linear relationships (36). The exceptional performance of RSF can potentially be attributed to the underlying nonlinear relationships between variables and outcomes.
Analyzing the risk factors through the RSF prediction model has the potential to enhance disease management strategies and optimize patient prognosis. CI emerged as the most critical risk factor affecting the prognosis of patients with class IV ± V LN, independent of eGFR. The AI and CI scores of the NIH system are commonly employed as supplementary tools alongside the 2003 ISN/RPS-LN classification system (3). CI assesses the degree of chronicity of glomerular and tubulointerstitial lesions in renal tissue from LN patients in a semi-quantitative manner and has been recognized as a predictor of adverse renal outcome (37–40). In proliferative LN, chronic kidney damage can progress rapidly, even among patients who clinically appear to respond favorably to aggressive immunosuppressive therapy (41). Therefore, clinicians should pay greater attention to the CI score and tailor the therapeutic approach to the degree of chronic injury in order to preserve renal function and improve long-term prognosis. Furthermore, when stratifying risks based on CI scores, physicians can assess the survival prospects of patients, especially those in the high-risk group (CI > 4).
Age has been shown to be a primary factor associated with mortality in LN but not with ESRD (39, 42, 43). Notably, age emerged as an independent predictor of adverse prognosis in the class IV ± V LN patients, which may be attribute to the inclusion of mortality in the composite endpoints in this study.
BASO% was identified as a clinical predictor for the prognosis of class IV ± V patients in this study. BASO has been shown to be important contributors to the pathogenesis of SLE, particularly in the development of LN. During the pathogenesis of LN, BASO has the capability to intensify the production of autoantibodies, amplify the formation of immune complexes, and ultimately resulting in the deposition of these complexes within the kidney (44). Liang et al. observed that active LN often exhibits lower levels of circulating BASO counts, demonstrating an inverse relationship with pathological activity (45). Consequently, variations in BASO levels not only as a reliable indicator of LN activity, but also potentially offer pivotal clues for anticipating the long-term prognostic outcomes of LN.
MAP, RBC, and UA were similarly identified as predictors for the adverse outcome of class IV ± V LN patients in this study. Hypertension stands as a significant contributor to unfavorable renal outcomes in LN patients, and its presence heightens renal histologic activity and accelerates renal dysfunction (46–48). Therefore, blood pressure control is of significant importance for the long-term prognosis management of patients. Anemia has also been identified being associated with adverse outcome in LN (12, 49, 50). Tubulointerstitial lesions lead to reduced erythropoietin production, thereby decreasing RBC counts, which have been strongly correlated with renal prognosis (12, 51). Consequently, the RBC count has the potential to be a vital prognostic indicator for class IV ± V LN. Recently, it has been established that elevated serum UA (SUA) levels serve as an independent risk factor and predictor of unfavorable long-term outcomes among patients with LN, aligning with the results of this study (52–54). With each 100 μmol/L increase in SUA levels, the risk of ESRD or death increased by 10% (54). Therefore, monitoring SUA levels and early intervention have the potential to improve long-term outcomes in LN patients, especially those with class IV ± V LN.
Our RSF model offers several advantages over previous studies, which rely primarily on clinical and pathological factors to predict outcomes. These advantages include a more precise target population, broader background data, and more targeted outcomes. However, there are also some limitations to this study. Firstly, the relatively small sample size and the absence of external validation are the main constraints. To address these limitations, we plan to conduct a larger prospective study, enrolling a broader cohort of eligible patients to further validate our model. Additionally, as the patients included in this study were from China, further verification is required to assess the generalizability of our prediction model to other ethnic groups. Finally, our data collection was limited to basic information on treatment strategies and was incapable of evaluating the impact of treatment during the follow-up period. Despite treatment not being a prognostic variable in our study, additional investigations examining the impact of treatment may be warranted. Despite these limitations in this study, we maintain that our findings can provide valuable insights for initiating early therapeutic intervention and optimizing the long-term prognosis for patients suffering from class IV ± V LN.
5 Conclusion
Class IV ± V LN exhibit distinct pathological features, yet demonstrate comparable clinical manifestations, treatment strategies, and long-term prognosis. Therefore, this study is the first to identify the key risk factors (eGFR, CI, age, BASO%, RBC, MAP, and UA) that influence class IV ± V LN, and to establish ML models including the RSF and XGboost model, to compare with the Cox model. The RSF model exhibits superior survival prediction and provides more precise prognostic stratification. The implications of these findings have the potential to enhance clinical decision-making within medical practice, thus underscoring the necessity for rigorously designed studies to provide further validation.
Data availability statement
The datasets presented in this article are not readily available because The dataset contains personal health records, etc.], and is therefore subject to strict privacy and ethical restrictions. Access to the dataset is limited to authorized researchers who have obtained approval from ethics committee and comply with all relevant data protection regulations. Requests to access the datasets should be directed to c3Vuc2hpcmVuQG1lZG1haWwuY29tLmNu.
Ethics statement
The studies involving humans were approved by The Ethics Committee of Xijing Hospital (ethical number: KY20213027-1). The studies were conducted in accordance with the local legislation and institutional requirements. Written informed consent for participation was not required from the participants or the participants’ legal guardians/next of kin in accordance with the national legislation and institutional requirements.
Author contributions
AW: Writing – original draft. YQ: Writing – review & editing. YX: Writing – review & editing. ZY: Writing – review & editing. LH: Writing – review & editing. JY: Writing – review & editing. YH: Writing – review & editing. MH: Writing – review & editing. GX: Writing – review & editing. JZ: Writing – review & editing. SS: Writing – review & editing.
Funding
The author(s) declare that financial support was received for the research and/or publication of this article. National Natural Science Foundation of China grants (reference number: 82470735), Key Research and Development Plan of Shaanxi Province grant (reference number: No.2023-ZDLSF-15), Key Project of Shaanxi Province (2022ZDLSF03-12), and Booster project (reference number: XJZT24LY27) supported this study.
Acknowledgments
The authors would like to acknowledge all statisticians for participating in this study.
Conflict of interest
The authors declare that the research was conducted in the absence of any commercial or financial relationships that could be construed as a potential conflict of interest.
Generative AI statement
The author(s) declare that no Generative AI was used in the creation of this manuscript.
Publisher’s note
All claims expressed in this article are solely those of the authors and do not necessarily represent those of their affiliated organizations, or those of the publisher, the editors and the reviewers. Any product that may be evaluated in this article, or claim that may be made by its manufacturer, is not guaranteed or endorsed by the publisher.
Supplementary material
The Supplementary Material for this article can be found online at: https://www.frontiersin.org/articles/10.3389/fimmu.2025.1580146/full#supplementary-material
Supplementary Figure 1 | Parameter of developing RSF model. RSF, random survival forests.
Supplementary Figure 2 | Survival curve of class IV and IV+V LN patients. LN, lupus nephritis.
Supplementary Figure 3 | The calibration curve of the RSF model in the training cohorts and testing cohorts (A) calibration curve at 12 months. (B) calibration curve at 36 months. (C) calibration curve at 60 months. RSF, random survival forests. The red line represents the performance of RSF model in the training set with the blue line shows its error bars. The yellow line represents the performance of RSF model in the testing set with the green line shows its error bars.
Supplementary Figure 4 | The optimal cutoff value for CI by the MSRSM. CI, chronic index. MSRSM, Maximally Selected Rank Statistics Method.
References
1. Kiriakidou M and Ching CL. Systemic lupus erythematosus. Ann Intern Med. (2020) 172:ITC81–96. doi: 10.7326/AITC202006020
2. Owen KA, Grammer AC, and Lipsky PE. Deconvoluting the heterogeneity of SLE: The contribution of ancestry. J Allergy Clin Immunol. (2022) 149:12–23. doi: 10.1016/j.jaci.2021.11.005
3. Yu C, Li P, Dang X, Zhang X, Mao Y, and Chen X. Lupus nephritis: new progress in diagnosis and treatment. J Autoimmun. (2022) 132:102871. doi: 10.1016/j.jaut.2022.102871
4. Mohan C, Zhang T, and Putterman C. Pathogenic cellular and molecular mediators in lupus nephritis. Nat Rev Nephrol. (2023) 19:491–508. doi: 10.1038/s41581-023-00722-z
5. Mok CC. Towards new avenues in the management of lupus glomerulonephritis. Nat Rev Rheumatol. (2016) 12:221–34. doi: 10.1038/nrrheum.2015.174
6. Parikh SV, Almaani S, Brodsky S, and Rovin BH. Update on lupus nephritis: core curriculum 2020. Am J Kidney Dis. (2020) 76:265–81. doi: 10.1053/j.ajkd.2019.10.017
7. Mok CC, Teng YKO, Saxena R, and Tanaka Y. Treatment of lupus nephritis: consensus, evidence and perspectives. Nat Rev Rheumatol. (2023) 19:227–38. doi: 10.1038/s41584-023-00925-5
8. Anders HJ, Saxena R, Zhao MH, Parodis I, Salmon JE, and Mohan C. Lupus nephritis. Nat Rev Dis Primers. (2020) 6:7. doi: 10.1038/s41572-019-0141-9
9. Weening JJ, D’Agati VD, Schwartz MM, Seshan SV, Alpers CE, Appel GB, et al. The classification of glomerulonephritis in systemic lupus erythematosus revisited. Kidney Int. (2004) 65:521–30. doi: 10.1111/j.1523-1755.2004.00443.x
10. Yu F, Haas M, Glassock R, and Zhao MH. Redefining lupus nephritis: clinical implications of pathophysiologic subtypes. Nat Rev Nephrol. (2017) 13:483–95. doi: 10.1038/nrneph.2017.85
11. Weening JJ, D’Agati VD, Schwartz MM, Seshan SV, Alpers CE, Appel GB, et al. The classification of glomerulonephritis in systemic lupus erythematosus revisited. J Am Soc Nephrol. (2004) 15:241–50. doi: 10.1097/01.ASN.0000108969.21691.5D
12. Yang J, Liang D, Zhang H, Liu Z, Le W, Zhou M, et al. Long-term renal outcomes in a cohort of 1814 Chinese patients with biopsy-proven lupus nephritis. Lupus. (2015) 24:1468–78. doi: 10.1177/0961203315593166
13. Ahn SS, Yoo J, Lee SW, Song JJ, Park YB, and Jung SM. Clinical characteristics and long-term outcomes in patients with mixed Class III/IV + V and pure proliferative lupus nephritis: A single-center experience. Lupus. (2022) 31:588–95. doi: 10.1177/09612033221088437
14. Ikeuchi H, Hiromura K, Kayakabe K, Tshilela KA, Uchiyama K, Hamatani H, et al. Renal outcomes in mixed proliferative and membranous lupus nephritis (Class III/IV + V): A long-term observational study. Modern Rheumatol. (2016) 26:908–13. doi: 10.3109/14397595.2016.1158896
15. Kidney Disease: Improving Global Outcomes Lupus Nephritis Work G. KDIGO 2024 clinical practice guideline for the management of LUPUS NEPHRITIS. Kidney Int. (2024) 105:S1–S69. doi: 10.1016/j.kint.2023.09.002
16. Fanouriakis A, Kostopoulou M, Andersen J, Aringer M, Arnaud L, Bae SC, et al. EULAR recommendations for the management of systemic lupus erythematosus: 2023 update. Ann Rheum Dis. (2024) 83:15–29. doi: 10.1136/ard-2023-224762
17. Kang Y, Zuo Y, He M, Duo L, Chen X, and Tang W. Clinical predictive model to estimate probability of remission in patients with lupus nephritis. Int Immunopharmacol. (2022) 110:108966. doi: 10.1016/j.intimp.2022.108966
18. Dall’Era M, Cisternas MG, Smilek DE, Straub L, Houssiau FA, Cervera R, et al. Predictors of long-term renal outcome in lupus nephritis trials: lessons learned from the Euro-Lupus Nephritis cohort. Arthritis Rheumatol. (2015) 67:1305–13. doi: 10.1002/art.39026
19. Wolf BJ, Spainhour JC, Arthur JM, Janech MG, Petri M, and Oates JC. Development of biomarker models to predict outcomes in lupus nephritis. Arthritis Rheumatol. (2016) 68:1955–63. doi: 10.1002/art.39623
20. Ginzler EM, Felson DT, Anthony JM, and Anderson JJ. Hypertension increases the risk of renal deterioration in systemic lupus erythematosus. J Rheumatol. (1993) 20:1694–700. doi: 10.1016/S0950-3579(05)80070-6
21. Handelman GS, Kok HK, Chandra RV, Razavi AH, Lee MJ, and Asadi H. eDoctor: machine learning and the future of medicine. J Intern Med. (2018) 284:603–19. doi: 10.1111/joim.2018.284.issue-6
22. Tian D, Yan HJ, Huang H, Zuo YJ, Liu MZ, Zhao J, et al. Machine learning-based prognostic model for patients after lung transplantation. JAMA Netw Open. (2023) 6:e2312022. doi: 10.1001/jamanetworkopen.2023.12022
23. Hou N, Li M, He L, Xie B, Wang L, Zhang R, et al. Predicting 30-days mortality for MIMIC-III patients with sepsis-3: a machine learning approach using XGboost. J Transl Med. (2020) 18:462. doi: 10.1186/s12967-020-02620-5
24. Collins GS, Reitsma JB, Altman DG, and Moons KG. Transparent reporting of a multivariable prediction model for individual prognosis or diagnosis (TRIPOD): the TRIPOD statement. BMJ. (2015) 350:g7594. doi: 10.1161/CIRCULATIONAHA.114.014508
25. Inker LA, Eneanya ND, Coresh J, Tighiouart H, Wang D, Sang YY, et al. New creatinine- and cystatin C-based equations to estimate GFR without race. New Engl J Med. (2021) 385:1737–49. doi: 10.1056/NEJMoa2102953
26. Jia Q, Ma F, Zhao J, Yang X, Sun R, Li R, et al. Effect of corticosteroids combined with cyclophosphamide or mycophenolate mofetil therapy for IgA nephropathy with stage 3 or 4 chronic kidney disease: A retrospective cohort study. Front Pharmacol. (2022) 13:946165. doi: 10.3389/fphar.2022.946165
27. Bajema IM, Wilhelmus S, Alpers CE, Bruijn JA, Colvin RB, Cook HT, et al. Revision of the International Society of Nephrology/Renal Pathology Society classification for lupus nephritis: clarification of definitions, and modified National Institutes of Health activity and chronicity indices. Kidney Int. (2018) 93:789–96. doi: 10.1016/j.kint.2017.11.023
28. Ishwaran H, Kogalur UB, Blackstone EH, and Lauer MS. Random survival forests. Kidney Int. (2008) 2:18–28. doi: 10.1214/08-AOAS169
29. Qin Y, Yu Z, Wu H, Wang A, Wang F, Wang D, et al. Prognostic factors affecting long-term outcomes in patients with concurrent IgA nephropathy and membranous nephropathy. Heliyon. (2024) 10:e23436. doi: 10.1016/j.heliyon.2023.e23436
30. Najafi CC, K S, and EJ. L. Significance of histologic patterns of glomerular injury upon long-term prognosis in severe lupus glomerulonephritis. Kidney Int. (2001) 59:2156–63. doi: 10.1046/j.1523-1755.2001.00730.x
31. Ilori TO, Enofe N, Oommen A, Cobb J, Navarrete J, Adedinsewo DA, et al. Comparison of outcomes between individuals with pure and mixed lupus nephritis: A retrospective study. PloS One. (2016) 11:e0157485. doi: 10.1371/journal.pone.0157485
32. Taylor JM. Random survival forests. J Thorac Oncol. (2011) 6:1974–5. doi: 10.1097/JTO.0b013e318233d835
33. Zhou Y and McArdle JJ. Rationale and applications of survival tree and survival ensemble methods. Psychometrika. (2015) 80:811–33. doi: 10.1007/s11336-014-9413-1
34. Barnwal A, Cho HS, and Hocking T. Survival regression with accelerated failure time model in XGBoost. J Comput Graph Stat. (2022) 31:1292–302. doi: 10.1080/10618600.2022.2067548
35. Zheng J, Li J, Zhang Z, Yu Y, Tan J, Liu Y, et al. Clinical Data based XGBoost Algorithm for infection risk prediction of patients with decompensated cirrhosis: a 10-year (2012-2021) Multicenter Retrospective Case-control study. BMC Gastroenterol. (2023) 23:310. doi: 10.1186/s12876-023-02949-3
36. Yao W, Frydman H, Larocque D, and Simonoff JS. Ensemble methods for survival function estimation with time-varying covariates. Stat Methods Med Res. (2022) 31:2217–36. doi: 10.1177/09622802221111549
37. Austin HA 3rd, Boumpas DT, Vaughan EM, and Balow JE. Predicting renal outcomes in severe lupus nephritis: contributions of clinical and histologic data. Kidney Int. (1994) 45:544–50. doi: 10.1038/ki.1994.70
38. Moroni G, Pasquali S, Quaglini S, Banfi G, Casanova S, Maccario M, et al. Clinical and prognostic value of serial renal biopsies in lupus nephritis. Am J Kidney Dis. (1999) 34:530–9. doi: 10.1016/S0272-6386(99)70082-X
39. Moroni G, Vercelloni PG, Quaglini S, Gatto M, Gianfreda D, Sacchi L, et al. Changing patterns in clinical-histological presentation and renal outcome over the last five decades in a cohort of 499 patients with lupus nephritis. Ann Rheum Dis. (2018) 77:1318–25. doi: 10.1136/annrheumdis-2017-212732
40. Parodis I, Adamichou C, Aydin S, Gomez A, Demoulin N, Weinmann-Menke J, et al. Per-protocol repeat kidney biopsy portends relapse and long-term outcome in incident cases of proliferative lupus nephritis. Rheumatol (Oxford). (2020) 59:3424–34. doi: 10.1093/rheumatology/keaa129
41. Malvar A, Pirruccio P, Alberton V, Lococo B, Recalde C, Fazini B, et al. Histologic versus clinical remission in proliferative lupus nephritis. Nephrol Dial Transplant. (2017) 32:1338–44. doi: 10.1093/ndt/gfv296
42. Rodriguez-Almaraz E, Gutierrez-Solis E, Rabadan E, Rodriguez P, Carmona L, Morales E, et al. Something new about prognostic factors for lupus nephritis? A systematic review. Lupus. (2021) 30:2256–67. doi: 10.1177/09612033211061475
43. Tang Y, Zhang X, Ji L, Mi X, Liu F, Yang L, et al. Clinicopathological and outcome analysis of adult lupus nephritis patients in China. Int Urol Nephrol. (2015) 47:513–20. doi: 10.1007/s11255-014-0903-y
44. Charles N, Chemouny JM, and Daugas E. Basophil involvement in lupus nephritis: a basis for innovation in daily care. Nephrol Dial Transplant. (2019) 34:750–6. doi: 10.1093/ndt/gfy245
45. Liang P, Tang Y, Lin L, Zhong H, Yang H, Zeng Y, et al. Low level of circulating basophil counts in biopsy-proven active lupus nephritis. Clin Rheumatol. (2018) 37:459–65. doi: 10.1007/s10067-017-3858-4
46. Sethi S, De Vriese AS, and Fervenza FC. Acute glomerulonephritis. Lancet. (2022) 399:1646–63. doi: 10.1016/S0140-6736(22)00461-5
47. Gao C, Bian X, Wu L, Zhan Q, Yu F, Pan H, et al. A nomogram predicting the histologic activity of lupus nephritis from clinical parameters. Nephrol Dial Transplant. (2024) 39:520–30. doi: 10.1093/ndt/gfad191
48. Shaharir SS, Mustafar R, Mohd R, Mohd Said MS, and Gafor HA. Persistent hypertension in lupus nephritis and the associated risk factors. Clin Rheumatol. (2015) 34:93–7. doi: 10.1007/s10067-014-2802-0
49. Ikeuchi H, Sugiyama H, Sato H, Yokoyama H, Maruyama S, Mukoyama M, et al. A nationwide analysis of renal and patient outcomes for adults with lupus nephritis in Japan. Clin Exp Nephrol. (2022) 26:898–908. doi: 10.1007/s10157-022-02232-x
50. Shayakul C, Ong-aj-yooth L, Chirawong P, Nimmannit S, Parichatikanond P, Laohapand T, et al. Lupus nephritis in Thailand: clinicopathologic findings and outcome in 569 patients. Am J Kidney Dis. (1995) 26:300–7. doi: 10.1016/0272-6386(95)90650-9
51. Guo Q, Lu X, Miao L, Wu M, Lu S, and Luo P. Analysis of clinical manifestations and pathology of lupus nephritis: a retrospective review of 82 cases. Clin Rheumatol. (2010) 29:1175–80. doi: 10.1007/s10067-010-1517-0
52. Dos Santos M, Veronese FV, and Moresco RN. Uric acid and kidney damage in systemic lupus erythematosus. Clin Chim Acta. (2020) 508:197–205. doi: 10.1016/j.cca.2020.05.034
53. Ugolini-Lopes MR, Gavinier SS, Leon E, Viana VT, Borba EF, and Bonfa E. Is serum uric acid a predictor of long-term renal outcome in lupus nephritis? Clin Rheumatol. (2019) 38:2777–83. doi: 10.1007/s10067-019-04620-3
Keywords: lupus nephritis, class IV ± V, machine learning, risk factors, prognostic model
Citation: Wang A, Qin Y, Xing Y, Yu Z, Huang L, Yuan J, Hui Y, Han M, Xu G, Zhao J and Sun S (2025) Clinical characteristics, prognosis, and predictive modeling in class IV ± V lupus nephritis. Front. Immunol. 16:1580146. doi: 10.3389/fimmu.2025.1580146
Received: 20 February 2025; Accepted: 17 April 2025;
Published: 15 May 2025.
Edited by:
Qingjun Pan, Affiliated Hospital of Guangdong Medical University, ChinaReviewed by:
Swee Ping Tang, Hospital Selayang, MalaysiaPatrick Cunningham, The University of Chicago, United States
Copyright © 2025 Wang, Qin, Xing, Yu, Huang, Yuan, Hui, Han, Xu, Zhao and Sun. This is an open-access article distributed under the terms of the Creative Commons Attribution License (CC BY). The use, distribution or reproduction in other forums is permitted, provided the original author(s) and the copyright owner(s) are credited and that the original publication in this journal is cited, in accordance with accepted academic practice. No use, distribution or reproduction is permitted which does not comply with these terms.
*Correspondence: Shiren Sun, c3Vuc2hpcmVuQG1lZG1haWwuY29tLmNu; Jin Zhao, emhqX3NwZWNpYWxAMTYzLmNvbQ==
†These authors have contributed equally to this work and share first authorship