 Teodor Jové-Juncà1
 Daniel Crespo-Piazuelo1,2
 Carles Hernández-Banqué1
 Olga González-Rodríguez1
 Lingzhao Fang3
 Raquel Quintanilla1*
 Maria Ballester1*
- 1Animal Breeding and Genetics Program, Institute of Agrifood Research and Technology (IRTA), Torre Marimon, Caldes de Montbui, Spain
- 2R&D Department, Cuarte S.L., Monzalbarba, Spain
- 3Center for Quantitative Genetics and Genomics, Aarhus University, Aarhus, Denmark
Genome wide association studies (GWAS) have been widely used to investigate the association of genetic markers with complex traits in both humans and livestock species. A particular trait of interest, when studying animal robustness and general immunocompetence, is the transcriptomic profile of blood. To identify genetic variants affecting gene expression in pig blood, we performed expression GWAS (eGWAS) in 255 animals from a commercial Duroc population between 8,499,177 imputed single nucleotide polymorphisms (SNPs) and the expression levels of 14,642 genes obtained from RNA sequencing. Out of the nearly 125 million associations tested, 23 million were found to be significant, grouped in 9,930 expression quantitative trait loci (eQTLs) associated to the expression levels of 6,051 genes. Over 36% of detected eQTLs mapped in close proximity to the genomic location of their associated gene and were classified as cis-eQTLs. Moreover, 430,694 variants were found to be associated with the expression of 10 or more different genes and were annotated as transcriptional hotspots. Among genes regulated by these hotspots, we identified genes that encode transcription factors and co-factors regulating immune responses, such as ARNT, or co-expressed genes related to immunity (CSF3R, JAK2, SOCS3, STAT5B and UBE2D1) and associated with health traits, such as phagocytic activity or haptoglobin concentration. In addition, several of the cis-regulating variants for immunity candidate genes overlapped with previously described immunity QTLs. Colocalization studies revealed putative common causal variants between the proportion of memory and helper T cells and the candidate genes CLEC12B, IGKV2D, KLRC1, KLRD1 and ZAP70. In conclusion, the associations identified in this study enable the characterization of transcriptional regulators of the pig blood transcriptome. Moreover, the colocalization between immunity QTLs and eQTLs has revealed potential causative mutations regulating immunocompetence in pigs. All these data and results contribute to shedding light on the regulatory mechanisms of blood gene expression and porcine immune regulation.
Introduction
Genome-wide association studies (GWAS) have been widely applied to study the association between genetic variants and a multitude of phenotypes, including disease incidence in humans or traits related to production performance and animal health in livestock. However, GWAS results showed that the majority of phenotype-associated variants are located in non-coding regions (1), affecting uncharacterized regulatory elements and thus potentially impacting gene expression (1–3). The study of gene expression as an intermediate phenotype is expected to improve the understanding of the relationship between genomic variation and conventional phenotypes (4). Expression Genome Wide Association Studies (eGWAS) are commonly used to find associations between genomic variation and gene expression levels. Genomic regions associated with gene expression are called expression Quantitative Trait Loci (eQTL). If an eQTL is very close to the genomic location of its associated gene, generally less than 1 Mb, it is classified as cis-eQTL. Otherwise, they are classified as trans-eQTLs (5, 6). Furthermore, genetic variants associated with the expression levels of multiple transcripts, known as transcriptional hotspots, can potentially be key regulators of biological pathways.
In pigs, a number of eGWAS have been carried out using gene-expression microarrays data or a limited set of expressed genes and low-density genotyping arrays (7–12). Nowadays, a combined whole genome and RNA-sequencing (RNA-seq) approach allows much more in-depth analyses (6, 13). Transcriptome datasets from RNA-seq typically encompass about 13,000 genes, which, combined with a vast amount of genotypic data, can result in the identification of thousands of associations between genomic variants and the transcriptome (5). Cis-eQTLs have been regularly prioritized over trans-eQTLs due to their putative local effect, lower complexity, and larger effect size (4, 5, 14, 15). Traditionally, causal variants affecting gene expression have been searched in upstream regions from the transcription start site (TSS) due to their potential role in promoters or enhancers. However, the potential regulatory effects of cis-regulatory variants located in the 3’UTR and trans-regulatory elements should not be ruled out (6).
Recently, several studies have improved the understanding of gene expression regulation mechanisms in livestock (6, 13, 16). Initiatives like FarmGTEx (17) or FAANG (Functional Annotation of Animal Genomes) (18) pursue further characterization of gene regulation in farm animals. Peripheral blood transcriptome reflects variations in immune capacity and represents a valuable source of information for identifying biomarkers associated with immunity traits. Characterizing the swine blood transcriptomic profile could enhance our understanding of immune regulation. Furthermore, the functional annotation of the porcine blood transcriptome could facilitate the identification of regulatory markers useful in genomic selection programs aimed at improving sustainability, productivity, and animal health. The characterization of the porcine expression profile could also hold implications for other species, given the pig’s role as a model for studying human diseases and biology. Both species share similarities in physiology, immunity, genome (19, 20), as well as in gene expression profiles (21–23).
In the present work, we aimed to characterize regulatory elements in the pig blood transcriptome and study its association with the expression levels of candidate genes related to immunity traits.
Materials and methods
Ethics statement
All procedures involving living animals in this study were performed in compliance with the Spanish Policy of Animal Protection RD 53/2013 under the European Union Directive 2010/63/EU regulating the use of animals in experimentation. All protocols performed were approved by the Ethical Committee of the Institut de Recerca i Tecnologia Agroalimentàries (IRTA).
Animal material
A commercial Duroc population consisting of 255 healthy piglets (129 females and 126 males) aged 60 ± 8 days was used. Animals belonged to six commercial batches, each containing between 37 and 46 animals. Two to four animals were selected from each litter balancing sex when possible. Animals were raised in the same farm and fed an ad libitum cereal-based commercial diet. Blood parameters and in-situ physical assessments indicated that the pigs in this study were physically healthy, showing no signs of immunosuppression, subclinical infection, acute stress, or acute/chronic inflammatory responses. Their immunocompetence was within the expected 95% confidence interval (24–26).
Blood was collected via the external jugular vein into vacutainer tubes with anticoagulants (Sangüesa S.A., Spain) and Tempus™ Blood RNA tubes (Thermo Fisher Scientific, Spain) to stabilize the RNA. All samples were transported with ice blocks to the laboratory and stored for further processing at -20°C (for DNA extraction) or -80°C (for RNA extraction).
Genotyping and imputation
Genomic DNA was extracted from blood samples using NucleoSpin Blood (Macherey-Nagel, Germany). DNA concentration and purity were measured using a Nanodrop ND-1000 spectrophotometer. Genotyping was performed with the GGP Porcine HD Array (Illumina, San Diego, CA) using the Infinium HD Assay Ultra protocol (Illumina). Plink v1.90b3.42 software (27) was used to remove SNPs with a minor allele frequency below 5% and SNPs with more than 10% missing genotypes. SNPs that did not map to the porcine reference genome (Sscrofa11.1 assembly) were also removed. A total of 42,641 SNPs remained for further analysis.
From this dataset, genotype imputation to sequence level was performed using a multi-breed Pig Genomics Reference Panel (PGRPv1) from PigGTEx (13), consisting of 1,602 whole genome sequence samples covering over 100 pig breeds. A total of 42M autosomal biallelic SNPs were imputed using Beagle v5.1 (28). After filtering out variants for dosage R-squared below 0.8 and minor allele frequency below 5%, a total of 8,499,177 SNPs remained for further analysis.
Linkage disequilibrium (LD) analyses were performed with Plink v1.90b3.42 to obtain the number of independent variants in the study. A 0.5 Mb window was used with a cut-off value of r2 = 0.7 and a sidestep of 10 SNPs. A total of 118,571 independent variants remained.
RNA sequencing and mapping
Whole-blood RNA was extracted using Tempus™ Spin RNA Isolation Reagent Kit (Thermo Fisher Scientific, Spain). Total RNA concentration was measured using Nanodrop ND-1000 spectrophotometer. Purity and integrity of RNA was measured using Fragment Analyzer equipment (Agilent Technologies Inc., Santa Clara, CA). All samples had RNA integrity number (RIN) values above 8. Libraries were prepared using the Stranded Total RNA with Ribo-Zero Plus rRNA depletion (Illumina) which removes rRNAs and globin RNAs.
RNA blood samples were sequenced with a depth of >55 M paired end (PE) reads (2 x 150 bp) in an Illumina NovaSeq6000 platform at Centro Nacional de Análisis Genómico (CNAG-CRG, Barcelona, Spain). Quality of RNA sequence reads was assessed with the FastQC software (29). RNA sequences were mapped against the reference genome (Sscrofa11.1 assembly) and the Ensembl Genes 109 annotation database using STAR 2.75.3a software (30). Quantification was performed using RSEM 1.3.0 software (31).
Counts were normalized using the EdgeR R package (32) with the trimmed mean of M-values methodology and transformed to counts per million (cpm) using log2 with the cpm function. To avoid artefacts, raw counts with a value of 0 were defined as NA. To filter lowly expressed transcripts, a filter similar to the one used by Crespo-Piazuelo et al. (6) was applied. Only genes with cpm above 10/minimum library size in millions (i.e. cpm > 0.69) in more than 35% of the samples were retained. Normality was checked using Shapiro-Wilk test to each expressed gene using a leave-one-out approach. Outliers were removed using this methodology. A total of 14,642 genes remained after filtering.
Expression genome wide association studies
eGWAS analyses were performed between the normalized expression data and the 8,499,177 SNPs from the imputed data with the fastGWA tool from GCTA 1.93.2 (33), using the following model to estimate the effect of each SNP on the expression level for all expressed genes
where Y is the vector containing the expression level for a particular gene of all individuals of the analyzed population; β stands for the vector of systematic effects sex and batch, being X the incidence matrix; g corresponds to the vector of infinitesimal genetic effects of each individual (and Z the incidence matrix), with distribution , being G the genomic relationship matrix calculated as described in Yang et al. (33) and σ2g the additive genetic variance; Sl is the vector of genotypes for the lth SNP, coded as 0, 1, 2, and al the SNP allele substitution effect; and finally e is the vector of residuals.
Multiple testing correction was performed using the Bonferroni method (34). Due to the high linkage disequilibrium detected in the study population, the number of independent tests had to be calculated to avoid overcorrection. As such, the 118,571 independent SNPs were used to compute a significance threshold of p adjust<0.05 (p-value<4.217x10⁻⁷).
Significantly associated variants were classified as cis- or trans- in reference to their genomic location respective of the location of their associated gene. Since a drop in LD score was observed at a distance of 1 Mb between variants, SNPs within the 1Mb window from their associated gene were considered to have a local effect on gene expression and were classified as cis. Variants outside this window were classified as trans-associated variants.
Functional predictions of the significant polymorphisms were performed with the Variant Effect Predictor (VEP) tool (35) on the Ensembl genes 109 annotation database. Significant variants were mapped against the mammalian conserved regions identified by Genomic Evolutionary Rate Profiling from multiple sequence alignments of 103 different mammal species (36).
Expression quantitative trait loci
eQTL regions were defined by grouping consecutive polymorphisms that were significantly associated with the same gene and located less than 1 Mb apart from each other. To reduce the number of false positives, only eQTLs with a minimum of 3 significantly associated polymorphisms were retained. Then, eQTL regions were extended 0.5Mb on each side in order to take surrounding genetic features in consideration during further analyses. Gene positions were extracted with the Biomart tool (37) from the Ensembl genes 109 database. Similarly to significant variants, eQTL regions were annotated as cis-eQTL when significant polymorphisms were located within less than 1Mb from their associated gene, whereas the remaining significant regions were considered as trans-eQTL. All genes whose expression was associated with an eQTL were subjected to functional annotation through pathway analysis using the ClueGO Cytoscape plugin (38), in order to identify candidate genes involved in immune-related functions.
Colocalization studies
In previous studies by Ballester et al. (25, 39) in the same Duroc population, health-related phenotypes were measured from blood, saliva and hair samples extracted at 60 ± 8 days of age. GWAS analyses were performed between the 42,641 SNPs genotyped with the GGP Porcine HD Array (Illumina, San Diego, CA) and 40 health-related traits including immunity traits (25, 39).
As a first approach to identify regulatory regions associated with both immunity phenotypes and gene expression levels, health-related QTLs located on autosomal chromosomes were overlapped with cis-eQTLs. Among genes regulated by the overlapping cis-eQTLs, candidate genes related to the QTL phenotype were identified using Gene Ontology annotation.
The SNPs associated to both health traits and the expression levels of candidate genes were proposed as putative regulators of immunity. To further assess possible causal variants shared between health QTLs and blood eQTLs, as well as to discriminate between variants within the same cis-eQTLs, the coloc-R package version 5 (40) was used. This software uses Bayesian testing and needs to be run between GWAS-like studies with the same variant panel. Therefore, GWAS for the health-related phenotypes were repeated using the imputed 8,499,177 SNPs panel developed in this work. GWAS were performed using a similar model than the one used for eGWAS:
Where Yp, was the vector of individual for any health-related trait, and the rest of terms were as described above. The fixed effects considered in β differed across traits according to those used by Ballester et al. (25, 39).
We used the coloc.abf function for the region encompassing both the QTL and eQTL studied. For each pair, four different hypotheses were tested and contrasted with the null hypotheses H0 (no causal SNPs for gene expression nor for the trait), H1 considered causal SNPs only for gene expression, H2 considered causal SNPs only for the health-related trait, H3 considered two different causal SNPs for each trait, and H4 considered a common causal regulator for both. Colocalization was considered to occur when the posterior probability of H4 was greater than 0.95.
Coloc output reported the posterior probability of H4, i.e. having a common regulator for both regions, as well as a list of shared potential causal variants. VEP software was used to map putative common causal variants. SNPs mapped inside regulatory regions (e.g., enhancers and upstream variants) were selected as potential candidates for gene expression regulation. A computer-assisted identification of putative transcription factors binding sites (TFBSs) disrupted by these variants was performed. A genomic sequence of 100 bp surrounding each candidate variant was extracted from Ensembl (pig reference genome Sscrofa11.1). Two sequences for each variant, corresponding to the reference and alternative alleles, were uploaded to the FIMO software from the MEME suite (41) with default parameters, along with a list of motifs corresponding to mammalian TFBSs obtained from the Jaspar database (42). Alignments between TFBSs and sequences containing candidate regulatory mutations with a p-value inferior to 0.001 were selected as significative. TFBSs of transcription factors (TFs) related to immunity, according to Gene Ontology database, were prioritized. The common causal variants affecting TFBSs were selected as candidates for key regulators of immunity through the regulation of gene expression.
Hotspot detection
Genetic variants associated with the expression of at least 10 genes were considered as genetic hotspots. Furthermore, the most significantly associated genetic variants in at least 10 eQTL regions were defined as top-hotspots (6). Genes with associated hotspots were examined for transcription factors and cofactors using the AnimalTFDB v4.0 (43). Pathways analysis was performed for genes regulated by a single top-hotspot through network analyses with the ClueGO Cytoscape plugin using KEGG pathways and gene ontology databases (38, 44). Co-expression between each regulator and its trans-associated genes was assessed using Partial Correlation and Information Theory procedures with the PCIT R package (45).
Results
Porcine blood transcriptome
The porcine blood transcriptome sequencing provided an average of 161.5 million reads per sample, totaling over 35.5 billion reads across the entire dataset. Of these, 90.1% were successfully mapped to the pig reference genome Sscrofa11.1. Among these mapped reads, 91.2% were located within genic regions, with 44.06% mapping to exons and 47.09% to introns.
After normalizing and filtering, we identified 14,642 annotated genes as being expressed in blood. The majority of these, 12,461 genes (85.1%), were protein-coding genes, while 2,064 genes (14.1%) were classified as long-non-coding RNAs (lncRNA).
Genomic variants associated with blood transcriptome
Significant associations between the expression levels of 6,051 genes and 5,682,600 genetic variants were obtained in the eGWAS (Table 1). Most of the associated variants were located within intronic (59.2%) and intergenic (20.9%) regions. Only 1% of associated variants involved coding regions, most of which were synonymous variants (67.8%). Regions with a potentially strong regulatory role, such as upstream or UTR, constituted 11.5% of the associated variants (Figure 1).

Table 1. Summary of results from the blood expression genome wide association study.
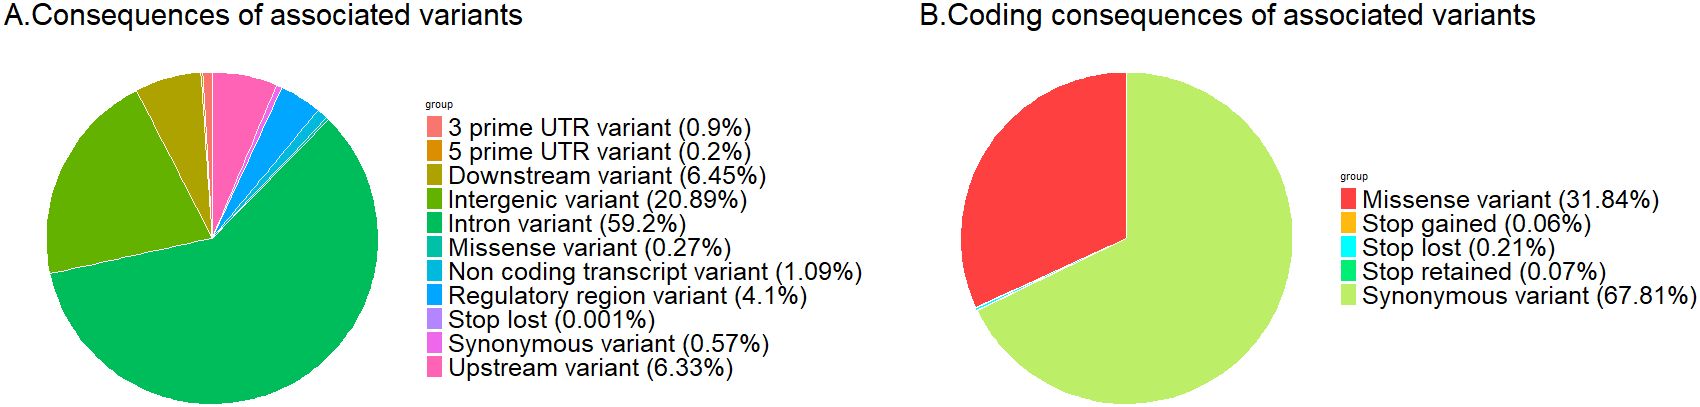
Figure 1. Pie chart presenting the consequences of genetic variants associated to blood gene expression levels (A) all associated variants; (B) variants in coding regions.
Of the 6,051 genes associated with genetic polymorphisms, 4,964 were protein-coding, 1,033 were lncRNA, and the remaining were identified as miRNA, snoRNA and other small RNA molecules. The ANKRD50 gene had the greatest number of associations, with a total of 65,889 genetic variants located on Sus scrofa chromosome (SSC) 8 showing a significant effect on ANKRD50 expression levels (Figure 2A). Meanwhile, the expression of ACBD5 gene exhibited the most significant associations (p-value of 2.02x10-74) with the variants rs335102081, rs345896251, rs338023300, rs697323536 and rs336561290, in SSC10 (Figure 2B).
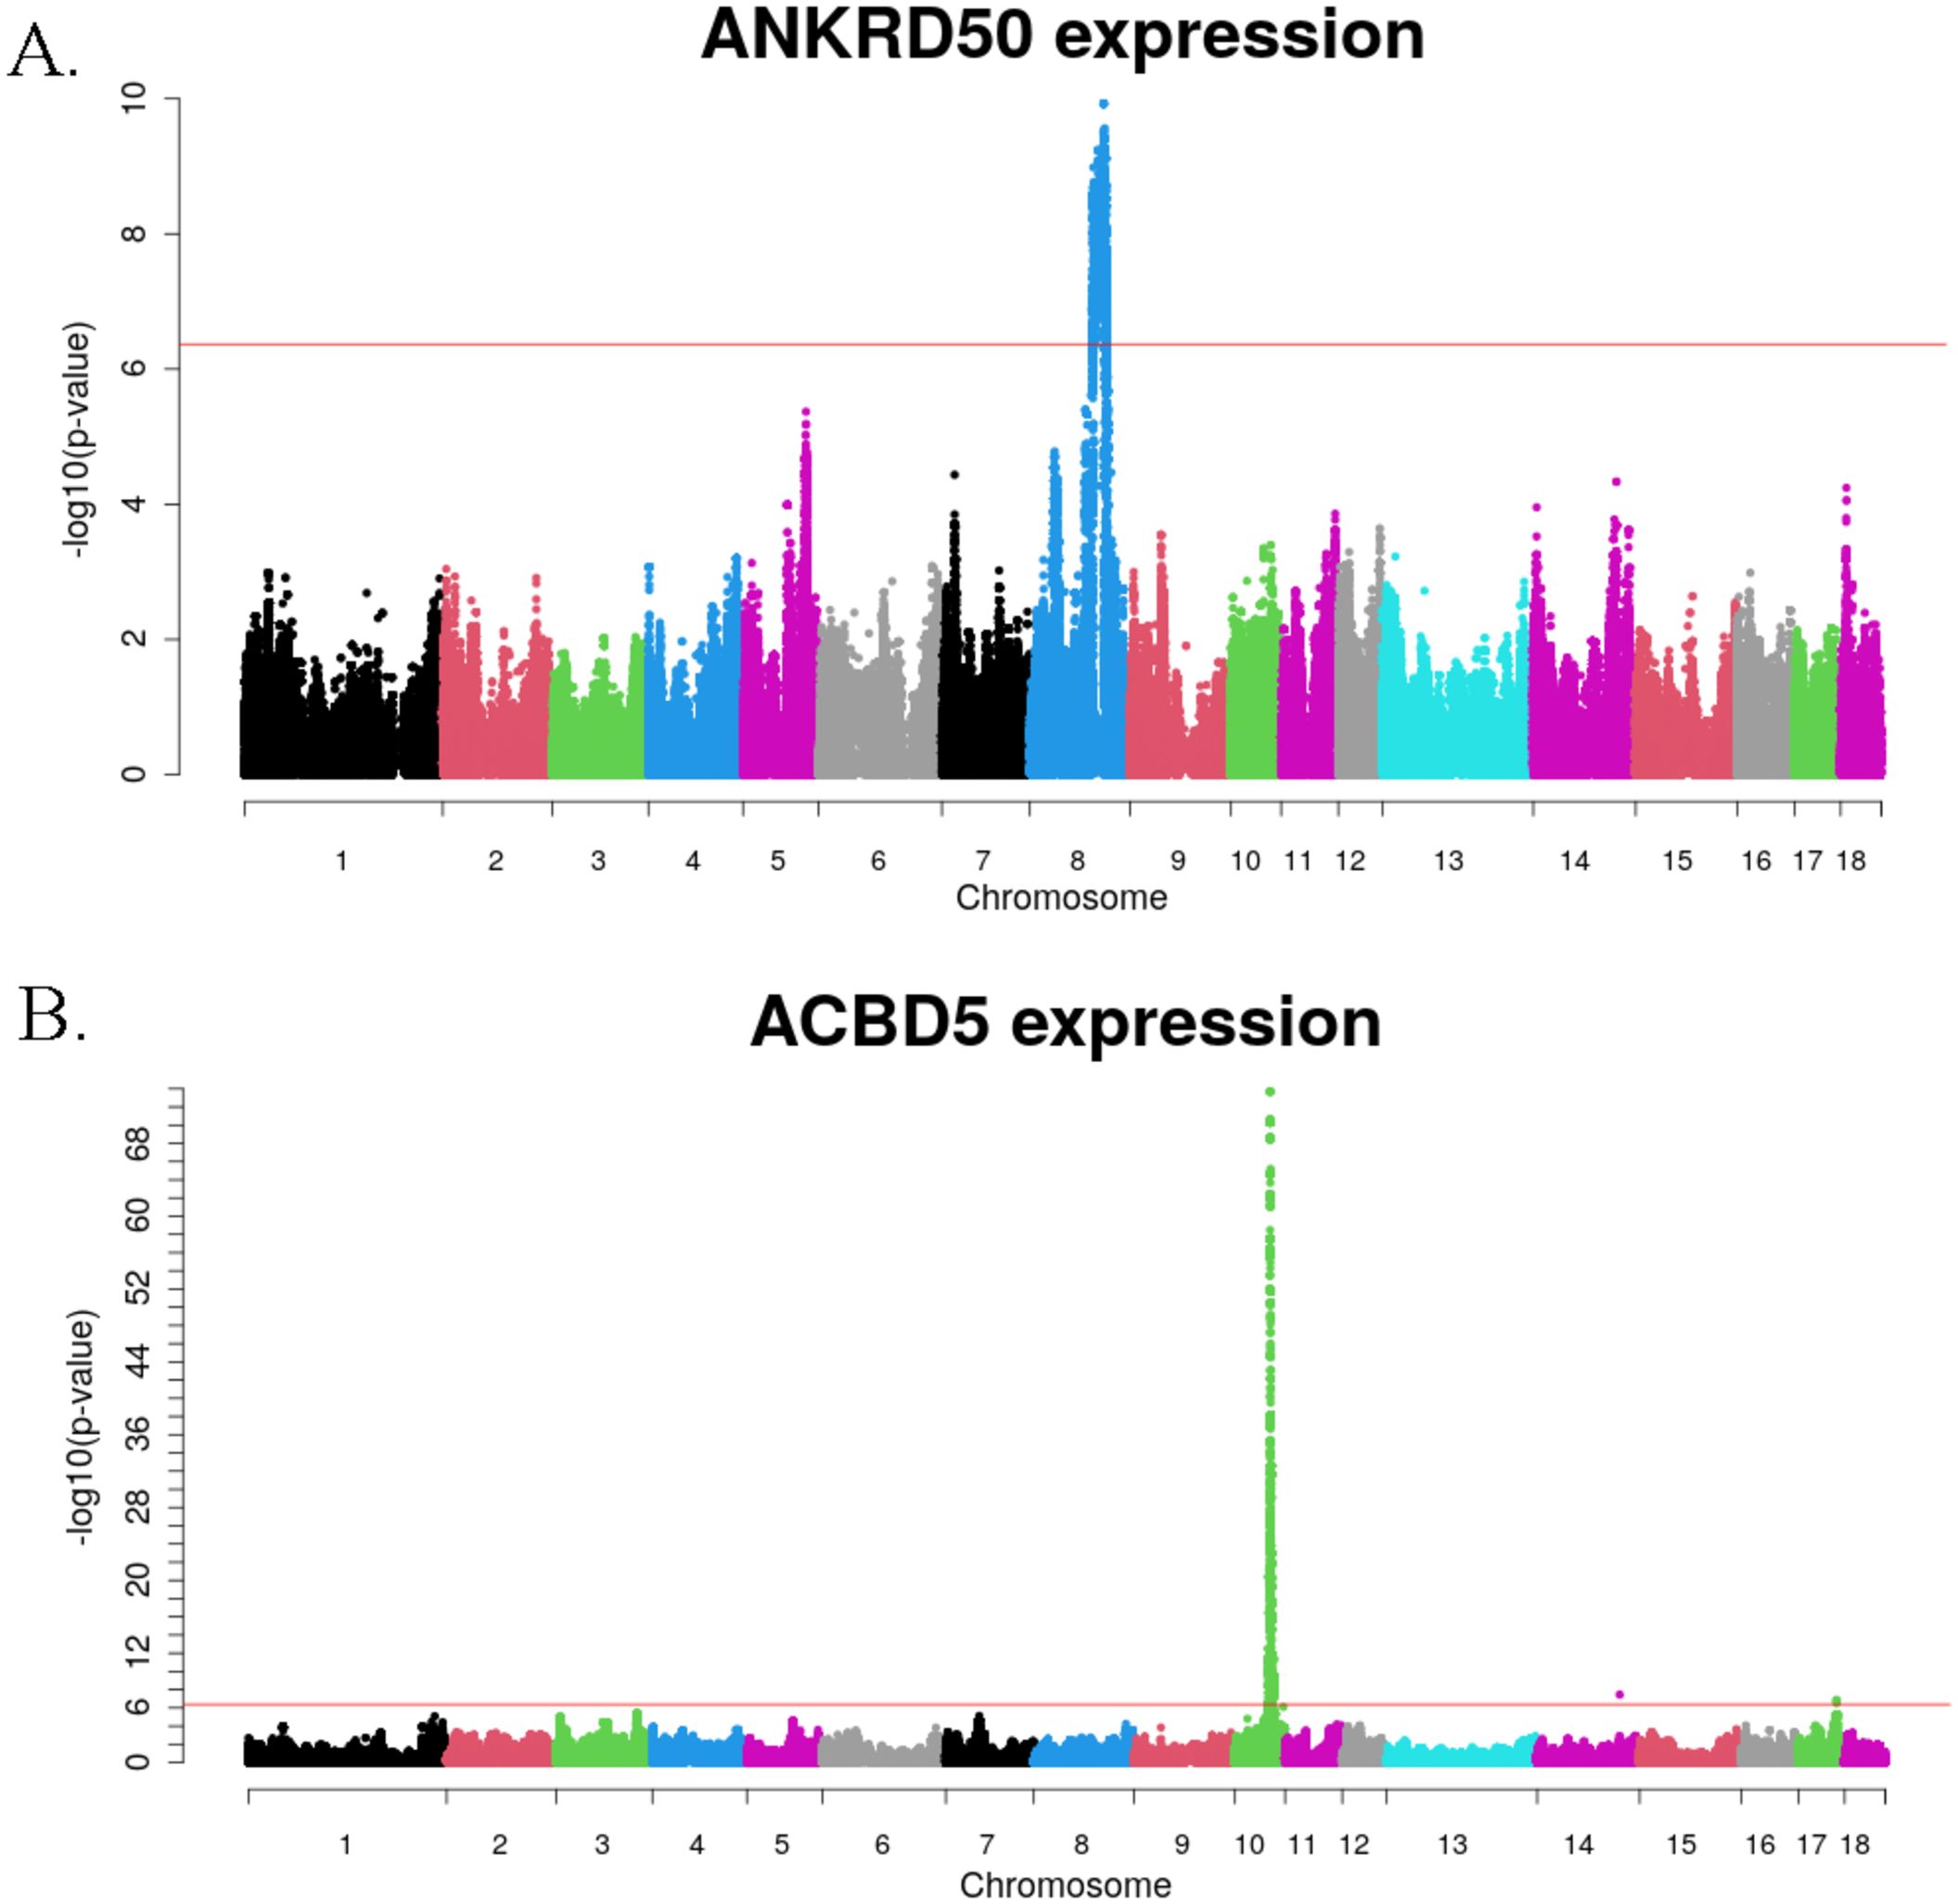
Figure 2. Manhattan plots of eGWAS results for ANKRD50 (A), and ACBD5 (B) expression levels. The red threshold corresponds to an adjusted p-value of 0.05 after Bonferroni correction for multiple testing.
When examining individual variants, a total of 3,859,132 (67.9% of significant variants) were found to have at least one association in cis (Table 1). Focusing on regulated genes, out of the 6,051 genes whose expression levels showed associations at genome level, 3,952 had at least one cis-regulatory variant, while 2,099 had exclusively trans-regulatory elements. On average, cis associations showed lower p-values than trans associations.
Variants located in potential regulatory regions were considered as candidates for regulatory elements. According to VEP prediction, a total of 517,770 cis-associated variants were found in upstream regions, while 77,350 variants were found in 3’UTR regions. Moreover, 342,114 cis-regulatory variants mapped inside regulatory regions. Overall, the percentages of predicted consequences for cis-regulatory variants were similar to those observed for all associated variants (Supplementary Figure 1). Analysis of the positions of cis-associated variants relative to their associated loci revealed an enrichment of associations near the TSS and just beyond the start of the 3’UTR, compared to variants located within the ORF itself (Figure 3).
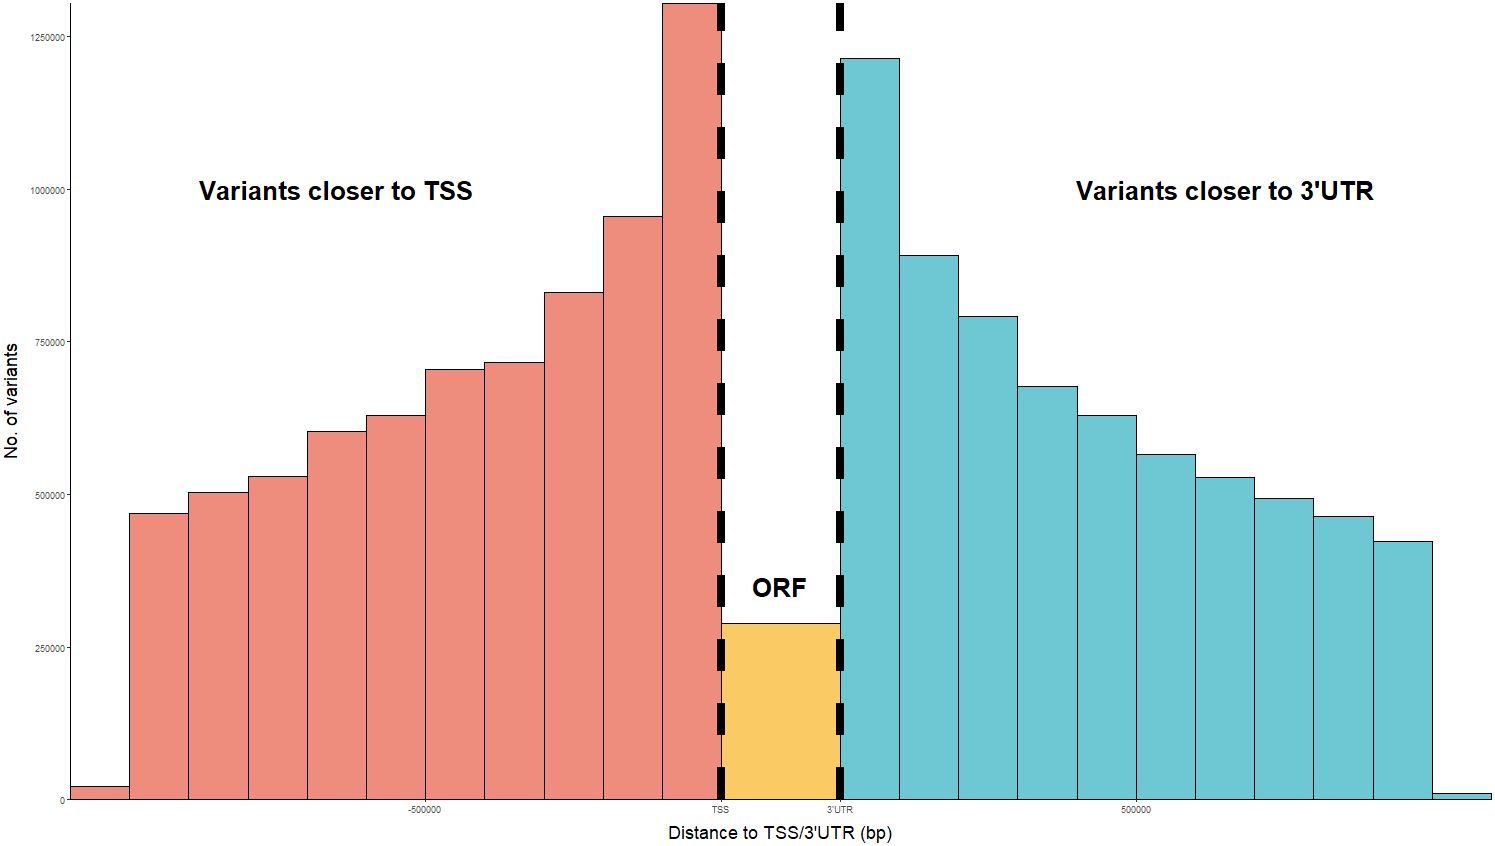
Figure 3. Distribution of the distance between cis regulatory variants and their regulated gene ORF, in bp. Distances have been calculated as relative to the transcription start site (TSS) or start of the 3’ untranslated regions (3’UTR), whichever closest. The number of regulatory variants located inside the ORF between the TSS and start of 3’UTR has been plotted in orange.
Additionally, 41,781 variants associated with the expression of 4,125 genes mapped inside evolutionarily conserved mammalian regions (GERP regions). The ANKRD50 gene, involved in endocytic recycling, showed the highest number of associated variants in conserved regions, all inside a single eQTL.
Genomic regions associated with blood transcriptome
Significant associations found within a distance of ±1 Mb of each other were considered part of the same eQTL. This approach led to the annotation of 14,243 different eQTLs. To ensure robustness and minimize the influence of isolated signals, we focused subsequent analyses on the 9,930 eQTL containing 3 or more significant variants, as the presence of multiple significant variants in close proximity is expected due to LD.
At eQTL level, 3,597 regions (36.2%) were identified as cis-eQTLs, while 6,333 were classified as trans (Table 1), regulating 3,663 different genes. Cis-eQTLs comprised a larger number of variants compared to trans-eQTLs, with an average of 5,579.52 SNPs per cis-eQTLs, whereas trans-eQTLs averaged 564.11 SNPs. The genomic distribution of cis- and trans-eQTLs across the 18 Sus Scrofa autosomes is shown in Figure 4. SSC6 exhibited the highest number of both total and cis-eQTLs, while SSC12 showed the highest proportion of cis-eQTLs among all autosomes.
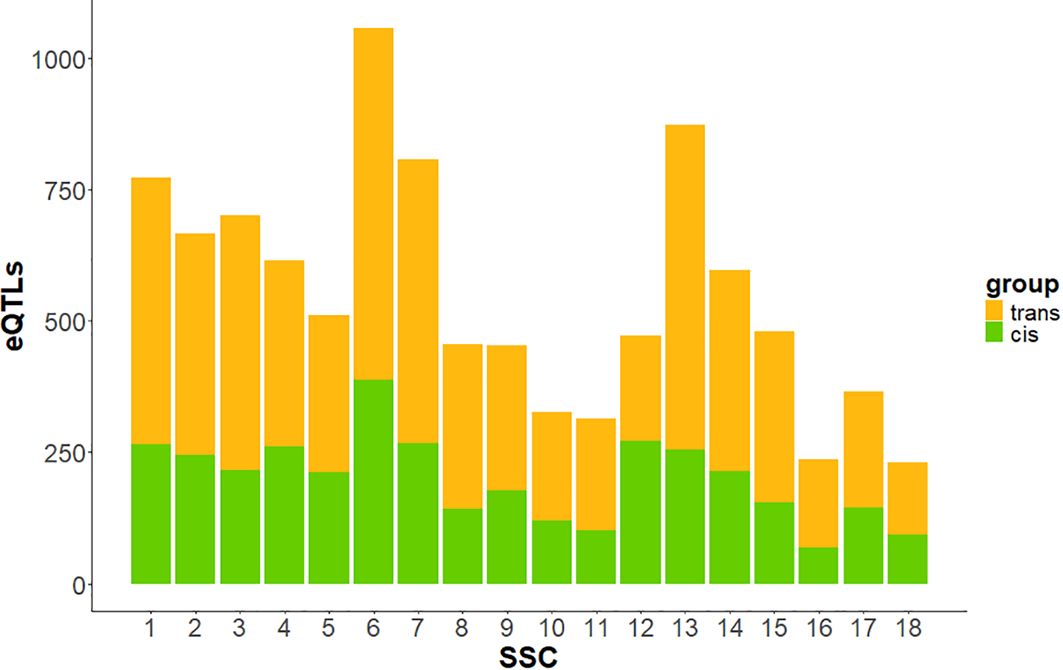
Figure 4. Bar plot showing the number of cis- and trans-eQTLs across autosomes. In green, eQTLs annotated in cis- to their associated gene; in orange, eQTLs annotated in trans- to their associated gene.
To further characterize immune-related genes regulated by eQTLs, we performed a functional annotation analysis of all eQTL-regulated genes. This analysis identified 771 immune-related genes, 482 of which were regulated in cis. The results of the functional annotation are presented in Supplementary Table S1.
Transcriptional hotspots and top-hotspots
To identify key regulatory elements, genetic variants that were significantly associated with the expression of at least 10 genes were classified as transcriptional regulatory hotspots. A total of 430,694 hotspot variants were identified in our study (Table 1). The variant with the highest number of associated genes was rs1107483072, which regulated the expression of 127 genes. This variant is located inside the sixth intron of the CAMTA1 gene, a transcription factor related to several immunological pathways (46).
Hotspot distribution across the genome was not uniform. The chromosomes with the highest number of hotspots were SSC6, SSC14 and SSC8, comprising 66,351, 64,393 and 61,022 hotspot variants, respectively (Figure 5). While most of these variants appeared functionally neutral, a subset of 422 was predicted to have deleterious effects on the protein sequence, and an additional 363 variants were also predicted to be deleterious but with low confidence. Among variants classified as hotspots, 344,328 (79.9%) were found in cis with at least one of their associated genes.

Figure 5. Bar plot depicting the distribution of cis- and trans-hotspots across autosomes. In green, hotspots annotated in cis to at least one of its associated genes; in orange hotspots annotated in trans to all its associated genes. Chromosomes SSC10, SSC11 and SSC18, with less than 150 hotspots, were not plotted due to the relative bar size.
The 2,093 genes associated with transcriptional hotspots included a significant number of transcriptional regulators: 112 were annotated as transcription factors and 106 as transcription co-factors. Of these, 68 transcription factors and 49 co-factors were found to have cis-hotspot associations. Approximately half of the hotspots associated in cis with a transcription factor or co-factor (46.9% and 46.2%, respectively) mapped inside intronic regions. Additionally, 13,462 hotspots in cis with transcription factors and 10,047 hotspots in cis with transcription co-factors mapped in regulatory regions. When looking at 3’UTR regions, 2,251 cis-hotspots associated with transcription factors and 1,719 cis-hotspots associated with transcription co-factors were mapped inside.
Among the total hotspot variants identified, 144 were also the most significantly associated polymorphisms in at least ten eQTLs. These were considered transcriptional top-hotspots and are detailed in Supplementary Table S2. All top hotspots grouped in seven genomics regions that are described in Table 2. From them, 42 variants were found to be associated in cis with at least one transcript in which they were the top association of the cis-eQTL. Functional annotation of genes regulated by the same regulatory top-hotspot highlighted biological processes regulated by the same regulatory variants. Results from ClueGO pathway analyses and PCIT co-expression analyses can be found in Supplementary Table S3.
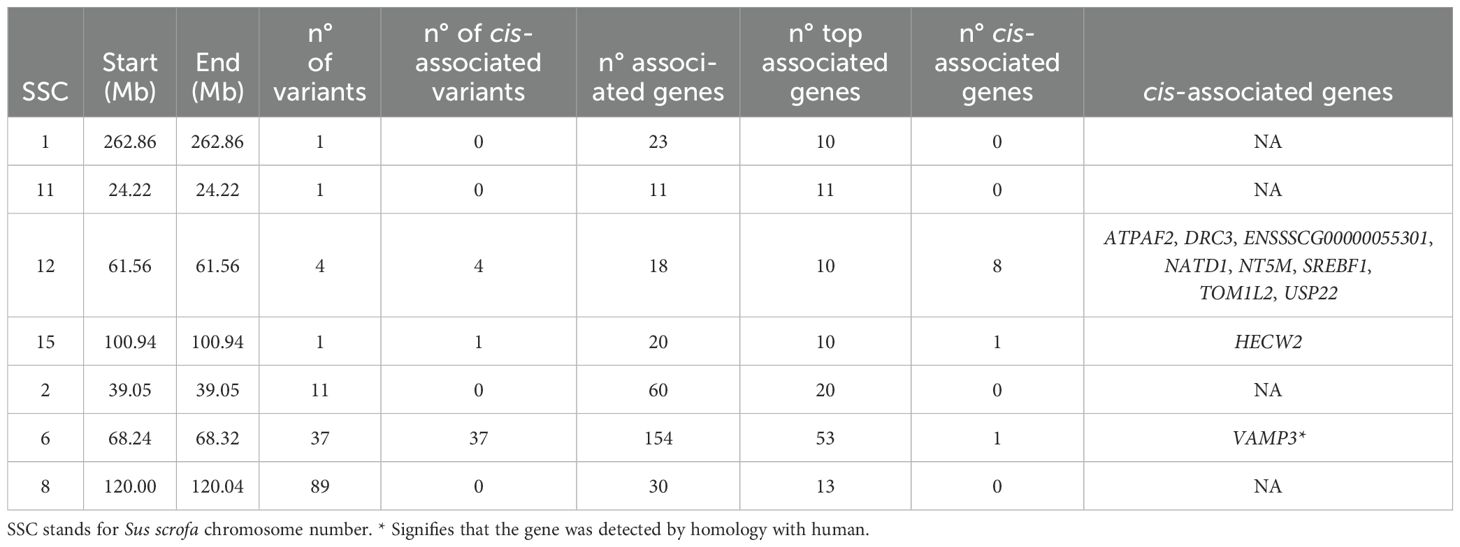
Table 2. Top-hotspots detected during the analysis, grouped by linkage disequilibrium.
For instance, a top-hotspot was identified on SSC1 associated with the expression of 23 genes. Co-expression analysis revealed strong correlations ranging from 0.56 to 0.95 between the expression levels of these genes, except for the novel gene ENSSSCG00000038679, which encodes a centrosomal protein. The functional enrichment analysis revealed several genes related to immune functions, including those involved in the T-cell apoptotic process (ADA, and RAG1). Other genes such as RAG1 and RAG2, both involved in activation of V(D)J recombination, were also identified. The PCIT analysis reported significant and negative correlations of the expression levels of most of these genes with phagocytosis, whereas positive correlations were observed with lymphocyte count (Figure 6A).
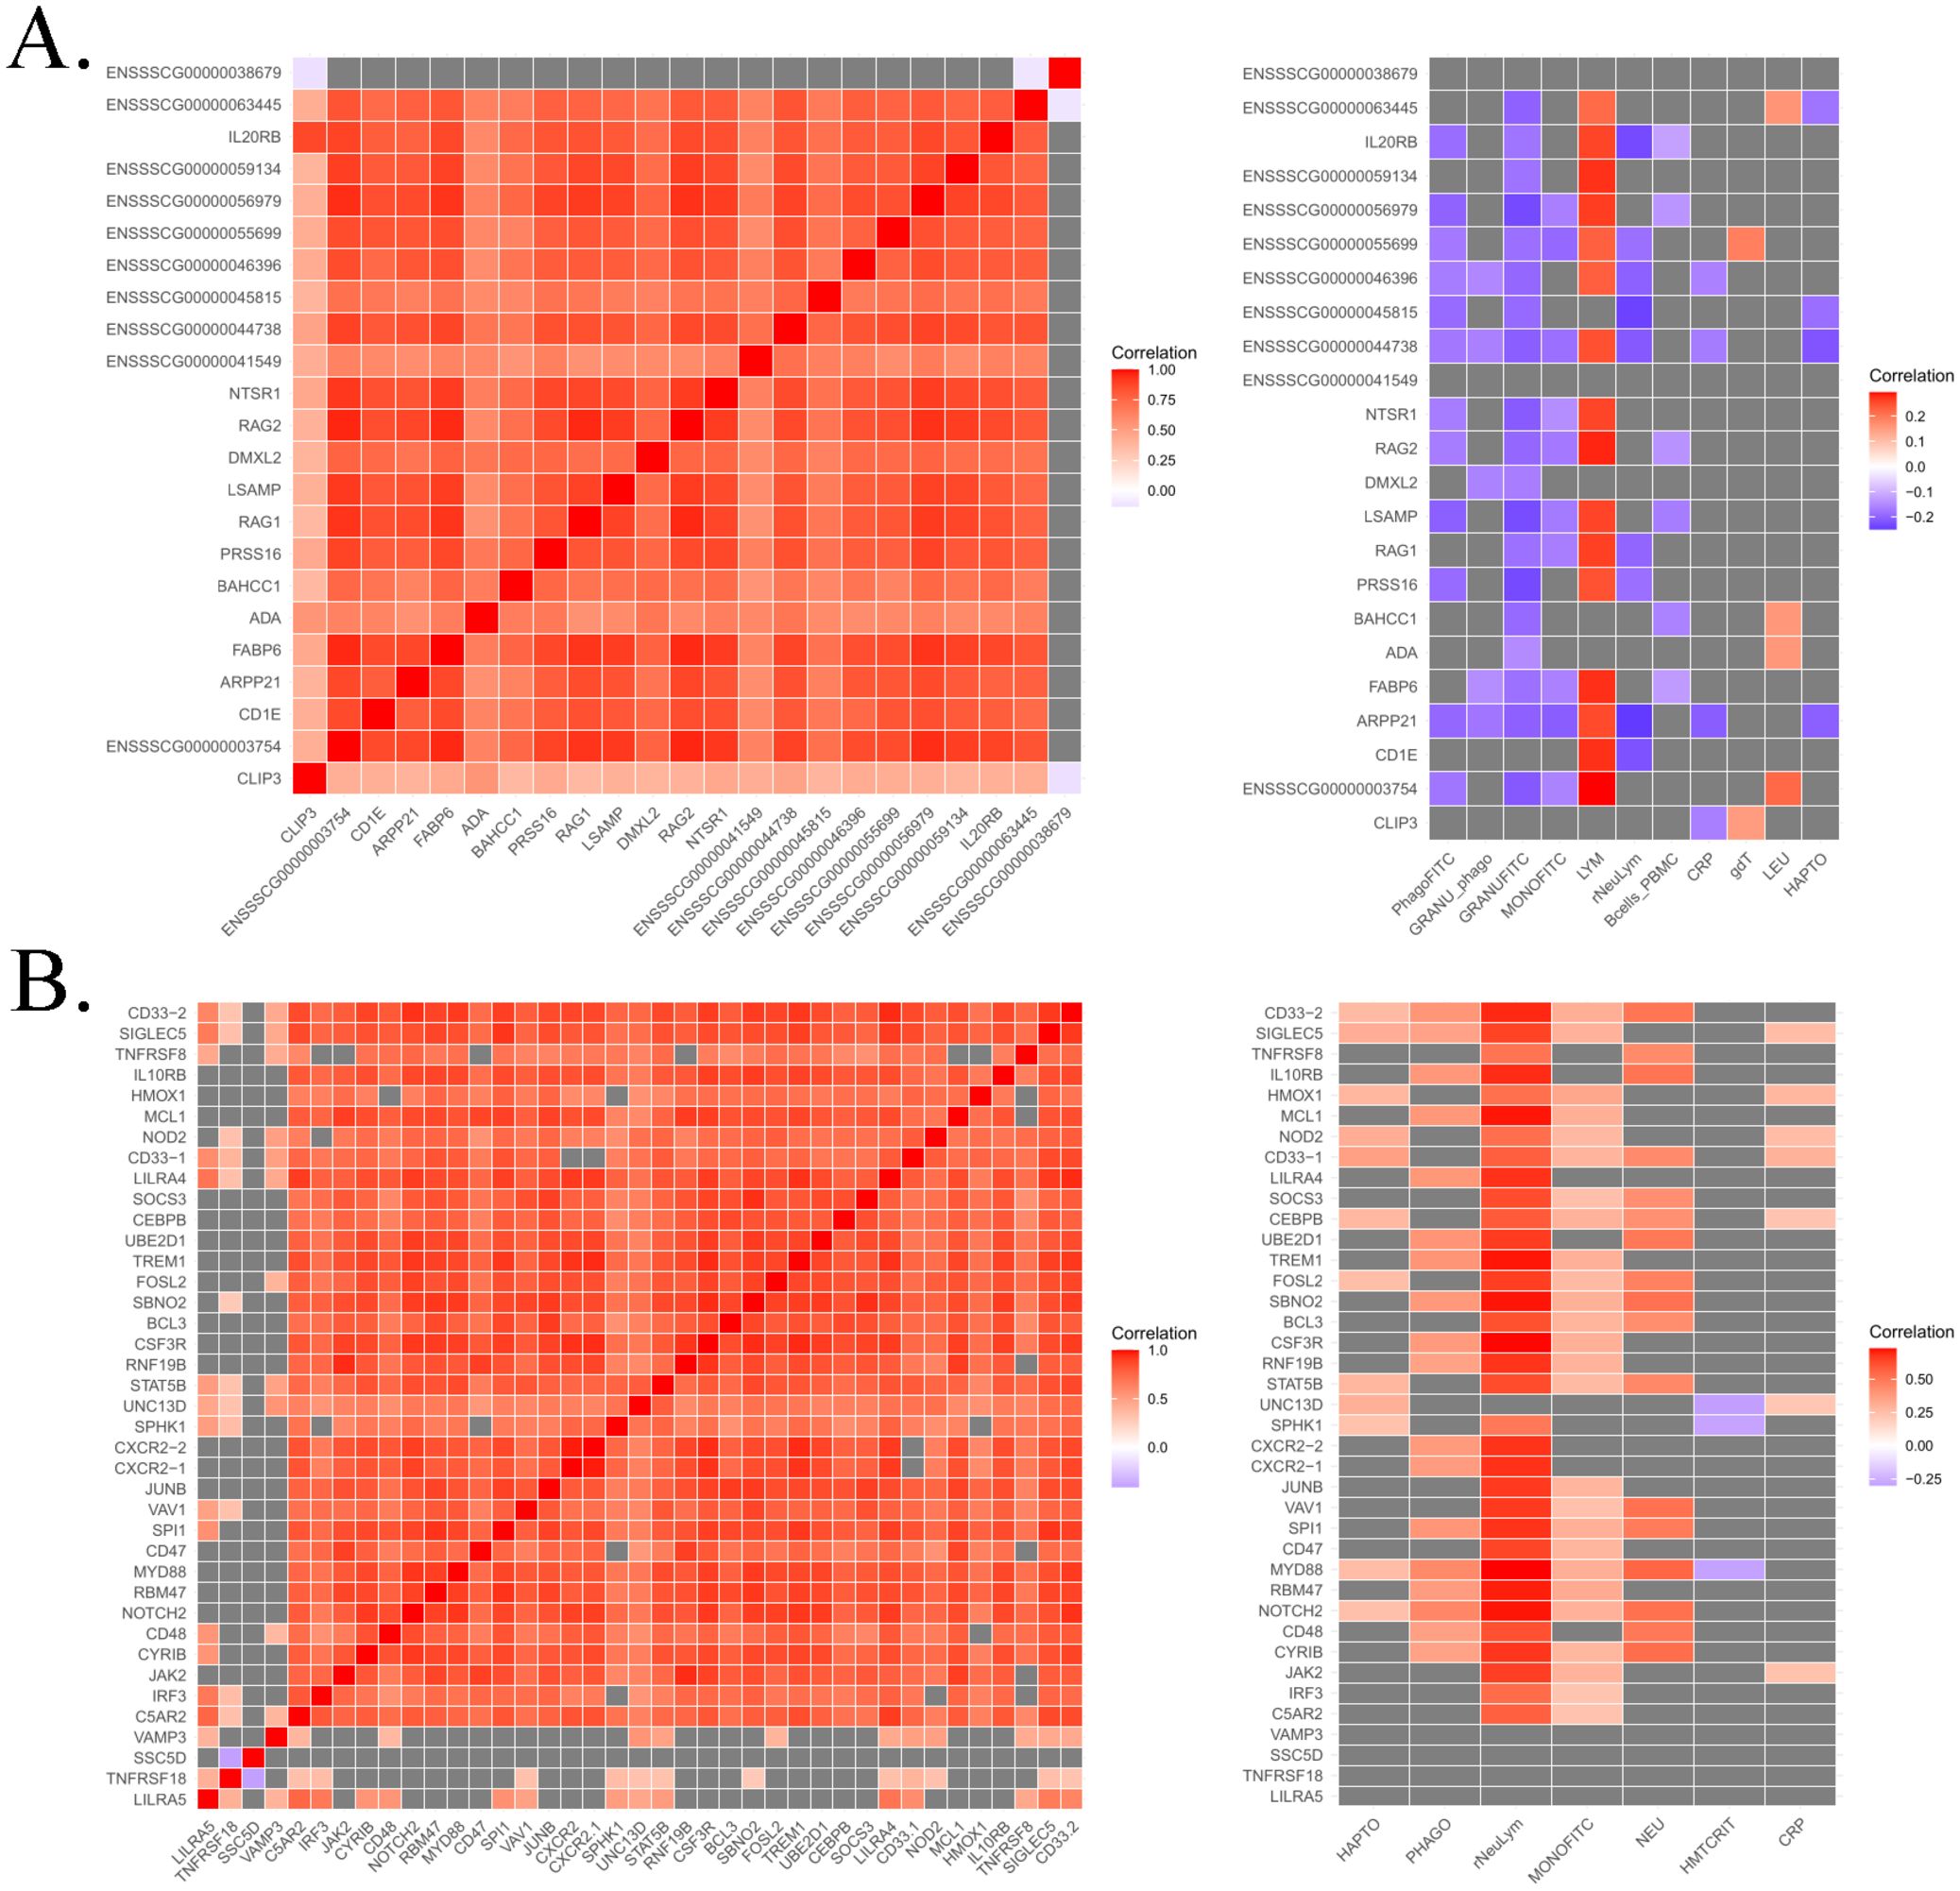
Figure 6. Heatmap of partial correlations from PCIT analysis between the expression levels of genes regulated by top-hotspots in SSC1 (A) and SSC6 (B), as well as their correlations with immunity traits. Positive correlations are presented in red, negative ones in blue, and non-significant correlations in grey.
A total of 37 top-hotspots in high LD were located in SSC6, all of them associated in cis to the expression levels of VAMP3 gene and located in intron 6 of the transcription factor CAMTA1. After VEP annotation, one of these top-hotspots, the rs3472545010, was within an enhancer (ENSSSCR6_9324TC). Remarkably, these top-hotspots were found to regulate genes associated with biological processes and pathways related to immunity such as signaling by CSF3 (G-CSF), regulation of interleukin 1, 8 and 10 production, regulation of tumor necrosis factor production or interferon-mediated signaling pathway among others (Supplementary Table S4). Furthermore, VAMP3, together with MYD88, SBNO2, SPI1, and UNC13, were found to be associated to the myeloid cell activation involved in immune response biological process. Co-expression analyses revealed strong correlations between the expression levels of these genes putatively co-regulated by the same top-hotspots (Figure 6B). Furthermore, significant correlations were observed between the expression of genes regulated by these hotspots and several health-related traits such as plasma concentration of acute phase proteins (Haptoglobin and CRP), phagocytic cells and phagocytic capacity of monocytes, neutrophil count, and the neutrophil/lymphocyte ratio (Figure 6B).
Four top-hotspots in high LD located on SSC12 presented cis-associations with eight genes: ATPAF2, DRC3, ENSSSCG00000055301 encoding a lncRNA, NATD1, NT5M, SREBF1, TOM1L2 and USP22. Notably, one of these putatively regulated genes encodes the transcription factor SREBF1 that plays a key role in steroid metabolism and lipid homeostasis. The only other cis-association found for a top-hotspot was between the variant rs3474314913 located on SSC15 and the gene HECW2.
Potential causal regulatory variants for immunity traits
The comparison of the blood transcriptome eQTL map with QTLs of health-related traits reported a total of 294 eQTLs, 175 of which were cis-eQTLs, colocalized with 15 hematological and immunity QTLs. Results are shown in Table 3. The immunity QTL with the highest number of colocalizations was the QTL at SSC3 for the relative abundance of T-helper cells among PBMCs, which had 45 overlapping eQTLs, and 17 of which were in cis. Next, the QTL at SSC5 for memory T cell amongst PBMCs had 41 overlapping eQTLs, and 22 of them in cis. Other QTL of phenotypes such as IgG serum or CRP concentration, white blood cells and platelets counts, mean corpuscular volume (MCV) and mean corpuscular hemoglobin (MCH) also colocalized eQTLs for blood transcriptome. The gene ontology enrichment analysis of genes regulated by these colocalized eQTLs revealed several candidate genes (Table 3) associated with immune responses. Among them, CD48 and SLAMF family receptors genes overlapped with CRP concentration in serum, IGHG4 and IGHV3–73 with IgG plasma levels and PIK3R3, PRDX1 and MPL with MCV and MCH. Several members of the IGKV, RBPJ, and ZAP70 genes, were also identified as candidate genes for the abundance of T-helper cells, while several members of the CLEC and KLR gene families were for memory T cells.
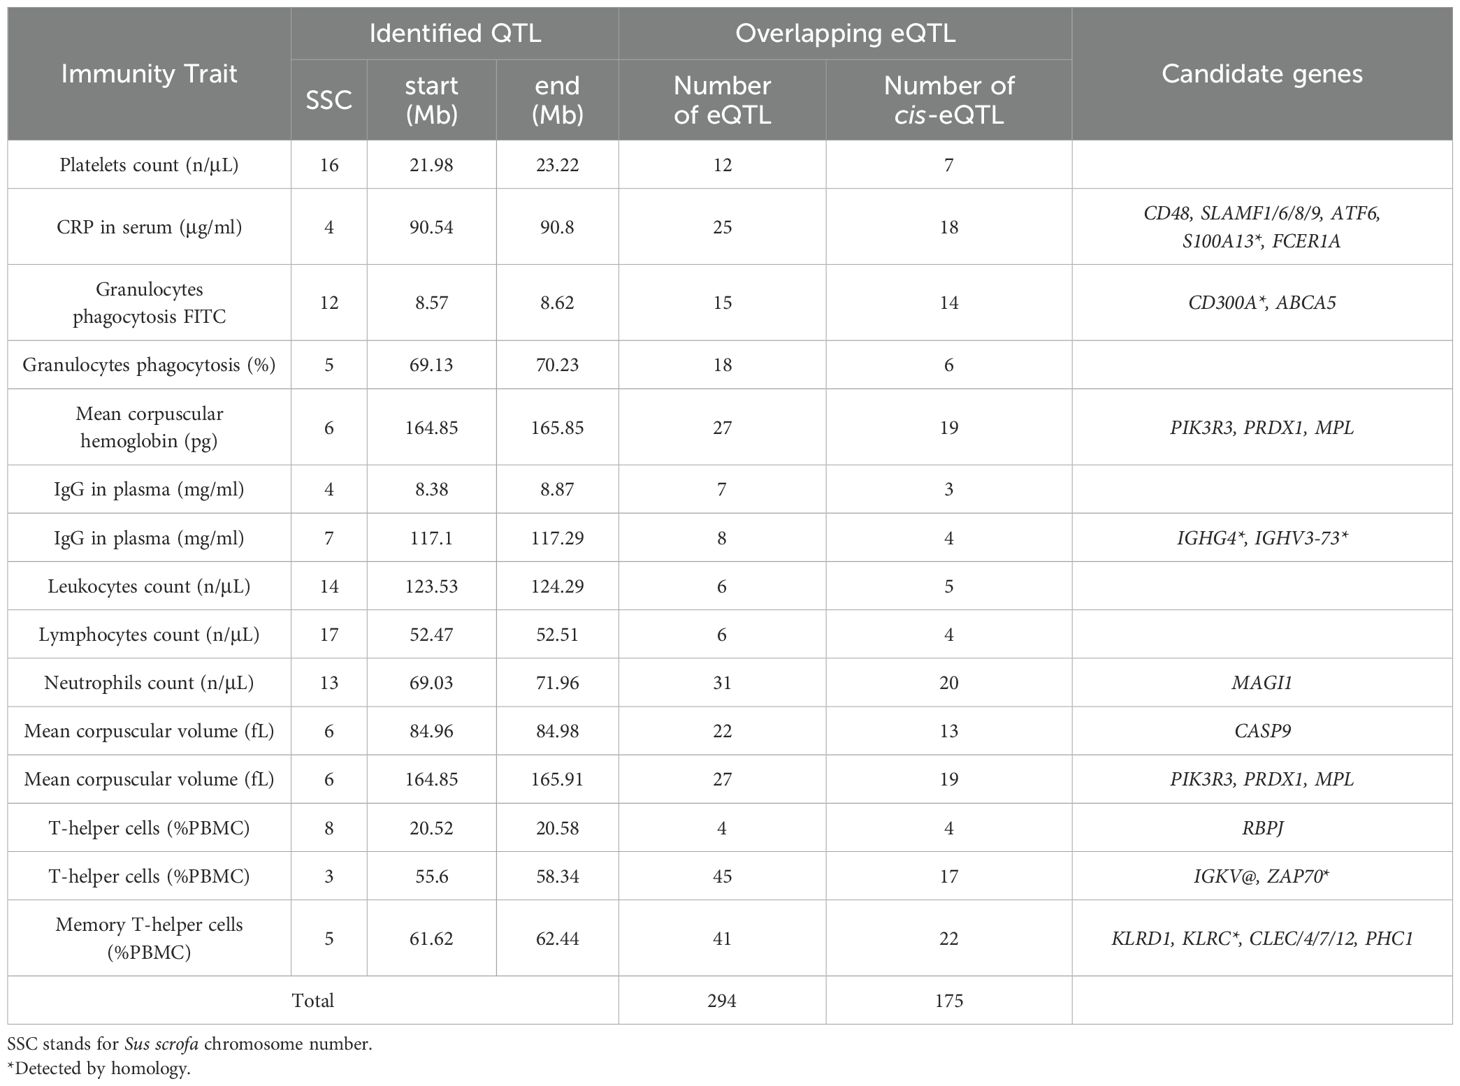
Table 3. Number of overlapping eQTLs to previously described immune associated regions.
Colocalization studies revealed substantial evidence of common causal regulators between health-related QTLs and the eQTLs described in the present work; Table 4 shows results for tests reporting posterior probabilities of having common causal variants above 0.95, plus the candidates to be the key regulators. The QTL for memory T cell showed common causal mutations with three cis-eQTLs for CLEC12B (PP.H4 = 0.99), KLRD1 (PP.H4 = 0.97) and KLRC1 (PP.H4 = 0.96) gene expression. The QTL for T-helper cell percentage also presented putative common causal variants with eQTL for several homologues to the IGKV2D gene (PP.H4 from 0.96 to 0.99) and ZAP70 (PP.H4 = 0.96).
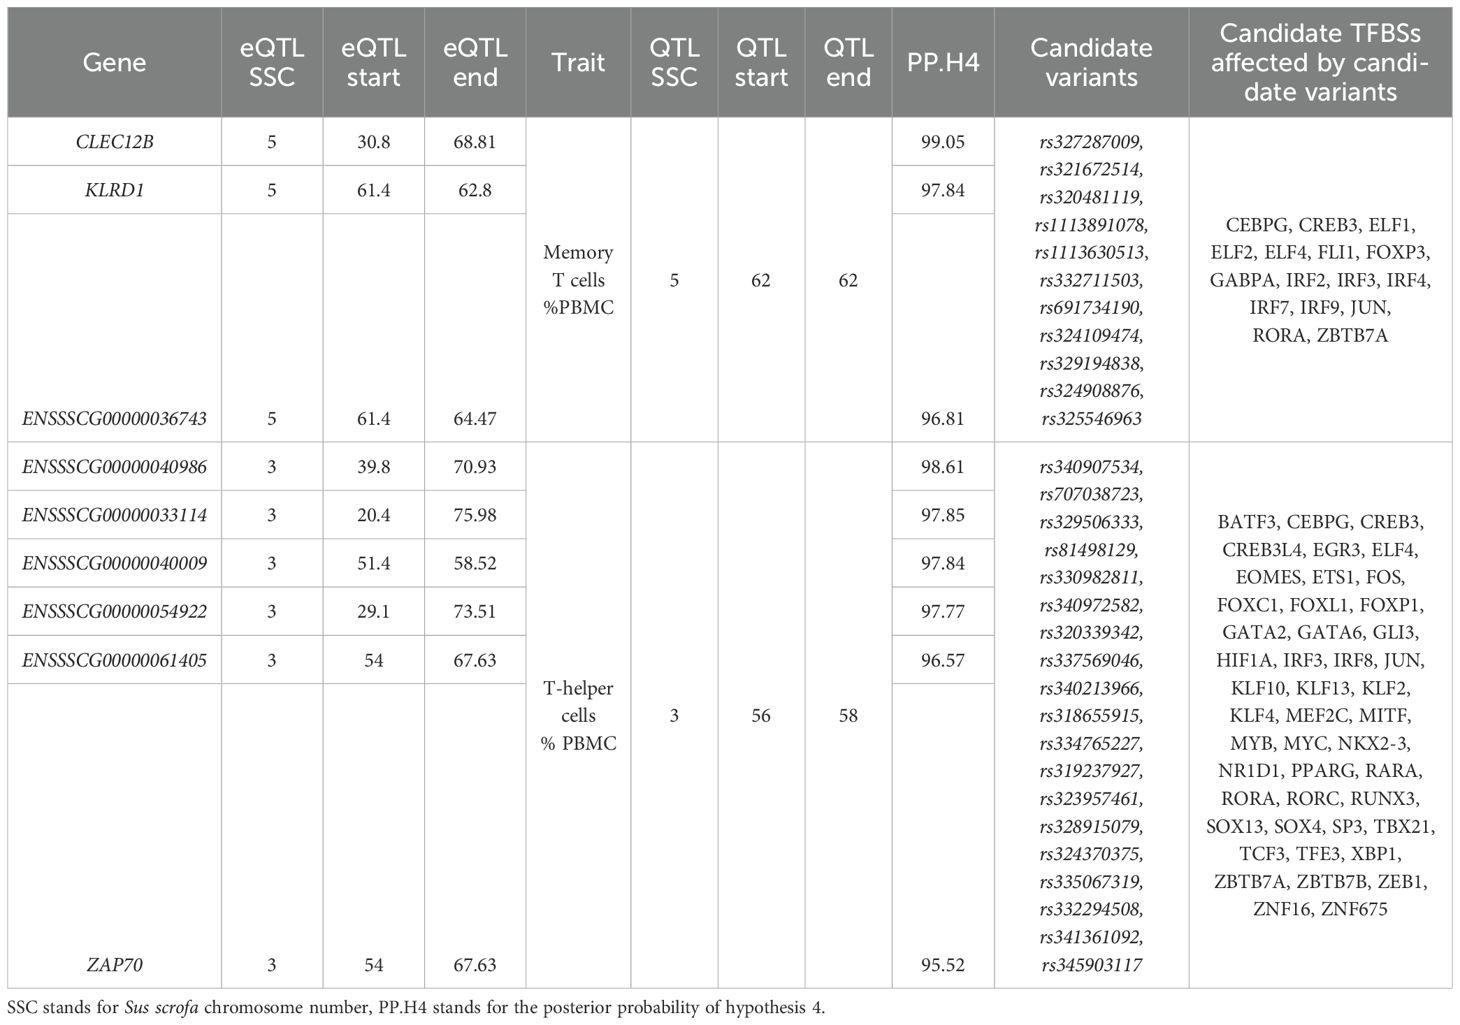
Table 4. Colocalization analysis results.
The 95% credible set of causal variants for the coloc studies was extracted for further analysis. Variants located in regulatory regions were selected as candidate regulators for these QTLs and eQTLs (Table 4). Eleven variants were selected for the memory T-cells QTL and CLEC12B, KLRD1 and KLRC1 eQTLs. An in-silico characterization of potentially modified TFBSs by these variants identified three of them as modifying immune-related TFBSs for CEBPG, ELF1, ELF2 and ELF4, IRF2–4 and IRF7, and RORA, among others (Supplementary Table S4). Nineteen variants were identified as potentially shared causal variants among the QTL for Helper T cells and the eQTLs for IGKV2D and ZAP70. A total of 46 in-silico predicted TFBSs for TFs associated with immune processes, including CEBPG, CREB3, GATA2 and GATA6, RORA, RORC, SOX13, and ZAN16, among others, were identified as being modified by these variants (Supplementary Table S4).
Comparative blood transcriptome with other transcriptomic analyses
Genes regulated by cis-eQTLs in the blood transcriptome were compared with those identified in previous studies in different porcine tissues. Crespo-Piazuelo et al. (6) analyzed the transcriptome of duodenum, liver and muscle from 300 pigs of Landrace, Large White and Duroc breeds. The duodenum transcriptome presented the highest proportion (44.89%) of cis-regulated genes overlapping with those identified as cis-regulated in blood, followed by liver and muscle (36.40% and 33.97%, respectively) (Figure 7A). When comparing results from all tissues, a total of 253 cis-regulated genes overlapped in all four tissues. Of these genes commonly regulated across tissues, 17 were annotated as transcription factors, and 12 as transcription co-factors, while the remaining genes had mostly housekeeping roles (Supplementary Table S5). Focusing on hotspot variants, when comparing hotspots in blood transcriptome with those obtained by Crespo-Piazuelo et al. (6), a total of 3,197 variants were identified as transcriptional regulatory hotspots across all four tissues (Figure 7B). However, none of them was found to be in cis in all four tissues simultaneously.
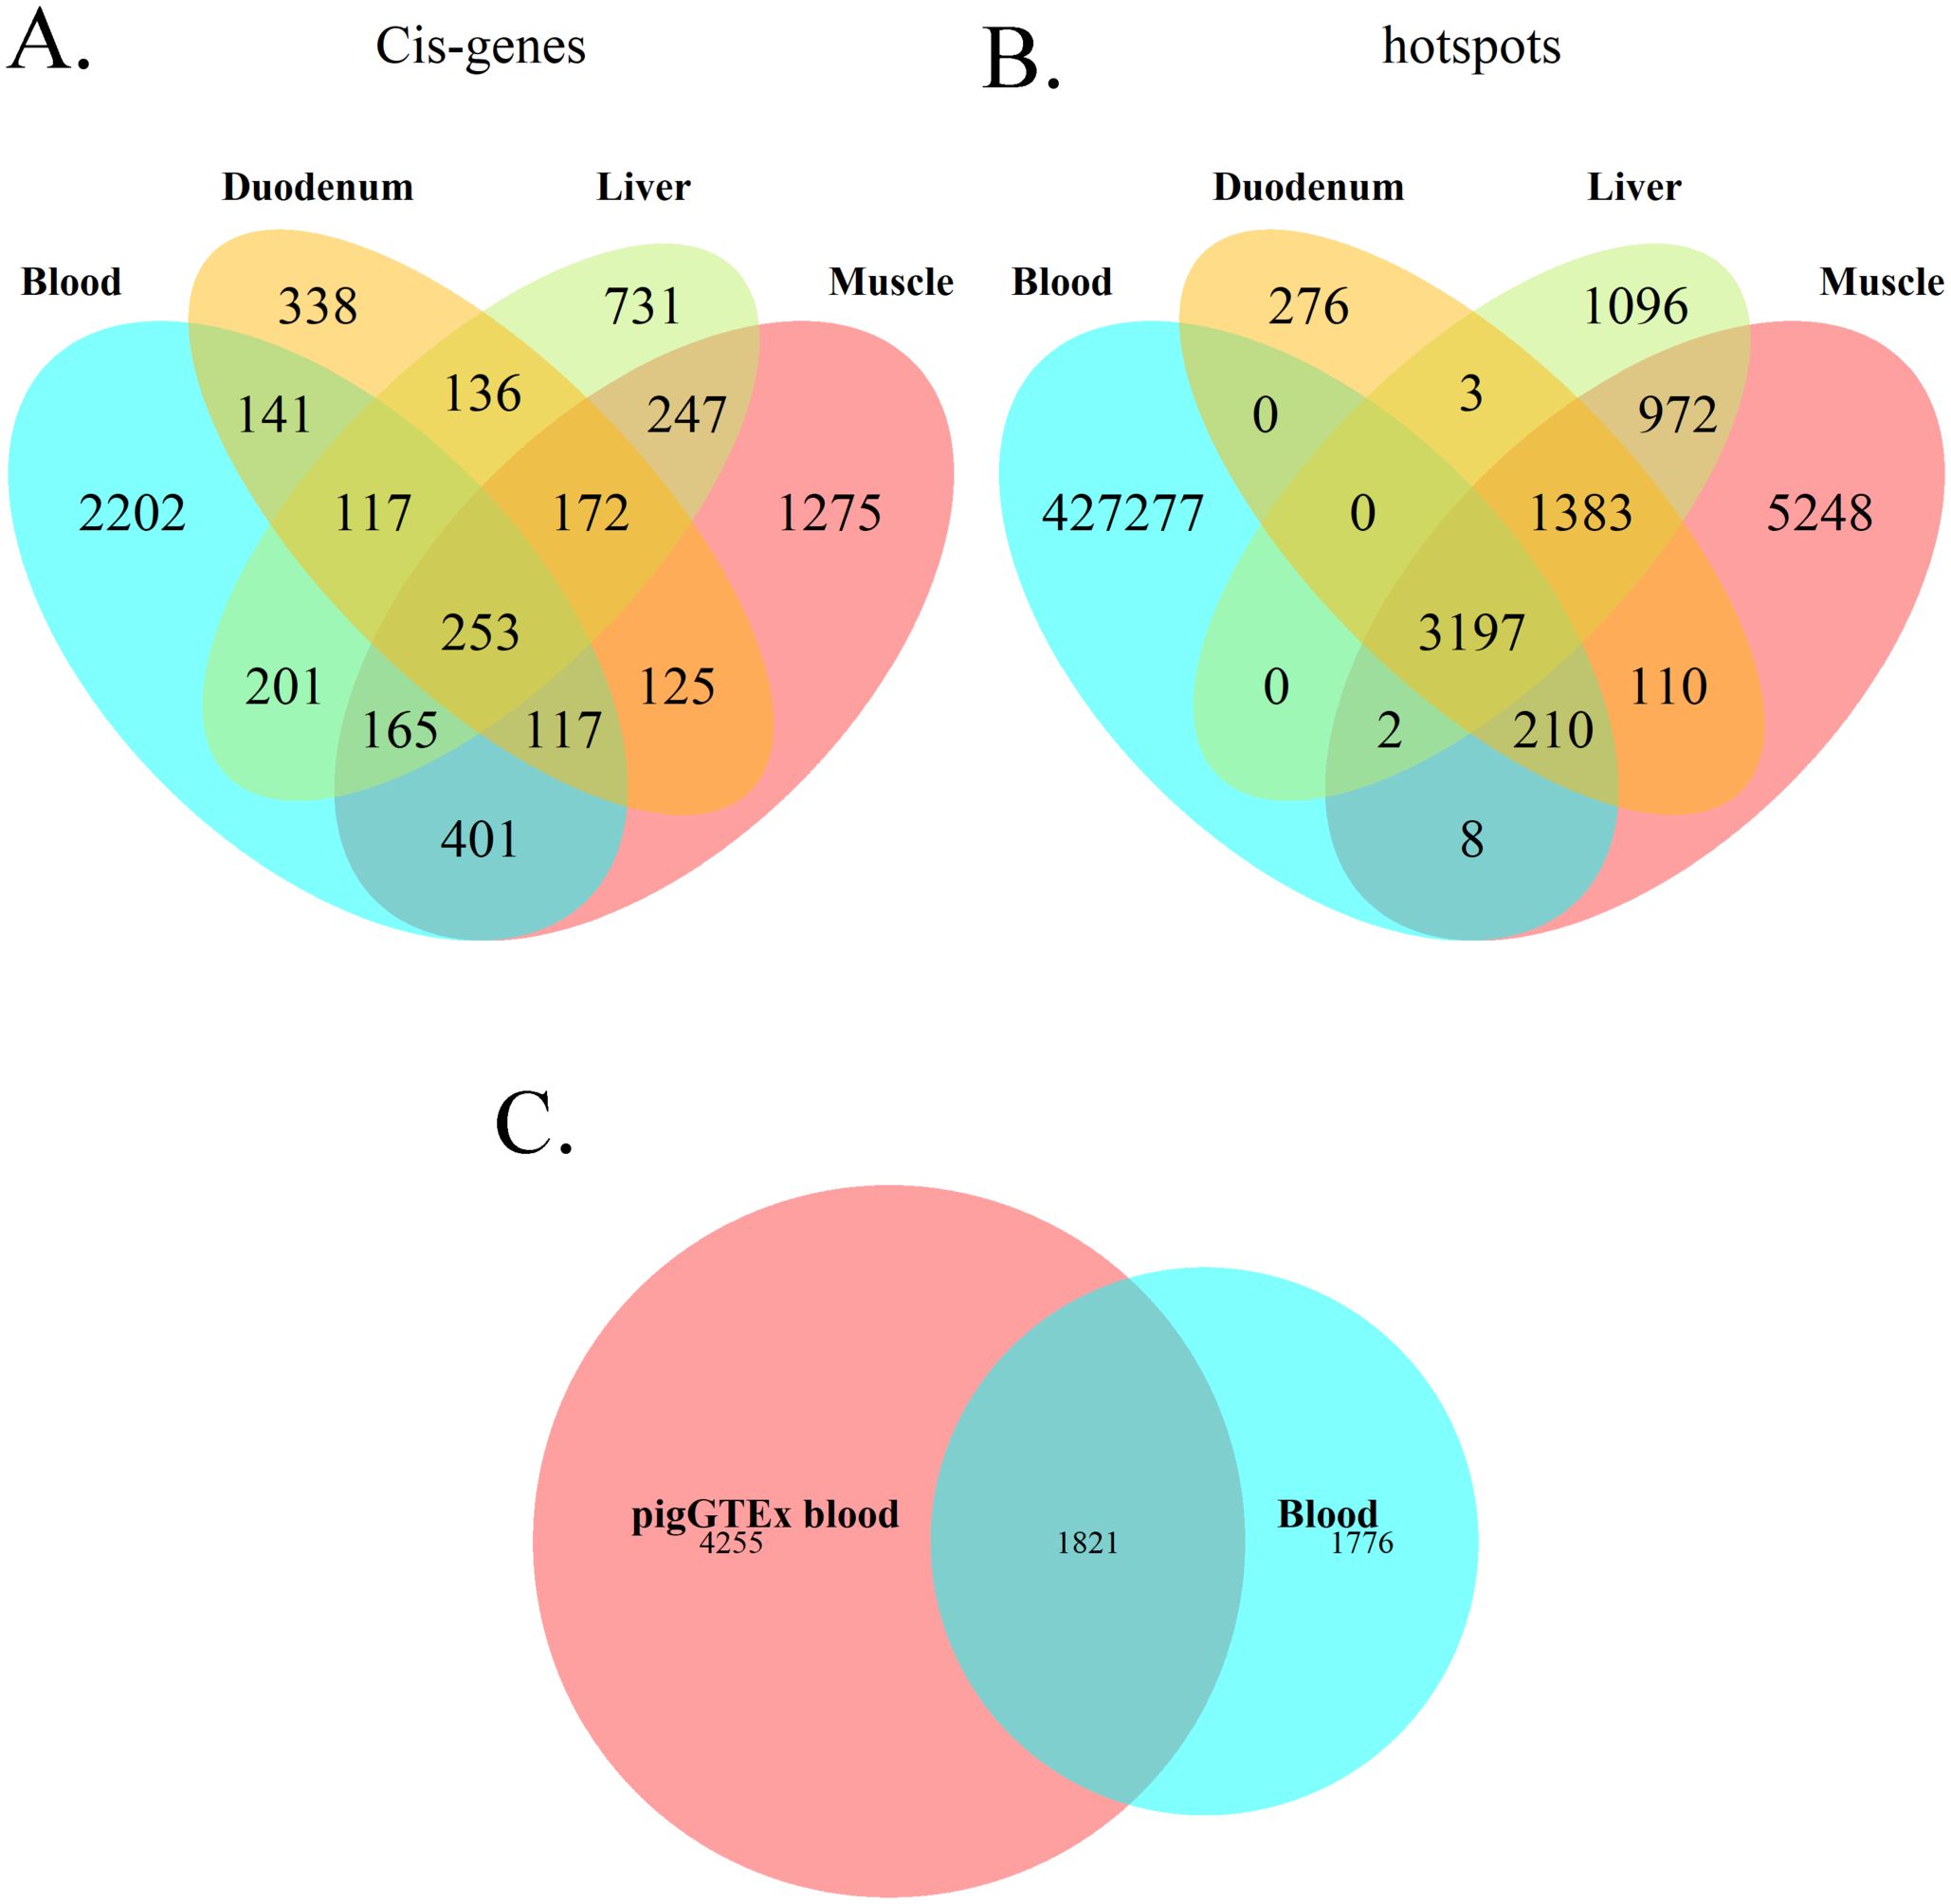
Figure 7. Venn diagrams depicting the overlap of results regarding porcine blood transcriptome with other studies. (A) Overlap between genes regulated by a cis eQTL in blood and those in duodenum, muscle and liver from Crespo-Piazuelo et al. (6) and the present work. (B) Overlap between regulatory hotspots for blood transcriptome and those for duodenum, muscle and liver from Crespo-Piazuelo et al. (6). (C) Overlap between genes regulated in blood by a cis eQTL in the present study and the PigGTEx project (13).
Additionally, results were compared with blood transcriptome data from the FarmGTEx consortium (13). In this case, 1,821 cis-regulated genes were shared between studies (Figure 7C). The coincidences can be found in Supplementary Table S5.
Discussion
The present study focuses on the genetic regulation of the porcine blood transcriptome, aiming to identify transcriptional regulatory variants and disentangle their association with immune capacity. RNA-seq data from 255 Duroc pigs were used to investigate the association between 8M imputed polymorphisms and expression levels of 14,642 genes in blood. A total of 23,645,971 significant associations, grouped into 9,930 eQTLs linked to the expression levels of 6,051 genes, were reported.
Among these significant eQTLs, 36.2% were associated in cis with the expression levels of 3,952 genes, which corresponded to 65.3% of regulated genes showing at least one cis-associated region. This represents a proportion of cis-eQTL similar to that observed in other studies (e.g. Crespo-Piazuelo et al., and Farhangi et al.) (6, 47). Moreover, cis-associated regions tend to be larger in both the number of variants and significance level than trans-eQTL regions, as was also observed by Dixon et al. (48) and Lim et al. (49). The cis-regulatory variants were enriched in previously mapped regulatory regions, in line with what had been reported in previous studies (e.g. Dixon et al., Crespo-Piazuelo et al.) (6, 48). Both promoters and 3’UTR regions were similarly enriched by cis-regulatory elements, highlighting the importance of considering the regulatory impact of 3’UTR regions (50).
It is worth highlighting those genes expressed in the blood transcriptome showing the most relevant cis-associations with genome. The most significant association (p-value= 2.02x10-74) was found in cis between the expression levels of the ACBD5 gene and an intergenic region upstream the gene. Currently, no enhancer regions are annotated in this region. However, transcription factor binding sites for GATA1, NFACTC2 and TBP were found inside, which would indicate a possible regulatory role. The gene ACBD5 is known to affect lipid metabolism through peroxisomal defects (51). However, mutations in ACBD5 have been seen associated to leukodystrophy and pexophagy, having a possible effect on platelet formation and megakaryocyte differentiation (52, 53). The NOX4 gene showed the second most significant eQTL (p-value= 2.98x10-73), being its expression levels associated with the intergenic SNPs rs328730607 and rs331477910, located upstream of the TSS of the gene. NOX4 is involved with non-phagocytic cells reactive oxygen species production (54). Thus, is considered a tumor-suppressor gene whose overexpression has been described to impact the efficiency of the transcription factor YY1, macrophage infiltration, and inflammatory capacity (55, 56).
Despite the high incidence of cis-eQTL regulating the blood transcriptome, 60.6% of genes putatively regulated at genetic level presented at least one form of trans-regulation. The vast majority of these trans-eQTLs were found to regulate multiple genes. In this study, we focused on those variants associated to the expression of ten or more transcripts. A total of 430,694 variants were detected as transcriptional hotspots, 344,328 of them cis-regulating the expression levels of at least one of their associated genes. Remarkably, SSC6 was among the pig chromosomes with the highest number of hotspots. Similarly, Crespo-Piazuelo et al. (6) reported 102 hotspots located at 56.3-64.5 Mb on SSC6 that were consistently associated to gene expression levels in duodenum, muscle and liver pig tissues, and were predicted to have a moderate or high impact on protein sequences. A total of 77 hotspots on SSC6 associated to blood transcriptome were shared with these hotspots identified in all tissues, supporting the existence of common regulatory elements.
Among the 2,093 genes regulated by the hotspots, 228 were annotated as transcription factors (TF) and co-factors, including several immunity-related TF and co-factors. Among them, the ARNT, a TF involved in the regulation of different biological functions including innate and adaptative immune responses (57). In our study, 2,013 cis-hotspots were associated to ARNT gene expression. In addition, a missense variant (rs338823350) associated with the expression of 10 genes was found on the coding region of the ARNT gene. Other co-factors regulating immunity functions and with missense hotspot variants were NLRP12, SIRT2 and KMT5C.
Special attention must be given to the identified top-hotspots, some of which contained top cis-regulatory variants associated with at least one transcript. Our results describe top-hotspots regulating co-expressed genes related to immune functions and associated with health traits, making them strong candidates for immunomodulation in pigs. It is worth noting the 37 highly linked top-hotspots found in intron 6 of the transcription factor CAMTA1. These 37 variants, among which rs3472545010 was located within an enhancer, regulated a total of 154 different genes, with a unique cis-hotspot for VAPM3 gene. The gene VAMP3 is involved in vesicle membrane adhesion across multiple cellular populations; a particular relevant function of VAMP3 in blood relies in fibronectin reabsorption and release in platelets via toll-like receptor signaling (58, 59). Among genes regulated by the SSC6 top-hotspots, CSF3R, JAK2, SOCS3, STAT5B and UBE2D1 are implicated in the signaling by the CSF3 pathway. CSF3, also known as G-CSF, is a cytokine that regulates production of neutrophils (60). Remarkably, these genes were highly co-expressed between them and also showed significant correlations with neutrophil counts and the neutrophil/lymphocyte ratio. Another top-hotspot, composed exclusively by the intergenic variant rs326486411, showed potential immunological implications. This variant was found trans-associated with several immunity candidate genes such as ADA, CD1E, IL20RB, RAG1 and RAG2. The RAG1 and RAG2 genes are well characterized immunity markers, being involved in V(D)J recombination (61). Curiously, the expression of several genes regulated by this hotspot correlated negatively with phagocytosis-related traits. Among the candidate genes for immunity mentioned, only CD1E and IL20RB could be a priori tangentially related to phagocytic capacity, given the CD1E regulatory functions of dendritic cells (62), and in the case of IL20RB involvement pathogens elimination (63). Due to the abundance of genes regulated by rs326486411 and their relationship with immunity, its intergenic location is a strong candidate for being a regulatory element in the pig genome.
Additional candidate regulators of gene expression with the potential to determine health traits were identified in the present study. The overlapping and colocalization studies with previously QTLs for health traits (25, 39) reported strong candidate genes such as CLEC12B, KLRD1 or ZAP70 which could influence the percentages of T-helper and memory T-helper cells. Several of the putative causal mutations identified by coloc were located in regulatory regions and affected transcription factor binding sites. Genes sharing putative causal variants with memory T cells were CLEC12B, KLRD1 and the homologue of KLRC1, ENSSSCG00000036743, both members of the killer cell lectin-like receptor family. Members of both gene families are highly expressed in memory T cells and have been involved in the activation (CLECs) and killing functions (KLRs) of memory T cells (64). The variant rs1113630513, located in an enhancer region (ENSSSCR5_BG8XW), was associated with the expression of all three genes and memory T-cell percentage and was found to affect binding sites for several members of the IRF transcription factor family. Members of the IRF family have been reported to be involved in CD4-positive or CD8-positive, alpha-beta T cell lineage commitment, especially in Helper T cell commitment through interferon I (65). For helper T cells, several members of the IGKV gene family and ZAP70 shared putative common causal variants. The IGKV loci in pigs contains several pseudogenes; however, the IGKV2 variants detected in this study are the most active (66). ZAP70 is a known regulator of adaptative immunity through T cell development (67). Five candidate putative mutations (rs707038723, rs81498129, rs340972582, rs337569046 and rs318655915), mapped inside enhancers, were found to affect binding sites for RORA, which is known to be involved in T-helper cell differentiation (68). The putative causal mutations identified in this study could impact pig immunity through the regulation of gene expression and could serve as target candidates for enhancing cellular immune responses in pigs. Overall, our results point towards regulators of pig immunity that could be used as biomarkers. Further studies are needed to validate these results and to assess the applicability of these markers in breeding programs.
Finally, the identified regulators of blood transcriptome showed important coincidences with those reported by the FarmGTEx consortium (13) across various experimental setups, reinforcing the robustness of the transcriptomic analysis and highlighting important putative regulators. Furthermore, the comparison of blood transcriptome eQTLs with those observed in muscle, duodenum and liver transcriptomes (6) revealed a high proportion of genes commonly regulated across these tissues, as well as shared regulatory hotspots variants. These results confirm the existence of common transcriptional regulatory mechanisms across tissues, which has already been postulated in previous studies (6, 69–71).
In conclusion, in the present study we have analyzed the blood transcriptome of 255 commercial Duroc pigs, reporting more than 23 million associations between 5,682,600 variants and 6,051 genes. We have characterized cis, trans and hotspot regulatory variants of the blood transcriptome across the pig genome and annotated the most notable ones associated with immunity. The annotation of the identified cis-regulatory variants remarked the importance of considering 3’UTR as regulatory regions. Additionally, we compared our results with previous studies on blood and other pig tissue transcriptomes identifying commonly regulatory variants. The colocalization studies of eQTL with QTLs associated with health traits revealed a list of potential causative mutations regulating immunocompetence in pigs. All these data contribute to expand our knowledge of porcine gene expression regulation and provide insights into the regulatory mechanisms that shape immunity-related phenotypes.
Data availability statement
The raw sequence data used in this study have been deposited in the SRA repository with the Bioproject accession code PRJNA1267984. Significant associations detected through eGWAS have been made publicly available in CORA.RDR repository (Doi: https://doi.org/10.34810/data2296).
Ethics statement
The animal study was approved by Ethical Committee of the Institut de Recerca i Tecnologia Agroalimentàries. The study was conducted in accordance with the local legislation and institutional requirements.
Author contributions
TJ-J: Data curation, Investigation, Methodology, Software, Writing – original draft, Writing – review & editing. DC-P: Data curation, Investigation, Software, Supervision, Writing – review & editing, Methodology. CH-B: Software, Writing – review & editing. OG-R: Investigation, Writing – review & editing. LF: Data curation, Software, Writing – review & editing. RQ: Conceptualization, Funding acquisition, Resources, Supervision, Writing – review & editing. MB: Conceptualization, Funding acquisition, Investigation, Methodology, Project administration, Resources, Supervision, Writing – review & editing.
Funding
The author(s) declare that financial support was received for the research and/or publication of this article. This study was funded by grants PID2020-112677RB-C21 and PID2023-148961OB-C21 awarded by MCIN/AEI/10.13039/501100011033. Jové-Juncà, T. was supported by an IRTA fellowship (CPI1221) while Hernández-Banqué C. was funded by FPI grant (PRE2021-097825) granted by the Spanish Ministry of Science and Innovation. Authors belong to the Consolidated Research Group “Sustainable animal husbandry” (reference 2021-SGR-01552), recognised by the Department of Universities, Research and Information Society (Generalitat de Catalunya).
Acknowledgments
Authors would like to acknowledge Selecció Batallé S.A. for their collaboration in the farm and slaughterhouse.
Conflict of interest
Author DC-P was employed by company Cuarte S.L., Spain.
The remaining authors declare that the research was conducted in the absence of any commercial or financial relationships that could be construed as a potential conflict of interest.
Generative AI statement
The author(s) declare that no Generative AI was used in the creation of this manuscript.
Publisher’s note
All claims expressed in this article are solely those of the authors and do not necessarily represent those of their affiliated organizations, or those of the publisher, the editors and the reviewers. Any product that may be evaluated in this article, or claim that may be made by its manufacturer, is not guaranteed or endorsed by the publisher.
Supplementary material
The Supplementary Material for this article can be found online at: https://www.frontiersin.org/articles/10.3389/fimmu.2025.1582982/full#supplementary-material
Supplementary Figure 1 | Pie charts representing the consequences of (A) all cis-associated variants; (B) cis-variants in coding regions.
References
1. Hindorff LA, Sethupathy P, Junkins HA, Ramos EM, Mehta JP, Collins FS, et al. Potential etiologic and functional implications of genome-wide association loci for human diseases and traits. Proc Natl Acad Sci U S A. (2009) 106:9362–7. doi: 10.1073/PNAS.0903103106
2. Maurano MT, Humbert R, Rynes E, Thurman RE, Haugen E, Wang H, et al. Systematic localization of common disease-associated variation in regulatory DNA. Science. (2012) 337:1190–5. doi: 10.1126/SCIENCE.1222794
3. Ward LD and Kellis M. Interpreting noncoding genetic variation in complex traits and human disease. Nat Biotechnol. (2012) 30:1095–106. doi: 10.1038/NBT.2422
4. Stranger BE, Nica AC, Forrest MS, Dimas A, Bird CP, Beazley C, et al. Population genomics of human gene expression. Nat Genet. (2007) 39:1217–24. doi: 10.1038/NG2142
5. Ardlie KG, DeLuca DS, Segrè AV, Sullivan TJ, Young TR, Gelfand ET, et al. Human genomics. The Genotype-Tissue Expression (GTEx) pilot analysis: multitissue gene regulation in humans. Science. (2015) 348:648–60. doi: 10.1126/SCIENCE.1262110
6. Crespo-Piazuelo D, González-Rodríguez O, Mongellaz M, Mercat M, Bink M, Huisman A, et al. Identification of transcriptional regulatory variants in pig duodenum, liver and muscle tissues. Gigascience. (2023) 12:1. doi: 10.1093/GIGASCIENCE/GIAD042
7. Ballester M, Ramayo-Caldas Y, Revilla M, Corominas J, Castelló A, Estellé J, et al. Integration of liver gene co-expression networks and eGWAs analyses highlighted candidate regulators implicated in lipid metabolism in pigs. Sci Rep. (2017) 7. doi: 10.1038/SREP46539
8. Cánovas A, Pena RN, Gallardo D, Ramírez O, Amills M, and Quintanilla R. Segregation of regulatory polymorphisms with effects on the gluteus medius transcriptome in a purebred pig population. PLoS One. (2012) 7. doi: 10.1371/JOURNAL.PONE.0035583
9. Criado-Mesas L, Ballester M, Crespo-Piazuelo D, Castelló A, Fernández AI, and Folch JM. Identification of eQTLs associated with lipid metabolism in Longissimus dorsi muscle of pigs with different genetic backgrounds. Sci Rep. (2020) 10. doi: 10.1038/S41598-020-67015-4
10. González-Prendes R, Mármol-Sánchez E, Quintanilla R, Castelló A, Zidi A, Ramayo-Caldas Y, et al. About the existence of common determinants of gene expression in the porcine liver and skeletal muscle. BMC Genomics. (2019) 20. doi: 10.1186/S12864-019-5889-5
11. Maroilley T, Lemonnier G, Lecardonnel J, Esquerré D, Ramayo-Caldas Y, Mercat MJ, et al. Deciphering the genetic regulation of peripheral blood transcriptome in pigs through expression genome-wide association study and allele-specific expression analysis. BMC Genomics. (2017) 18. doi: 10.1186/S12864-017-4354-6
12. Corominas J, Ramayo-Caldas Y, Puig-Oliveras A, Estellé J, Castelló A, Alves E, et al. Analysis of porcine adipose tissue transcriptome reveals differences in de novo fatty acid synthesis in pigs with divergent muscle fatty acid composition. BMC Genomics. (2013) 14:1–14. doi: 10.1186/1471-2164-14-843/FIGURES/4
13. Teng J, Gao Y, Yin H, Bai Z, Liu S, Zeng H, et al. A compendium of genetic regulatory effects across pig tissues. bioRxiv. (2022) 19. doi: 10.1101/2022.11.11.516073
14. Grundberg E, Small KS, Hedman ÅK, Nica AC, Buil A, Keildson S, et al. Mapping cis- and trans-regulatory effects across multiple tissues in twins. Nat Genet. (2012) 44:1084–9. doi: 10.1038/NG.2394
15. Nica AC, Montgomery SB, Dimas AS, Stranger BE, Beazley C, Barroso I, et al. Candidate causal regulatory effects by integration of expression QTLs with complex trait genetic associations. PLoS Genet. (2010) 6. doi: 10.1371/JOURNAL.PGEN.1000895
16. Liu J, Lang K, Tan S, Jie W, Zhu Y, Huang S, et al. A web-based database server using 43,710 public RNA-seq samples for the analysis of gene expression and alternative splicing in livestock animals. BMC Genomics. (2022) 23. doi: 10.1186/S12864-022-08881-2
17. FarmGTEx. Available online at: https://www.farmgtex.org/ (Accessed November 13, 2024).
18. Andersson L, Archibald AL, Bottema CD, Brauning R, Burgess SC, Burt DW, et al. Coordinated international action to accelerate genome-to-phenome with FAANG, the Functional Annotation of Animal Genomes project. Genome Biol. (2015) 16. doi: 10.1186/S13059-015-0622-4
19. Hou N, Du X, and Wu S. Advances in pig models of human diseases. Anim Model Exp Med. (2022) 5:141–52. doi: 10.1002/AME2.12223
20. Lunney JK, Van Goor A, Walker KE, Hailstock T, Franklin J, and Dai C. Importance of the pig as a human biomedical model. Sci Transl Med. (2021) 13. doi: 10.1126/SCITRANSLMED.ABD5758
21. Flisikowska T, Stachowiak M, Xu H, Wagner A, Hernandez-Caceres A, Wurmser C, et al. Porcine familial adenomatous polyposis model enables systematic analysis of early events in adenoma progression. Sci Rep. (2017) 7. doi: 10.1038/S41598-017-06741-8
22. Klymiuk N, Blutke A, Graf A, Krause S, Burkhardt K, Wuensch A, et al. Dystrophin-deficient pigs provide new insights into the hierarchy of physiological derangements of dystrophic muscle. Hum Mol Genet. (2013) 22:4368–82. doi: 10.1093/HMG/DDT287
23. Li X, Tang XX, Vargas Buonfiglio LG, Comellas AP, Thornell IM, Ramachandran S, et al. Electrolyte transport properties in distal small airways from cystic fibrosis pigs with implications for host defense. Am J Physiol Lung Cell Mol Physiol. (2016) 310:L670–9. doi: 10.1152/AJPLUNG.00422.2015
24. Thorn CE, Bowman AS, and Eckersall D. Hematology of pigs. Schalm’s Vet Hematol Seventh Ed. (2020), 1019–25. doi: 10.1002/9781119500537.CH113
25. Ballester M, Ramayo-Caldas Y, González-Rodríguez O, Pascual M, Reixach J, Díaz M, et al. Genetic parameters and associated genomic regions for global immunocompetence and other health-related traits in pigs. Sci Rep. (2020) 10. doi: 10.1038/S41598-020-75417-7
26. Zhang S, Yu B, Liu Q, Zhang Y, Zhu M, Shi L, et al. Assessment of hematologic and biochemical parameters for healthy commercial pigs in China. Anim an Open Access J MDPI. (2022) 12. doi: 10.3390/ANI12182464
27. Purcell S. PLINK v1.90b3.42(2007). Available online at: http://pngu.mgh.harvard.edu/purcell/plink/ (Accessed November 8, 2022).
28. Browning BL, Zhou Y, and Browning SR. A One-Penny Imputed Genome from Next-Generation Reference Panels. American Society of Human genetics, Rockville USA. (2018). doi: 10.1016/j.ajhg.2018.07.015.
29. Wingett SW and Andrews S. FastQ Screen: A tool for multi-genome mapping and quality control. F1000Research. (2018) 7:1338. doi: 10.12688/F1000RESEARCH.15931.2
30. Dobin A, Davis CA, Schlesinger F, Drenkow J, Zaleski C, Jha S, et al. STAR: ultrafast universal RNA-seq aligner. Bioinformatics. (2013) 29:15–21. doi: 10.1093/BIOINFORMATICS/BTS635
31. Li B and Dewey CN. RSEM: Accurate transcript quantification from RNA-Seq data with or without a reference genome. BMC Bioinf. (2011) 12:1–16. doi: 10.1186/1471-2105-12-323/TABLES/6
32. Robinson MD, McCarthy DJ, and Smyth GK. edgeR: A Bioconductor package for differential expression analysis of digital gene expression data. Bioinformatics. (2009) 26:139–40. doi: 10.1093/BIOINFORMATICS/BTP616
33. Yang J, Hong Lee S, Goddard M, and P V. GCTA: a tool for genome-wide complex trait analysis. Am J Hum Genet. (2011) 8:76–82. doi: 10.1016/j.ajhg.2010.11.011
34. Haynes W. Bonferroni correction. Encycl Syst Biol. (2013), 154–4. doi: 10.1007/978-1-4419-9863-7_1213
35. McLaren W, Gil L, Hunt SE, Riat HS, Ritchie GRS, Thormann A, et al. The ensembl variant effect predictor. Genome Biol. (2016) 17:1–14. doi: 10.1186/S13059-016-0974-4/TABLES/8
36. Hecker N and Hiller M. A genome alignment of 120 mammals highlights ultraconserved element variability and placenta-associated enhancers. Gigascience. (2020) 9:giz159. doi: 10.1093/GIGASCIENCE/GIZ159
37. Kinsella RJ, Kähäri A, Haider S, Zamora J, Proctor G, Spudich G, et al. Ensembl BioMarts: a hub for data retrieval across taxonomic space. Database (Oxford). (2011) 2011. doi: 10.1093/DATABASE/BAR030
38. Bindea G, Mlecnik B, Hackl H, Charoentong P, Tosolini M, Kirilovsky A, et al. ClueGO: a Cytoscape plug-in to decipher functionally grouped gene ontology and pathway annotation networks. Bioinformatics. (2009) 25:1091–3. doi: 10.1093/BIOINFORMATICS/BTP101
39. Ballester M, Jové-Juncà T, Pascual A, López-Serrano S, Crespo-Piazuelo D, Hernández-Banqué C, et al. Genetic architecture of innate and adaptive immune cells in pigs. Front Immunol. (2023) 14:1058346. doi: 10.3389/FIMMU.2023.1058346
40. Wallace C. Statistical testing of shared genetic control for potentially related traits. Genet Epidemiol. (2013) 37:802–13. doi: 10.1002/GEPI.21765
41. Bailey TL, Johnson J, and Grant CE. Noble WS. The MEME suite. Nucleic Acids Res. (2015) 43:W39–49. doi: 10.1093/NAR/GKV416
42. Rauluseviciute I, Riudavets-Puig R, Blanc-Mathieu R, Castro-Mondragon JA, Ferenc K, Kumar V, et al. JASPAR 2024: 20th anniversary of the open-access database of transcription factor binding profiles. Nucleic Acids Res. (2024) 52:D174–82. doi: 10.1093/NAR/GKAD1059
43. Shen WK, Chen SY, Gan ZQ, Zhang YZ, Yue T, Chen MM, et al. AnimalTFDB 4.0: a comprehensive animal transcription factor database updated with variation and expression annotations. Nucleic Acids Res. (2023) 51:D39–45. doi: 10.1093/NAR/GKAC907
44. Shannon P, Markiel A, Ozier O, Baliga NS, Wang JT, Ramage D, et al. Cytoscape: a software environment for integrated models of biomolecular interaction networks. Genome Res. (2003) 13:2498–504. doi: 10.1101/GR.1239303
45. Watson-Haigh NS, Kadarmideen HN, and Reverter A. PCIT: an R package for weighted gene co-expression networks based on partial correlation and information theory approaches. Bioinformatics. (2010) 26:411–3. doi: 10.1093/BIOINFORMATICS/BTP674
46. Minskaia E, Saraiva BC, Soares MMV, Azevedo RI, Ribeiro RM, Kumar SD, et al. Molecular markers distinguishing T cell subtypes with TSDR strand-bias methylation. Front Immunol. (2018) 9:2540. doi: 10.3389/FIMMU.2018.02540
47. Farhangi S, Gòdia M, Derks MFL, Harlizius B, Dibbits B, González-Prendes R, et al. Expression genome-wide association study identifies key regulatory variants enriched with metabolic and immune functions in four porcine tissues. BMC Genomics. (2024) 25. doi: 10.1186/S12864-024-10583-W
48. Dixon AL, Liang L, Moffatt MF, Chen W, Heath S, Wong KCC, et al. A genome-wide association study of global gene expression. Nat Genet. (2007) 39:1202–7. doi: 10.1038/ng2109
49. Lim KS, Cheng J, Tuggle C, Dyck M, Canada PG, Fortin F, et al. Genetic analysis of the blood transcriptome of young healthy pigs to improve disease resilience. Genet Sel Evol. (2023) 55. doi: 10.1186/S12711-023-00860-9
50. Schwerk J and Savan R. Translating the untranslated region. J Immunol. (2015) 195:2963–71. doi: 10.4049/JIMMUNOL.1500756
51. Ferdinandusse S, Falkenberg KD, Koster J, Mooyer PA, Jones R, van Roermund CWT, et al. ACBD5 deficiency causes a defect in peroxisomal very long-chain fatty acid metabolism. J Med Genet. (2017) 54:330–7. doi: 10.1136/JMEDGENET-2016-104132
52. Bartlett M, Nasiri N, Pressman R, Bademci G, and Forghani I. First reported adult patient with retinal dystrophy and leukodystrophy caused by a novel ACBD5 variant: A case report and review of literature. Am J Med Genet A. (2021) 185:1236–41. doi: 10.1002/AJMG.A.62073
53. Nazarko TY, Ozeki K, Till A, Ramakrishnan G, Lotfi P, Yan M, et al. Peroxisomal Atg37 binds Atg30 or palmitoyl-CoA to regulate phagophore formation during pexophagy. J Cell Biol. (2014) 204:541–57. doi: 10.1083/JCB.201307050
54. Brar SS, Kennedy TP, Sturrock AB, Huecksteadt TP, Quinn MT, Richard Whorton A, et al. An NAD(P)H oxidase regulates growth and transcription in melanoma cells. Am J Physiol Cell Physiol. (2002) 282. doi: 10.1152/AJPCELL.00496.2001
55. Liu WJ, Wang L, Zhou FM, Liu SW, Wang W, Zhao EJ, et al. Elevated NOX4 promotes tumorigenesis and acquired EGFR-TKIs resistance via enhancing IL-8/PD-L1 signaling in NSCLC. Drug Resist Update. (2023) 70. doi: 10.1016/J.DRUP.2023.100987
56. Vendrov AE, Xiao H, Lozhkin A, Hayami T, Hu G, Brody MJ, et al. Cardiomyocyte NOX4 regulates resident macrophage-mediated inflammation and diastolic dysfunction in stress cardiomyopathy. Redox Biol. (2023) 67. doi: 10.1016/J.REDOX.2023.102937
57. Huang W, Rui K, Wang X, Peng N, Zhou W, Shi X, et al. The aryl hydrocarbon receptor in immune regulation and autoimmune pathogenesis. J Autoimmun. (2023) 138:103049. doi: 10.1016/J.JAUT.2023.103049
58. Lowenstein CJ. VAMP-3 mediates platelet endocytosis. Blood. (2017) 130:2816–8. doi: 10.1182/BLOOD-2017-10-808576
59. Banerjee M, Huang Y, Joshi S, Popa GJ, Mendenhall MD, Wang QJ, et al. Platelets endocytose viral particles and are activated via TLR (Toll-like receptor) signaling. Arterioscler Thromb Vasc Biol. (2020) 40:1635–50. doi: 10.1161/ATVBAHA.120.314180
60. Panopoulos AD and Watowich SS. Granulocyte colony-stimulating factor: Molecular mechanisms of action during steady state and ‘emergency’ hematopoiesis. Cytokine. (2008) 42:277–88. doi: 10.1016/J.CYTO.2008.03.002
61. Pabst R. The pig as a model for immunology research. Cell Tissue Res. (2020) 380:287–304. doi: 10.1007/S00441-020-03206-9
62. Angénieux C, Fraisier V, Maître B, Racine V, van der Wel N, Fricker D, et al. The cellular pathway of CD1e in immature and maturing dendritic cells. Traffic. (2005) 6:286–302. doi: 10.1111/J.1600-0854.2005.00272.X
63. Logsdon NJ, Deshpande A, Harris BD, Rajashankar KR, and Walter MR. Structural basis for receptor sharing and activation by interleukin-20 receptor-2 (IL-20R2) binding cytokines. Proc Natl Acad Sci U S A. (2012) 109:12704–9. doi: 10.1073/PNAS.1117551109/-/DCSUPPLEMENTAL/PNAS.201117551SI.PDF
64. Weng N-P, Araki Y, and Subedi K. The molecular basis of the memory T cell response: differential gene expression and its epigenetic regulation HHS Public Access. Nat Rev Immunol. (2012) 12:306–15. doi: 10.1038/nri3173
65. Zhang R, Chen K, Peng L, and Xiong H. Regulation of T helper cell differentiation by interferon regulatory factor family members. Immunol Res. (2012) 54:169–76. doi: 10.1007/S12026-012-8328-0
66. Schwartz JC, Lefranc MP, and Murtaugh MP. Evolution of the porcine (Sus scrofa domestica) immunoglobulin kappa locus through germline gene conversion. Immunogenetics. (2012) 64:303–11. doi: 10.1007/S00251-011-0589-6
67. Fischer A, Picard C, Chemin K, Dogniaux S, Le Deist F, and Hivroz C. ZAP70: a master regulator of adaptive immunity. Semin Immunopathol. (2010) 32:107–16. doi: 10.1007/S00281-010-0196-X
68. Dawson HD, Collins G, Pyle R, Key M, and Taub DD. The Retinoic Acid Receptor-alpha mediates human T-cell activation and Th2 cytokine and chemokine production. BMC Immunol. (2008) 9. doi: 10.1186/1471-2172-9-16
69. Dimas AS, Deutsch S, Stranger BE, Montgomery SB, Borel C, Attar-Cohen H, et al. Common regulatory variation impacts gene expression in a cell type-dependent manner. Science. (2009) 325:1246–50. doi: 10.1126/SCIENCE.1174148
70. Emilsson V, Thorleifsson G, Zhang B, Leonardson AS, Zink F, Zhu J, et al. Genetics of gene expression and its effect on disease. Nature. (2008) 452:423–8. doi: 10.1038/NATURE06758
Keywords: gene expression, eGWAS, swine, immune system, lymphocytes, SNP, RNA-seq
Citation: Jové-Juncà T, Crespo-Piazuelo D, Hernández-Banqué C, González-Rodríguez O, Fang L, Quintanilla R and Ballester M (2025) Unveiling regulatory variants in the blood transcriptome and their association with immunity traits in pigs. Front. Immunol. 16:1582982. doi: 10.3389/fimmu.2025.1582982
Received: 25 February 2025; Accepted: 07 May 2025;
Published: 05 June 2025.
Edited by:
Marta Alonso-Hearn, Basque Research and Technology Alliance (BRTA), SpainReviewed by:
Eduard Murani, Research Institute for Farm Animal Biology, GermanyGerard Badia-Bringué, NEIKER Basque Institute for Agricultural Research and Development, Spain
Copyright © 2025 Jové-Juncà, Crespo-Piazuelo, Hernández-Banqué, González-Rodríguez, Fang, Quintanilla and Ballester. This is an open-access article distributed under the terms of the Creative Commons Attribution License (CC BY). The use, distribution or reproduction in other forums is permitted, provided the original author(s) and the copyright owner(s) are credited and that the original publication in this journal is cited, in accordance with accepted academic practice. No use, distribution or reproduction is permitted which does not comply with these terms.
*Correspondence: Maria Ballester, bWFyaWEuYmFsbGVzdGVyQGlydGEuY2F0; Raquel Quintanilla, cmFxdWVsLnF1aW50YW5pbGxhQGlydGEuY2F0