 Lu Qiao
 Zenghua Liang1,2,3†
 Pengyi Ma
 Cuiyun Sun
 Lin Yu
- 1Department of Biochemistry and Molecular Biology, School of Basic Medical Sciences, Tianjin Medical University, Tianjin, China
- 2Laboratory of Molecular Immunology, Research Center of Basic Medical Science, Tianjin Medical University, Tianjin, China
- 3Tianjin Key Laboratory of Cellular and Molecular Immunology and Key Laboratory of the Educational Ministry of China, Tianjin Medical University, Tianjin, China
- 4Department of Radiology, Tianjin Medical University General Hospital, Tianjin, China
- 5Department of Neuropathology, Tianjin Key Laboratory of Injuries, Variations and Regeneration of the Nervous System, Key Laboratory of Post-trauma Neuro-repair and Regeneration in Central Nervous System of Education Ministry, Tianjin Neurological Institute, Tianjin Medical University General Hospital, Tianjin, China
Background: Triple-negative breast cancer (TNBC), the most lethal breast cancer subtype, demonstrates poor prognosis due to its high rates of metastasis, recurrence, and mortality. The metastatic potential in TNBC patients serves as a critical determinant of clinical outcomes. The high mobility group AT-hook 2 (HMGA2) has emerged as a novel chromatin architectural regulator, its specific role in TNBC metastasis requires further investigation.
Methods: We analyzed the expression of HMGA2 in TNBC and non-TNBC patients using Genomic Data Commons (GDC) The Cancer Genome Atlas (TCGA) and immunohistochemistry. The correlation between HMGA2 expression and patient prognosis was assessed using the Kaplan-Meier estimator. The roles of HMGA2 in TNBC metastasis were validated through cell wound healing assay, transwell assay and lung metastatic model. RNA sequencing, chromatin immunoprecipitation, DNA electrophoretic mobility shift, co-immunoprecipitation and chromosome conformation capture assays were applied to identify the mechanisms by how HMGA2 functions as a novel chromatin architectural regulator.
Results: Our study revealed significantly upregulated HMGA2 expression in TNBC patients compared to non-TNBC patients. Kaplan-Meier survival analysis demonstrated a strong association between elevated HMGA2 expression and poor prognosis in TNBC cases. Functional studies showed that HMGA2 downregulation markedly inhibited TNBC metastatic progression. Mechanistic investigations revealed that HMGA2 facilitates TNBC metastasis through transcriptional activation of matrix metalloproteinases (MMPs). Specifically, HMGA2 interacted with lysine acetyltransferase 6A (KAT6A) to mediate histone acetylation at MMPs promoter regions. Concurrently, HMGA2 induced chromatin conformation changes to enhance MMPs transcriptional activity.
Conclusion: These findings establish that the HMGA2/KAT6A complex promote MMPs expression to drive TNBC metastasis, identifying novel therapeutic targets for this aggressive malignancy.
1 Introduction
Breast cancer is the most frequently diagnosed malignancy among women worldwide, with metastasis being the leading cause of mortality (1). Among its subtypes, triple-negative breast cancer (TNBC) is the most aggressive; it exhibits high metastatic potential, elevated recurrence rates, and poor prognosis (2). A comprehensive understanding of the molecular mechanisms underlying TNBC metastasis is crucial for advancing targeted interventions.
High mobility group AT-hook 2 (HMGA2) functions as a non-histone architectural transcription factor (3). Its DNA-binding domain is located at the N-terminal of HMGA2, whereas the acidic domain resides at the C-terminal (4). HMGA2 specifically binds to AT-rich DNA sequences, thereby modifying the chromatin architecture and regulating the transcription of target genes. It participates in diverse biological processes through protein-protein interactions (5). During embryogenesis, HMGA2 expression is significantly elevated but remains relatively low in most adult tissues. However, its overexpression is frequently observed in various human malignancies, thus indicating its potential oncogenic role (6). For example, HMGA2 binds to the signal transducer and activator of transcription 3 (STAT3) promoter to activate its transcription and promote macrophage recruitment in colorectal cancer (CRC) (7). HMGA2 also induces transforming growth factor beta 2 (TGFβ-2) receptor expression, activates the TGFβ signaling pathway, and facilitates cancer cell metastasis (8). Accumulating evidence identifies HMGA2 as a key driver of epithelial-to-mesenchymal transition (EMT) (9). Additionally, its interaction with retinoblastoma protein (pRb) mediates forkhead box L2 (FOXL2) transactivation and potentially contributes to metastatic progression (10). Moreover, HMGA2 interacts with poly(ADP-ribose) polymerase 1 (PARP1) by enhancing PARP1 activity and reducing cancer cell sensitivity to olaparib (a PARP inhibitor) (11). Previous studies have demonstrated HMGA2’s role in TNBC proliferation, migration, and invasion (12, 13). However, its precise function as a chromatin architectural regulator in TNBC metastasis remains unclear.
Lysine acetyltransferase 6A (KAT6A), a MYST family member, regulates gene expression by acetylating target gene promoters and enhancers (14). KAT6A specifically mediates histone acetylation at H3 lysine 9 (H3K9) (H3K9ac) and H3K23 (H3K23ac) (15). Substantial evidence supports its oncogenic role in various cancers. For instance, KAT6A regulates stemness and proliferation (16). In ovarian cancer, it binds to and acetylates constitutive photomorphogenesis 1 (COP1) at K294, resulting in β-catenin accumulation and enhanced activity (17). In glioma, KAT6A activates phosphatidylinositol-4,5-bisphosphate 3-kinase catalytic subunit alpha (PIK3CA) transcription by recruiting tripartite motif-containing 24 (TRIM24), thereby promoting tumorigenesis (18).
Matrix metalloproteinases (MMPs), members of the metzincin protease superfamily (19), are frequently upregulated in cancers (20). These proteolytic enzymes drive cancer progression by degrading the extracellular matrix, facilitating angiogenesis, and shaping the tumor microenvironment (21). Previous studies have demonstrated that MMP1 enhances cancer invasion and metastasis (22) while also regulating cancer stemness and chemoresistance (23). MMP2, activated by MMP1 (24), with MMP9, specifically degrade the extracellular matrix, thereby facilitating metastasis (25).
This study demonstrates that HMGA2 is significantly overexpressed in TNBC and correlates with poor prognosis. Mechanistically, the study identifies KAT6A as a novel HMGA2-interacting partner, which forms a complex that binds to MMPs promoters and catalyzes site-specific histone acetylation. Furthermore, HMGA2 induces chromatin conformation changes at MMPs promoter regions and directly enhances MMPs transcription. The resulting MMPs upregulation promotes extracellular matrix degradation and drives TNBC metastasis.
2 Materials and methods
2.1 Database analysis
Gene expression data for breast cancer were obtained from Genomic Data Commons (GDC) The Cancer Genome Atlas (TCGA) (https://gdc.xenahubs.net). The 20 datasets included 1,104 tumor and 113 normal tissues, with tumor subtypes categorized as follows: 616 Luminal, 67 human epidermal growth factor receptor 2 (HER2)-positive, and 142 TNBC. Pearson’s correlation analysis between HMGA2 and MMPs messenger ribonucleic acid (mRNA) expression levels was performed using the online platform www.bioinformatics.cn.
2.2 Clinical information and tissue specimens
Human tissue specimens, including 6 normal, 60 TNBC, and 20 non-TNBC cases, were collected from the Tianjin Medical University General Hospital (TMUGH). The study was approved by the Ethics Committee of TMUGH. The ethics lot number is IRB2020-KY-289. Detailed patient information is provided in Supplementary Table 1.
2.3 Cell culture
MDA-MB-231 and BT549 cells were obtained from the China Center for Type Culture Collection (CCTCC) and authenticated by short tandem repeat (STR) profiling. HEK293T cells were purchased from the American Type Culture Collection (ATCC). MDA-MB-231 and HEK293T cells were cultured in Dulbecco’s modified Eagle’s medium (DMEM) supplemented with 10% fetal bovine serum (FBS). BT549 cells were maintained in Roswell Park Memorial Institute 1640 (RPMI-1640) medium supplemented with 10% FBS and 1 μg/mL insulin. All cells were cultured at 37°C with 5% CO2 in a humidified incubator.
2.4 Lentivirus packaging
Two HMGA2 short hairpin (sh) RNA plasmids were constructed as TRC2-pLKO-shHMGA2-1 (5’-AGTCCCTCTAAAGCAGCTCAA-3’) and TRC2-pLKO-shHMGA2-2 (5’-AGGAGGAAACTGAAGAGACAT-3’). The full-length human HMGA2 sequence, HMGA2 deletion mutant (D1, D2, D3) sequence were cloned into the pLVX-IRES-puro expression vector to generate pLVX-IRES-HMGA2, pLVX-IRES-HMGA2-D1, pLVX-IRES-HMGA2-D2, pLVX-IRES-HMGA2-D3. All plasmids were constructed by GENEWIZ. When the fusion degree of HEK293T cells reached about 70%, transient transfection of expression plasmids along with packaging plasmids using polyethyleneimine (PEI). The viral supernatant was collected at 24 h and 48 h, centrifuged for removal of floating cells, filtered through a 0.45 µm filter. MDA-MB-231 and BT549 cells were infected with the lentiviruses in the presence of 1 µg/mL puromycin. The screened cells were diluted in cascaded gradients and cultured in 96-well plates. After about 7–14 days, monoclonal formation could be see under the microscope. Selected a cell population with only one monoclonal and expanded the culture to obtain a stable knockdown or overexpressed cell lines.
2.5 Immunohistochemistry (IHC)
IHC was performed as previously described (26). A polyclonal HMGA2 antibody was applied to the tissues at a 1:250 dilution.
2.6 Western blotting (WB)
The lysis solution contained radioimmunoprecipitation assay (RIPA) lysis buffer (Solarbio, R0010), 1 mM phenylmethylsulfonyl fluoride (PMSF) (Solarbio, P0100), and 1 × protease inhibitor cocktail (PIC) (Solarbio, P6730). Protein concentrations were measured using a bicinchoninic acid assay (BCA) protein assay kit (Thermo Scientific, A55864). Proteins were separated by sodium dodecyl sulfate-polyacrylamide gel electrophoresis (SDS-PAGE) and transferred onto a nitrocellulose (NC) membrane (PALL, 66485). After blocking with 5% skim milk (Solarbio, D8340) for approximately 2 h, NC membranes were incubated with primary antibodies at 4 °C for 12–16 h. The next day, NC membranes were washed with tris-buffered saline with tween 20 (TBST) to remove residual primary antibodies, followed by incubation with secondary antibodies for 1–2 h. Protein bands were visualized using a chemiluminescence detection system. The primary antibodies used in WB were anti-HMGA2 (Proteintech, 20795-1-AP), anti-MMP1 (Proteintech, 10371-2-AP), anti-MMP2 (Proteintech, 10373-2-AP), anti-MMP9 (Proteintech, 10375-2-AP), anti-KAT6A (Santa Cruz Biotechnology, sc-293283), anti-Tubulin (Proteintech, 11224-1-AP), anti-Flag (Proteintech, 20543-1-AP).
2.7 Real-time quantitative polymerase chain reaction
Total RNA was extracted using RNA Isolator Total RNA Extraction Reagent (Vazyme, R401-01), and 1 μg of cDNA was synthesized with a reverse transcription kit (GenStar, A236-04). Quantitative polymerase chain reaction (qPCR) was performed using 2 × RealStar Fast SYBR qPCR Mix (GenStar, A303). The primers used are listed in Supplementary Table 2.
2.8 Immunofluorescence (IF)
TNBC cells were fixed with 4% paraformaldehyde (Solarbio, P1110) for 10 min, permeabilized with 0.5% Triton X-100 (Sigma-Aldrich, 93443) about 5 min and blocked with 5% bovine serum albumin (BSA) for 1 h at room temperature. Cells were incubated in primary antibody solution at 4°C overnight. HMGA2 was detected using a rabbit polyclonal antibody (dilution ratio 1: 50). Cells were rewarmed at room temperature for 1 h. After washing five times with phosphate buffered saline (PBS) (Solarbio, P1010), cells were incubated with goat anti-rabbit IgG (H + L) highly cross-adsorbed secondary antibody, Alexa Fluor™ 488 (Invitrogen, A-11034, dilution ratio 1: 200). Finally, cells washed five times with PBS and nuclei were stained with DAPI (Sigma-Aldrich, F6057).
2.9 Cell wound healing assay
TNBC cells were seeded in six-well plates and allowed to adhere. A perpendicular scratch was made, and the medium was replaced with 1% FBS. Images were captured at 0 h and 24 h using a microscope, whereas migration was quantified with ImageJ.
2.10 Transwell assay
Matrigel matrix (Corning, 356234) was diluted to an appropriate concentration and pre-added to the upper chamber of Transwell inserts (Millipore, PTEP24H48), followed by incubation at 37°C for 1 h. Approximately 1 × 10⁵ TNBC cells were resuspended in 100 μL medium (with 0% FBS) and then seeded into the upper chamber. The lower chamber was filled with appropriate medium (10% FBS). After 12–16 h of incubation, cells that invaded the inferior surface of the membrane were fixed with 4% paraformaldehyde and stained with crystal violet using ImageJ software to calculate relative invasion.
2.11 Lung metastatic model
Animal experiments strictly followed the NIH Principles for the Care of Laboratory Animals and were approved by the Institutional Animal Care and Use Committee of Tianjin Medical University. The review number is TMUaMEC 2023012. Six-week-old female BALB/c nude mice were used to establish a lung metastatic model. Approximately 1 × 10⁶ MDA-MB-231 cells resuspended in 150 μL of PBS were injected into mice tail vein (n = 5). Metastasis was monitored by bioluminescence imaging after intraperitoneal injection of D-luciferin potassium salt (Beyotime, ST196) using a In Vivo Imaging System (IVIS).
2.12 RNA sequencing
The experiment was performed using shNC or shHMGA2 from MDA-MB-231 cells and sequenced using GENEWIZ. Differentially expressed genes (DEGs) were analyzed using DESeq2 (V1.26.0) in the Bioconductor software package.
2.13 Gelatin zymography assay
When the fusion rate of TNBC cells reached 70 – 80%, the original medium was removed and replaced with a serum-free medium for further culture. The conditioned medium was collected at 12 h and 24 h, concentrated, and dissolved in 5 × non-reducing buffer. Proteins were separated on a 7.5% acrylamide gel containing gelatin, and the gel was washed and stained to visualize the gelatinolytic activity as white bands against a blue background.
2.14 Chromatin immunoprecipitation (ChIP)
A sonication ChIP kit (ABclonal, RK20258) was used to perform ChIP assays. Briefly, cells were crosslinked using a 1% formaldehyde solution (Sigma, F8775), and glycine was added to terminate crosslinking. Chromatin was sheared by sonication and 5% of the lysate was saved as an input. Then the target protein antibodies were added to the remaining ultrasound-treated sample for 12–16 h at 4 °C. The normal rabbit IgG antibody (Cell Signaling Technology, #2729) or mouse IgG antibody (Proteintech, B900620) were added to the negative control group. Protein-DNA complexes were captured using ChIP-grade magnetic beads (ABclonal, RM02915), eluted, and crosslinked. Target DNA enrichment was quantified using qPCR. The primary antibodies used in ChIP were anti-HMGA2, anti-H3K23ac (abcam, ab177275). The ChIP primers are listed in Supplementary Table 3.
2.15 Electrophoretic mobility shift assay (EMSA)
Biotin-labeled and unlabeled probes corresponding to the MMPs promoter sequences were synthesized using GENEWIZ. A Chemiluminescent EMSA Kit (Beyotime, GS009) was used to complete the EMSA assay according to the manufacturer’s protocol. The reaction groups included: 1) negative control (biotin-labeled probe only), 2) binding reaction (biotin-labeled probe + nuclear protein), and 3) competition reaction (biotin-labeled probe + nuclear protein + increasing concentrations of unlabeled probe). Samples were electrophoresed on an 8% polyacrylamide gel, transferred to a positively charged nylon membrane (Beyotime, FFN10), and crosslinked under UV light (120 mJ/cm² for 2 min). Probes were detected using horseradish peroxidase-coupled streptavidin. The EMSA probe sequences are listed in Supplementary Table 4.
2.16 Immunoprecipitation and co-immunoprecipitation (Co-IP)
Cells were lysed in NP-40 Lysis Buffer (Beyotime, P0013F) with PMSF and PIC for 1 h at 4 °C. The lysates were centrifuged at 12,000 rpm for 15 min. Overall, 100 μL of the supernatant was saved as the input. The remaining supernatant was incubated with IgG (negative control) or target protein antibodies for 12–16 h at 4°C. Added protein A/G magnetic beads (Selleck, B23201) approximately 3 h at 4 °C. IP wash buffer was used to wash the magnetic beads approximately six times and then 2 × loading buffer was used to resuspend the magnetic beads. For IP, the samples were analyzed using Coomassie Brilliant Blue staining. For Co-IP, the samples were analyzed by WB. The primary antibodies used in Co-IP were anti-HMGA2, anti-KAT6A, anti-Flag.
2.17 Chromosome conformation capture (3C) assay
Approximately 1 × 10⁷ cells were crosslinked with 1% formaldehyde to fix the chromatin conformation, and glycine was added to fully terminate formaldehyde crosslinking. Nuclei were lysed in 3C lysis buffer and digested with DpnII (NEB, R0543S) at 37°C for 12–16 h. The digested fragments were ligated using T4 DNA ligase (NEB, M0202S) at 16°C for 8 h. The ligation efficiency between the anchor sites and other sites was quantified by qPCR. Standard samples were generated by amplifying MMPs promoter regions, digesting with DpnII, and ligating with T4 DNA ligase. The crosslinking rates were normalized to the standard. All the primers used are listed in Supplementary Table 5.
2.18 Statistical analysis
GraphPad Prism 8.0.1 software was used for statistical analysis of experimental data. Student’s t-test or one-way ANOVA were used to compare the statistical significance. All the results were presented as the mean ± standard deviation (SD) from three independent experiments. *p<0.05, **p<0.01, ***p<0.001, ****p<0.0001 was regarded as indicative of statistical significance.
3 Results
3.1 HMGA2 is highly expressed in TNBC and associates with patients’ poor prognosis
To investigate HMGA2 expression patterns in breast cancer tissues, we analyzed GDC TCGA (https://gdc.xenahubs.net), which revealed significantly elevated HMGA2 mRNA levels in tumor tissues than in normal tissues (Figure 1A). Subtype-specific analysis showed that TNBC samples exhibited the highest HMGA2 expression levels (Figure 1B which was further validated by IHC staining (Figure 1C). Comparative analysis across breast cancer cell lines revealed significantly higher HMGA2 expression in TNBC cell lines than in MCF7 and T-47D cell lines (Figures 1D, E). At the same time, the endogenous HMGA2 in TNBC cells were detected by IF (Supplementary Figure 1A).
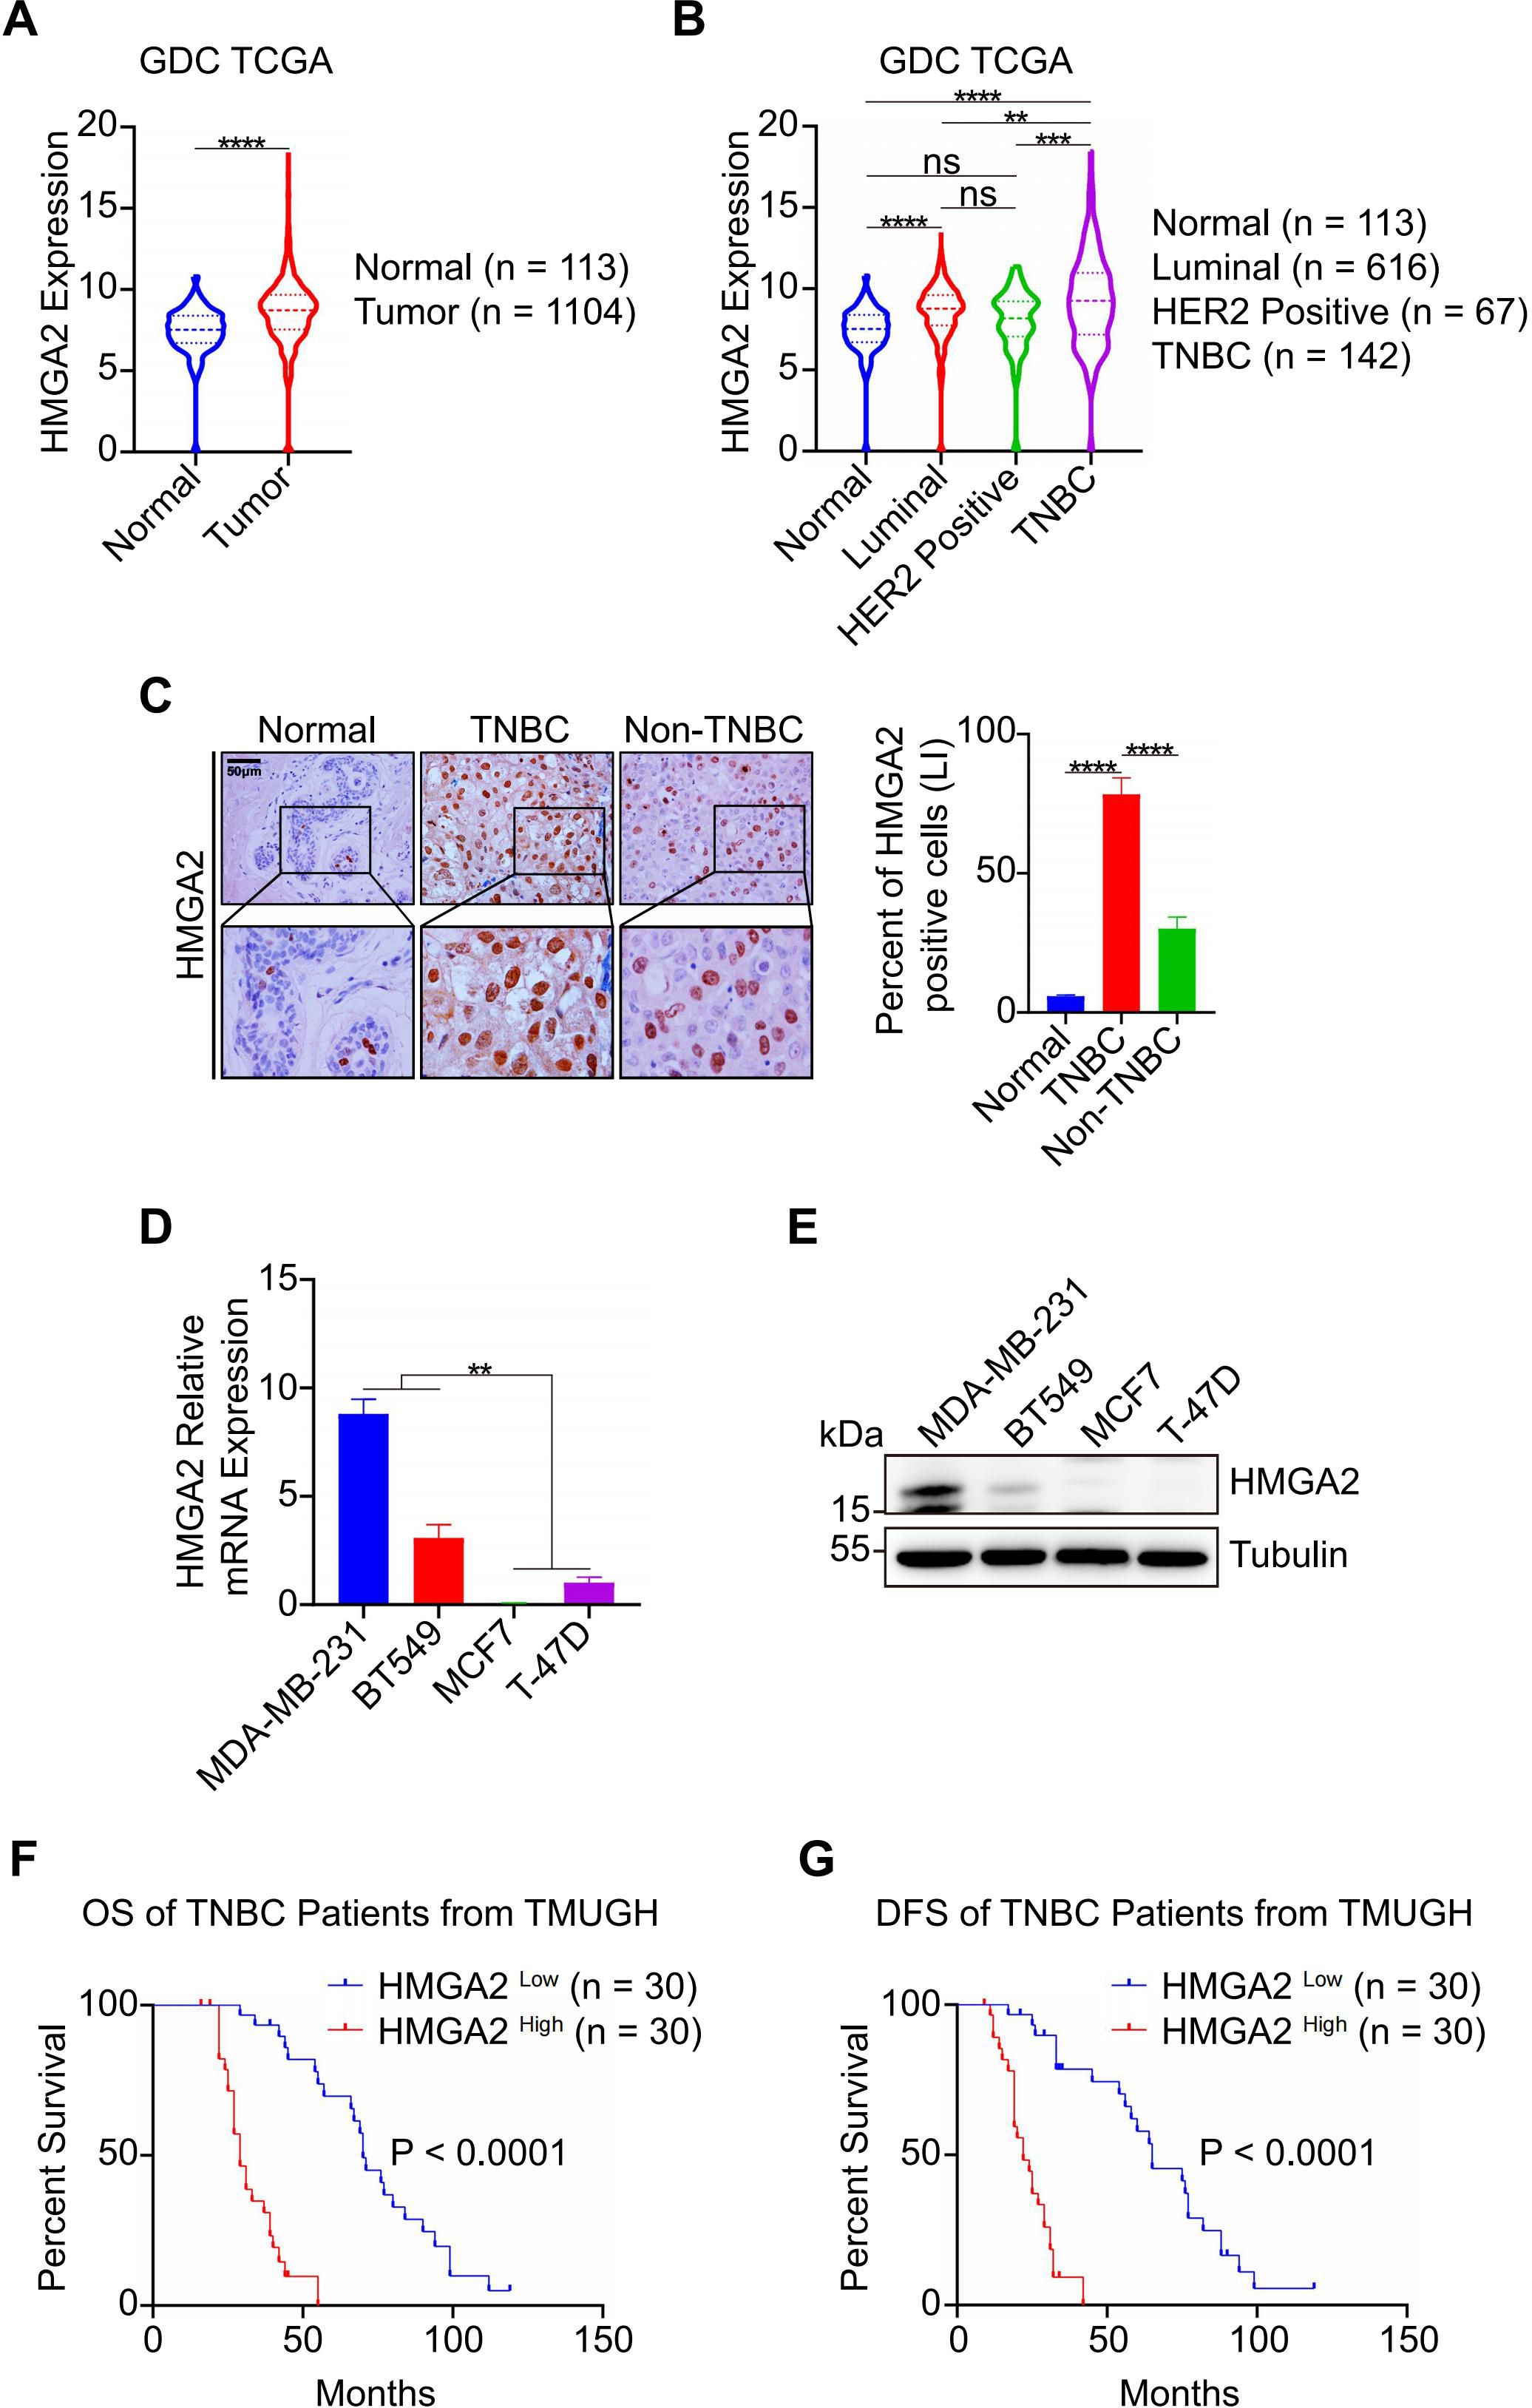
Figure 1. HMGA2 is highly expressed in TNBC and associates with patients’ poor prognosis. (A) HMGA2 mRNA expression levels in normal and tumor tissues. Data were obtained from GDC TCGA. (B) HMGA2 mRNA expression levels in TNBC and non-TNBC tissues. Data were obtained from GDC TCGA. Breast cancer can be classified according to their expression of estrogen receptor (ER), progesterone receptor (PR), HER2 and Ki67. (C) The representative HMGA2 IHC images of the FFPE samples, 6 cases of normal tissues, 60 cases of TNBC tissues and 20 cases of non-TNBC tissues. Scale bar: 50 μm. Magnification: 400 ×. (D, E) mRNA (D) and protein (E) of HMGA2 expression in TNBC cells (MDA-MB-231 and BT549) were higher than those of MCF7 and T-47D cell lines. (F, G) TNBC patients with high HMGA2 expression exhibited poor prognosis. TNBC patients from TMUGH. ns, no significance; **p<0.01, ***p<0.001, ****p<0.0001.
To assess HMGA2’s prognostic value, we performed Cox proportional hazard modeling in patients with TNBC. Both univariate and multivariate analyses identified TNM stage, MKI67 expression, and HMGA2 levels as prognostic factors for overall survival (OS) and disease-free survival (DFS) in the TMUGH cohort (Tables 1, 2). Survival analysis of patients with TNBC from TMUGH cohort (Figures 1F, G) showed that elevated HMGA2 expression correlated with significantly shorter OS and DFS. Collectively, these findings establish high HMGA2 expression as a potential indicator of poor prognosis in patients with TNBC.
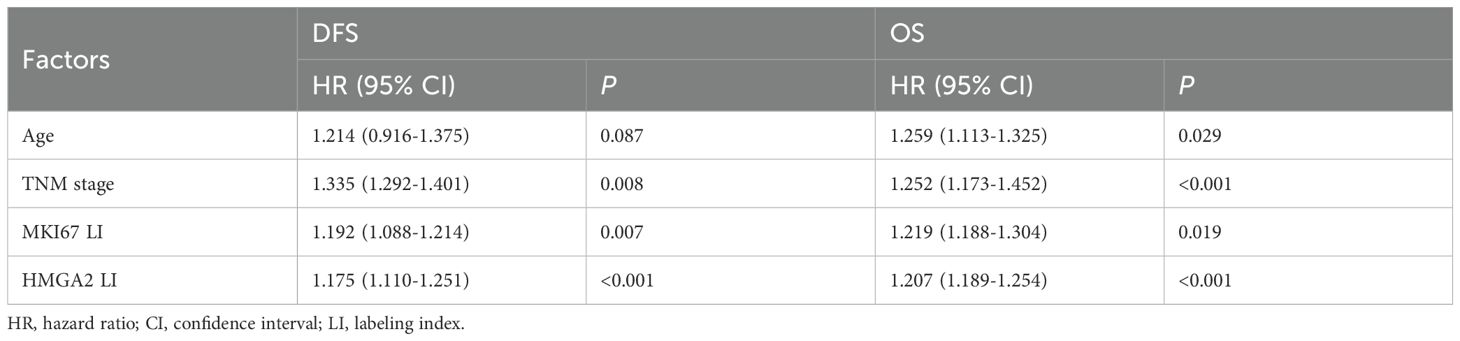
Table 1. Univariate analysis for DFS and OS in our TNBC samples.

Table 2. Multivariate analysis for DFS and OS in our TNBC samples.
3.2 HMGA2 promotes the metastasis of TNBC
To further investigate the functional role of HMGA2 in TNBC metastasis, we established HMGA2 stable knockdown models using shRNA that specifically targeted HMGA2 (shHMGA2–1 and shHMGA2-2). Knockdown efficiency was confirmed by RT-qPCR and WB analysis (Figures 2A, B). Functional assays demonstrated that HMGA2 knockdown significantly inhibited the migratory and invasive capabilities of TNBC cells (Figures 2C, D). To evaluate in vivo metastatic potential, we established a lung metastatic model. Comparative analysis revealed that the shHMGA2 groups exhibited significantly reduced metastatic capacity and prolonged survival time compared to the shNC group (Figures 2E, F). Collectively, these findings strongly suggest that HMGA2 is essential for promoting TNBC metastasis.
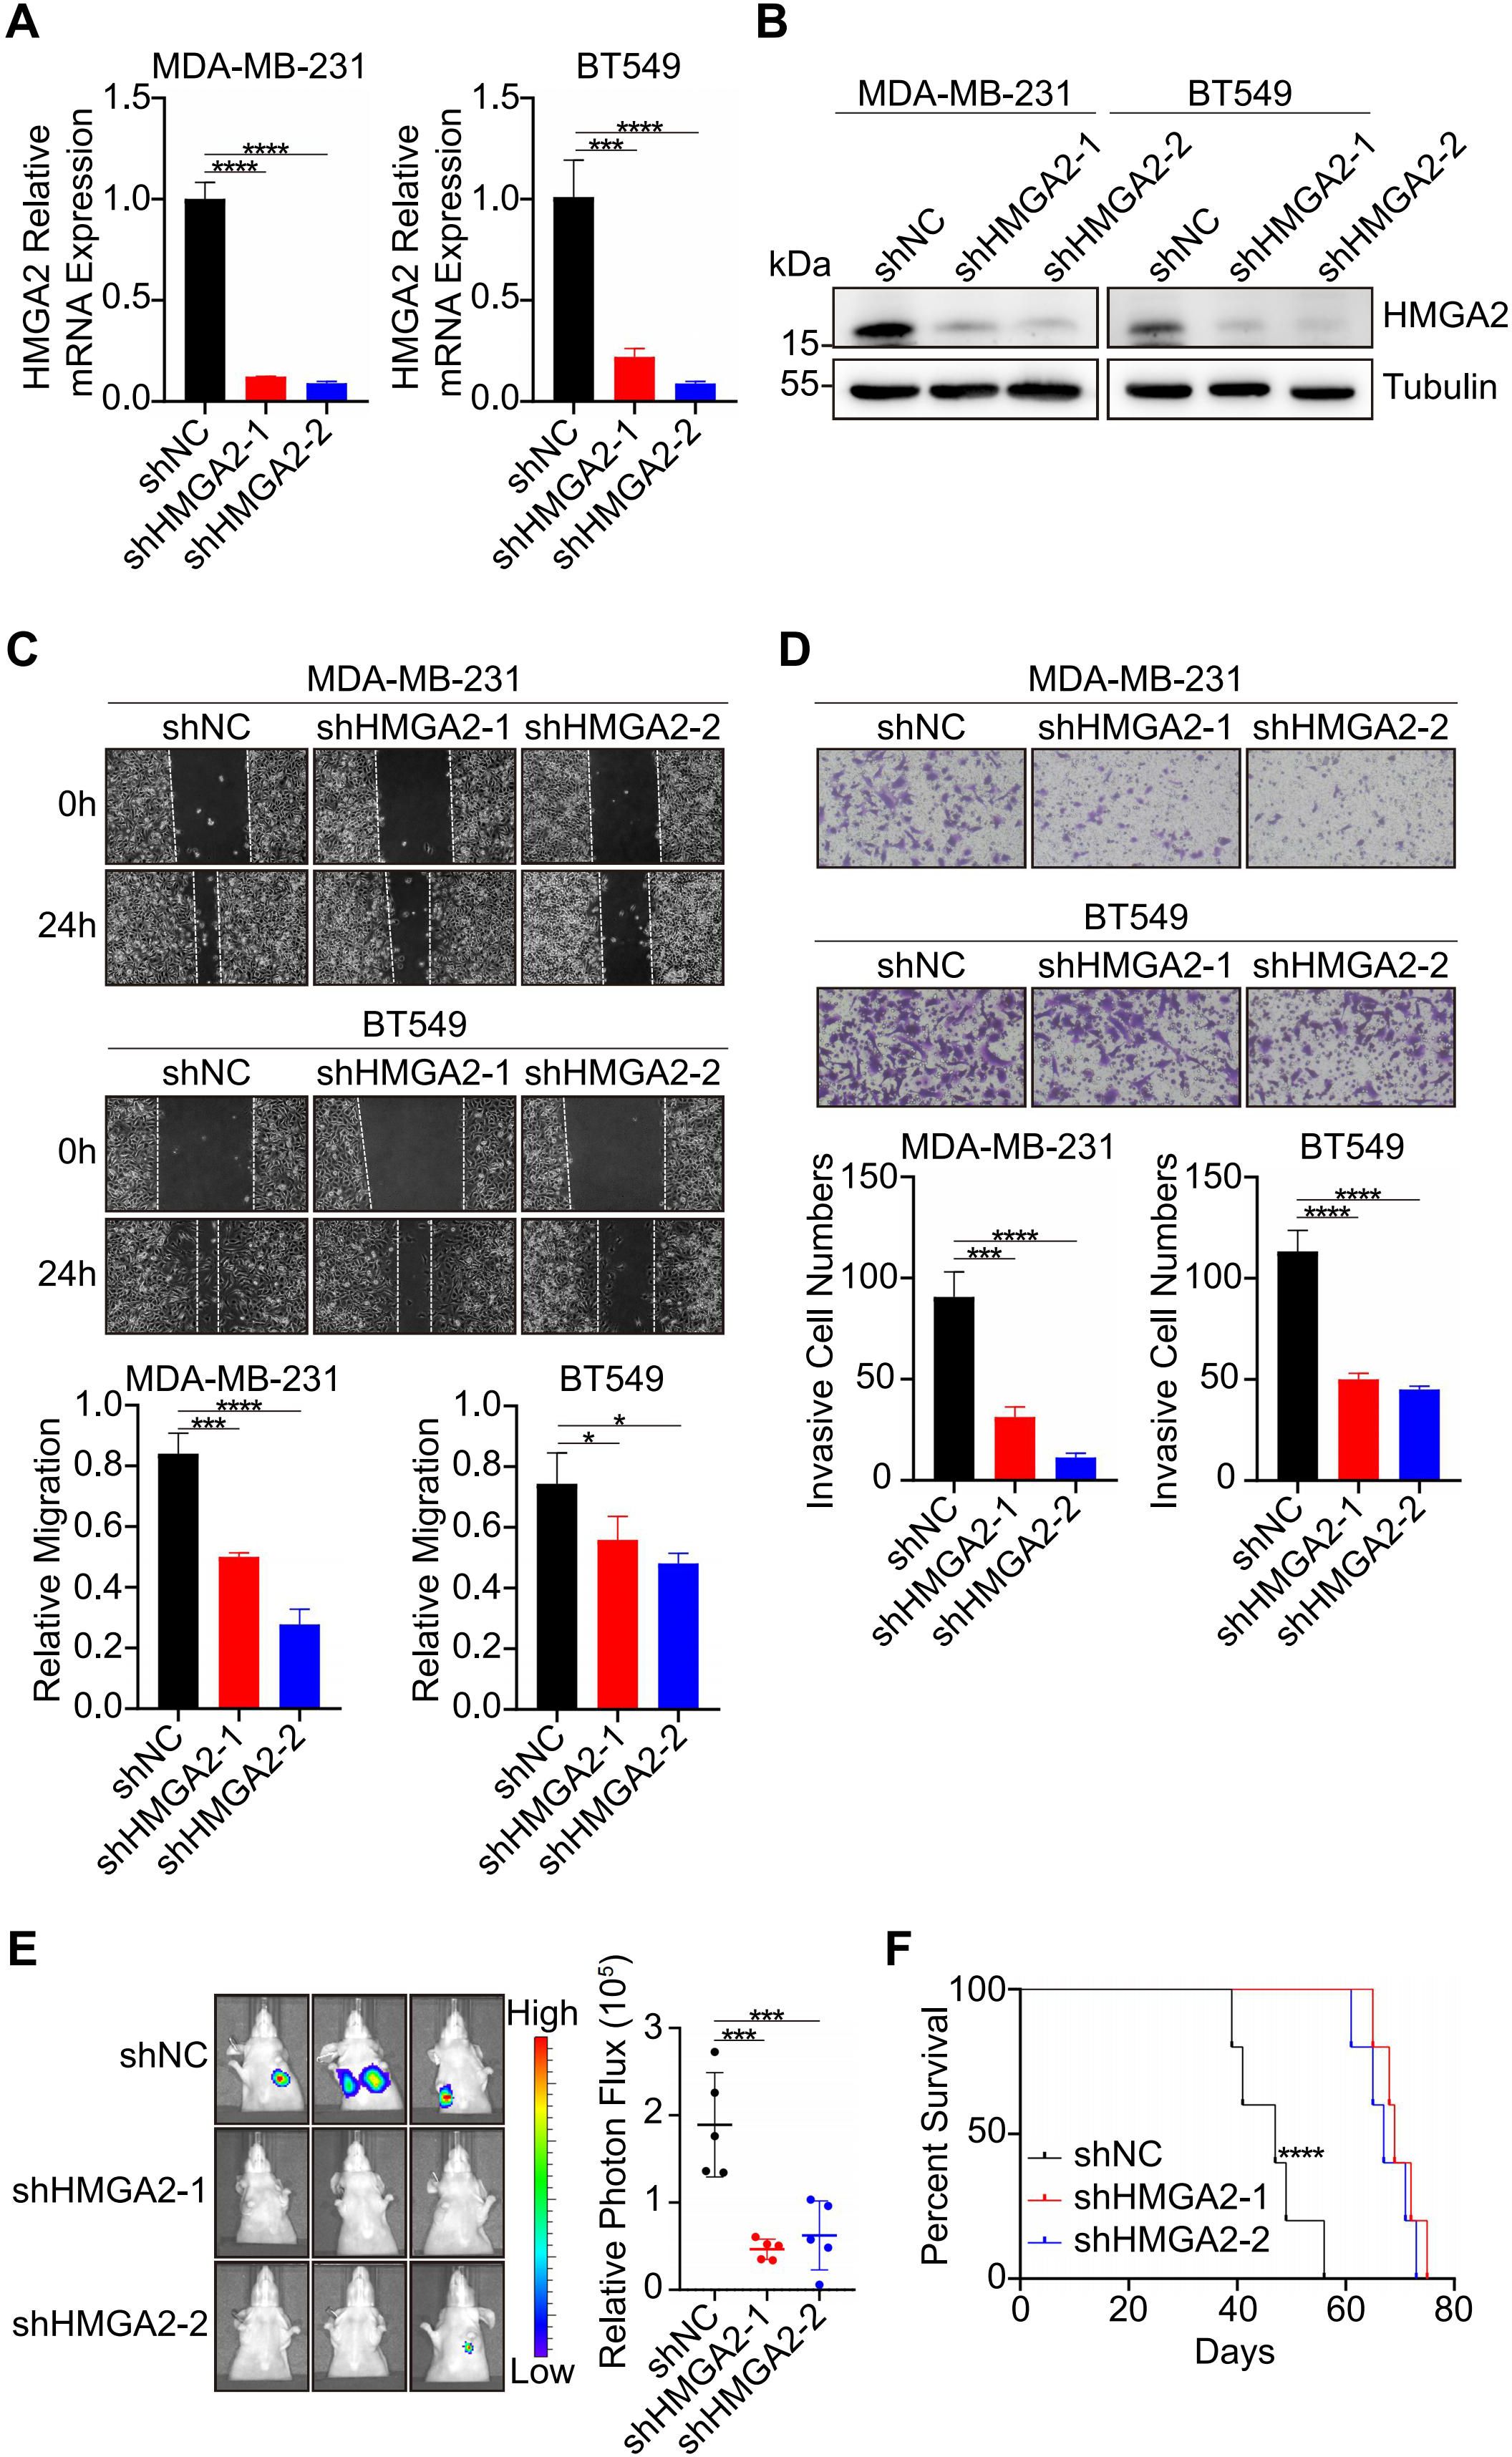
Figure 2. HMGA2 promotes the metastasis of TNBC. (A, B) RT-qPCR (A) and WB (B) were performed to assess the knockdown efficiency of HMGA2. (C) Wound healing assays demonstrated HMGA2 knockdown inhibited the migration in TNBC cells. (D) Transwell assays demonstrated HMGA2 knockdown inhibited the invasion in TNBC cells. (E) Representative images of lung metastasis in mice injected with shNC and shHMGA2 cells (n = 5). (F) Survival time of mice of lung metastasis with shNC and shHMGA2 cells (n = 5). *p<0.05, ***p<0.001, ****p<0.0001.
3.3 HMGA2 regulates the expression of genes associated with TNBC metastasis
Building on our findings regarding HMGA2’s role in TNBC metastasis, we sought to elucidate the underlying molecular mechanisms. We initially performed RNA sequencing of MDA-MB-231 cells transfected with either shNC or shHMGA2 to identify DEGs. The results were screened according to the difference significance criteria, DEGs change ≥ 2-fold and false discovery rate (FDR) below 0.05. Hierarchical clustering analysis revealed 322 down regulated genes and 353 up regulated genes in shHMGA2 cells compared to shNC cells (Figure 3A). Subsequent Gene Ontology (GO) enrichment analysis and Kyoto Encyclopedia of Genes and Genomes (KEGG) pathway analysis of DEGs indicated that HMGA2 primarily regulates “extracellular matrix”, “extracellular matrix organization” and “pathways in cancer”, suggesting its crucial involvement in TNBC metastasis (Figures 3B, C).
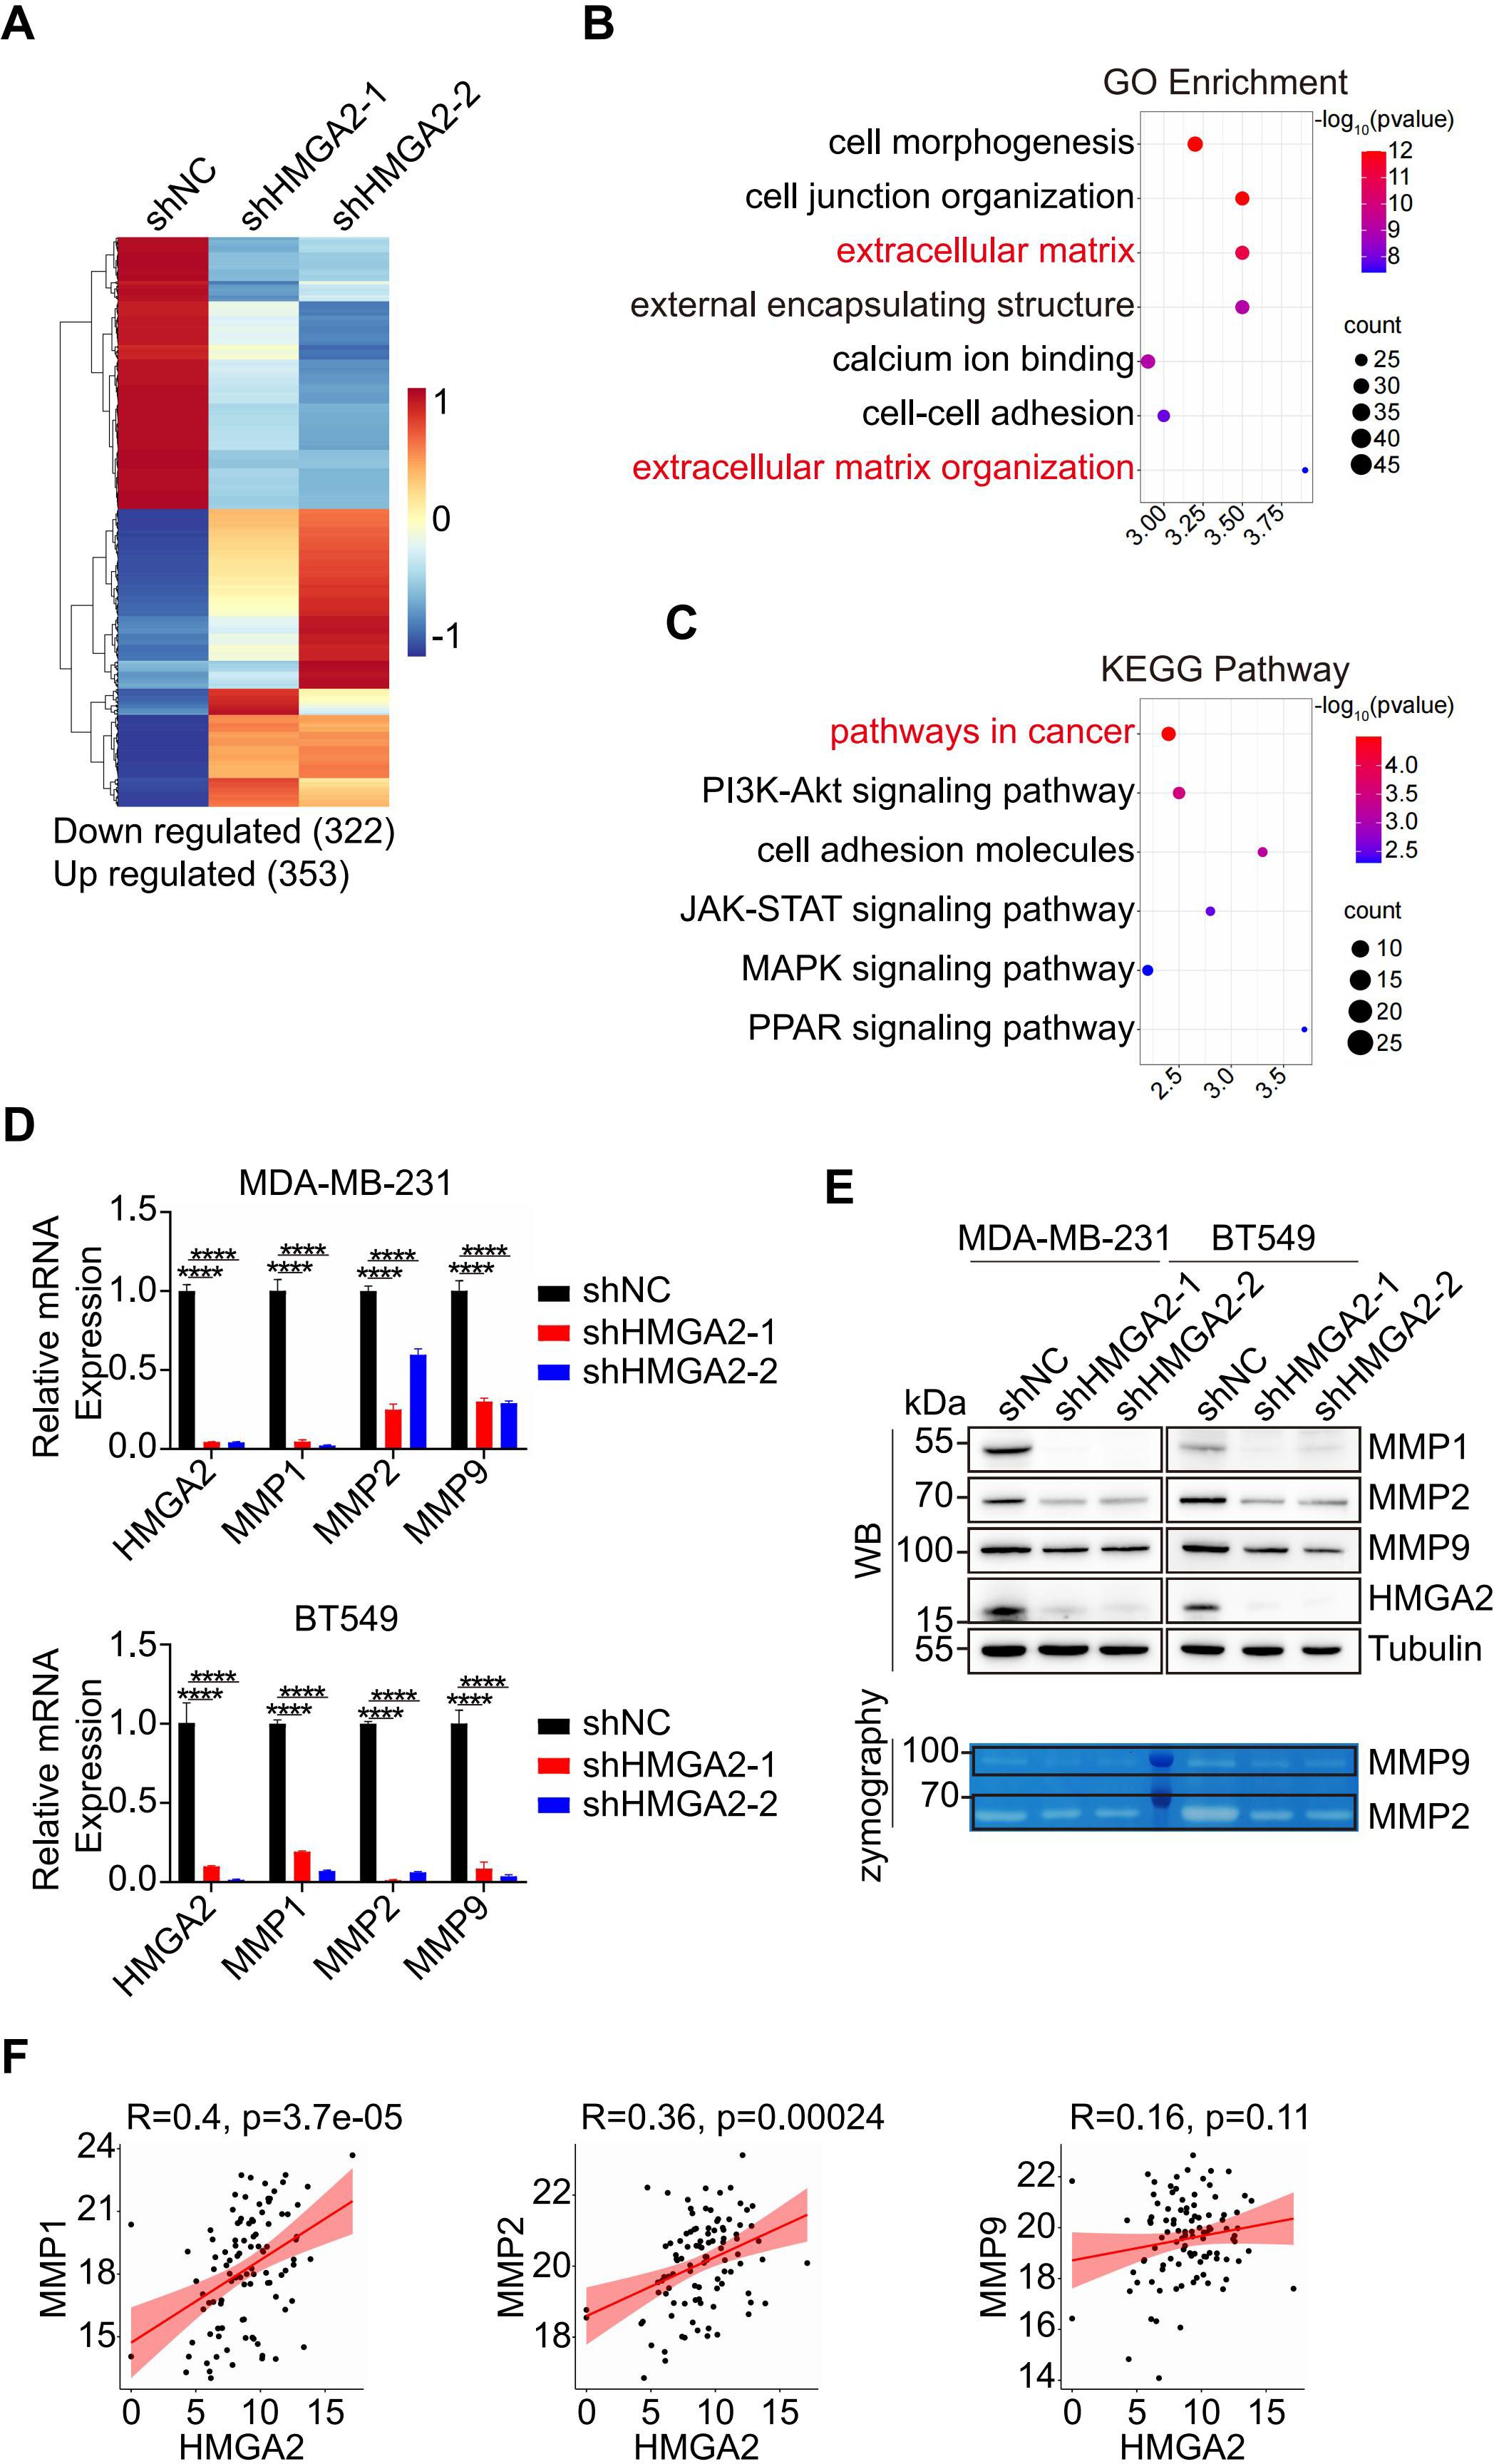
Figure 3. HMGA2 regulates the expression of MMPs. (A) Heatmap from the RNA-sequencing data showed the DEGs in HMGA2 knowdown or control cells. (B, C) Representative GO (B) and KEGG (C) term analysis of DEGs. (D, E) After HMGA2 knowdown in TNBC cells, MMPs expression levels were detected by RT-qPCR (D) and WB (E, upper part). MMP2 and MMP9 enzymatic activities were decreased following HMGA2 knockdown (E, lower part). (F) Correlation between HMGA2 and MMPs expression. Data were obtained from GDC TCGA. ****p<0.0001.
MMPs are the key enzymes for degrading extracellular matrix, to further validate the MMPs expression patterns, we performed RT-qPCR and WB analyses. Transcriptional analysis revealed a significant downregulation of MMP1, MMP2, and MMP9 in shHMGA2 groups (Figure 3D). WB analysis confirmed a corresponding reduction in protein expression levels (Figure 3E, upper panel). Gelatin zymography assays demonstrated markedly decreased enzymatic activity of both MMP2 and MMP9 following HMGA2 knockdown (Figure 3E, lower panel; Supplementary Figure 2A). Analysis of GDC TCGA revealed positive correlations between HMGA2 and MMP1/MMP2 mRNA expression levels, with a moderate correlation observed for MMP9 (Figure 3F). These comprehensive findings support our hypothesis that HMGA2 promotes TNBC metastasis through functional activation of MMPs.
3.4 HMGA2 regulates transcription of MMPs
To identify the specific binding regions for HMGA2, we performed ChIP assays on TNBC cells. The results demonstrated HMGA2 binding at the transcription start site (TSS) and R1 (located upstream of TSS) of MMP1, as well as at the TSS, R1 and R2 (located upstream of R1) of both MMP2 or MMP9. HMGA2 knockdown significantly reduced its interaction with these conserved regions, confirming the specificity of HMGA2 recruitment to the MMPs promoters (Figures 4A–C). Structural predictions using AlphaFold 3 supported HMGA2’s ability to bind to the TSS, R1, and R2 of these target genes (Figure 4D). The EMSA results showed that HMGA2 specifically bound to labeled probes (Figures 4E, lane 2), with unlabeled probes competitively inhibiting complex formation in a dose-dependent manner (Figure 4E, Lanes 3-7). Collectively, these findings demonstrate that HMGA2 directly interacts with the conserved regions of the MMPs promoters to regulate transcriptional activity.
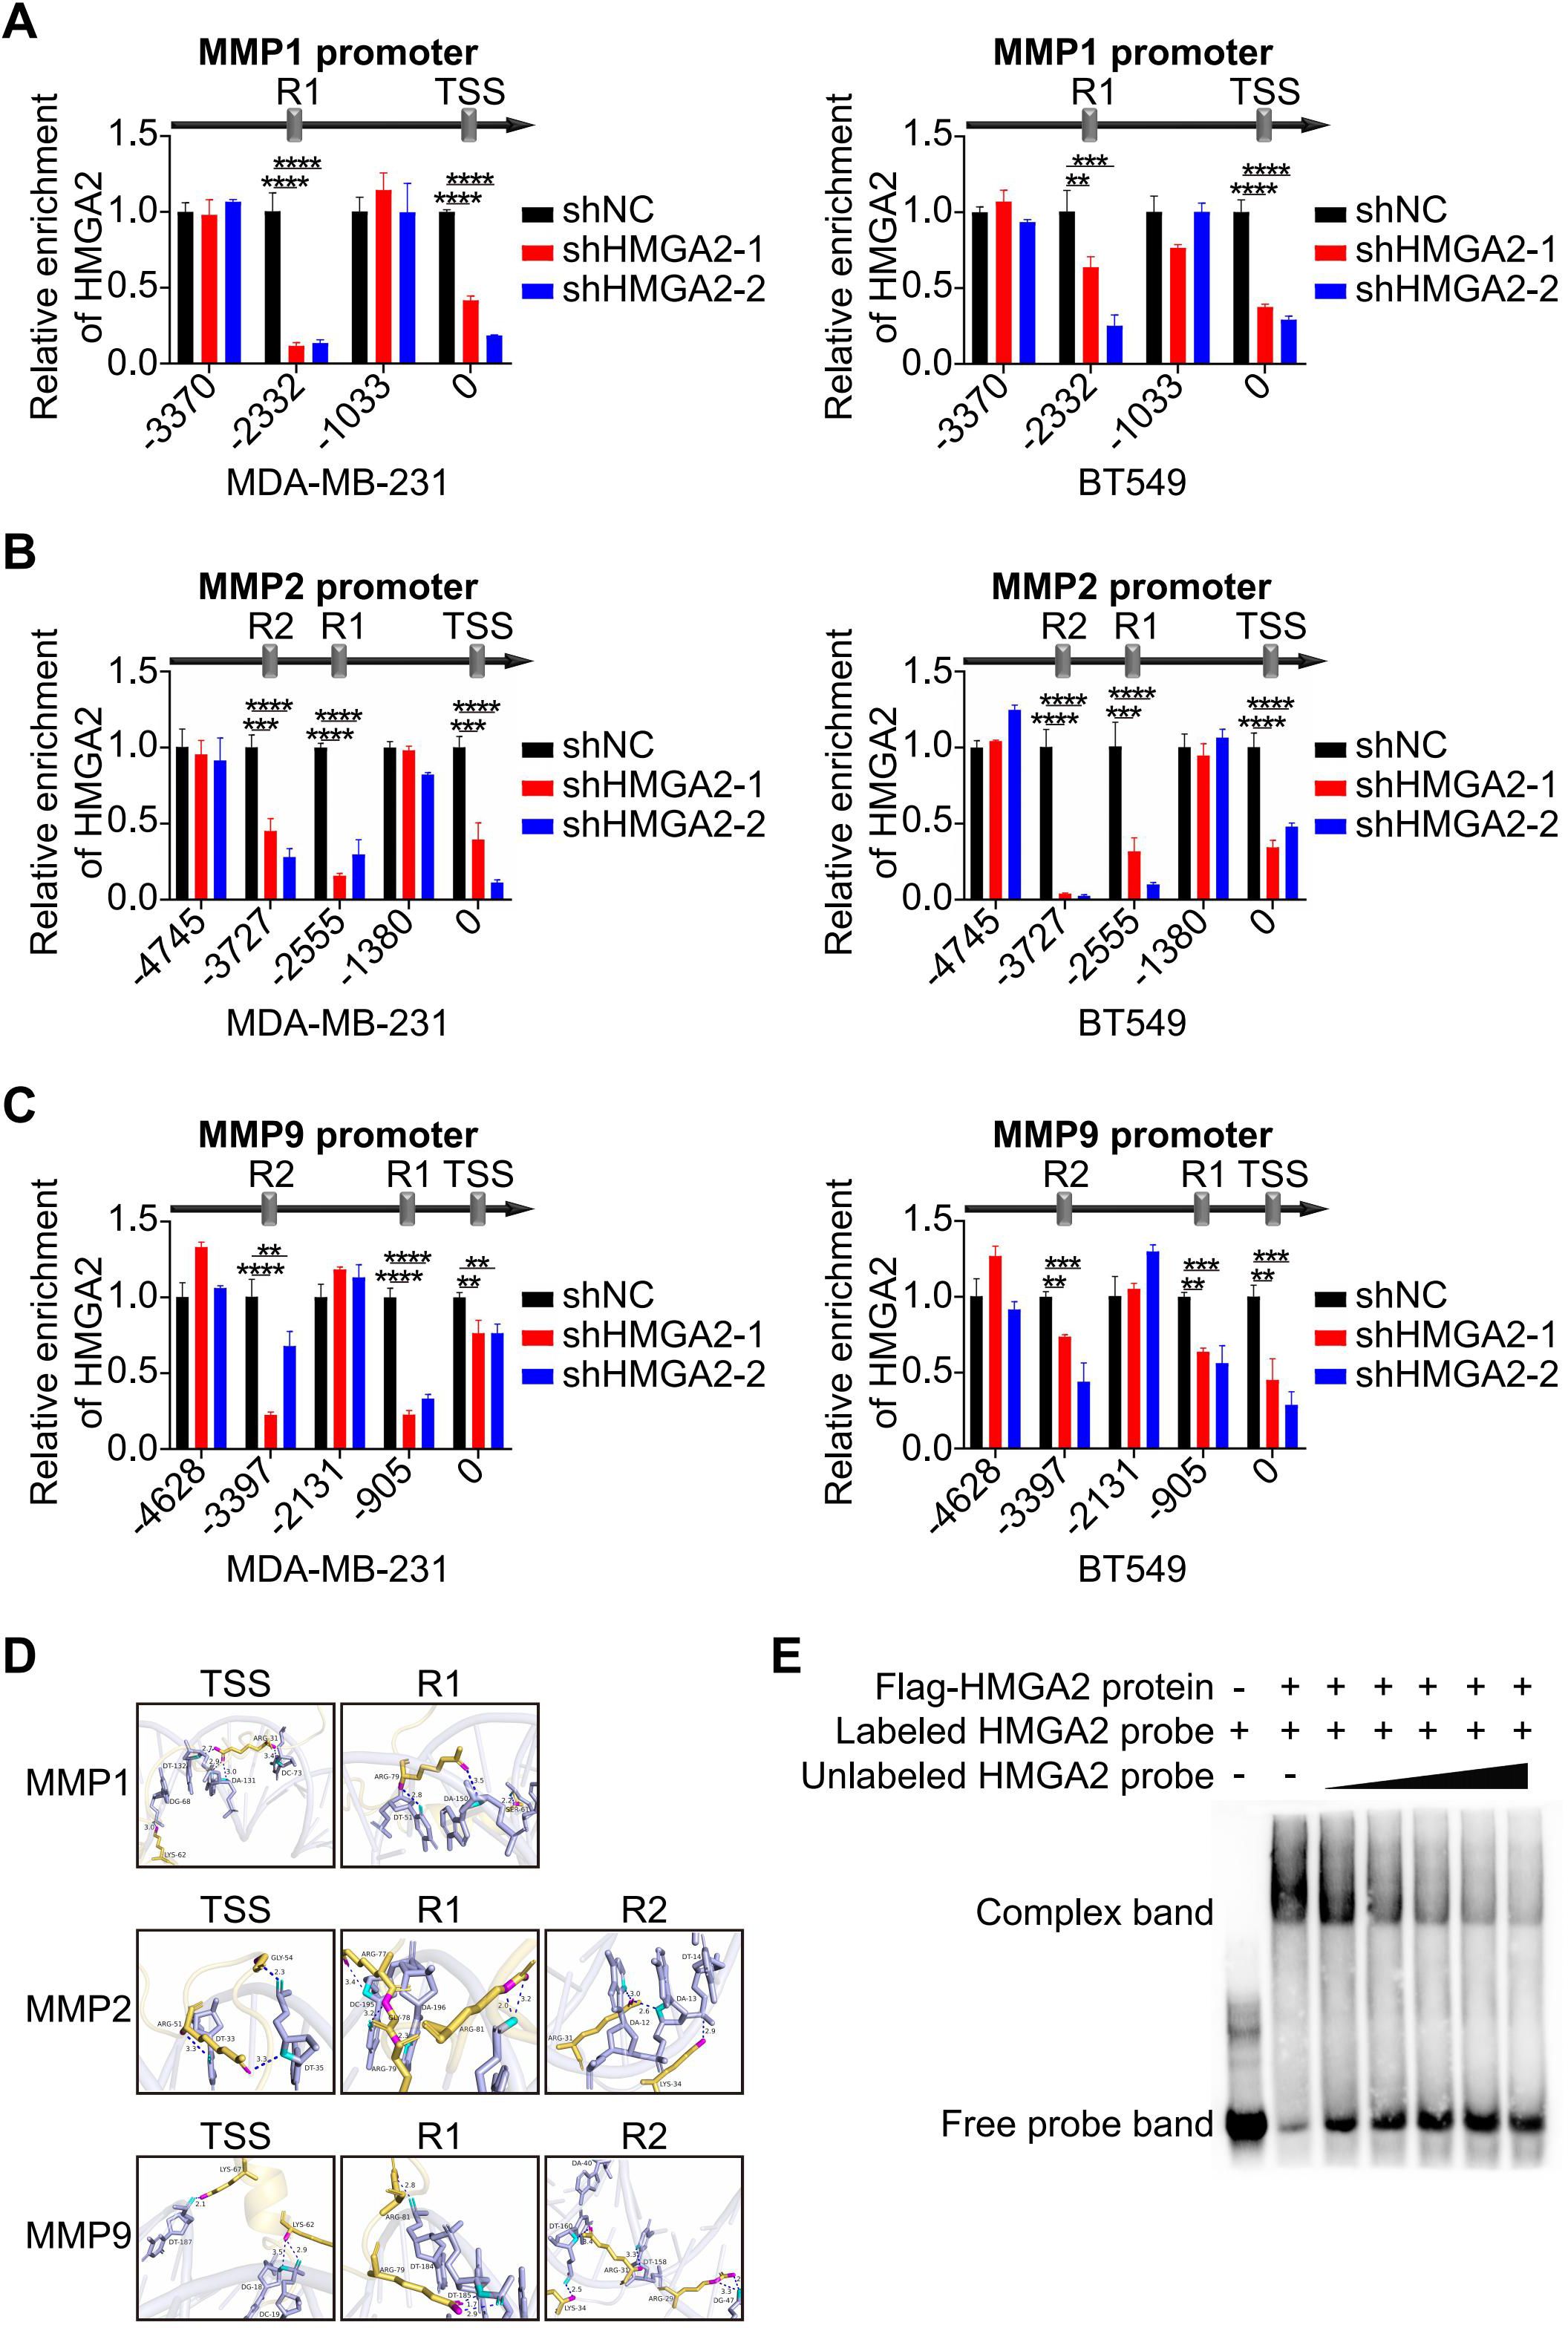
Figure 4. HMGA2 regulates transcription of MMPs. (A-C) ChIP results demonstrated the interaction of HMGA2 with promoters of MMPs in TNBC cells. (D) Schematic diagram illustrated HMGA2 binds to conserved regions at MMPs promoters. (E) Interactions between in vitro translated HMGA2 and MMPs promoters were verified by EMSA. **p<0.01, ***p<0.001, ****p<0.0001.
3.5 HMGA2 interacts with KAT6A regulating the expression of MMPs
The potential interacting proteins of HMGA2 were revealed by IP experiments. Mass spectrometry (MS) analysis of the HMGA2 interactome in vector versus HMGA2 cells identified KAT6A as a potential interacting partner in TNBC cells (Figure 5A). Co-IP experiments confirmed the physical interaction between HMGA2 and KAT6A in TNBC cells (Figures 5B, C). Through the ectopic expression of various HMGA2 truncation mutants, we observed that the D3 mutant (lacking amino acids 74-109) exhibited a significantly reduced interaction with KAT6A compared to the D1 and D2 mutants (Figures 5D, E).
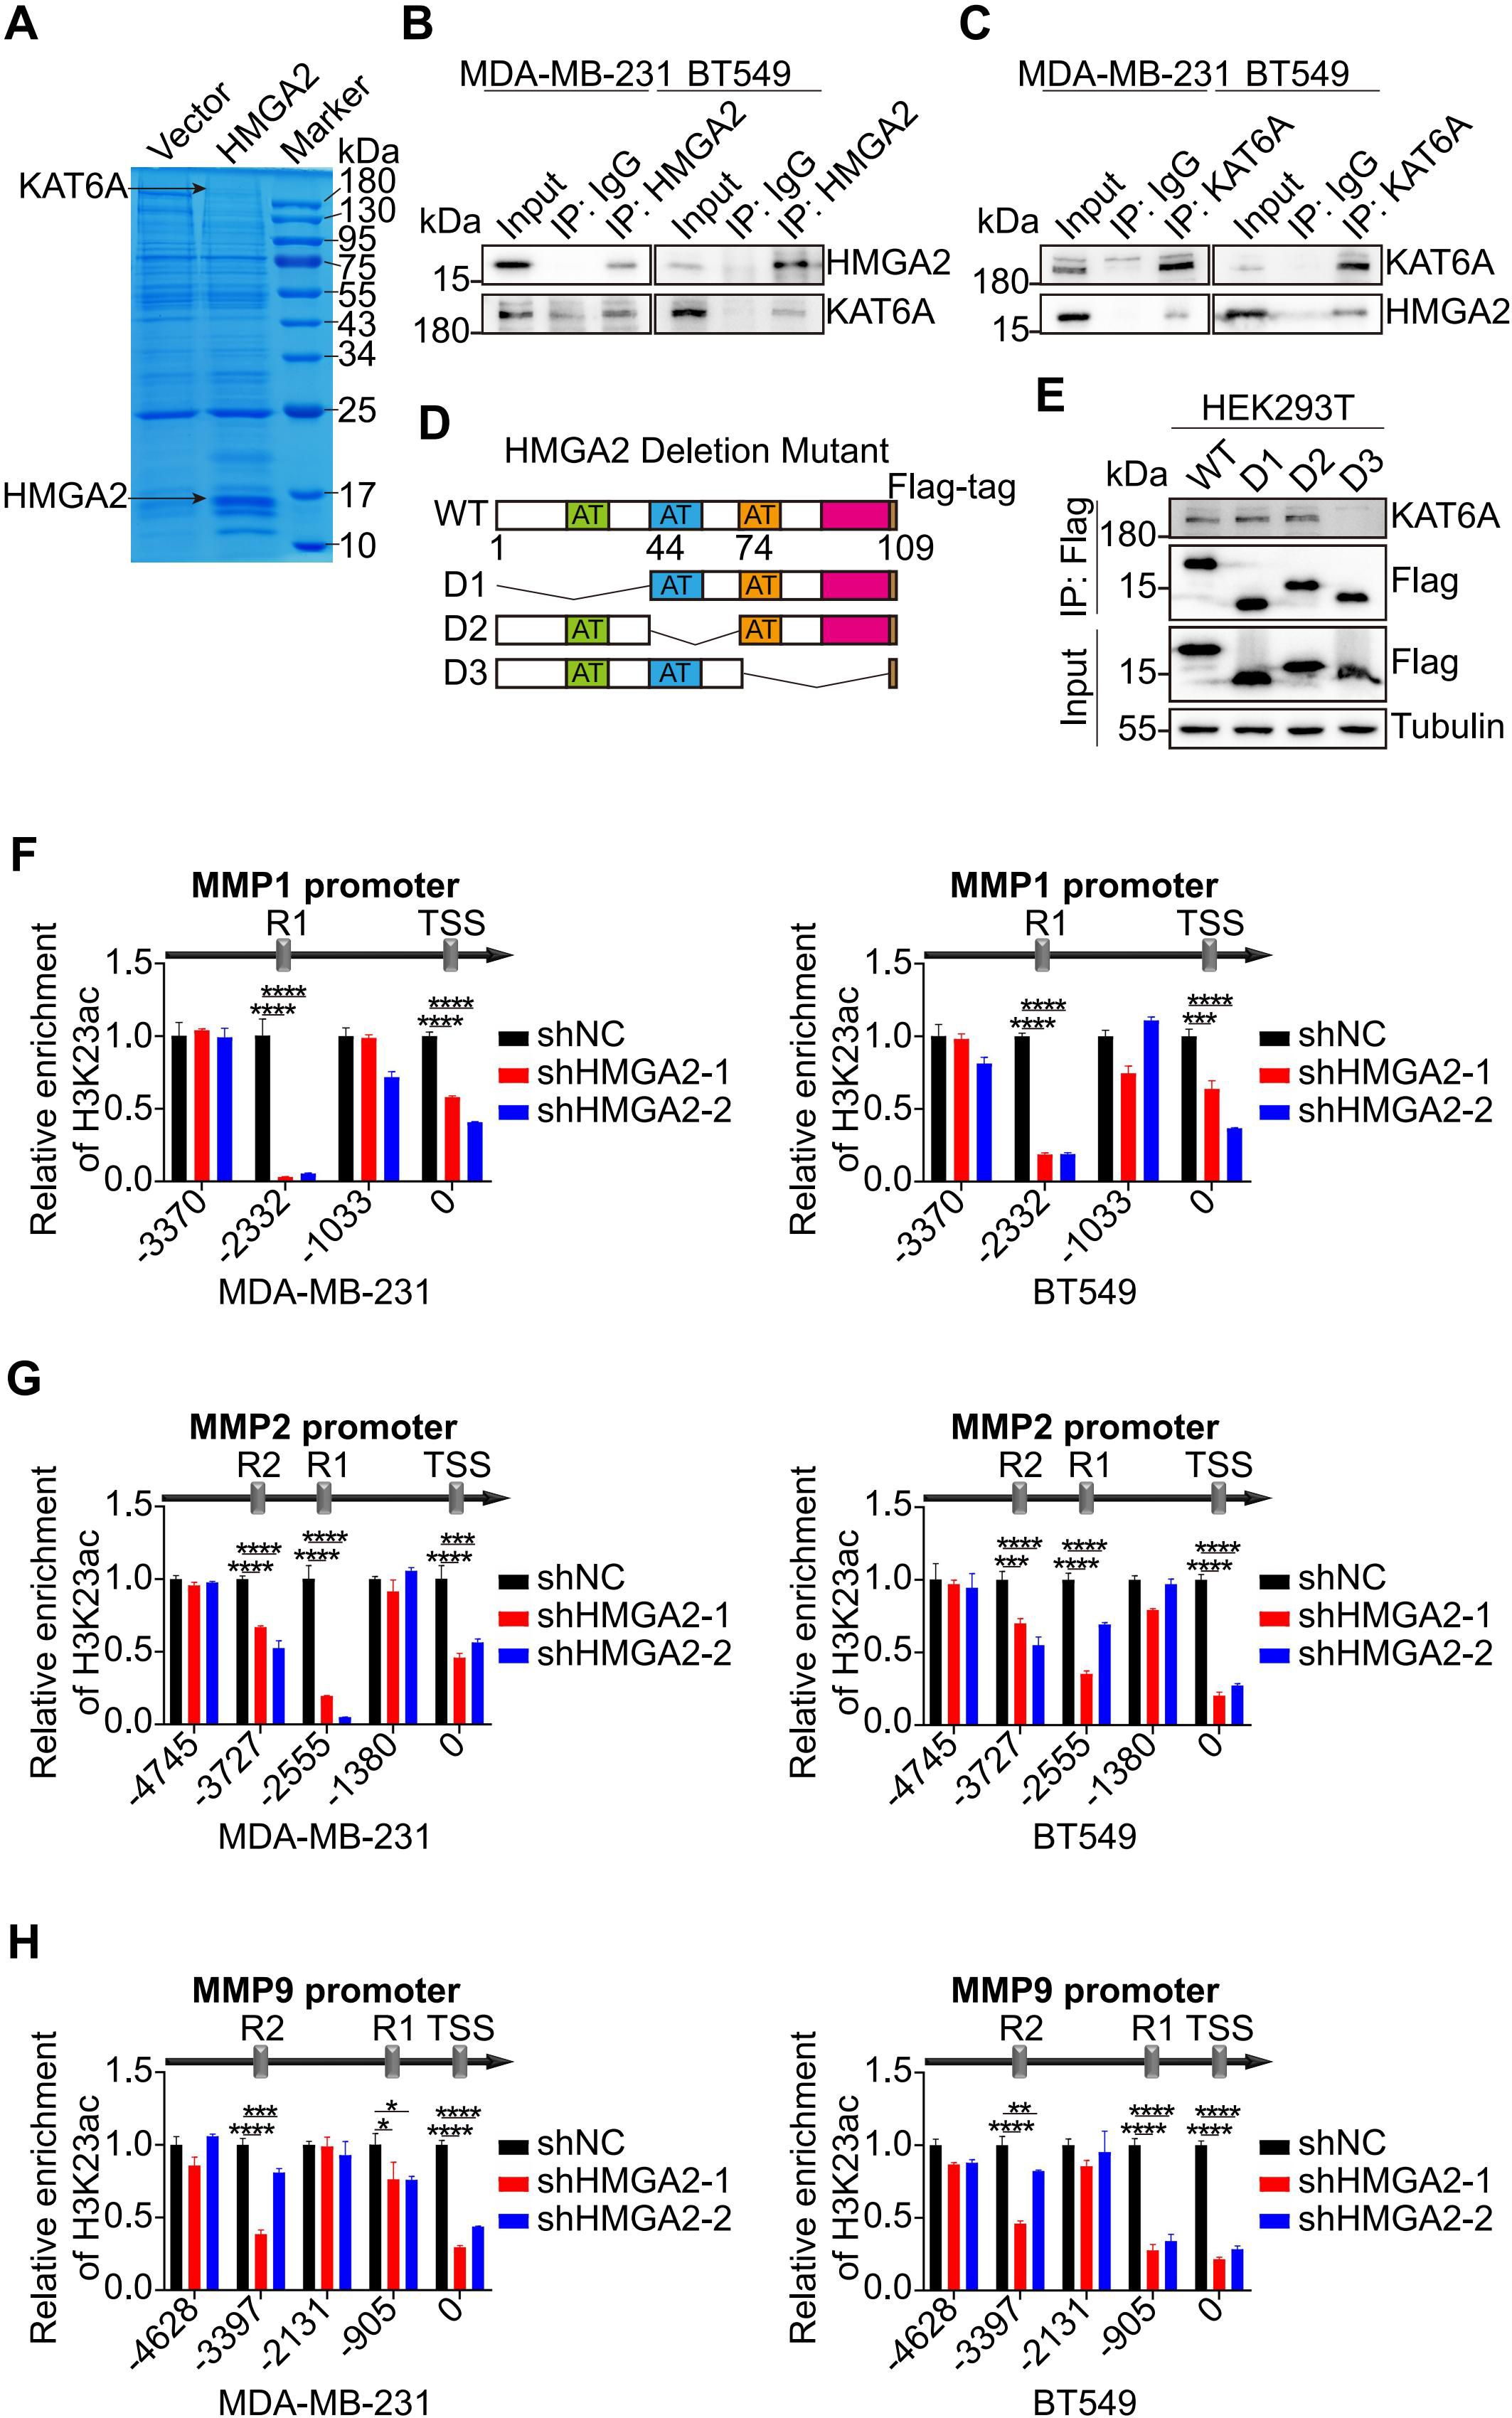
Figure 5. HMGA2 interacts with KAT6A regulating the expression of MMPs. (A) Proteins from the IP assay on MDA-MB-231 cells were separated by SDS-PAGE and detected by Coomassie brilliant blue staining. (B, C) Interaction between HMGA2 and KAT6A were verified in MDA-MB-231 (B) and BT549 (C) cells by Co-IP assay. (D) Schematic of various HMGA2 truncations. (E) Total cell lysates from HEK293T cells expressing different truncations of HMGA2 were subjected to IP with antibodies against Flag tags. (F–H) ChIP results demonstrated the interaction of H3K23ac with promoters of MMPs in TNBC cells. *p<0.05, **p<0.01, ***p<0.001, ****p<0.0001.
Given KAT6A’s established role in mediating H3K23ac, we performed additional ChIP assays to target this histone modification. The analysis revealed that H3K23ac binding regions coincided with HMGA2 binding regions in MMPs promoters, and HMGA2 silencing markedly decreased histone modification interactions at these regions (Figures 5F-H).
3.6 HMGA2 promotes MMPs transcription via chromatin conformation changes
Based on the ChIP results, the spatial conformations of the MMPs promoter regions were inferred the Figure 6A. To investigate the role of HMGA2 as a chromatin architectural regulator, we performed 3C assays to analyze spatial interactions within the MMP1, MMP2, and MMP9 promoter regions. Using R1 of MMP1 as the PCR anchor, we detected strong chromatin conformation enrichment between R1 and TSS, which was attenuated by HMGA2 knockdown (Figure 6B, Supplementary Figure 3A). Reciprocal analysis using TSS as the anchor confirmed chromatin conformation enrichment to R1 (Figure 6C, Supplementary Figure 3B). Similar spatial organization patterns were observed for MMP2, with R2 as the anchor, revealing enrichments among R1, R2 and the TSS (Figure 6D, Supplementary Figure 3C), and R1 was the anchor that interacted with R2 and the TSS (Figure 6E, Supplementary Figure 3D) and TSS as the anchor, demonstrating enrichments with both R1 and R2 (Figure 6F, Supplementary Figure 3E). Consistent chromatin conformation enrichments patterns were also detected in the MMP9 promoter region (Figures 6G–I, Supplementary Figure 3F-H).
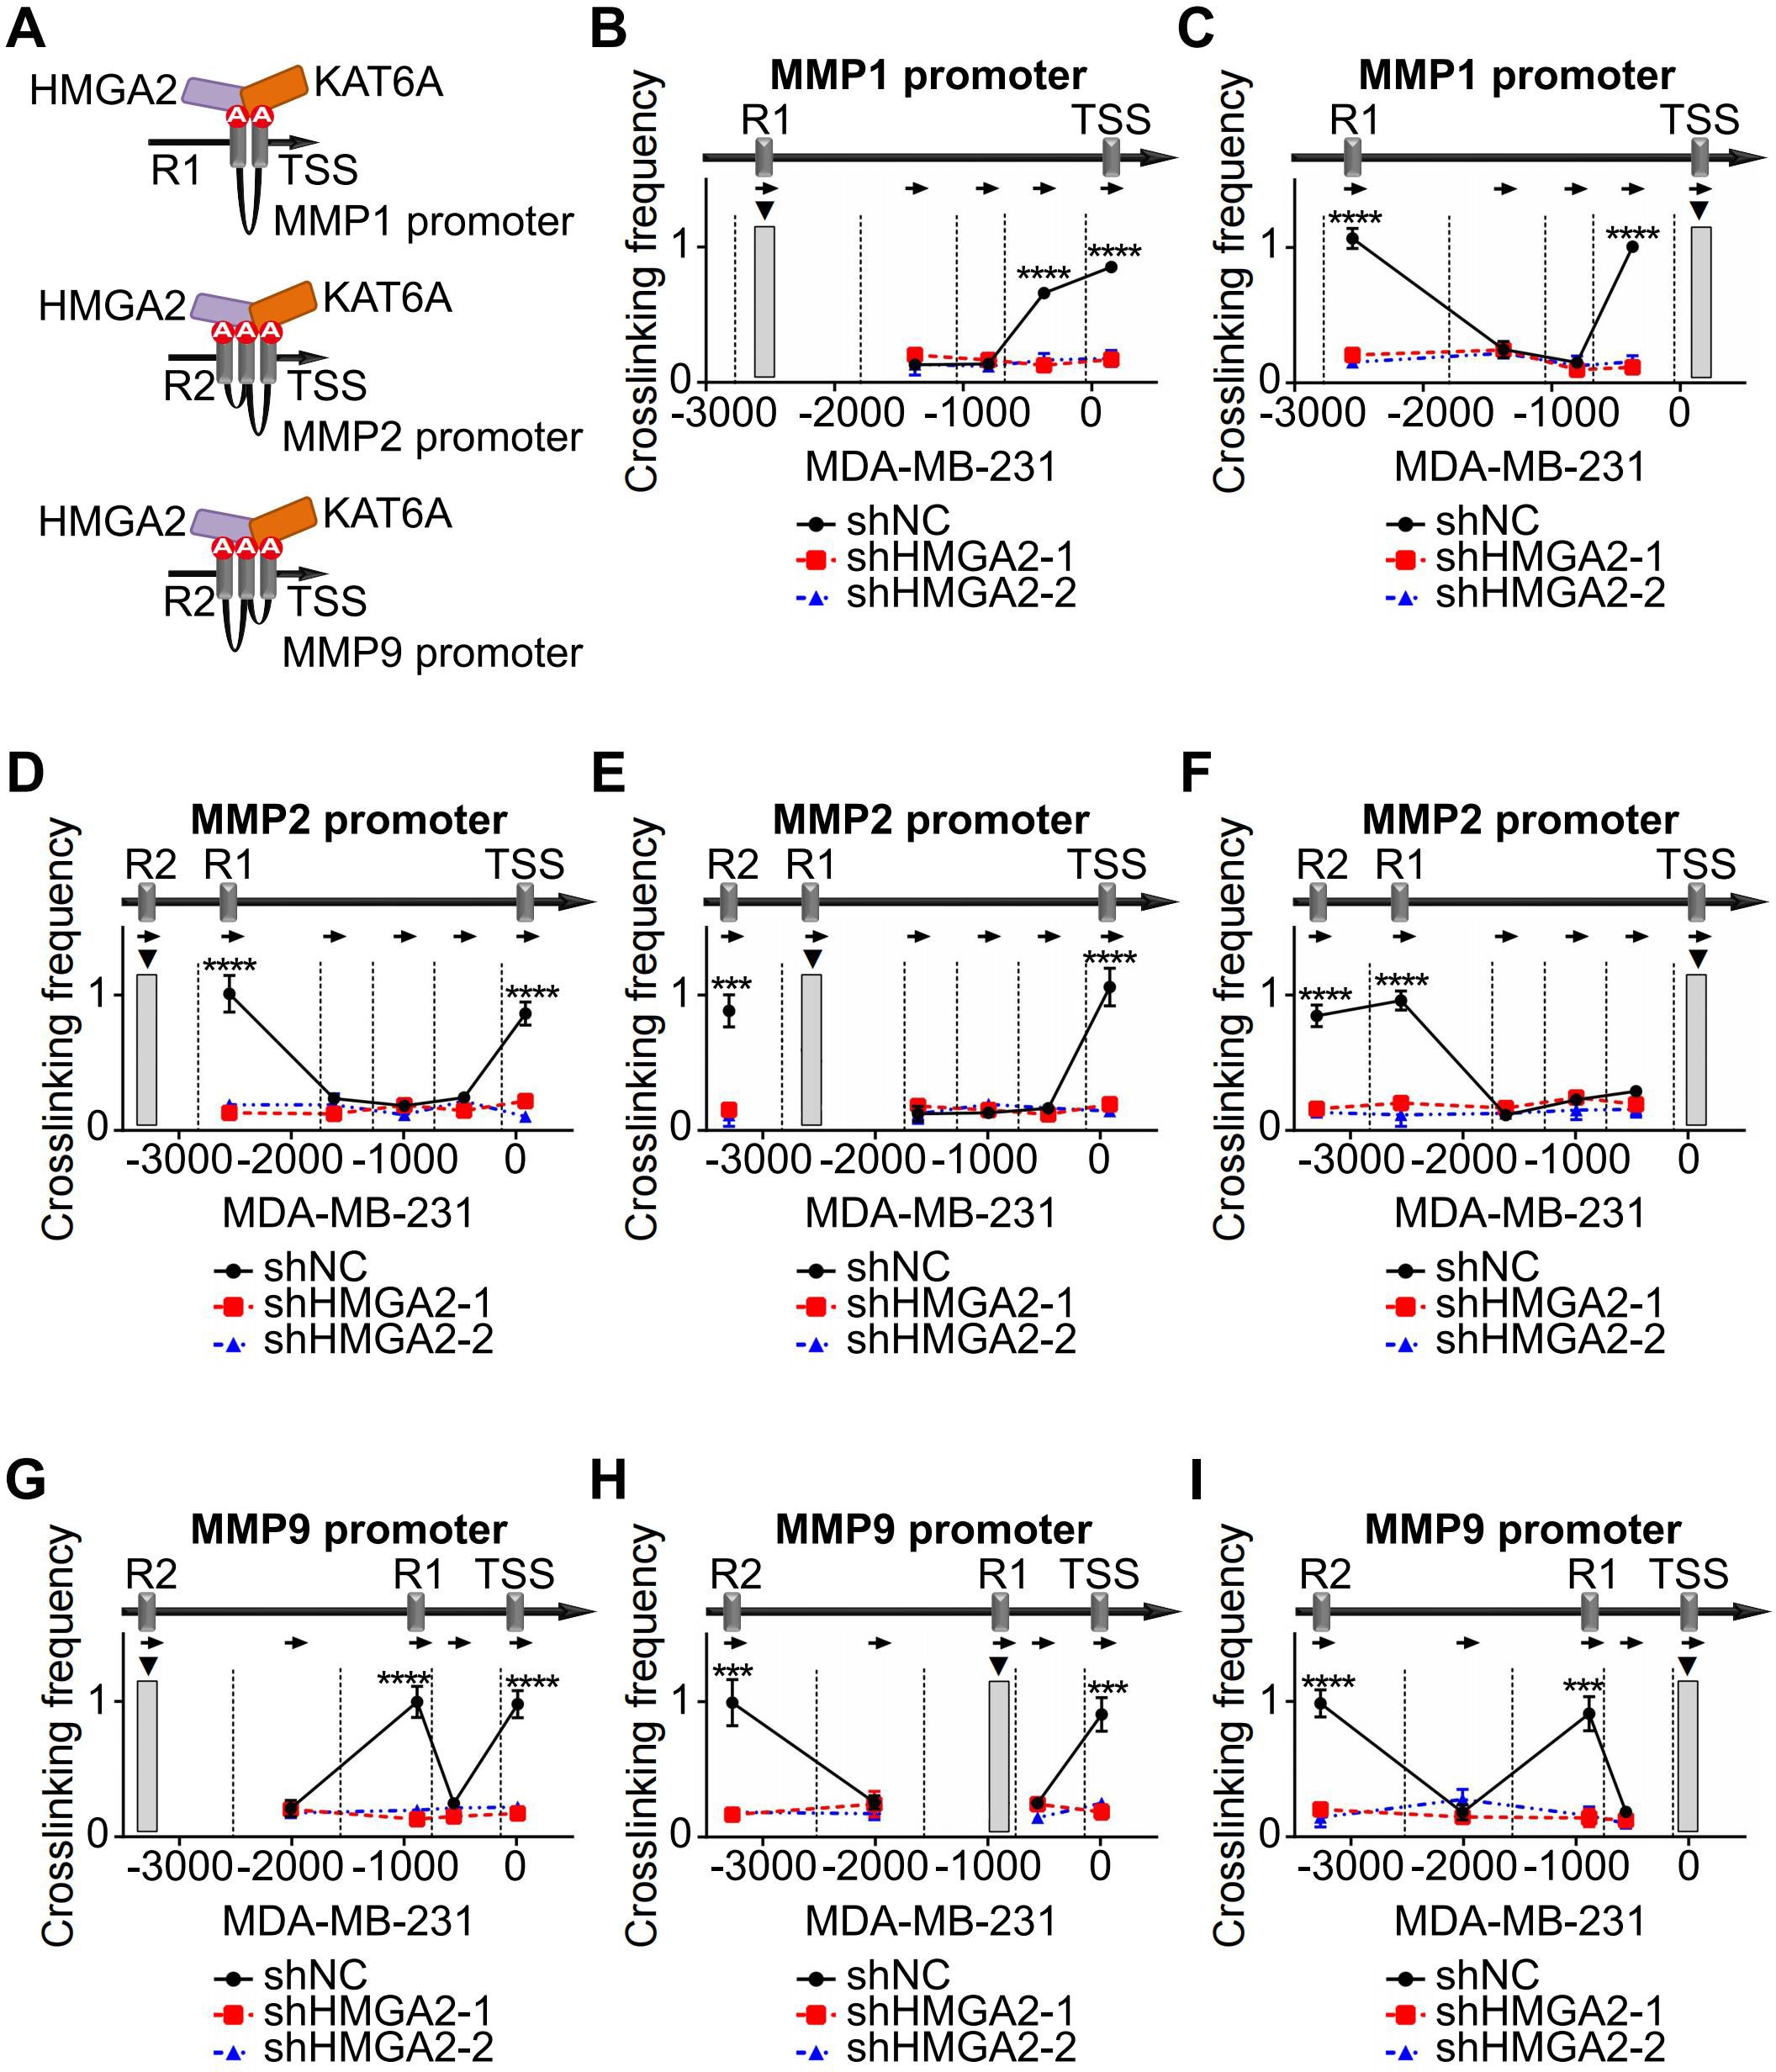
Figure 6. HMGA2 promotes MMPs transcription via chromatin conformation changes. (A) Schematic structure illustrating the mechanism of HMGA2 induced chromatin conformation changes on MMPs promoters. (B) In MDA-MB-231 cells, the anchor was R1 of MMP1, 3C data showed the DNA cross-link among R1 to TSS. HMGA2 knockdown attenuated the formation of R1/TSS cross-linking. Restriction enzyme cleavage sites were displayed by vertical lines, and direction of PCR primers were represented by arrows. (C) In MDA-MB-231 cells, the anchor was TSS of MMP1, and the cross-link among TSS to R1 were shown. (D, G) In MDA-MB-231 cells, the anchor was R2 of MMP2 or MMP9, and the cross-links among R2 to R1 and TSS were shown. (E, H) In MDA-MB-231 cells, the anchor was R1 of MMP2 or MMP9, and the cross-links among R1 to R2 and TSS were shown. (F, I) In MDA-MB-231 cells, the anchor was TSS of MMP2 or MMP9, and the cross-links among TSS to R1 and R2 were shown. ***p<0.001, ****p<0.0001.
In addition, we used KAT6A inhibitor PF-9363 in TNBC cells to block KAT6A activity and performed 3C assays to detect the chromatin conformation changes in the promoter regions of MMPs. After treatment with PF-9363, the chromatin conformation enrichments between TSS and R1 in MMP1 promoter were attenuated compared with control (Figures 7A, B, Supplementary Figures 4A, B). In MMP2 promoter, the PF-9363 treatment blocked the chromatin conformation interaction forming among TSS, R1 and R2 (Figures 7C–E, Supplementary Figures 4C–E). In MMP9 promoter, a similar effect could also be observed (Figures 7F–H, Supplementary Figures 4F–H). In PF-9363 treatment group, the chromatin conformation enrichments of different MMPs promoter regions were similar as the effects caused by HMGA2 knocking down. Collectively, these findings demonstrated that HMGA2 recruits KAT6A to MMPs promoters and induces histone acetylation and chromatin conformation changes, ultimately activating MMPs transcription.
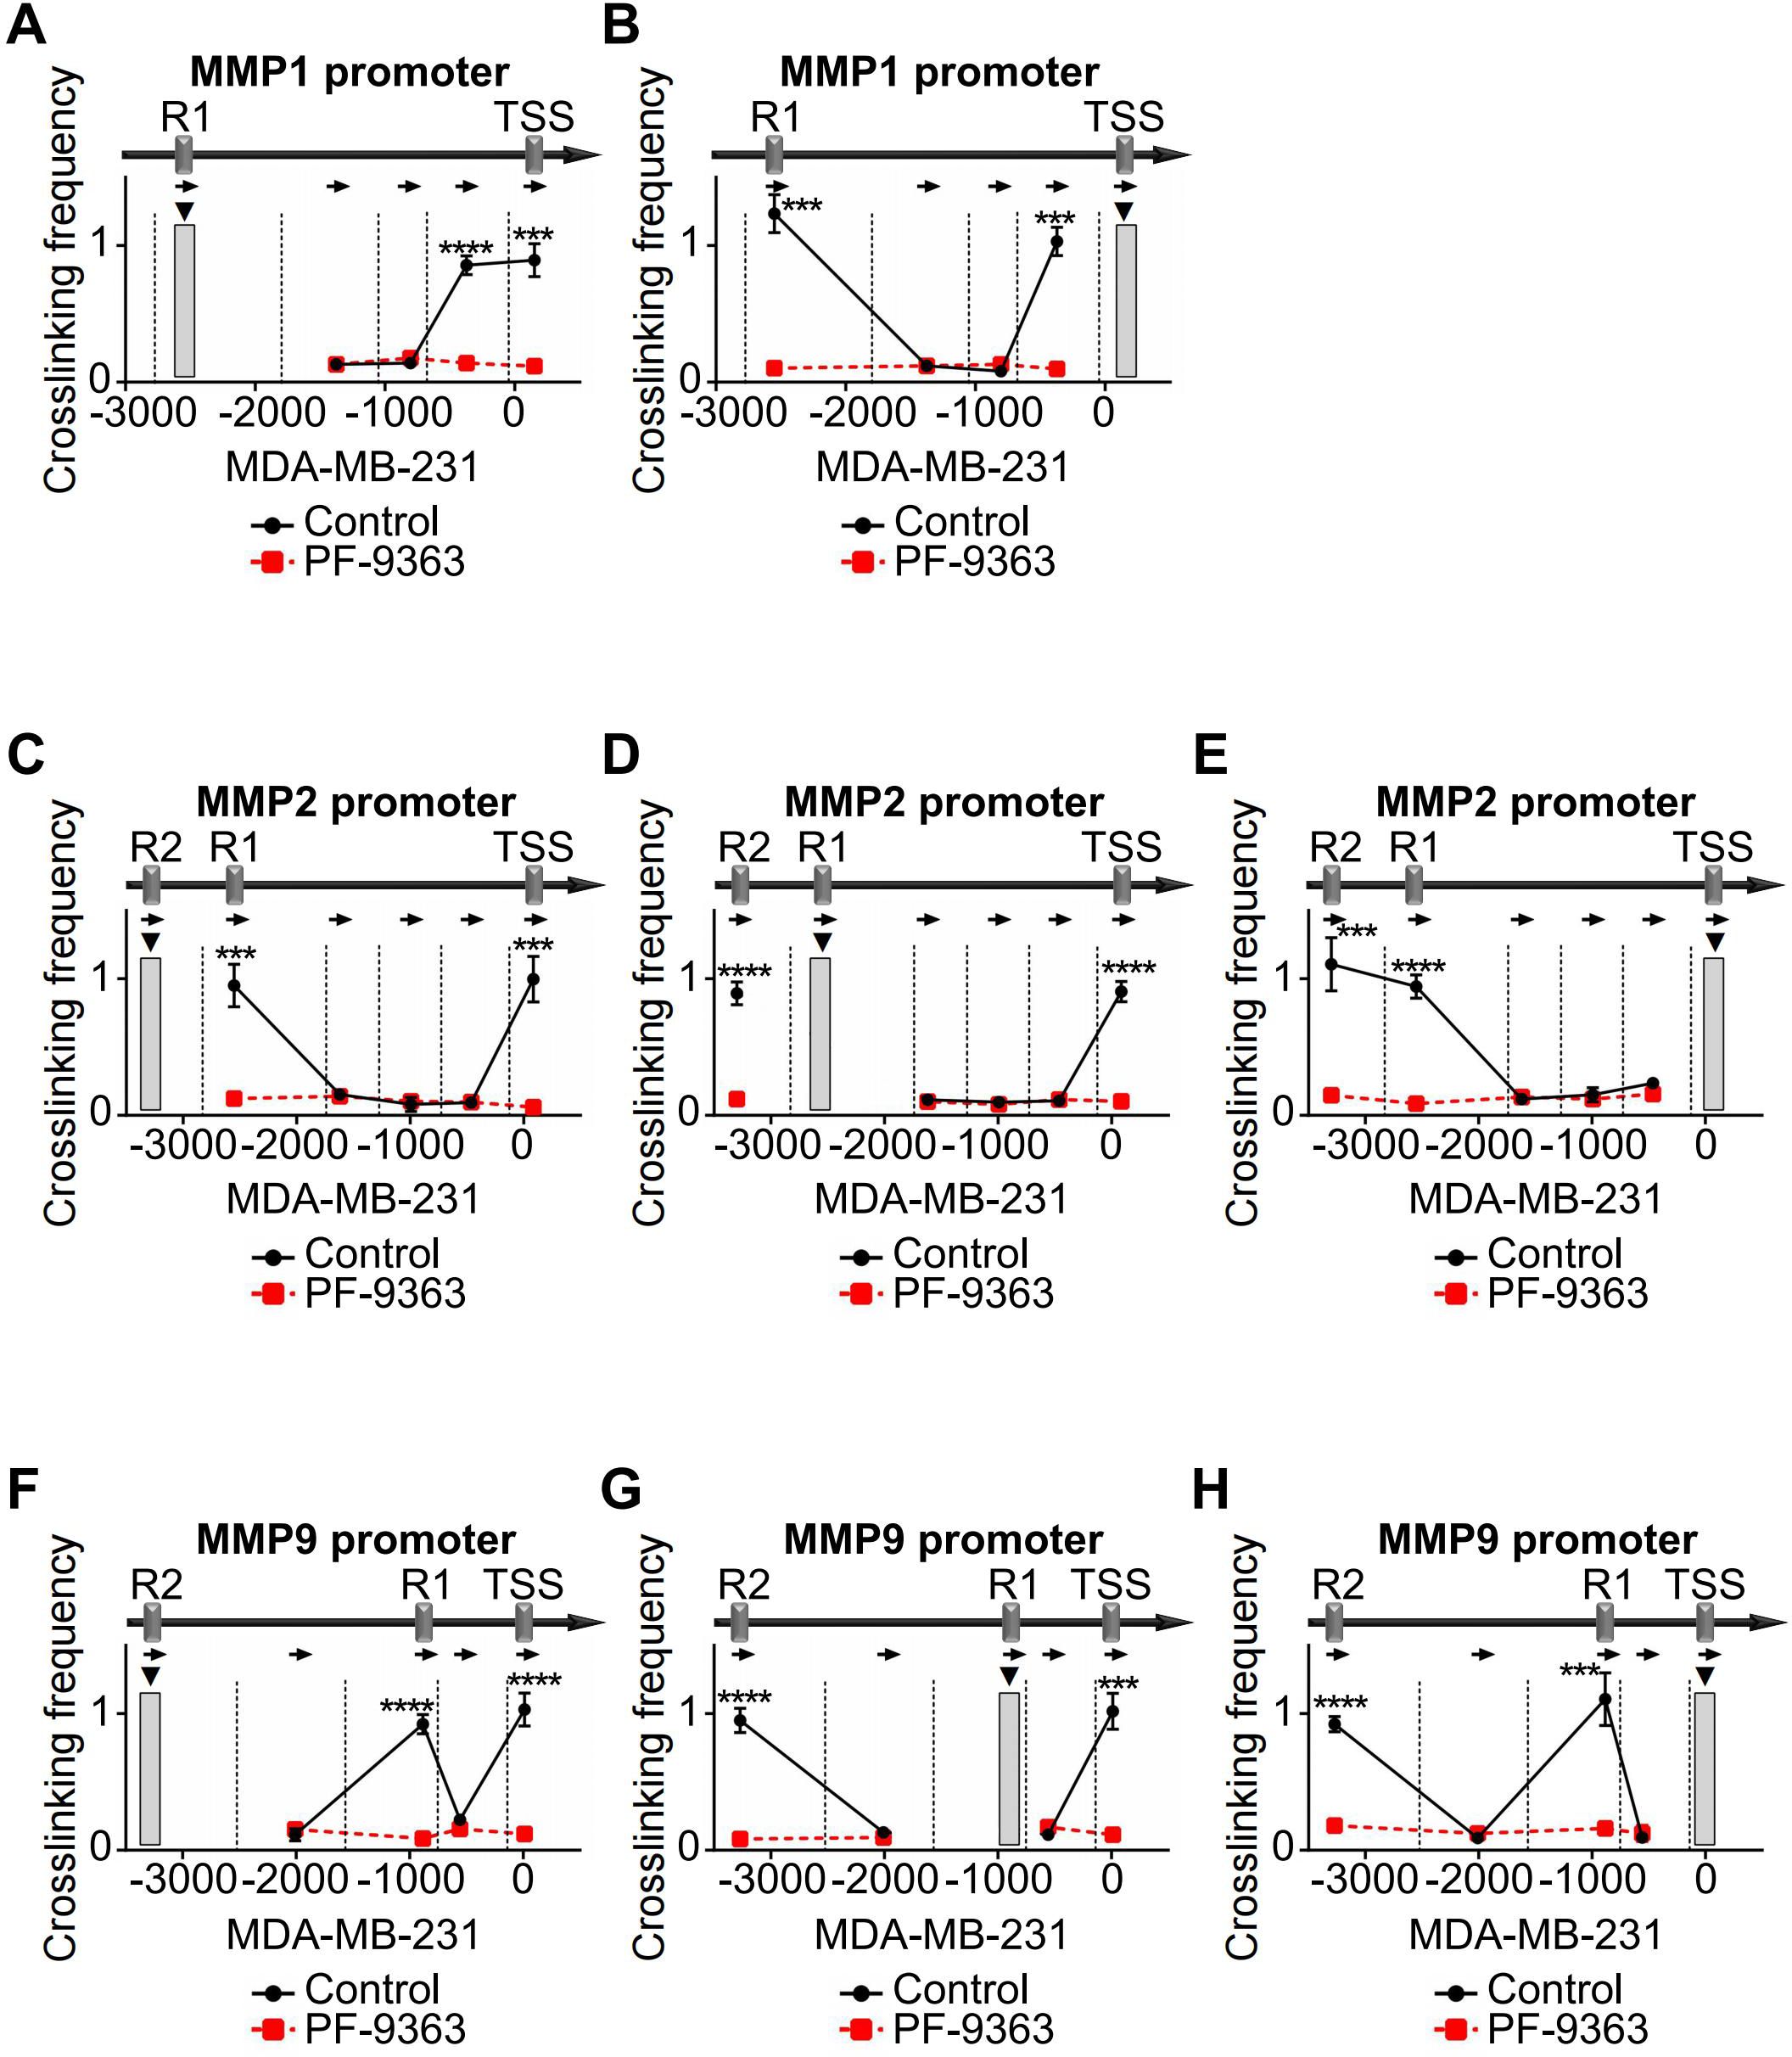
Figure 7. PF-9363 attenuated chromatin conformation enrichments in MMPs promoters. (A, B) In MDA-MB-231 cells, treatment with PF-9363 blocked the formation of R1/TSS cross-linking in MMP1 promoter. (C-E) In MDA-MB-231 cells, PF-9363 treatment dissociated cross-links among TSS, R1 and R2 in MMP2 promoter. (F–H) In MDA-MB-231 cells, PF-9363 departed cross-links among TSS, R1 and R2 in MMP9 promoter. ***p<0.001, ****p<0.0001.
3.7 HMGA2 promotes TNBC cells migration and invasion via MMPs
To validate HMGA2’s functional role in TNBC cells, we restored its expression in shHMGA2 groups, which resulted in a corresponding increase in MMPs protein levels (Figure 8A). Furthermore, HMGA2 re-expression enhanced TNBC cells migration and invasion (Figures 8B, C).
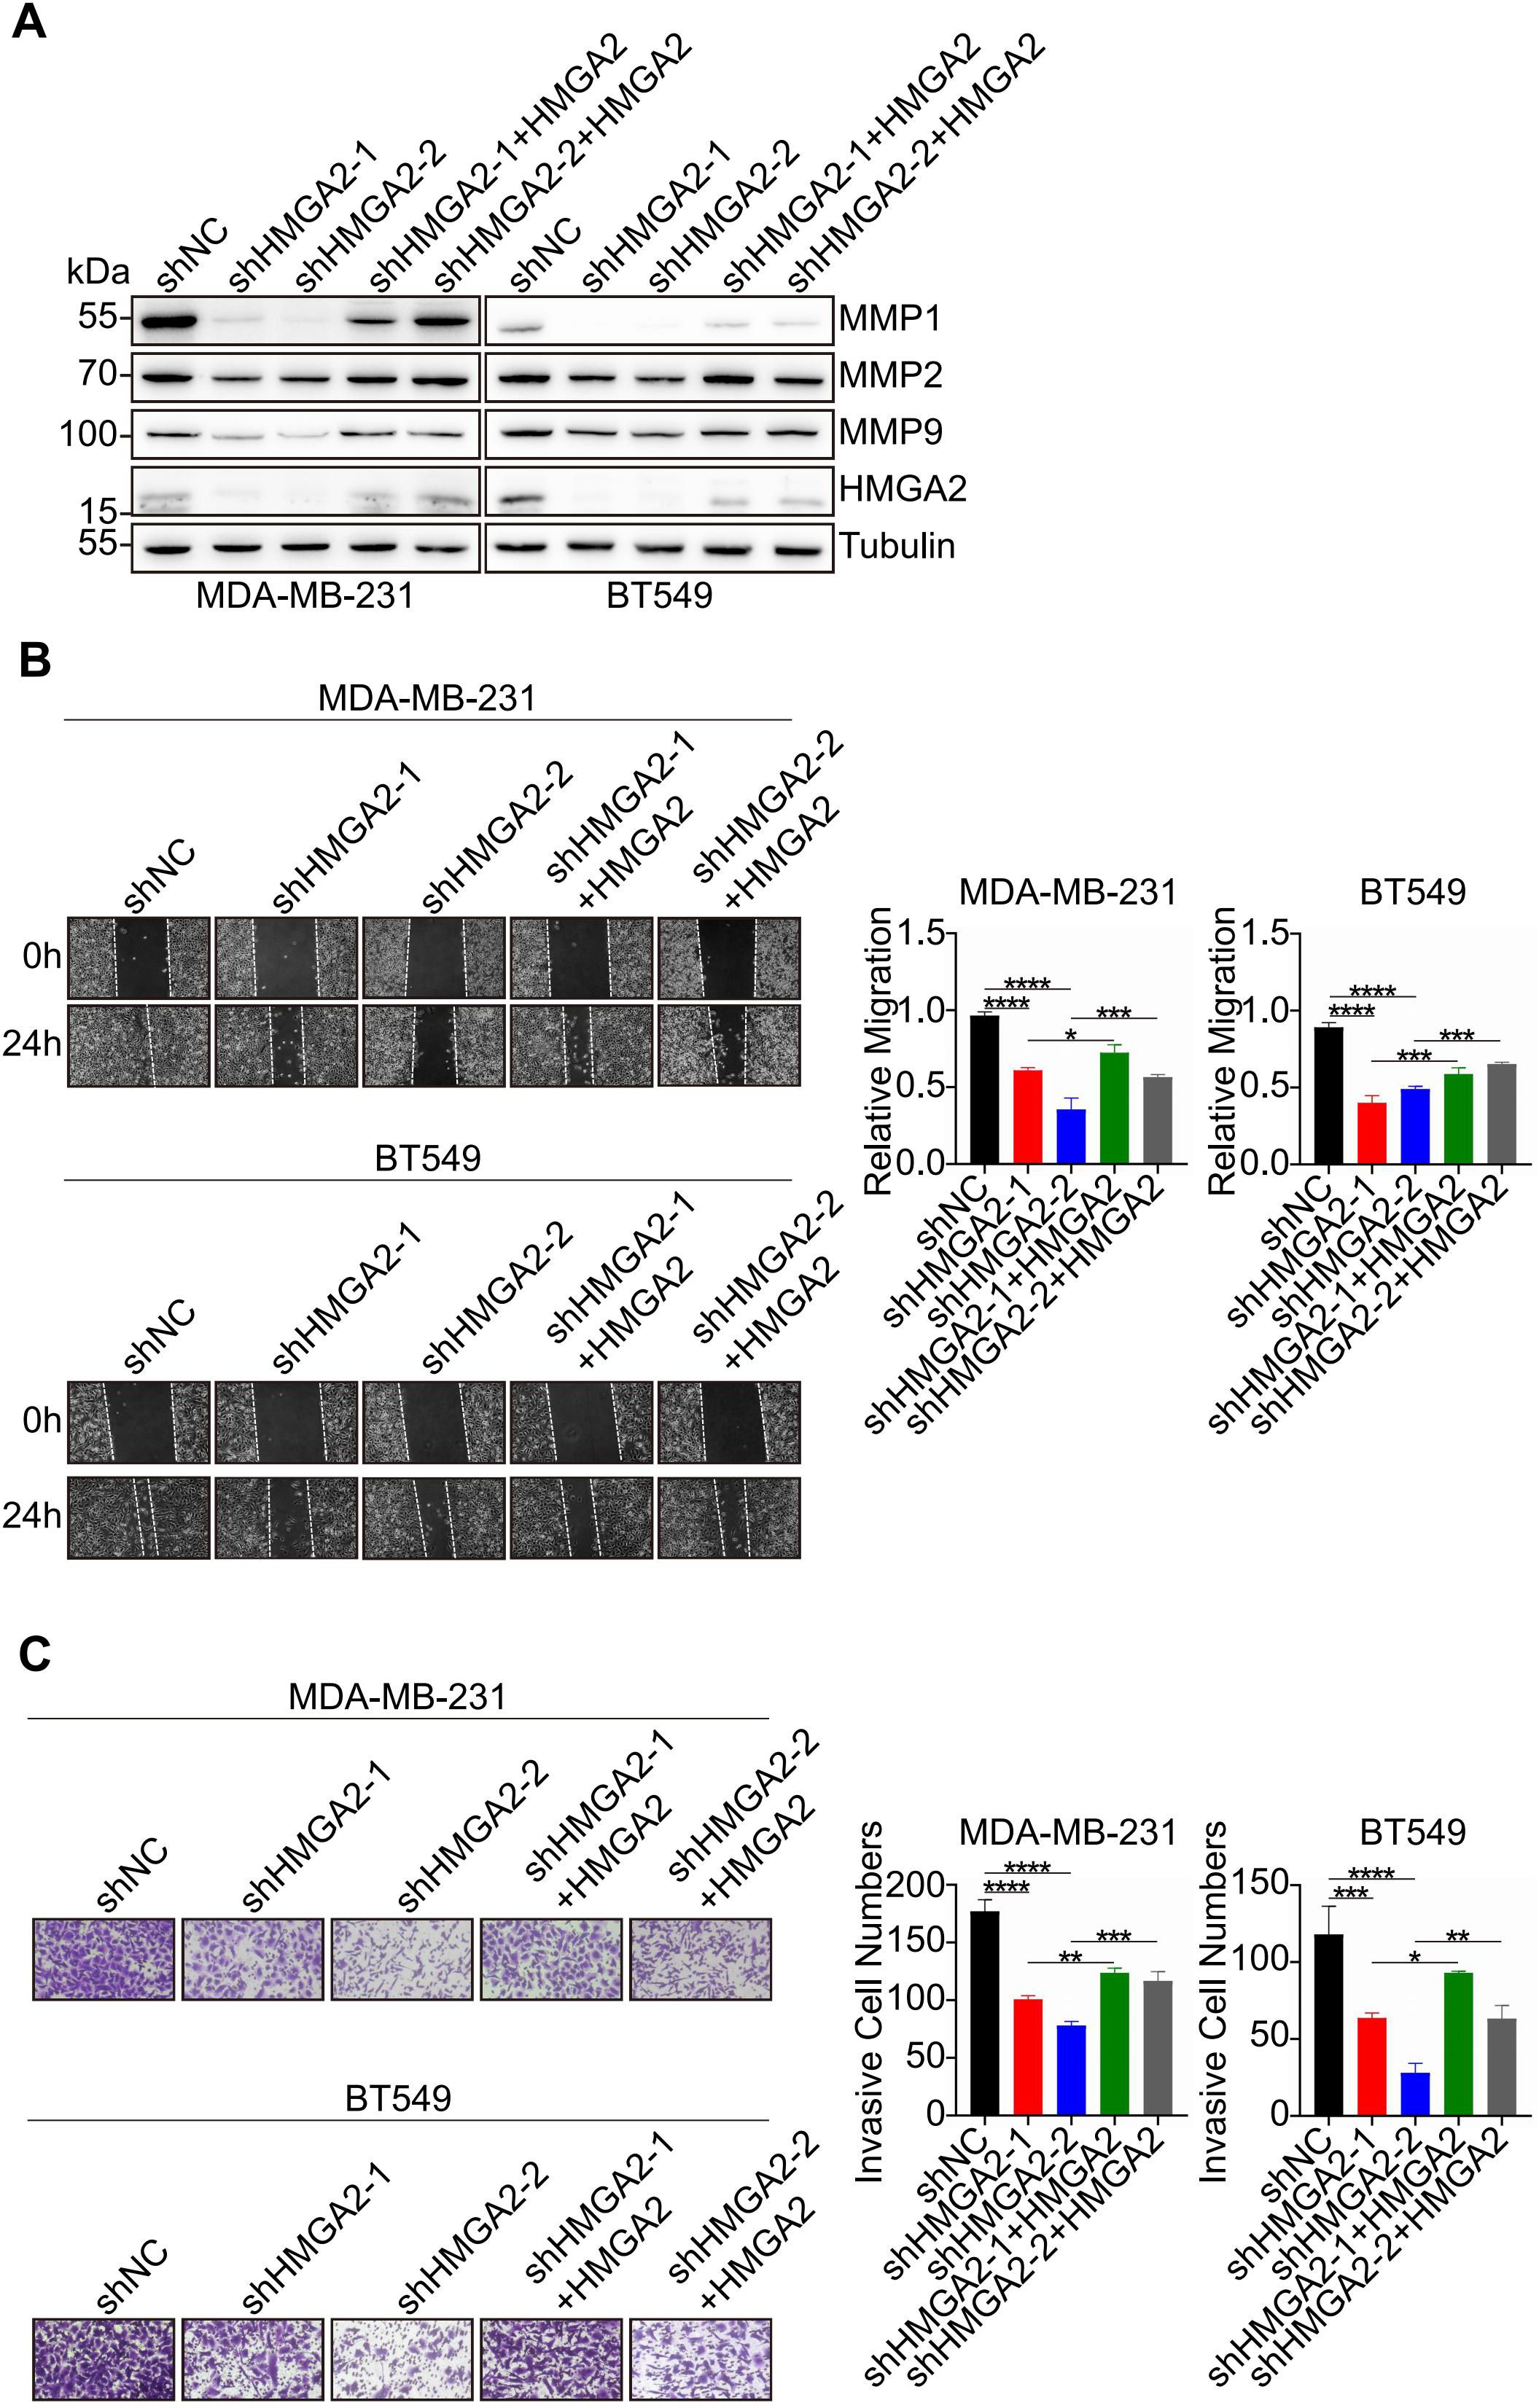
Figure 8. HMGA2 promotes TNBC cells migration and invasion via MMPs. (A) WB data of MMPs expression levels in TNBC cells of shNC group, two HMGA2 knocked down groups (shHMGA2-1, shHMGA2-2), and two HMGA2 rescued expression groups (shHMGA2 + HMGA2 res). (B, C) The wound healing and transwell assays detected aforementioned TNBC cells migration and invasion. *p<0.05, **p<0.01, ***p<0.001, ****p<0.0001.
4 Discussion
TNBC is an aggressive subtype of breast cancer with limited treatment options and a lack of effective therapeutic targets (27). Although previous studies have implicated HMGA2 in TNBC metastasis (12), the precise mechanisms by which it regulates chromatin conformation changes remain unclear. In this study, we identified HMGA2 as a critical architectural regulator of TNBC metastasis. Our findings revealed that HMGA2 expression is significantly elevated in TNBC tissues than in non-TNBC tissues. Furthermore, up-regulated HMGA2 expression correlated with poor prognosis in patients with TNBC, thus highlighting its potential as a prognostic biomarker. Functional studies using loss-of-function approaches confirmed HMGA2’s essential role in TNBC metastasis. Mechanistically, we revealed that HMGA2 interacts with KAT6A to regulate MMPs transcription, thereby promoting TNBC metastasis. Additionally, our findings showed that HMGA2 modulates chromatin conformation changes at MMPs loci. Collectively, these results suggested that HMGA2 may act as a novel biomarker for TNBC metastasis.
Alterations in histone modifications are fundamental epigenetic events that accompany transcriptional regulation and serve as critical drivers of oncogenesis and cancer progression. The N-terminus of KAT6A contains a double plant homeodomain (PHD) zinc finger domain and MYST domain, and the C-terminus of KAT6A contains a glutamate/aspartate-rich region and a serine/methionine-rich region (28). Considering that the MYST domain possesses acetyltransferase activity, and the serine/methionine-rich region possesses transcriptional activation activity (15), KAT6A can regulate chromatin structure and function by catalyzing the acetylation of specific amino acid residues, thereby affecting gene expression (14). KAT6A was previously established as an oncogene in TNBC through its interaction with SMAD3, which mediates TRIM24-SMAD3 complex recruitment to chromatin. Additionally, in TNBC immune microenvironment, the KAT6A/SMAD3/IL6/CD163 molecular axis drives macrophage M2 polarization (29). However, the role of KAT6A in TNBC requires further investigations.
Chromatin structure is crucial for gene expression and regulation (30, 31). For instance, the homolog family member A (RhoA) promoter contains two staphylococcal nuclease domain-containing protein 1 (SND1) recognition sites, where SND1 facilitates long-range chromatin interactions while linking histone H3K9ac to chromatin remodeling (32). SND1 promotes DNA methyltransferase 3 alpha (DNMT3A) transcription by modulating long-range chromatin remodeling of the DNMT3A promoter (26). Additionally, the transcription factor MYC regulates prostate cancer-specific gene transcription by remodeling CTCF-mediated chromatin structure (33). These results highlight the significance of chromatin conformation changes in tumorigenesis.
Overall, our study highlights HMGA2’s role as a chromatin architectural regulator in TNBC metastasis. Mechanistically, HMGA2 binds to MMPs promoters to regulate their transcription. Furthermore, HMGA2 interacts with KAT6A to catalyze H3K23ac modifications in MMPs promoter regions. These coordinated epigenetic modifications, along with chromatin conformation changes, ultimately promote MMPs transcription (Figure 9).
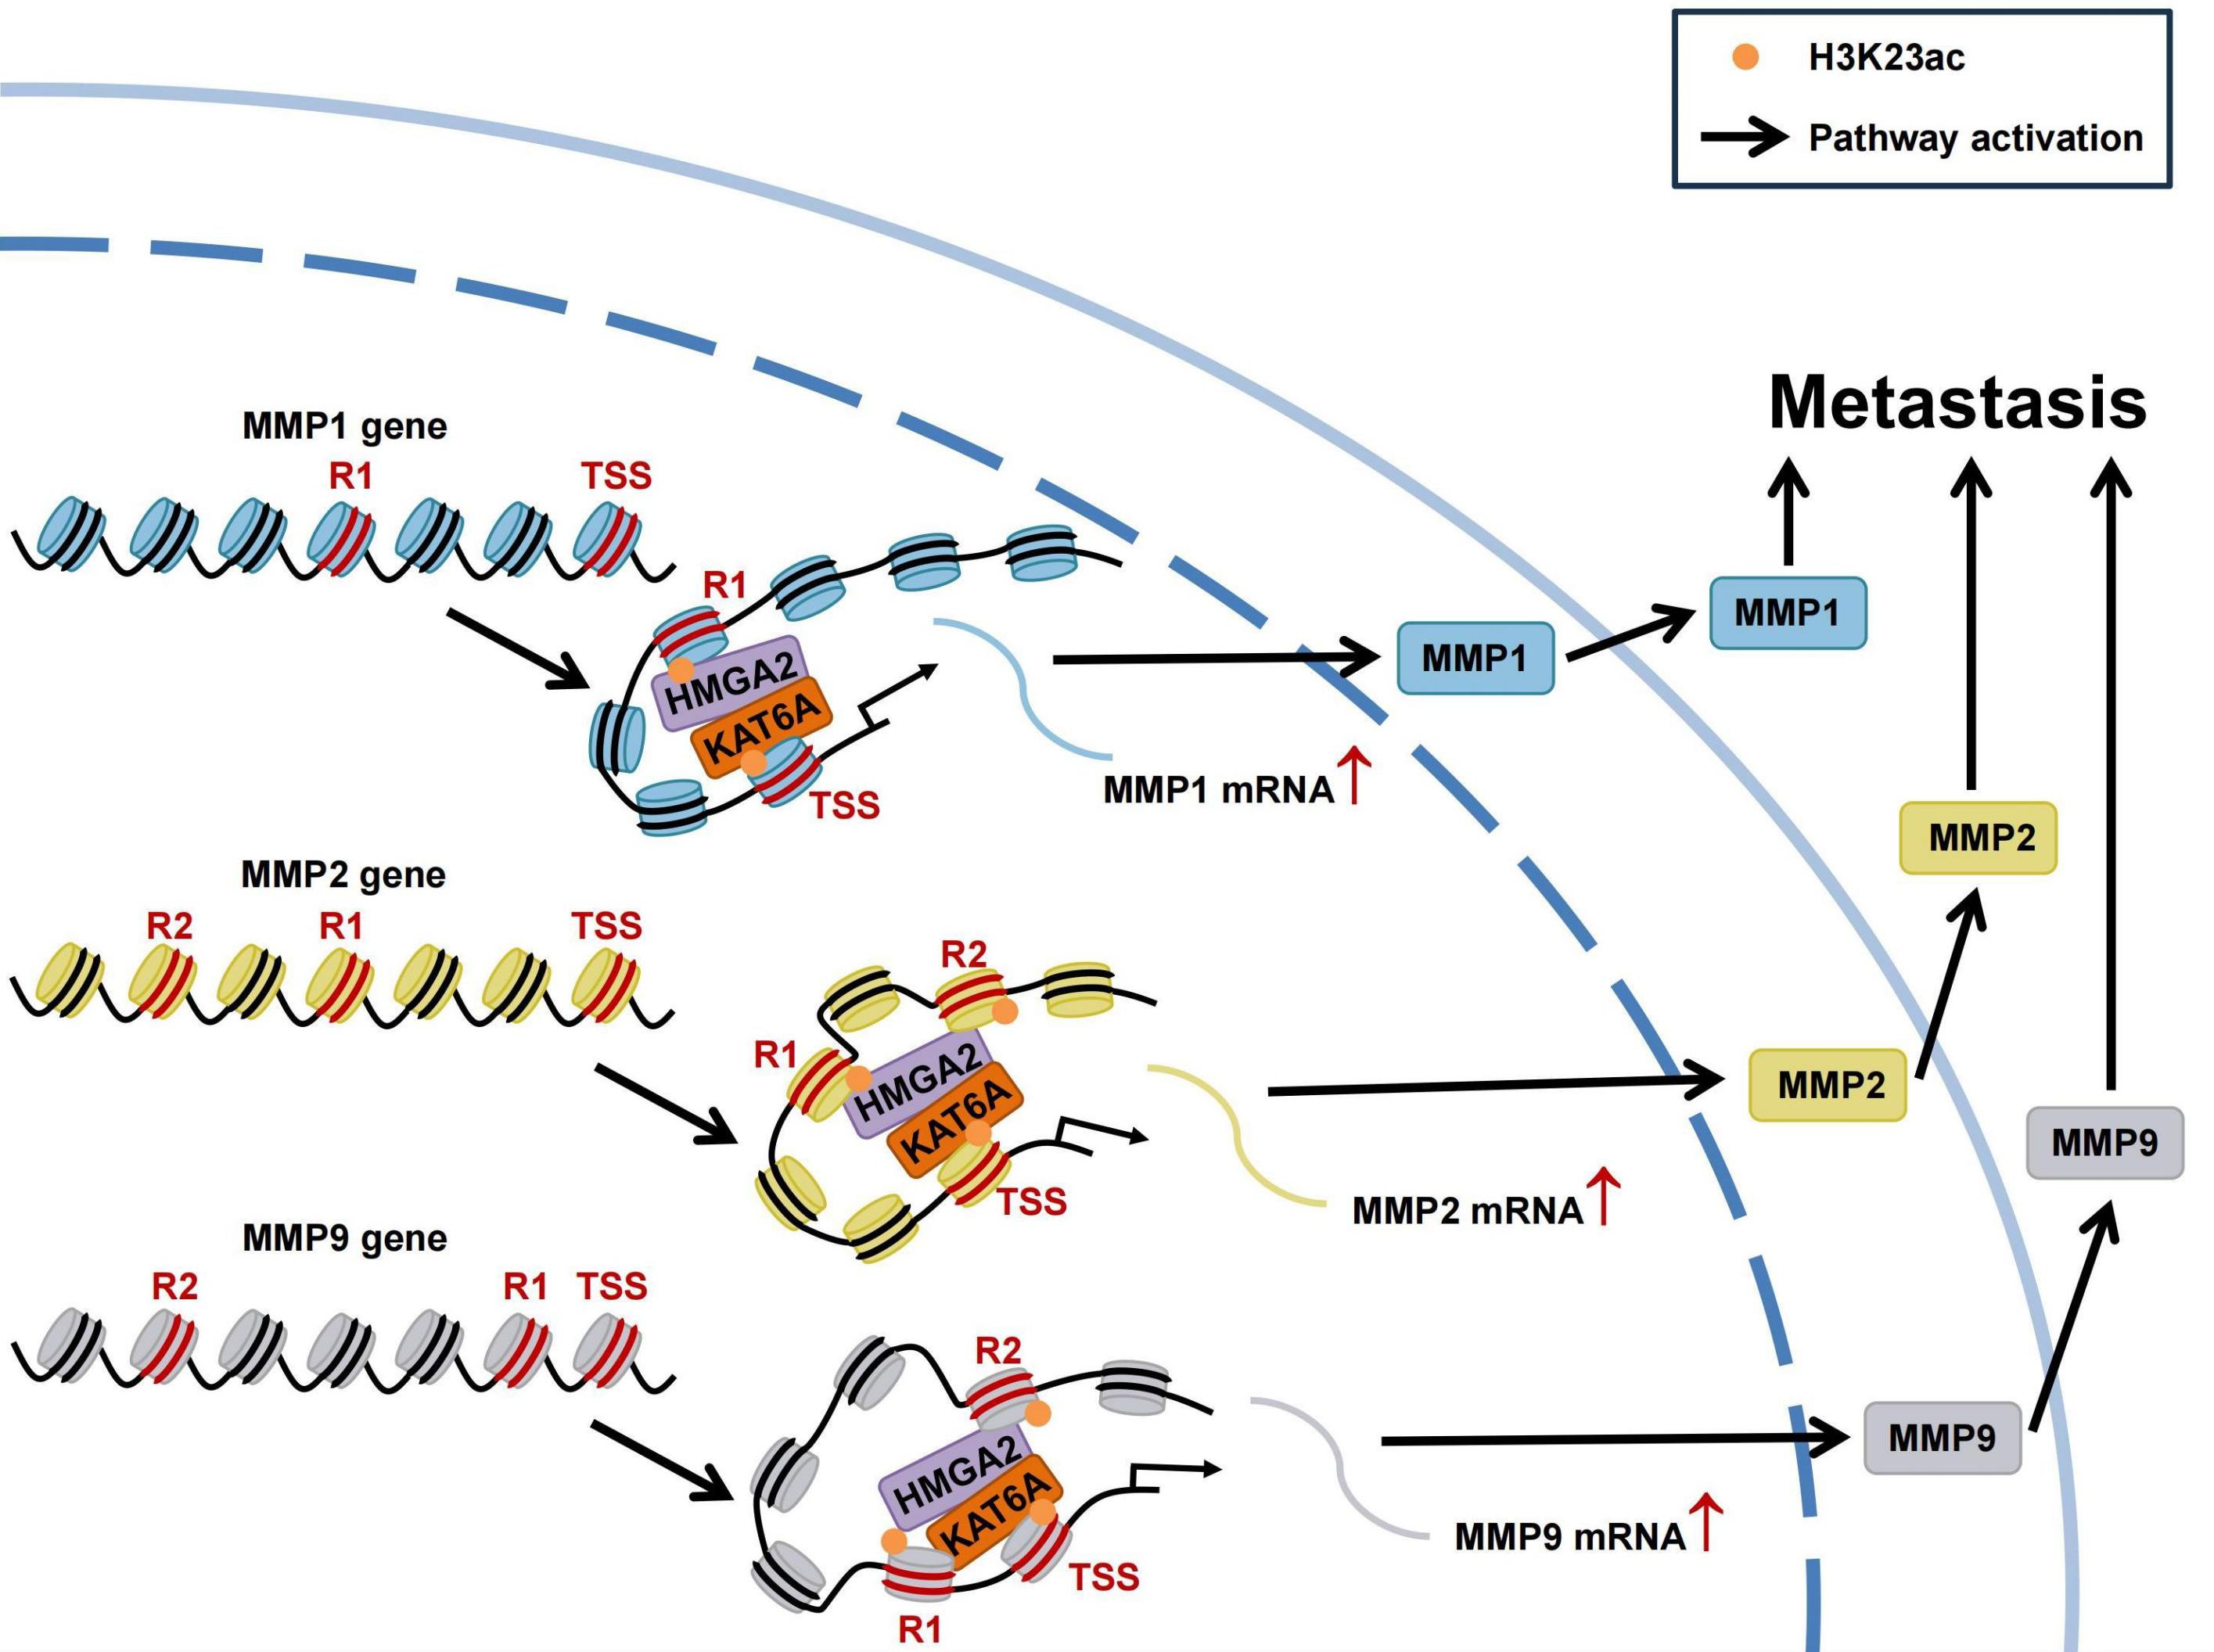
Figure 9. Schematic of HMGA2 interacts with KAT6A to regulate MMPs chromatin architecture and promote triple-negative breast cancer metastasis. HMGA2 directly binds to MMPs promoters to regulate their transcription. In addition, HMGA2 interacts with KAT6A to induce histone H3K23ac on MMPs promoters, accompanying with chromatin conformation changes. Extracellular matrix degradation induced by MMPs promote the metastasis of TNBC.
Data availability statement
RNA sequencing data in this study have been uploaded to the GEO repository (accession number GSE296619).
Ethics statement
The studies involving humans were approved by Ethics Committee of Tianjin Medical University General Hospital. The studies were conducted in accordance with the local legislation and institutional requirements. The participants provided their written informed consent to participate in this study. The animal studies were approved by Institutional Animal Care and Use Committee of Tianjin Medical University. The studies were conducted in accordance with the local legislation and institutional requirements. Written informed consent was obtained from the owners for the participation of their animals in this study.
Author contributions
LQ: Formal analysis, Investigation, Validation, Visualization, Writing – original draft, Writing – review & editing. ZL: Formal analysis, Investigation, Writing – original draft. PM: Formal analysis, Investigation, Software, Writing – review & editing, Resources. SZ: Data curation, Investigation, Writing – review & editing, Funding acquisition, Project administration, Resources. CS: Data curation, Investigation, Writing – review & editing, Resources. WL: Data curation, Visualization, Writing – review & editing, Resources. LY: Conceptualization, Funding acquisition, Methodology, Project administration, Resources, Supervision, Writing – original draft, Writing – review & editing.
Funding
The author(s) declare that financial support was received for the research and/or publication of this article. This research was supported by the National Natural Science Foundation of China (No. 82072772).
Acknowledgments
We thank all patients for their participation in this study.
Conflict of interest
The authors declare that the research was conducted in the absence of any commercial or financial relationships that could be construed as a potential conflict of interest.
Generative AI statement
The author(s) declare that no Generative AI was used in the creation of this manuscript.
Publisher’s note
All claims expressed in this article are solely those of the authors and do not necessarily represent those of their affiliated organizations, or those of the publisher, the editors and the reviewers. Any product that may be evaluated in this article, or claim that may be made by its manufacturer, is not guaranteed or endorsed by the publisher.
Supplementary material
The Supplementary Material for this article can be found online at: https://www.frontiersin.org/articles/10.3389/fimmu.2025.1590368/full#supplementary-material
Supplementary Figure 1 | The endogenous HMGA2 in TNBC cells. The endogenous HMGA2 were detected by IF in TNBC cells.
Supplementary Figure 2 | HMGA2 regulates enzymatic activities of both MMP2 and MMP9. MMP2 and MMP9 enzymatic activities were detected by gelatin zymograohy assay.
Supplementary Figure 3 | HMGA2 promotes MMPs transcription via chromatin conformation changes. (A) In BT549 cells, the anchor was R1 of MMP1, 3C data showed the DNA cross-link among R1 to TSS. HMGA2 knockdown attenuated the formation of R1/TSS cross-linking. (B) In BT549 cells, the anchor was TSS of MMP1, and the cross-link among TSS to R1 were shown. (C, F) In BT549 cells, the anchor was R2 of MMP2 or MMP9, and the cross-links among R2 to R1 and TSS were shown. (D, G) In BT549 cells, the anchor was R1 of MMP2 or MMP9, and the cross-links among R1 to R2 and TSS were shown. (E, H) In BT549 cells, the anchor was TSS of MMP2 or MMP9, and the cross-links among TSS to R1 and R2 were shown. ****p<0.0001.
Supplementary Figure 4 | PF-9363 attenuated chromatin conformation enrichments in MMPs promoters. In BT549 cells, PF-9363 attenuated the formation of chromatin conformation enrichments in MMP1 (A, B), MMP2 (C-E) and MMP9 (F–H) promoters. **p<0.01, ***p<0.001, ****p<0.0001.
References
1. Siegel RL, Miller KD, Wagle NS, and Jemal A. Cancer statistics, 2023. CA Cancer J Clin. (2023) 73:17–48. doi: 10.3322/caac.21763
2. Derakhshan F and Reis-Filho JS. Pathogenesis of triple-negative breast cancer. Annu Rev Pathol. (2022) 17:181–204. doi: 10.1146/annurev-pathol-042420-093238
3. Fusco A and Fedele M. Roles of HMGA proteins in cancer. Nat Rev Cancer. (2007) 7:899–910. doi: 10.1038/nrc2271
4. Mansoori B, Mohammadi A, Ditzel HJ, Duijf PHG, Khaze V, Gjerstorff MF, et al. HMGA2 as a critical regulator in cancer development. Genes (Basel). (2021) 12:269. doi: 10.3390/genes12020269
5. Luo Z, Zheng Q, Ye S, Li Y, Chen J, Fan C, et al. HMGA2 alleviates ferroptosis by promoting GPX4 expression in pancreatic cancer cells. Cell Death Dis. (2024) 15:220. doi: 10.1038/s41419-024-06592-y
6. Zhang S, Mo Q, and Wang X. Oncological role of HMGA2 (Review). Int J Oncol. (2019) 55:775–88. doi: 10.3892/ijo.2019.4856
7. Wang X, Wang J, Zhao J, Wang H, Chen J, and Wu J. HMGA2 facilitates colorectal cancer progression via STAT3-mediated tumor-associated macrophage recruitment. Theranostics. (2022) 12:963–75. doi: 10.7150/thno.65411
8. Morishita A, Zaidi MR, Mitoro A, Sankarasharma D, Szabolcs M, Okada Y, et al. HMGA2 is a driver of tumor metastasis. Cancer Res. (2013) 73:4289–99. doi: 10.1158/0008-5472.CAN-12-3848
9. Fang L, Zhang L, Wang M, He Y, Yang J, Huang Z, et al. Pooled CRISPR screening identifies P-bodies as repressors of cancer epithelial-mesenchymal transition. Cancer Res. (2024) 84:659–74. doi: 10.1158/0008-5472.CAN-23-1693
10. Dong J, Wang R, Ren G, Li X, Wang J, Sun Y, et al. HMGA2-FOXL2 axis regulates metastases and epithelial-to-mesenchymal transition of chemoresistant gastric cancer. Clin Cancer Res. (2017) 23:3461–73. doi: 10.1158/1078-0432.CCR-16-2180
11. Hombach-Klonisch S, Kalantari F, Medapati MR, Natarajan S, Krishnan SN, Kumar-Kanojia A, et al. HMGA2 as a functional antagonist of PARP1 inhibitors in tumor cells. Mol Oncol. (2019) 13:153–70. doi: 10.1002/1878-0261.12390
12. Mansoori B, Terp MG, Mohammadi A, Pedersen CB, Ditzel HJ, Baradaran B, et al. HMGA2 supports cancer hallmarks in triple-negative breast cancer. Cancers (Basel). (2021) 13:5197. doi: 10.3390/cancers13205197
13. Xu J, Fang X, Long L, Wang S, Qian S, and Lyu J. HMGA2 promotes breast cancer metastasis by modulating Hippo-YAP signaling pathway. Cancer Biol Ther. (2021) 22:5–11. doi: 10.1080/15384047.2020.1832429
14. Wiesel-Motiuk N and Assaraf YG. The key roles of the lysine acetyltransferases KAT6A and KAT6B in physiology and pathology. Drug Resist Updat. (2020) 53:100729. doi: 10.1016/j.drup.2020.100729
15. Zheng T, Wang S, Liu W, and Lu Y. Targeting KAT6A/B as a new therapeutic strategy for cancer therapy. J Med Chem. (2025) 68:1002–20. doi: 10.1021/acs.jmedchem.4c02613
16. Yan F, Li J, Milosevic J, Petroni R, Liu S, Shi Z, et al. KAT6A and ENL form an epigenetic transcriptional control module to drive critical leukemogenic gene-expression programs. Cancer Discov. (2022) 12:792–811. doi: 10.1158/2159-8290.CD-20-1459
17. Liu W, Zhan Z, Zhang M, Sun B, Shi Q, Luo F, et al. KAT6A, a novel regulator of beta-catenin, promotes tumorigenicity and chemoresistance in ovarian cancer by acetylating COP1. Theranostics. (2021) 11:6278–92. doi: 10.7150/thno.57455
18. Lv D, Jia F, Hou Y, Sang Y, Alvarez AA, Zhang W, et al. Histone acetyltransferase KAT6A upregulates PI3K/AKT signaling through TRIM24 binding. Cancer Res. (2017) 77:6190–201. doi: 10.1158/0008-5472.CAN-17-1388
19. de Almeida LGN, Thode H, Eslambolchi Y, Chopra S, Young D, Gill S, et al. Matrix metalloproteinases: from molecular mechanisms to physiology, pathophysiology, and pharmacology. Pharmacol Rev. (2022) 74:712–68. doi: 10.1124/pharmrev.121.000349
20. Isaacson KJ, Martin Jensen M, Subrahmanyam NB, and Ghandehari H. Matrix-metalloproteinases as targets for controlled delivery in cancer: An analysis of upregulation and expression. J Control Release. (2017) 259:62–75. doi: 10.1016/j.jconrel.2017.01.034
21. Roy R, Yang J, and Moses MA. Matrix metalloproteinases as novel biomarkers and potential therapeutic targets in human cancer. J Clin Oncol. (2009) 27:5287–97. doi: 10.1200/JCO.2009.23.5556
22. Liu M, Hu Y, Zhang MF, Luo KJ, Xie XY, Wen J, et al. MMP1 promotes tumor growth and metastasis in esophageal squamous cell carcinoma. Cancer Lett. (2016) 377:97–104. doi: 10.1016/j.canlet.2016.04.034
23. Zhu S, Yang N, Niu C, Wang W, Wang X, Bai J, et al. The miR-145-MMP1 axis is a critical regulator for imiquimod-induced cancer stemness and chemoresistance. Pharmacol Res. (2022) 179:106196. doi: 10.1016/j.phrs.2022.106196
24. Geervliet E and Bansal R. Matrix metalloproteinases as potential biomarkers and therapeutic targets in liver diseases. Cells. (2020) 9:1212. doi: 10.3390/cells9051212
25. Bi X, Lou P, Song Y, Sheng X, Liu R, Deng M, et al. Msi1 promotes breast cancer metastasis by regulating invadopodia-mediated extracellular matrix degradation via the Timp3-Mmp9 pathway. Oncogene. (2021) 40:4832–45. doi: 10.1038/s41388-021-01873-8
26. Zhang H, Gao M, Zhao W, and Yu L. The chromatin architectural regulator SND1 mediates metastasis in triple-negative breast cancer by promoting CDH1 gene methylation. Breast Cancer Res. (2023) 25:129. doi: 10.1186/s13058-023-01731-3
27. Hua Z, White J, and Zhou J. Cancer stem cells in TNBC. Semin Cancer Biol. (2022) 82:26–34. doi: 10.1016/j.semcancer.2021.06.015
28. Su J, Wang X, Bai Y, Sun M, Yao Y, and Duan Y. The role of MOZ/KAT6A in hematological Malignancies and advances in MOZ/KAT6A inhibitors. Pharmacol Res. (2021) 174:105930. doi: 10.1016/j.phrs.2021.105930
29. Zhu K, Lv Q, Lu X, Wang Y, and Dai X. Cold atmospheric plasma restores skewed macrophage polarization in triple negative breast cancers via enhancing KAT6A acetylation. Free Radic Biol Med. (2025) 226:364–73. doi: 10.1016/j.freeradbiomed.2024.11.028
30. Zhao S, Allis CD, and Wang GG. The language of chromatin modification in human cancers. Nat Rev Cancer. (2021) 21:413–30. doi: 10.1038/s41568-021-00357-x
31. Guo D, Xie Q, Jiang S, Xie T, Li Y, Huang X, et al. Synergistic alterations in the multilevel chromatin structure anchor dysregulated genes in small cell lung cancer. Comput Struct Biotechnol J. (2021) 19:5946–59. doi: 10.1016/j.csbj.2021.11.003
32. Yu L, Xu J, Liu J, Zhang H, Sun C, Wang Q, et al. The novel chromatin architectural regulator SND1 promotes glioma proliferation and invasion and predicts the prognosis of patients. Neuro Oncol. (2019) 21:742–54. doi: 10.1093/neuonc/noz038
Keywords: triple-negative breast cancer, high mobility group AT-hook 2, matrix metalloproteinases, lysine acetyltransferase 6A, metastasis
Citation: Qiao L, Liang Z, Ma P, Zhang S, Sun C, Luo W and Yu L (2025) HMGA2 interacts with KAT6A to regulate MMPs chromatin architecture and promote triple-negative breast cancer metastasis. Front. Immunol. 16:1590368. doi: 10.3389/fimmu.2025.1590368
Received: 09 March 2025; Accepted: 28 April 2025;
Published: 22 May 2025.
Edited by:
Xiangpeng Dai, Jilin University, ChinaCopyright © 2025 Qiao, Liang, Ma, Zhang, Sun, Luo and Yu. This is an open-access article distributed under the terms of the Creative Commons Attribution License (CC BY). The use, distribution or reproduction in other forums is permitted, provided the original author(s) and the copyright owner(s) are credited and that the original publication in this journal is cited, in accordance with accepted academic practice. No use, distribution or reproduction is permitted which does not comply with these terms.
*Correspondence: Lin Yu, b25vYmxpdmlvbkB0bXUuZWR1LmNu
†These authors have contributed equally to this work