 Jingjing Chen1
 Mengjia Peng
- 1Department of Gynecology and Obstetrics, The Third Affiliated Hospital of Wenzhou Medical University, Rui’an, China
- 2Department of Gynecology and Obstetrics, The Second Affiliated Hospital of Wenzhou Medical University, Wenzhou, China
Background: Preeclampsia, a hypertensive disorder during pregnancy affecting 2-8% of pregnancies globally, remains a leading cause of maternal and fetal morbidity. Current diagnostic reliance on late-onset clinical features and suboptimal biomarkers underscores the need for early molecular predictors. Ribosome biogenesis, critical for cellular homeostasis, is hypothesized to drive placental dysfunction in PE, though its role remains underexplored.
Methods: We integrated placental transcriptomic data from two datasets (GSE75010, GSE10588) to systematically investigate ribosome biogenesis dysregulation in preeclampsia. Functional enrichment analyses delineated the dysregulation of pathways, while weighted gene co-expression network analysis identified hub genes within ribosome biogenesis-associated modules. A multi-algorithm machine learning framework was employed to optimize predictive performance, with model interpretability achieved through SHapley Additive exPlanations and diagnostic accuracy validated by receiver operating characteristic curves. Immune microenvironment profiling and regulatory network analyses elucidated mechanistic links. Finally, qRT-PCR confirmed the differential expression of key genes in clinical samples.
Results: We identified 25 ribosome biogenesis-related differentially expressed genes, which were significantly enriched in RNA degradation and rRNA processing. Weighted gene co-expression network analysis prioritized seven hub genes. A random forest model incorporating six key feature genes (GLUL, DDX28, NCL, RIOK1, SUV39H1, RRS1) demonstrated robust diagnostic performance, achieving an AUC of 0.972 in the training dataset and 0.917 in the validation dataset. SHapley Additive exPlanations interpretability analysis revealed SUV39H1 as the dominant risk contributor, while GLUL exhibited a protective effect. Regulatory network reconstruction identified 32 transcription factors, 24 RNA-binding proteins, and 62 miRNAs as putative upstream regulators of key genes. Immune Microenvironment Profiling linked key genes to altered placental immune cell populations. qRT-PCR confirmed that GLUL and NCL expression decreased and DDX28 and RIOK1 expression increased in clinical placental samples of preeclampsia group.
Conclusion: This study identifies ribosome biogenesis as one of the pivotal molecular mechanisms to PE pathogenesis, leveraging SHAP-interpretable machine learning to pinpoint six biomarkers. Future research is requisite for the validation of CRISPR and the integration of multi-omics to translate the findings into clinical diagnosis and targeted therapy.
1 Introduction
Preeclampsia (PE), a multisystem hypertensive disorder of pregnancy affecting approximately 2-8% of global pregnancies, remains a leading cause of maternal and perinatal morbidity and mortality, accounting for over 70,000 maternal deaths annually with disproportionate impacts in low-resource settings due to limited prenatal care access (1, 2). PE arises from multifactorial interactions between maternal, fetal, and placental components. Central to its pathophysiology is impaired trophoblast function, specifically defective invasion leading to inadequate uterine spiral artery remodeling, which results in shallow placental implantation (3, 4). These placental aberrations induce malperfusion-induced ischemia, endothelial dysfunction, and systemic inflammatory activation, clinically manifesting as gestational hypertension with multiorgan complications. Without timely intervention, progressive disease may culminate in critical maternal complications such as eclampsia and hemolysis, elevated liver enzymes, and low platelet count (HELLP) syndrome (3, 4). Current diagnostic approaches predominantly depend on late-onset clinical features (e.g., proteinuria, hypertension) and suboptimal biomarkers such as soluble fms-like tyrosine kinase-1 to placental growth factor (sFlt-1/PlGF) ratio, which significantly constrains timely clinical intervention. This limitation underscores the critical need for predictive models based on early-stage biomarkers (5, 6).
Ribosome biogenesis is a dynamic, multi-step process involving RNA polymerase I (Pol I)-driven transcription of 47S pre-rRNA, ribosomal protein (RP) assembly, and nucleolar maturation. This fundamental process serves as a pivotal regulator of cellular proteostasis and plays a crucial role in mediating adaptive responses to metabolic and oxidative stress (7). During placental development, ribosome biogenesis is tightly regulated by nutrient-sensing pathways, including MYC-mediated transcriptional activation and mTOR-dependent ribosomal protein synthesis, which collectively coordinate trophoblast proliferation, differentiation, and invasive capacity (7, 44). Dysregulation of ribosome biogenesis disrupts nucleolar architecture, triggering nucleolar stress characterized by impaired rRNA processing, defective ribosomal RNA (rRNA) surveillance, and p53-dependent cell cycle arrest. These molecular perturbations directly contribute to PE’s characteristic pathological features of inadequate placental implantation and vascular dysfunction (8, 44). Moreover, defects in mitochondrial ribosome biogenesis further exacerbate oxidative injury by impairing electron transport chain (ETC) complex assembly, leading to reactive oxygen species (ROS) overproduction and trophoblast apoptosis, as evidenced by downregulated mitochondrial RP expression in PE placentas (8, 45). Concurrently, ribosomopathies reduce translational precision, causing dysregulation of key epithelial-mesenchymal transition (EMT) mediators such as E-cadherin and Snail, thereby suppressing trophoblast migration and spiral artery remodeling (9). These pathological cascades are amplified by epigenetic dysregulation, which represses Pol I activity and exacerbates nucleolar stress (46). The resultant proteostatic imbalance activates compensatory mechanisms such as ribophagy and unfolded protein response (UPR), further depleting functional ribosomes and creating a feedforward loop of placental ischemia and sterile inflammation (47, 48). While these pathophysiological parallels underscore ribosome biogenesis as a critical node in PE pathogenesis, the key feature genes which could predict the PE risk and associated mechanisms remain underexplored, necessitating systematic investigations to translate these insights into biomarkers and treatment targets.
In this study, we hypothesized that dysregulated ribosome biogenesis represents a key molecular driver of PE progression and may serve as a predictive biomarker for PE risk. To address this, we explored the ribosome biogenesis-related differentially expressed genes (RiboRDEGs) in PE and developed a ribosome biogenesis-centric framework for PE risk prediction. Our multi-cohort transcriptomic analysis identified 25 RiboDEGs significantly associated with PE pathogenesis. Functional characterization of these genes revealed their critical roles in PE development. Using weighted gene co-expression network analysis (WGCNA) coupled with ensemble machine learning approaches, we identified six core predictive biomarkers (GLUL, DDX28, NCL, RIOK1, SUV39H1, and RRS1) with high diagnostic potential. SHapley Additive exPlanations (SHAP) analysis elucidated the synergistic contributions of these feature genes to PE risk, while integrated regulatory network analysis uncovered their coordinated transcriptional and post-transcriptional control mechanisms. Importantly, immune microenvironment profiling demonstrated significant associations between key RiboDEGs and altered placental immune cell compositions. These findings provide novel insights into the role of ribosome biogenesis dysregulation in PE pathogenesis. Furthermore, we present a clinically applicable prediction model that bridges molecular mechanisms with early risk assessment, representing a significant advancement toward personalized obstetric care.
2 Materials and methods
2.1 Data acquisition and preprocessing
Gene expression profiles of PE were retrieved from the National Center for Biotechnology Information (NCBI) Gene Expression Omnibus (GEO) database (7). Three placental tissue-derived Homo sapiens datasets were analyzed: GSE75010 (GPL6244 platform; 80 PE cases and 77 controls) (8–13), GSE10588 (GPL2986 platform; 17 PE cases and 26 controls) (14), and GSE54618 (GPL10558 platform; 12 PE cases and 12 controls) (15) (Table 1). Probe annotation was performed for GSE75010 and GSE10588 using platform-specific annotation files, followed by dataset merging and batch effect correction via the sva R package (v3.52.0) (16). The combined dataset (97 PE cases and 103 controls) underwent normalization using the R package limma (v3.60.4) (17), with principal component analysis (PCA) (18) confirming effective batch effect removal. The GSE54618 dataset served as an independent validation cohort, processed identically with probe annotation and normalization.
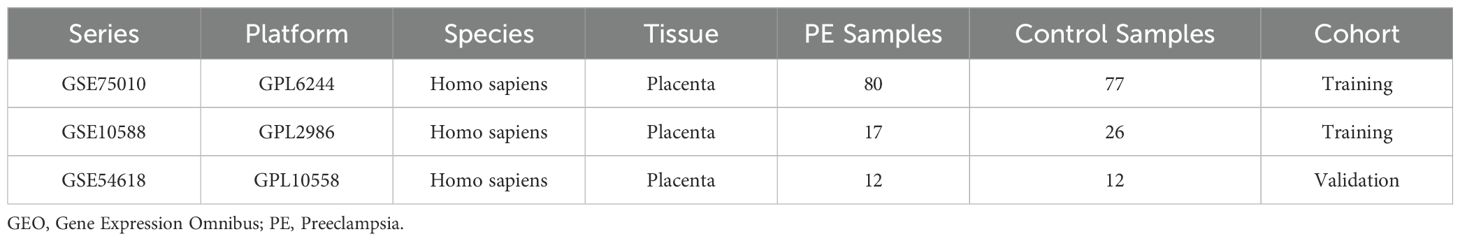
Table 1. GEO microarray chip information.
2.2 Acquisition of ribosome biogenesis-related genes
RiboRGs were systematically acquired through a dual-source approach. Firstly, the GeneCards database (19) was queried using the keyword “ribosome biogenesis,” retaining protein-coding genes with a relevance score >5, which yielded 59 candidate genes. Secondly, 331 RiboRGs were retrieved from the published literature using the same keyword on the PubMed website (20). After merging these two gene lists and removing duplicates, a final set of 344 nonrepetitive RiboRGs was generated for subsequent analysis (Supplementary Table S1).
2.3 Identification of RiboRDEGs in PE
Differentially expressed genes (DEGs) between PE and control groups were identified using the R package limma with thresholds of |log2 fold change (log2FC) | > 0.1 and adjusted p-value (P.adj) < 0.05 (Benjamini-Hochberg correction). Upregulated and downregulated DEGs were defined as log2FC > 0.1 and log2FC < -0.1, respectively, with statistical significance (P.adj < 0.05). Volcano plots were generated using R package ggplot2 (v3.5.1) to visualize differential expression patterns. RiboRDEGs were subsequently identified by intersecting the DEG list with the precompiled 344 RiboRGs, with results visualized through a Venn diagram. Heatmaps generated by R package ComplexHeatmap (v2.20.0) (21) employed Z-score-normalized counts, hierarchical clustering (Euclidean distance, complete linkage), and three-dimensional PCA maps generated by R package rgl (v1.3.1) demonstrated clear separation of PE and controls.
2.4 Functional enrichment analysis
Gene set enrichment analysis (GSEA) (22) was performed on the combined dataset using the R package clusterProfiler (v4.12.6) (23) with the Kyoto Encyclopedia of Genes and Genomes (KEGG) database (24), employing gene set size thresholds of 10–500 genes and significance criteria of P.adj < 0.05 (Benjamini-Hochberg method) and false discovery rate (FDR) < 0.05. To elucidate the biological functions of RiboRDEGs, Gene Ontology (GO) (25), which encompasses biological process (BP), cellular component (CC), and molecular function (MF), and KEGG pathway analysis were performed using clusterProfiler, with the same statistical thresholds. Pathway interaction networks were reconstructed using the R package CBNplot (v1.4.0) (26), where Bayesian networks were inferred through the bnpathplot function by modeling biological pathways as nodes weighted by pathway activity scores derived from RiboRDEG expression profiles.
2.5 Weighted gene co-expression network construction and hub gene identification
WGCNA was implemented using the R package WGCNA (v1.73) (27) to identify hub genes among RiboRDEGs. A scale-free topology model was constructed by selecting an optimal soft-thresholding power (β) to maximize network connectivity while minimizing spurious correlations. The adjacency matrix was transformed into a topological overlap matrix (TOM) to quantify gene co-expression similarity, followed by dynamic tree cutting to define gene modules. Module-trait relationships were assessed by calculating Pearson correlation coefficients between module eigengenes (MEs) and PE status, with the most significantly associated module (p < 0.05) selected for downstream analysis. Hub genes were identified as the intersection of RiboRDEGs and genes within the PE-correlated module, visualized via Venn diagrams. Pairwise Spearman correlations among hub genes were computed and displayed using the corrplot R package (v0.94).
2.6 Predictive model construction and feature gene identification via integrated machine learning
A comprehensive machine learning framework comprising (28) 113 prediction models was developed using the combined dataset to identify key feature genes associated with PE risk. Twelve distinct algorithms spanning linear models (Stepglm, Lasso, Ridge, Enet), ensemble methods (XGBoost, RandomForest, GBM), Bayesian approaches (NaiveBayes), hybrid dimensionality reduction & regularization (plsRglm) and supervised learning techniques (SVM, glmBoost, LDA) were implemented through their respective R packages (glmnet, xgboost, randomForest, etc.), with algorithm combinations detailed in Supplementary Table S2. Model performance was evaluated via 10-fold cross-validation, receiver operating characteristic (ROC) curve analysis, and decision curve analysis (DCA), with diagnostic efficacy quantified by mean area under curve (AUC) values across training and validation cohorts (GSE54618). Models demonstrating AUC >0.9 were prioritized as high-diagnostic-value candidates. Final feature gene selection was guided by consensus across top-performing models, validated through calibration curves and confusion matrices to ensure robustness.
2.7 Interpretability analysis of optimal predictive model
Model interpretability was assessed using SHAP (29) to delineate the contribution of key feature genes to PE risk prediction. SHAP values were computed via the R package kernelshap (v0.7.0), with positive/negative values indicating directional effects on risk (increase/decrease). Global feature importance rankings were derived from mean absolute SHAP values using shapviz (v0.9.5), visualized through bar plots (overall importance) and beeswarm plots (feature value-SHAP value distributions). SHAP interaction values quantified pairwise feature interdependencies, visualized via scatterplots, while waterfall plots generated for representative cases provided localized interpretability of model decisions. This comprehensive SHAP-based interpretability framework quantifies the importance of key feature genes in predictive model decisions in PE.
2.8 ROC curve analysis and protein-protein interaction network analysis of key genes
Key genes were assessed for differential expression between PE and control groups using Mann-Whitney U tests, with results visualized through violin plots. Diagnostic performance was evaluated via ROC curve analysis using the R package pROC (v1.18.5) (30), calculating AUC values to quantify predictive capacity. PPI networks were reconstructed via the GeneMANIA database (31), integrating key genes with functionally associated partners to infer biological modules relevant to PE pathogenesis.
2.9 Regulatory network reconstruction
Transcriptional and post-transcriptional regulatory networks were systematically reconstructed to elucidate molecular interactions involving key genes. Transcription factor (TF)-gene interactions were identified using the ChIPBase database (32), retaining TF-gene pairs with combined upstream/downstream supporting samples ≥8. RNA binding protein (RBP) and microRNA (miRNA) interactors were predicted via the ENCORI database (33), applying evidence-based thresholds of clipExpNum ≥10 for RBPs and ≥7 for miRNAs. All interaction networks (TF-gene, RBP-gene, miRNA-gene) were integrated and visualized using Cytoscape (v3.10.2).
2.10 Immune microenvironment characterization
Placental immune cell infiltration profiles were quantified via single-sample gene set enrichment analysis (ssGSEA) using the R package GSVA (v1.52.3), with 28 immune cell-specific gene sets derived from established markers (34). Enrichment scores representing relative immune cell abundance were compared between PE and control groups, identifying differentially infiltrated cell types. Spearman correlation matrices generated via the R package linkET (v0.0.7.4) revealed intercellular immune interactions and key gene-immune cell associations (|r| >0.3), visualized through network diagrams. Significant correlations (|r| >0.3) were further validated using scatterplots to delineate linear relationships.
2.11 Clinical sample collection and processing
Placental tissue samples were collected from 20 singleton pregnancies (10 PE cases, 10 gestational age-matched controls, each group included five term pregnancy and five preterm pregnancies) undergoing cesarean delivery at the Third Affiliated Hospital of Wenzhou Medical University. PE diagnosis followed ISSHP criteria: sustained hypertension (≥140/90 mmHg) with proteinuria (≥0.3 g/24h) emerging after 20 gestational weeks. Inclusion criteria required maternal age 20–40 years, uncomplicated antenatal course prior to PE onset, and absence of fetal anomalies. Exclusion criteria encompassed pre-existing comorbidities (chronic hypertension, diabetes), acute infections (including COVID-19), gestational diabetes, fetal congenital disorders, and exposure to confounding medications. Full-thickness placental biopsies were obtained from the central region within 15 minutes of delivery, snap-frozen in liquid nitrogen, and stored at −80°C. Ethical approval was granted by the Research Ethics Committee of Ruian People’s Hospital (Approval No. YJ2024178), with written informed consent obtained from all participants.
2.12 RNA isolation and quantitative real-time PCR validation
Total RNA was isolated from placental tissues using the Tissue Total RNA Isolation Kit V2 (Vazyme Biotech, RC112-01), with purity and concentration assessed via NanoDrop spectrophotometry (Thermo Fisher Scientific; A260/A280 ratios: 1.8–2.0). Reverse transcription was performed with 1 µg RNA using HiScript III All-in-One RT SuperMix (Vazyme Biotech, R333-01) under optimized conditions: 25°C for 5 min, 50°C for 15 min, and 85°C for 5 min. qRT-PCR assays were conducted on a CFX Connect system (Bio-Rad) with Taq Pro Universal SYBR Master Mix (Vazyme Biotech, Q712-02) in 10 µL reactions (40 cycles: 95°C/10 s denaturation, 60°C/30 s annealing/extension). Melt curve analysis confirmed amplification specificity, and relative gene expression was normalized to GAPDH using the 2−ΔΔCt method. All reactions included triplicate technical replicates, with fold-change calculations relative to control samples.
2.13 Statistical analysis
All analyses were conducted within the R statistical environment (v4.4.0). Normality assumptions were verified through Shapiro-Wilk testing, with parametric comparisons (Student’s t-test) applied to normally distributed continuous variables and non-parametric alternatives (Mann-Whitney U test) for skewed distributions. Spearman’s rank correlation coefficient (ρ) quantified associations between molecular features. Unless otherwise stated, all reported p-values were two-tailed, with statistical significance defined as p < 0.05. Multiple testing correction was implemented via the Benjamini-Hochberg method for high-throughput datasets to control false discovery rate (FDR < 0.05).
3 Results
3.1 Analytical flow diagram
Figure 1 displays the technical approach of the study, providing a concise overview of the analytical processes used in this study. The analytical flow commenced with merging transcriptomic datasets GSE75010 and GSE10588, followed by identification of DEGs. RiboRGs were intersected with DEGs to derive RiboRDEGs. Subsequent multi-modal enrichment analyses included GSEA, GO, KEGG pathway mapping, and Bayesian network inference to elucidate functional associations. WGCNA identified PE-correlated modules and key genes, while machine learning algorithms refined core diagnostic biomarkers. Model interpretability was enhanced through SHAP, with ROC curve analysis validating diagnostic efficacy using external dataset GSE10588. Immune infiltration profiling via ssGSEA revealed microenvironmental interactions of key genes. Regulatory networks encompassing mRNA-TF, mRNA-miRNA, and mRNA-RBP interactions were reconstructed to delineate molecular mechanisms. Final clinical validation confirmed differential expression patterns of candidate genes in PE cohorts.
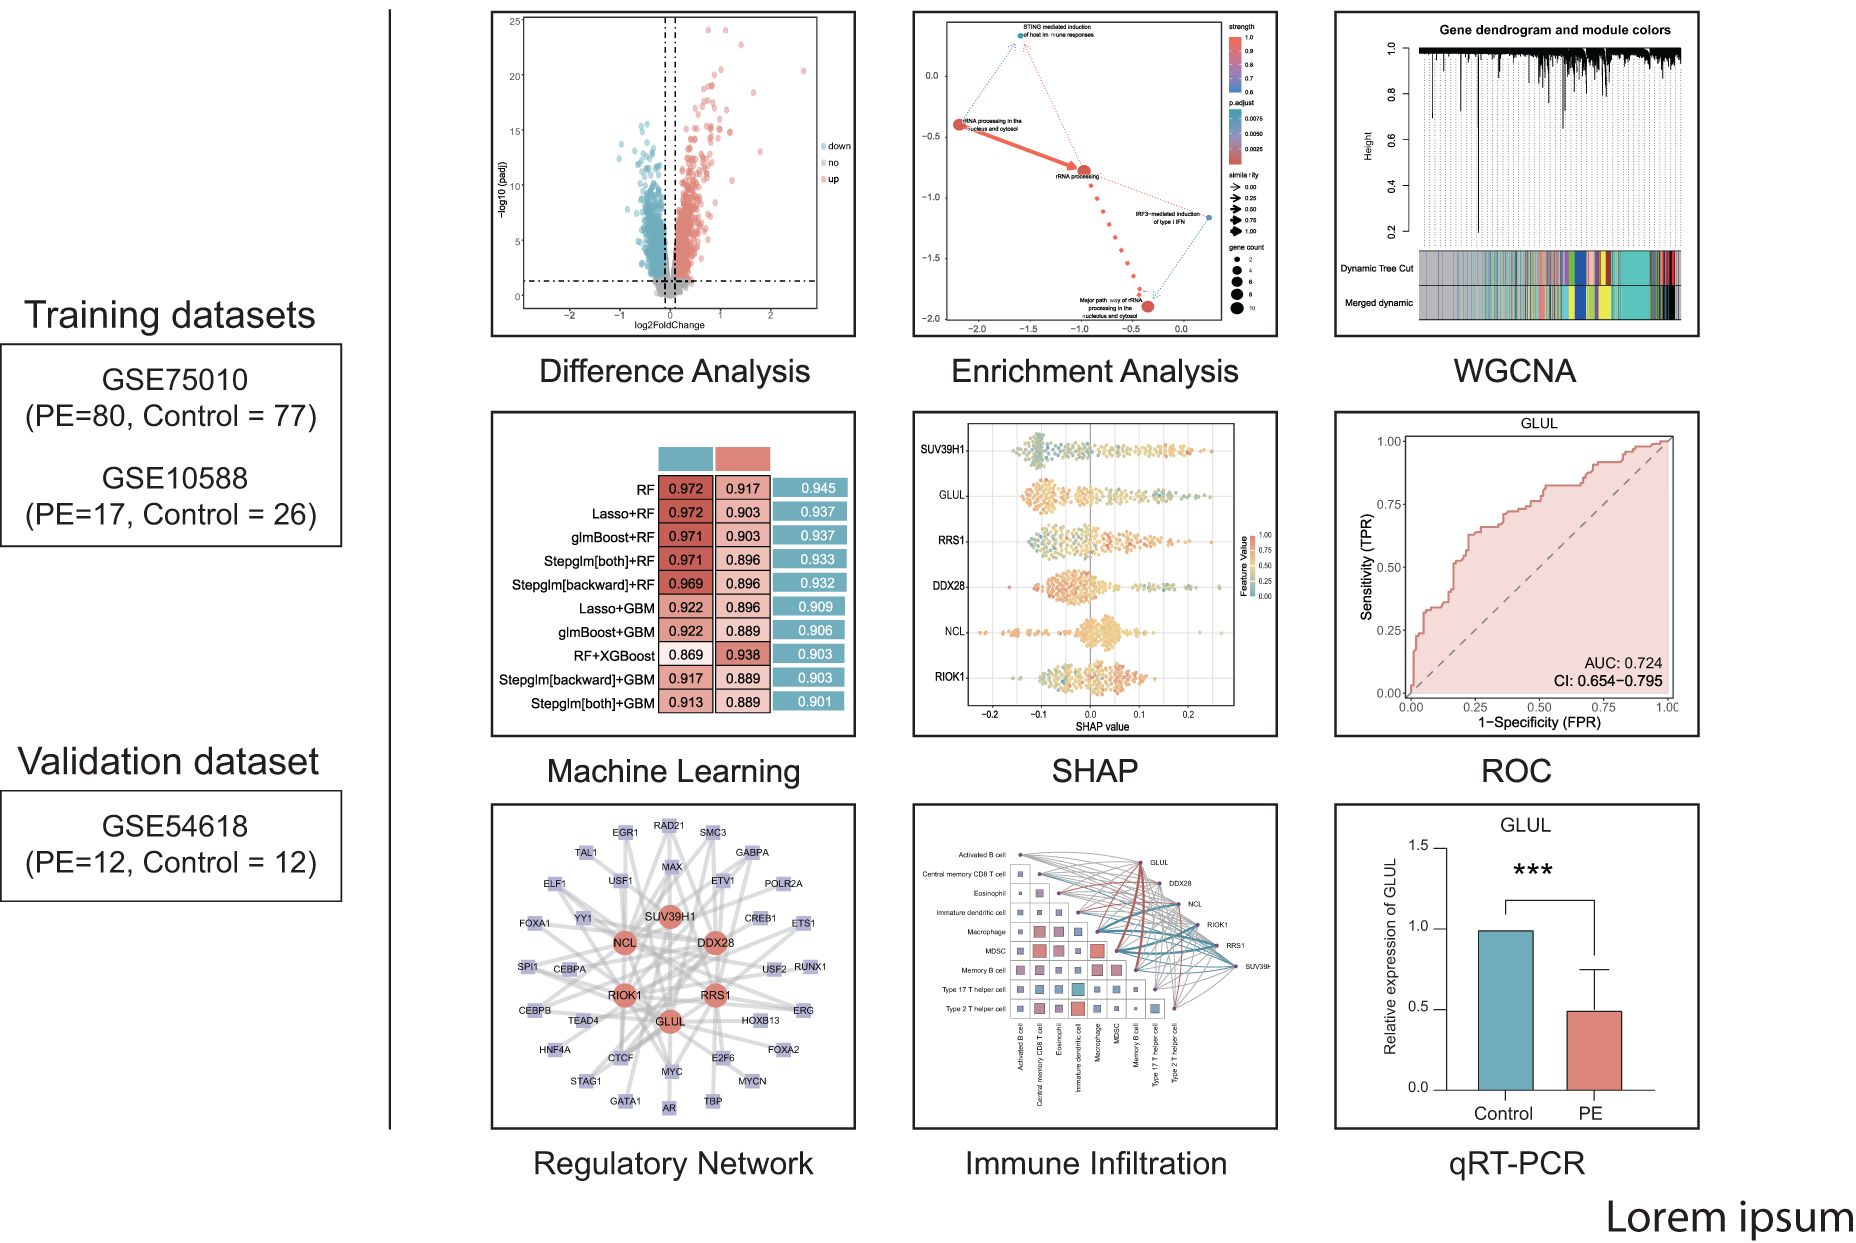
Figure 1. Technology roadmap.
3.2 Identification of ribosome biogenesis-related differentially expressed genes
The GSE75010 and GSE10588 datasets were merged into a combined cohort (n=200) and subjected to batch effect correction using the R package sva, followed by normalization via the R package limma. Pre-correction boxplots (Supplementary Figure S1A) revealed pronounced inter-batch variability in expression distributions, which resolved post-correction (Supplementary Figure S1B). PCA demonstrated distinct separation between original datasets along PC1 and PC2 prior to adjustment (Supplementary Figure S1C), whereas post-correction PCA (Supplementary Figure S1D) showed overlapping clusters with reduced variance contributions (PC1: 2.97%, PC2: 2.19%), confirming effective batch effect mitigation. Based on this combined cohort, we conducted differential expression analysis using the R package limma and identified 2,783 DEGs (|log2FC| > 0.1, P.adj < 0.05) between PE and control groups, comprising 1,304 upregulated and 1,479 downregulated genes (Figure 2A). Intersection of these DEGs with the precompiled ribosome biogenesis-related gene set (344 RiboRGs) yielded 25 RiboRDEGs, including C1QBP, DDX28, DDX51, DHX30, EXOSC2, GLUL, LSM6, MPHOSPH6, MRPL36, NCL, NOL6, PAK1IP1, POLR1B, PRKDC, RAN, RIOK1, RNASEL, RPP25, RPS27L, RRS1, SUV39H1, TBL3, TFB1M, WDR12 and XRCC5 (Figure 2B). The heatmap reveals the stratified clustering and expression disparity of 25 RiboRDEGs between the PE group and the control group (Figure 2C), which is corroborated by 3D PCA demonstrating significant intergroup separation (Figure 2D).
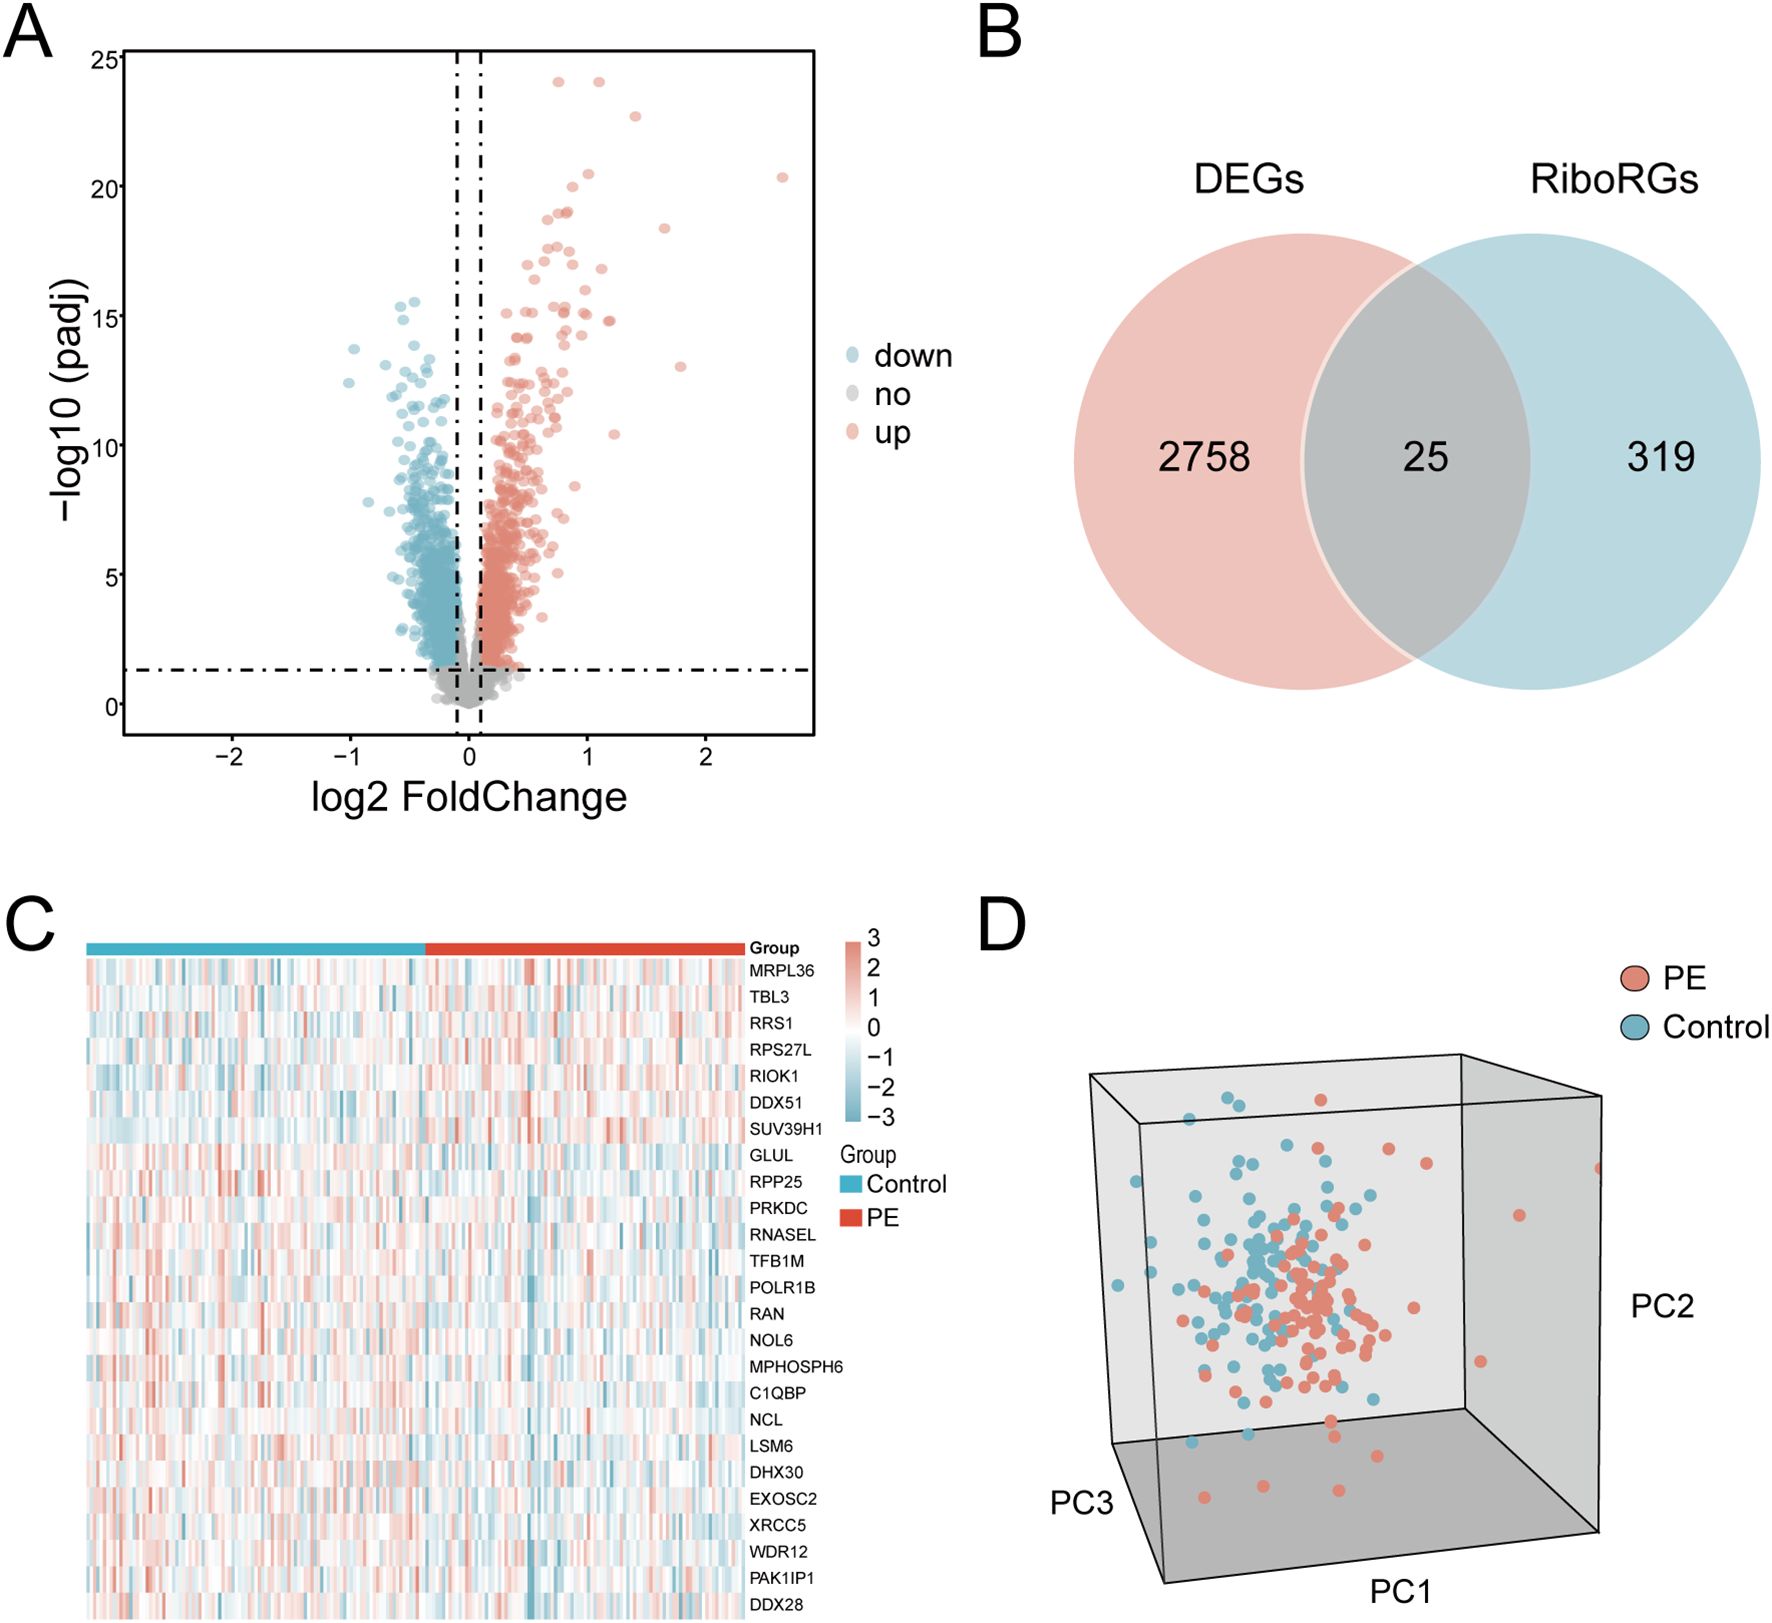
Figure 2. Identification of RiboRDEGs. (A) Volcano plot of DEGs (|log2FC| > 0.1, P.adj < 0.05), red indicates upregulated genes and blue indicates downregulated genes (B) Venn diagram intersecting DEGs and RiboRGs,red indicates DEGs and blue indicates RiboRGs. (C) Heatmap of RiboRDEG expression across samples, red indicates high expression and blue indicates low expression. (D) 3D PCA plot demonstrating group segregation based on RiboRDEG profiles, red indicates PE samples, blue indicates normal samples.
3.3 Functional enrichment profiling
For exploring significantly dysregulated pathways in PE, we conducted GSEA analysis on the combined dataset. Results showed that top enriched terms in PE including HIF-1 signaling, AMPK signaling, and proteasome activity (Figure 3A). Subsequent GO and KEGG analyses of the 25 RiboRDEGs demonstrated their predominant involvement in rRNA metabolic processes (BP: ncRNA processing, ribosome biogenesis), nucleolar complexes (CC: 90S preribosome, small-subunit processome), and RNA helicase activities (MF: U3 snoRNA binding) (Figure 3B). KEGG pathway enrichment further implicated these genes in ribosome biogenesis and RNA degradation. Bayesian network analysis identified rRNA processing as a central hub (Figures 3C, D), exhibiting robust connectivity with immune response pathways (STING-mediated host immunity, IRF3-dependent IFN induction) and subcellular rRNA maturation processes.
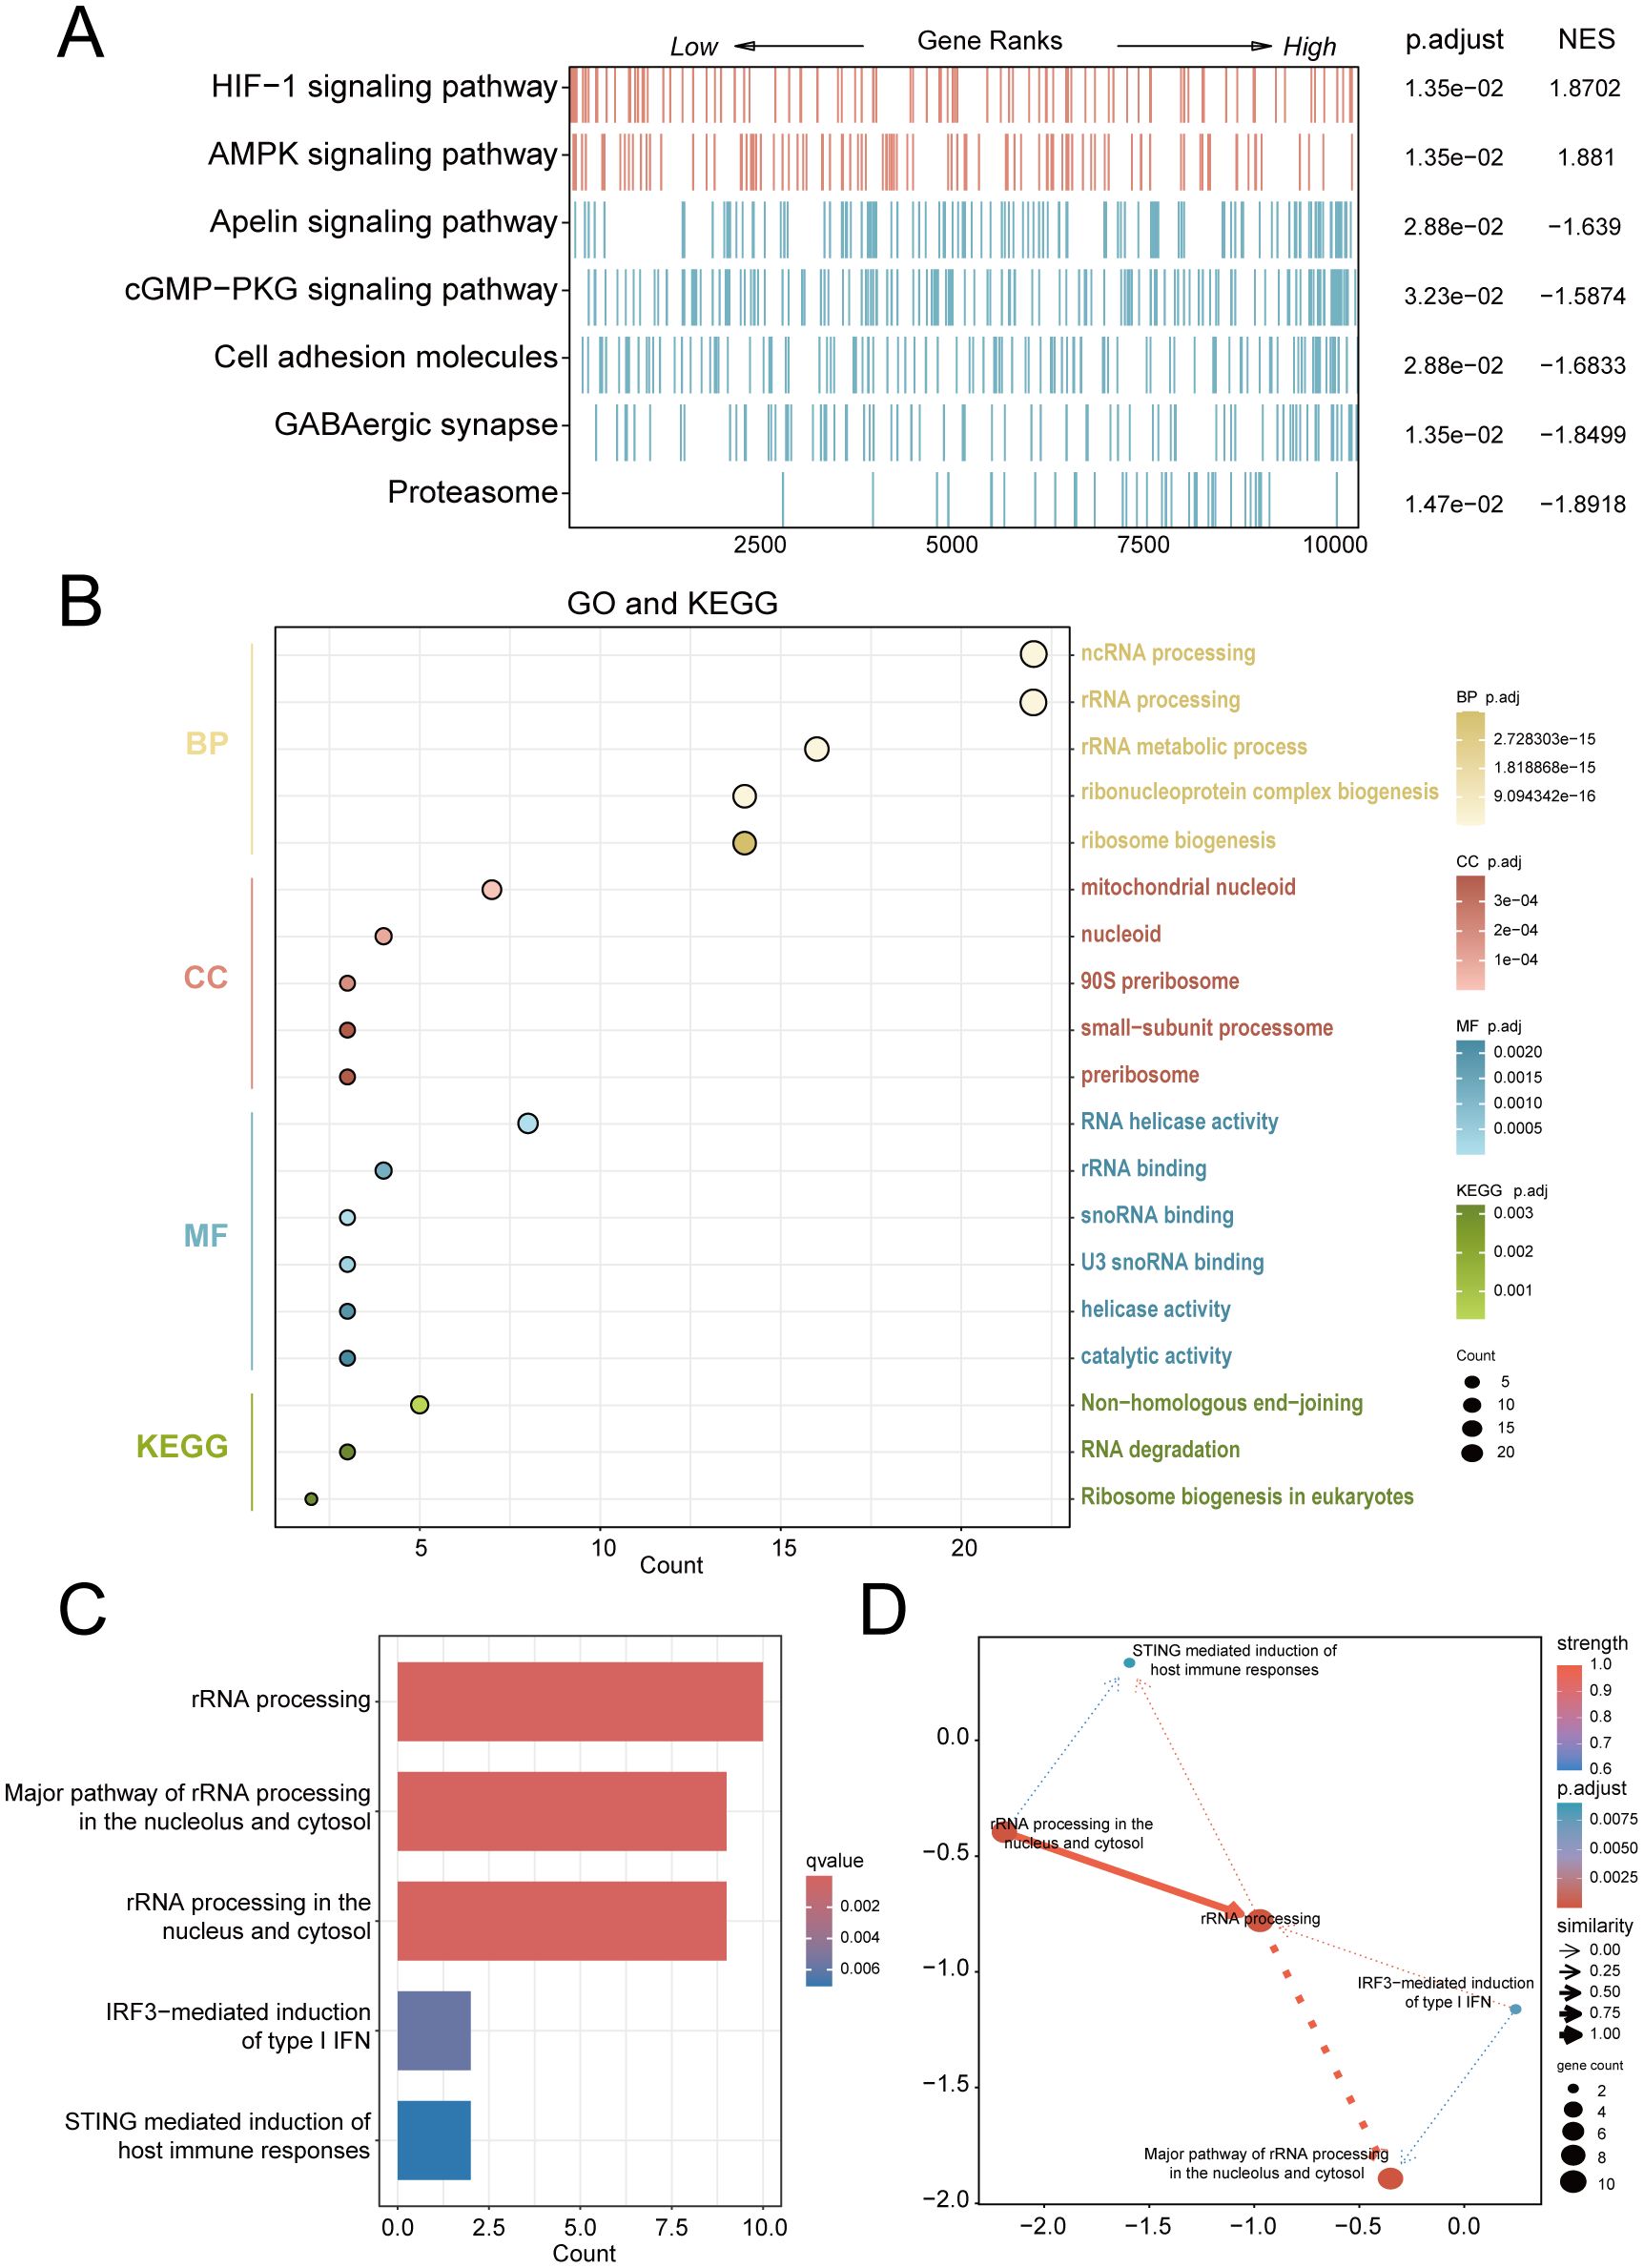
Figure 3. Multi-modal enrichment analysis of PE-associated molecular pathways. (A) GSEA heatmap of combined dataset pathways (red: leading-edge enrichment; blue: trailing-edge enrichment). (B) Bubble plot of RiboRDEG-enriched GO terms (BP, CC, MF) and KEGG pathways, with term counts on the x-axis. (C) Bayesian pathway enrichment bar plot. (D) Bayesian network illustrating pathway interactions, with node size reflecting functional centrality and edge properties indicating interaction strength (thickness) and directionality (arrows). Solid/dashed lines distinguish established vs. hypothesized regulatory relationships.
3.4 Weighted gene co-expression network analysis and hub gene prioritization
A scale-free co-expression network was constructed using WGCNA (power = 10, scale-free fit R² = 0.9; Figure 4A). Dynamic module detection identified 9 gene clusters (Figures 4B, C), with low inter-module correlations confirmed by a heatmap analysis (Figure 4D). The MEblue module exhibited the strongest positive correlation with PE (cor = 0.66, p = 3×10⁻²⁶; Figure 4E). Intersection of MEblue module genes (n=955) with RiboRDEGs revealed seven hub genes (GLUL, LSM6, DDX28, NCL, RIOK1, RRS1, SUV39H1; Figure 4F). Spearman correlation analysis demonstrated strong co-expression patterns among hub genes (Figure 4G), suggesting functional synergy in PE pathogenesis.
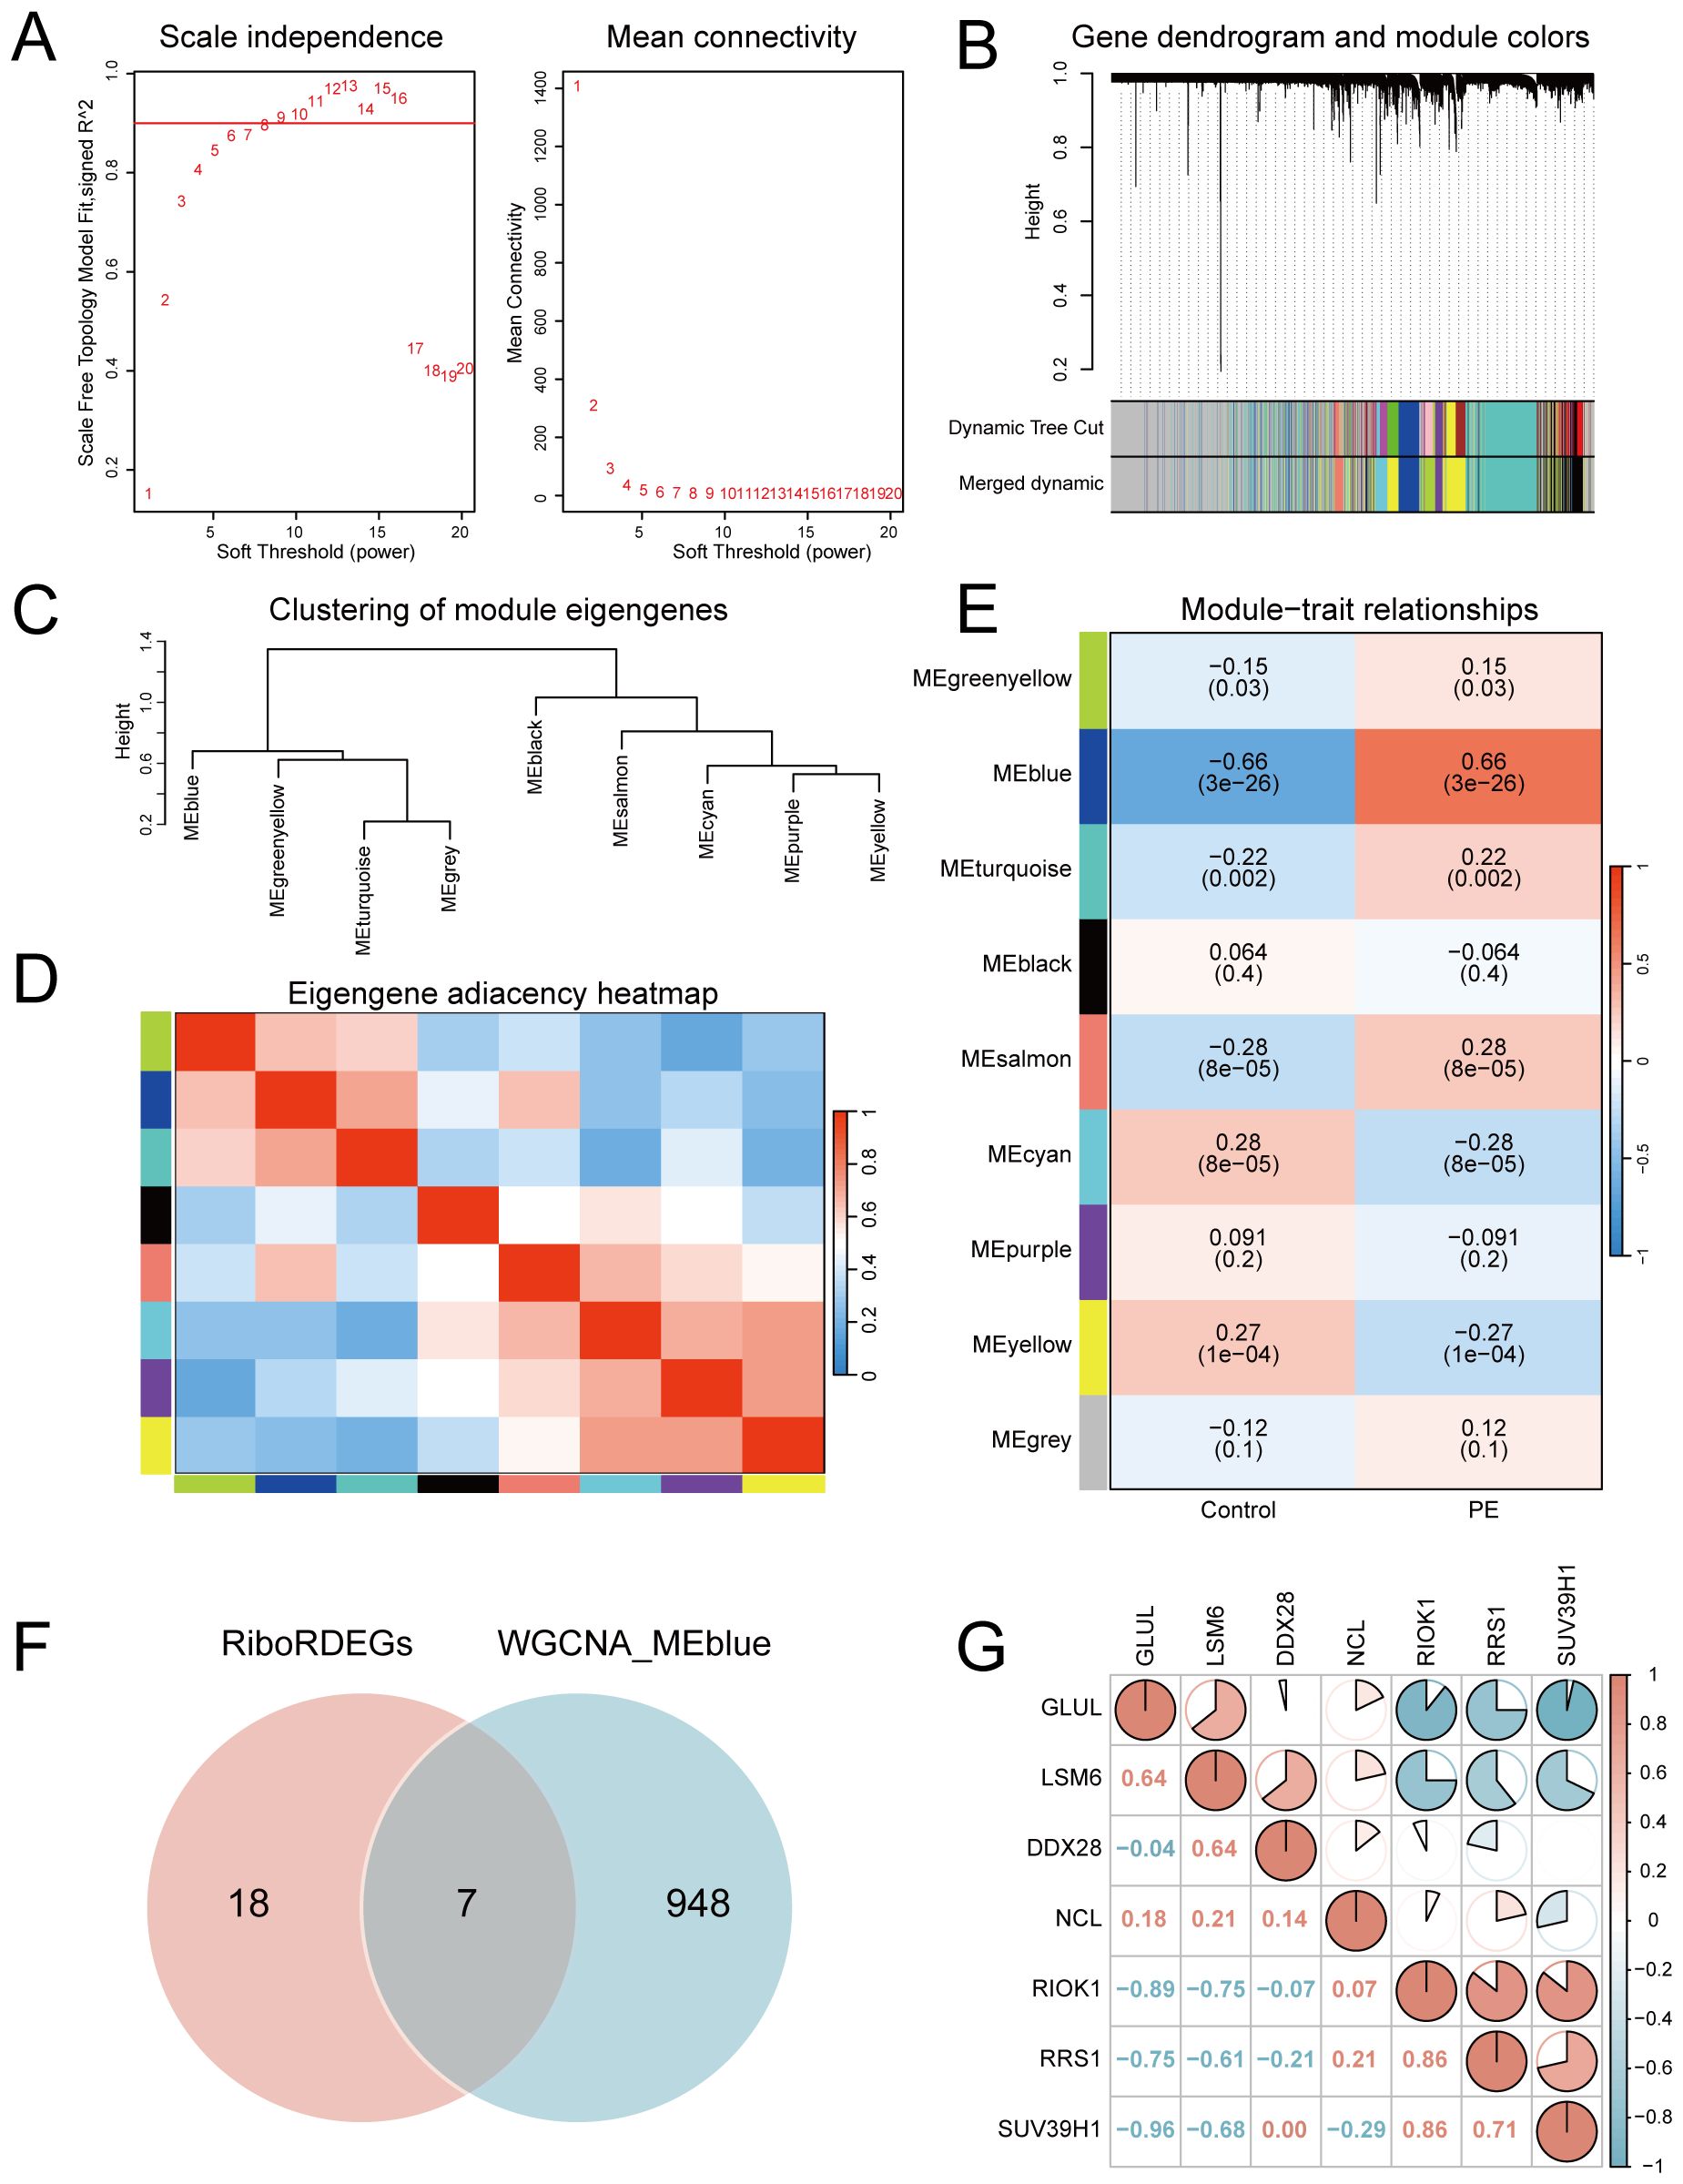
Figure 4. Co-expression network construction and hub gene identification. (A) Soft-threshold selection for scale-free topology (left: fit index; right: mean connectivity). (B) Hierarchical clustering dendrogram with merged modules. (C) Module eigengene clustering tree. (D) Inter-module correlation heatmap. (E) Module-trait correlation heatmap highlighting MEblue-PE association. (upper: correlation coefficients; lower: p-values) (F) Venn diagram intersecting MEblue genes and RiboRDEGs. (G) Correlation heatmap of seven hub genes. In the heatmap, red indicates a positive correlation and blue indicates a negative correlation. |r|>0.95: significant correlation; |r|≥0.8: highly correlated; 0.5≤|r|<0.8: moderately correlated; 0.3≤|r|<0.5: weakly correlated; |r|<0.3: not correlated.
3.5 Machine learning-based predictive model construction and validation
A multi-algorithm framework comprising 113 model combinations was implemented to identify optimal predictors of PE risk using seven hub genes (Figure 5A). Random Forest (RF) demonstrated superior diagnostic performance, achieving AUCs of 0.972 (95% CI: 0.953–0.988) in the training cohort and 0.917 (95% CI: 0.757–1.000) in the validation cohort (Figure 5B). The final RF model incorporated six feature genes (GLUL, DDX28, NCL, RIOK1, SUV39H1, RRS1; Table 2). DCA shows that this model can provide substantial clinical net benefits for clinical decision making (Figure 5C), while calibration curves showed strong concordance between predicted and observed PE probabilities (Figure 5D). Confusion matrices further validated the model’s diagnostic accuracy, achieving sensitivity >90% and specificity >85% in both training and validation cohorts (Figure 5E).
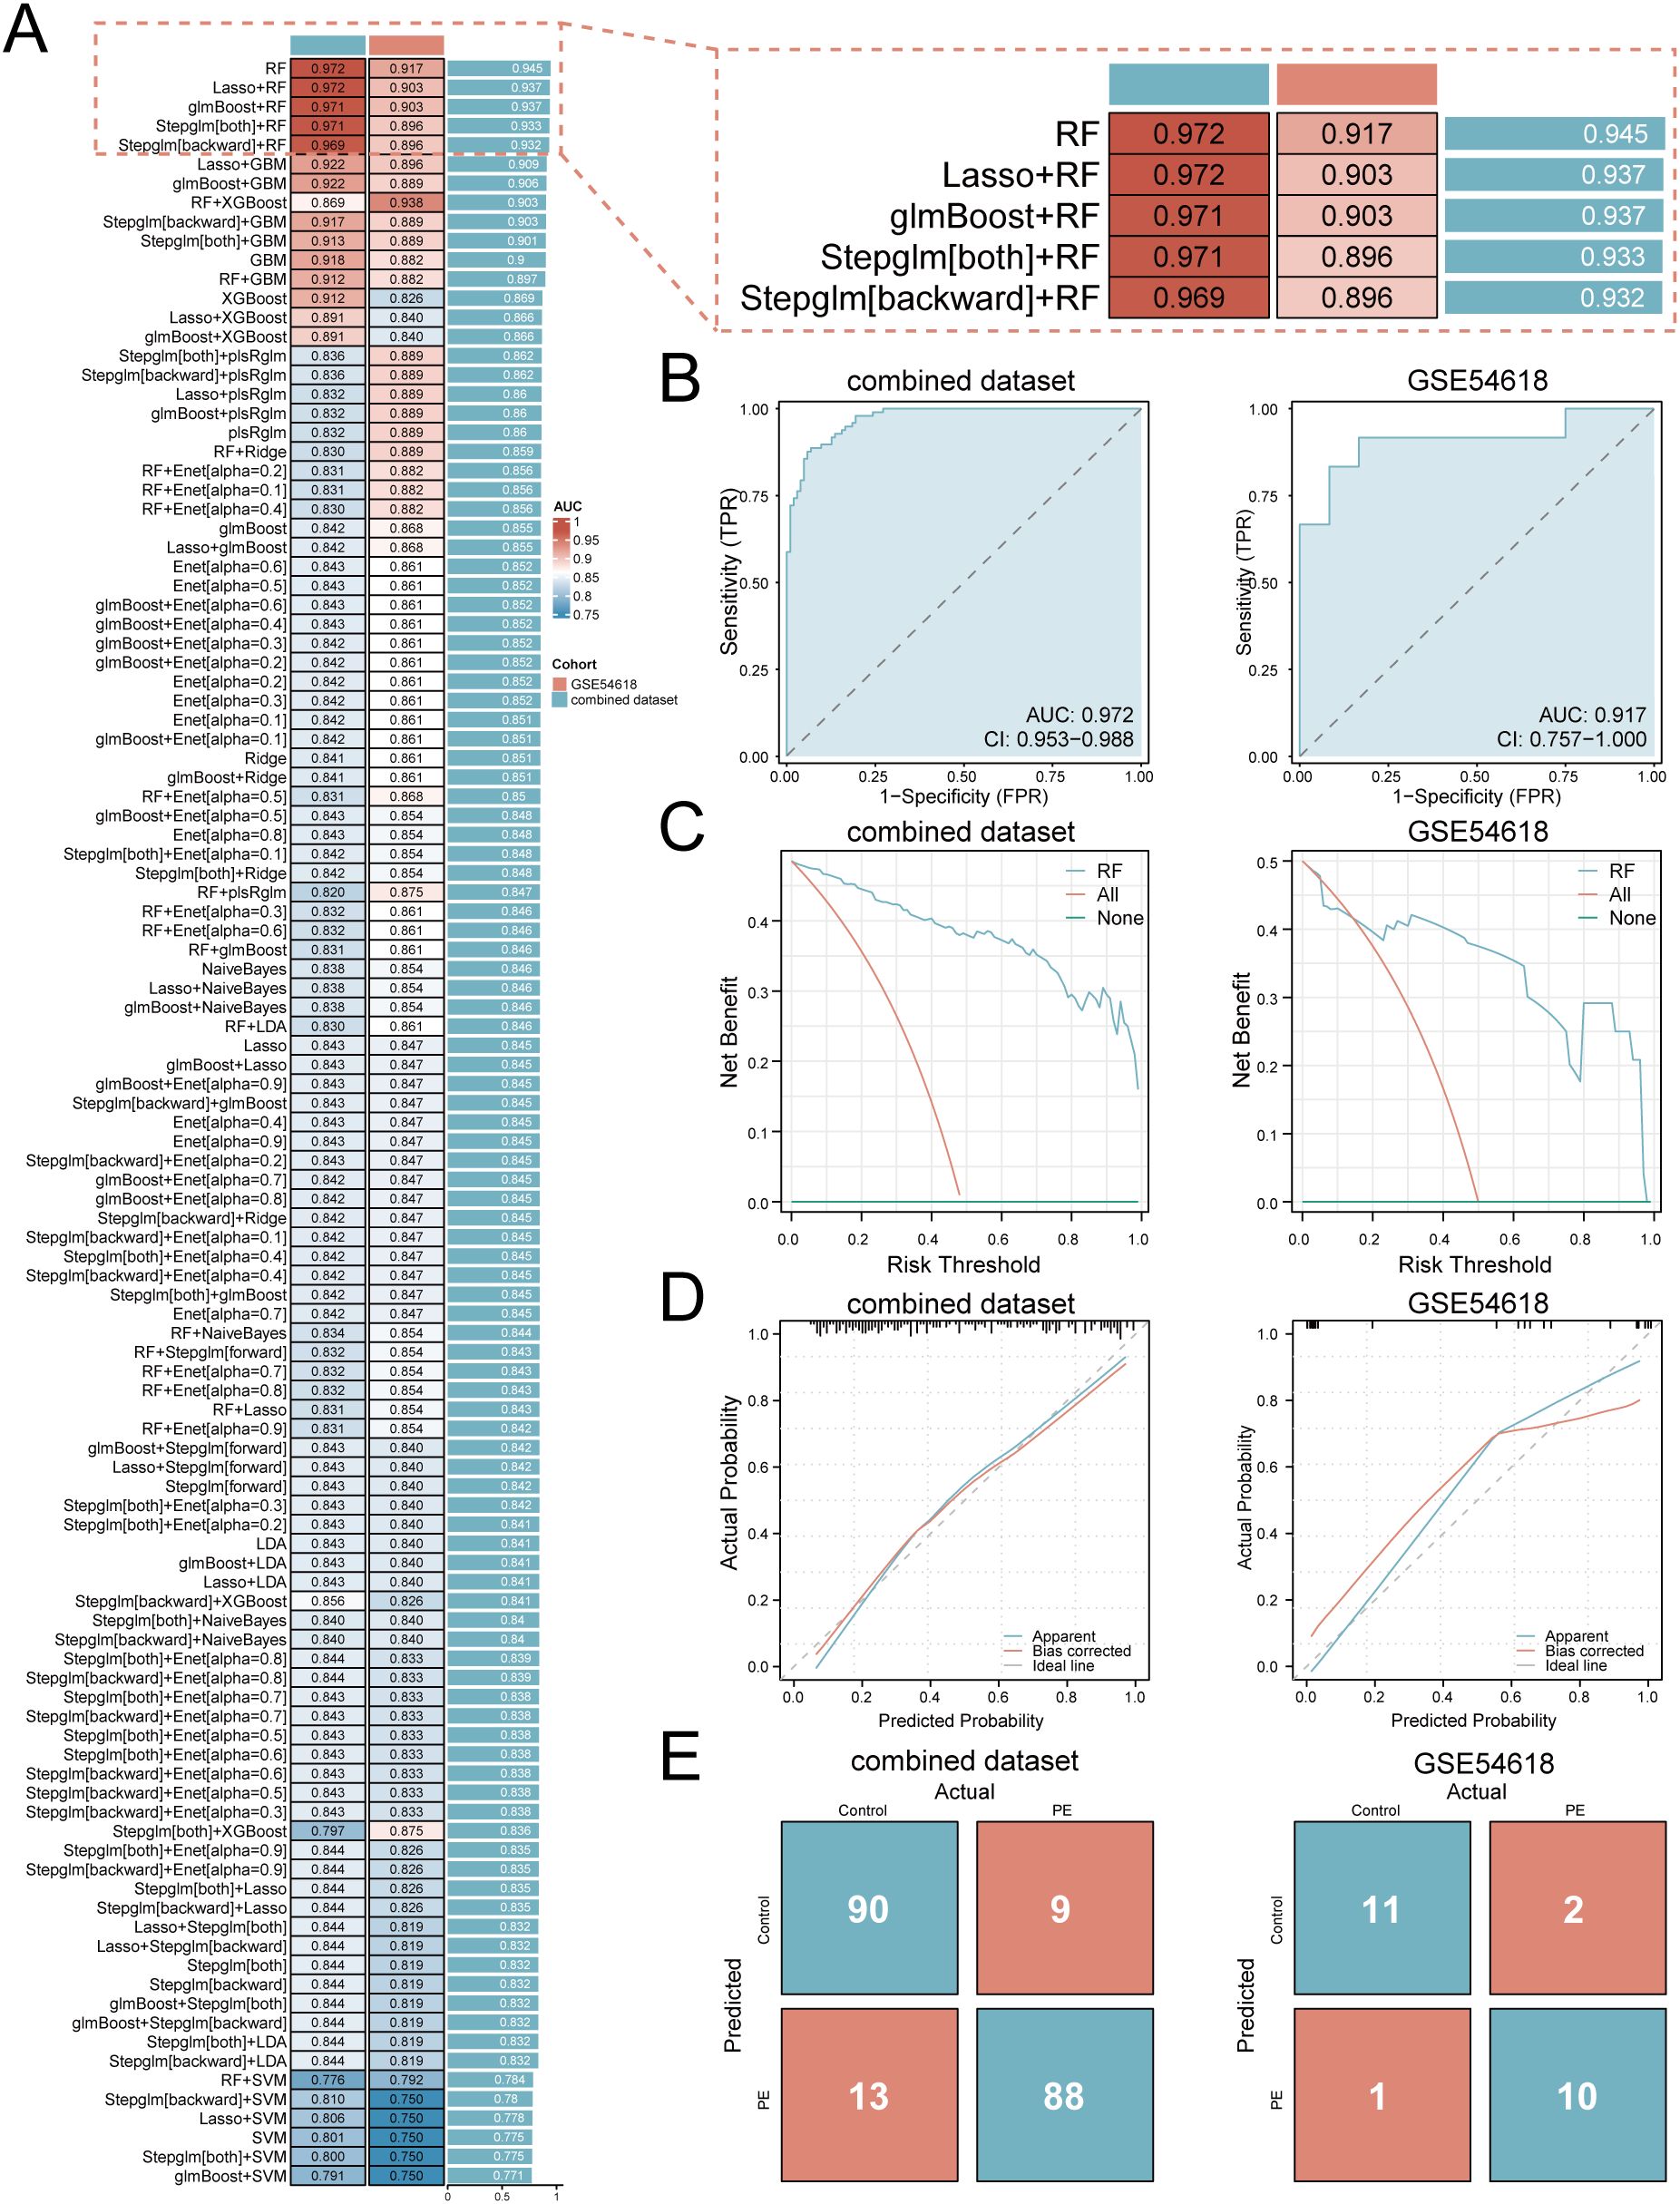
Figure 5. Development and validation of the machine learning-based predictive model. (A) Bar plot comparing mean AUCs of 113 algorithm combinations across training and validation cohorts. (B) ROC curves of the RF model (TPR, true positive rate; FPR, false positive rate; AUC>0.9 indicates high diagnostic value). (C) Decision curve analysis evaluating clinical utility. (D) Calibration curves assessing prediction accuracy. (E) Confusion matrices quantifying classification performance.
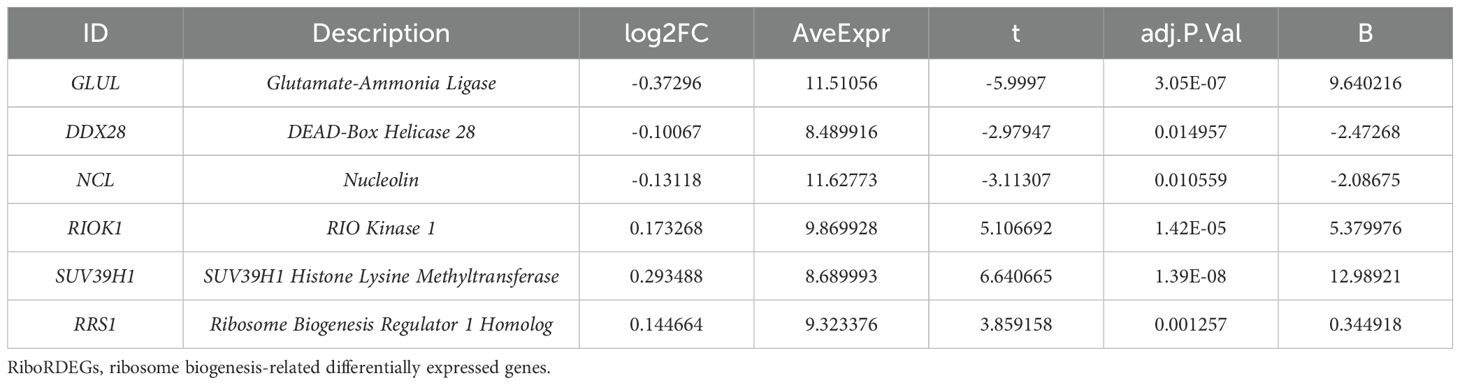
Table 2. Description of RiboRDEGs.
To elucidate the potential impact of the six feature genes on the risks associated with PE, we conducted SHAP analysis. This analysis revealed SUV39H1 as the most influential feature in the RF model (mean |SHAP| = 0.0944), followed by GLUL (|SHAP| = 0.0843), RRS1 (mean |SHAP| = 0.0649), DDX28 (mean |SHAP| = 0.0606), NCL (mean |SHAP| = 0.0534) and RIOK1 (mean |SHAP| = 0.0495) (Figure 6A). The expression levels of these genes have different directional effects on PE risk. Elevated SUV39H1, RRS1 and RIOK1 expression correlated with increased PE probability, whereas higher GLUL, DDX28 and NCL levels exhibited protective effects (Figure 6B). Interaction analysis identified synergistic risk amplification between SUV39H1 and RRS1 (Figure 6C), while GLUL-NCL co-expression showed concerted risk reduction (Figure 6D). A negative interaction between RRS1 and NCL (Figure 6E) suggested compensatory regulatory dynamics. Waterfall plots for representative PE (predicted probability = 0.864) and control (probability = 0.131) cases demonstrated model interpretability, with SUV39H1 contributing most substantially to risk prediction (Figures 6F, G).
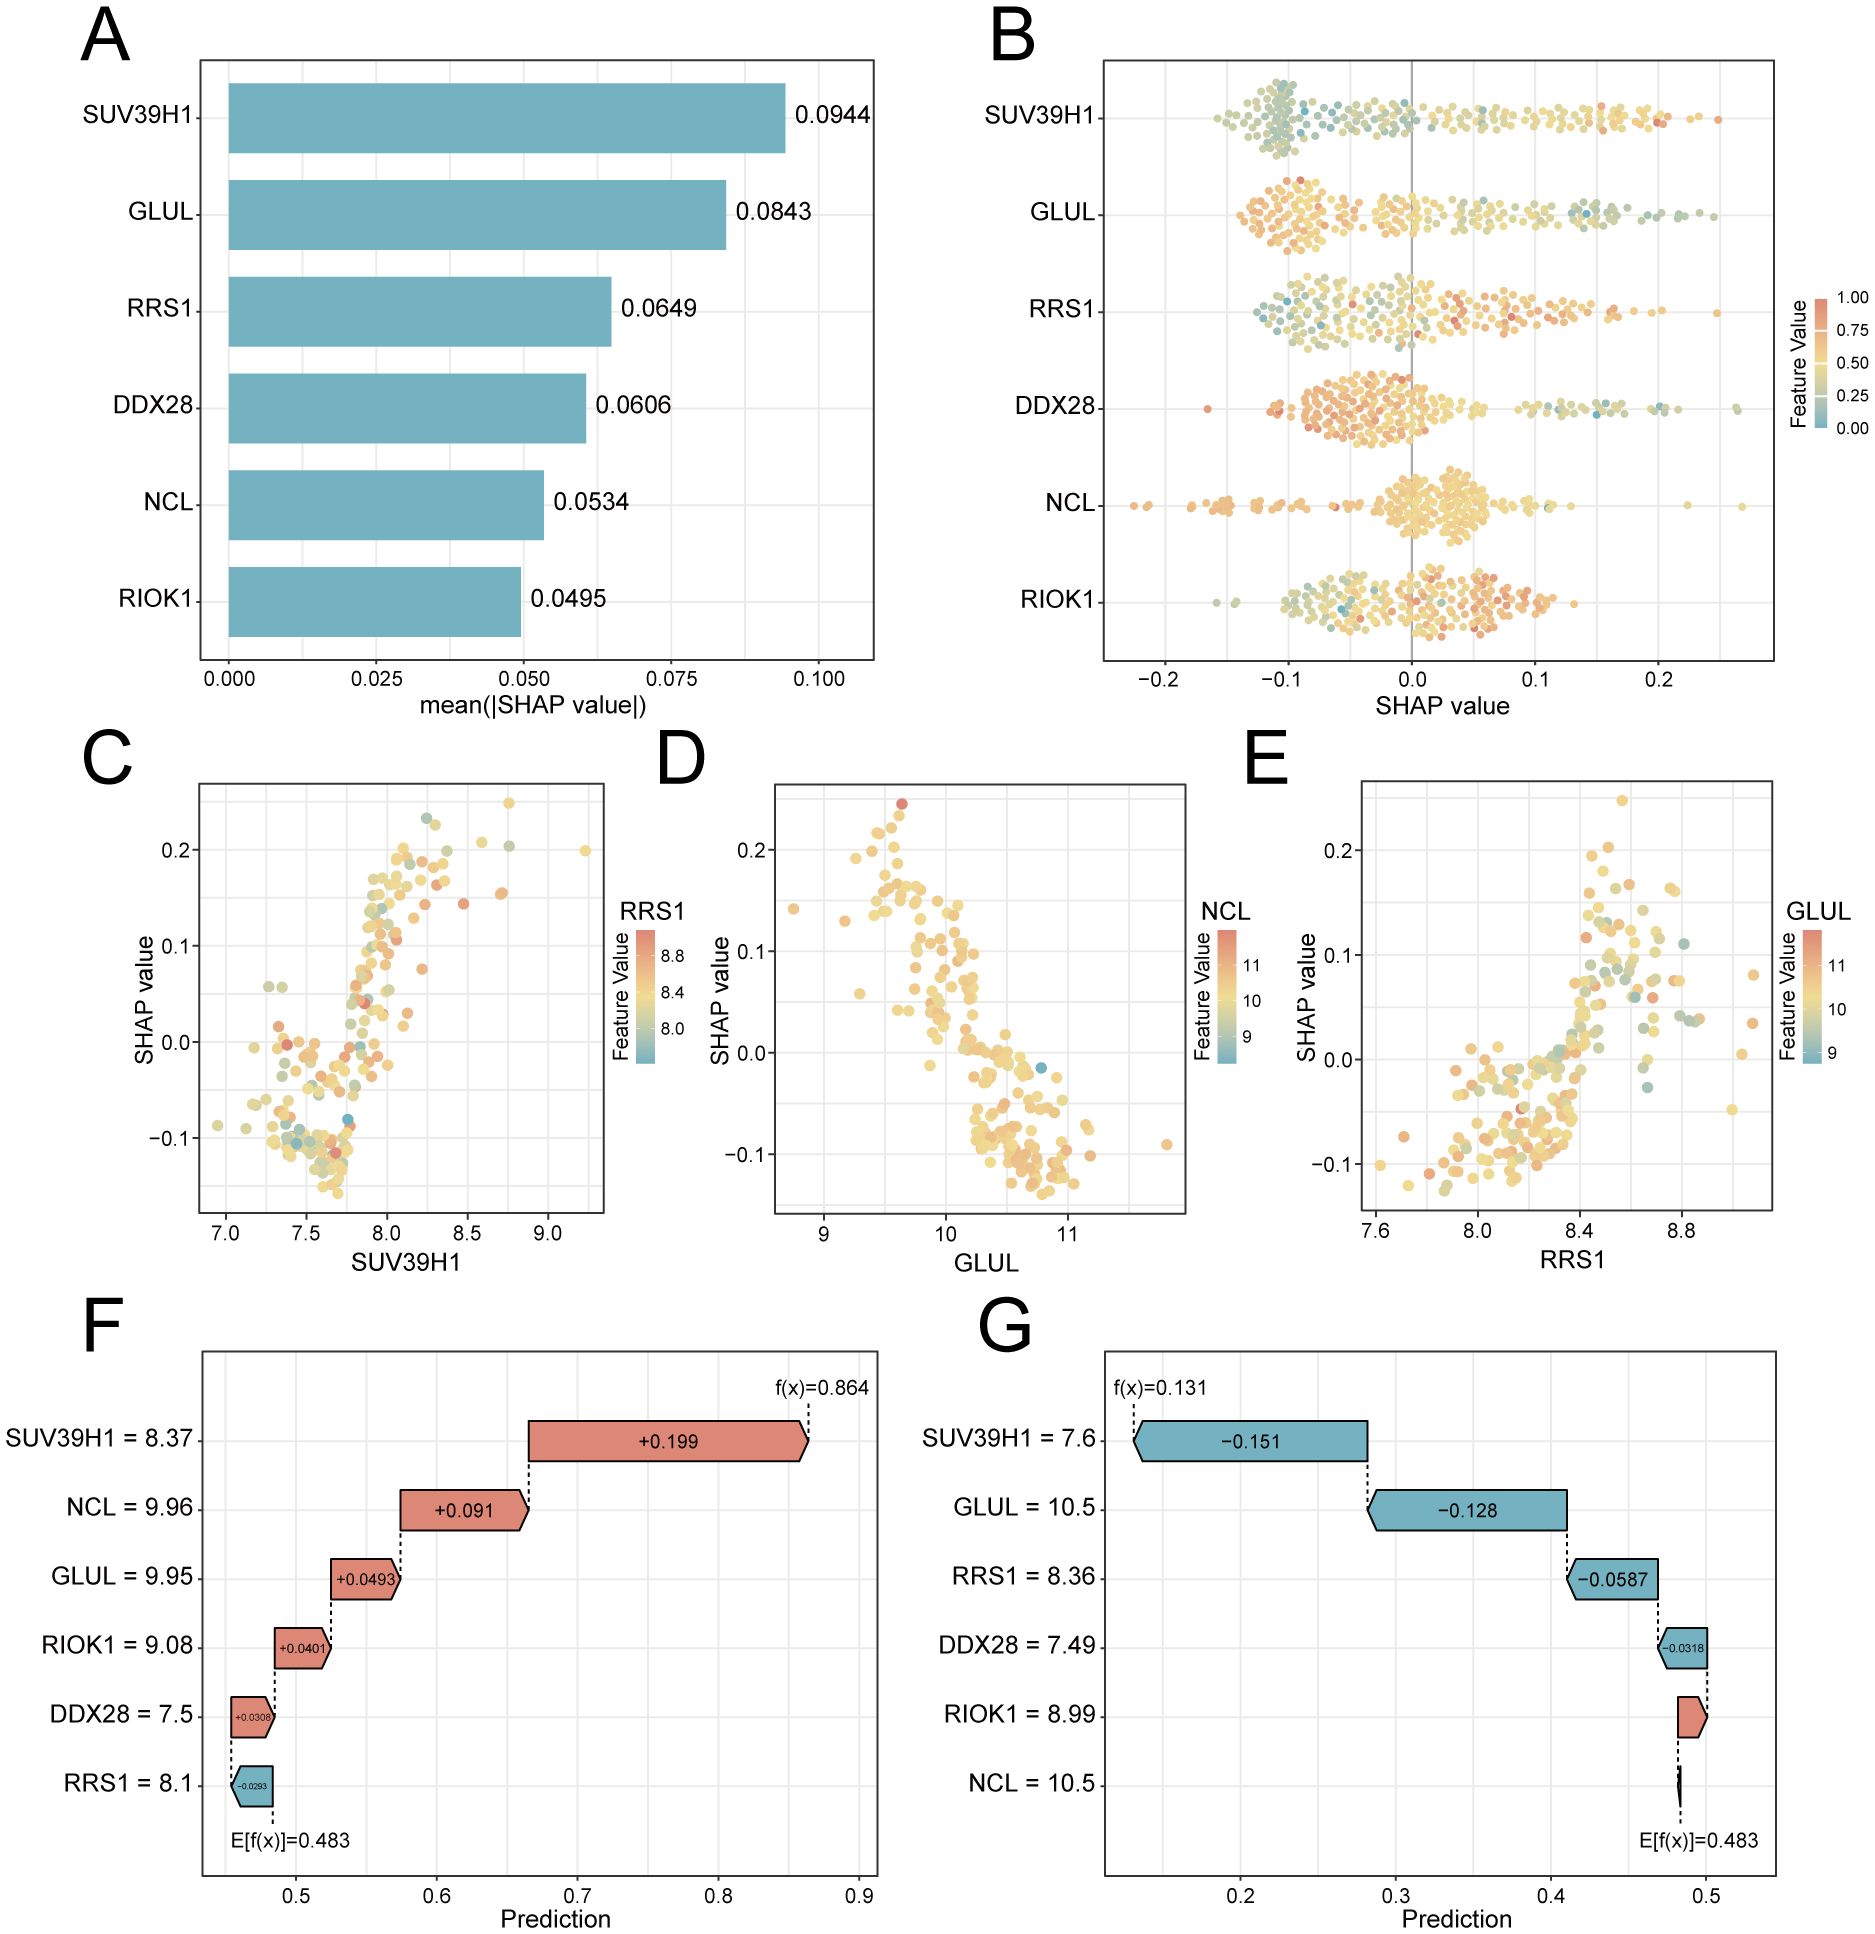
Figure 6. SHAP-based interpretation of key feature genes in the RF predictive model. (A) Feature importance bar plot ranked by mean absolute SHAP values. (B) Beeswarm plot showing SHAP value directionality (x-axis) versus gene expression (color scale: red = high, blue = low). (C–E). Interaction scatterplots: x-axis = gene expression, y-axis = SHAP value, color = interacting gene expression. (F) Waterfall plot for a PE case (predicted risk = 0.864). (G) Control case waterfall plot (risk = 0.131). Arrows indicate SHAP contributions (red: risk increase; blue: decrease).
3.6 ROC curve analysis and protein interaction network of key genes
Differential expression analysis confirmed significant downregulation of GLUL, DDX28, and NCL (p < 0.01; Figures 7A–C) alongside upregulation of RIOK1, SUV39H1, and RRS1 (p < 0.001; Figures 7D–F) in PE placentas. ROC analysis revealed moderate diagnostic utility for GLUL (AUC = 0.724), RIOK1 (AUC = 0.707), and SUV39H1 (AUC = 0.745) in the training cohort, with weaker performance for DDX28 (AUC = 0.613), NCL (AUC = 0.634), and RRS1 (AUC = 0.663) (Figures 7G–L). External validation in GSE54618 maintained moderate diagnostic accuracy for DDX28 (AUC = 0.847), RIOK1 (AUC = 0.771), SUV39H1 (AUC = 0.840), and RRS1 (AUC = 0.764), while GLUL (AUC = 0.604) and NCL (AUC = 0.688) showed limited discriminative power (Figures 7M–R). Protein-protein interaction (PPI) network analysis via GeneMANIA identified 20 functionally associated partners (Figure 7S), with co-expression (47.61%) and physical interactions (51.88%) as predominant interaction modes, suggesting that these key genes may collaboratively regulate ribosome biogenesis and RNA processing through transcriptional coordination and direct molecular binding, thereby contributing to placental dysfunction in PE pathogenesis.
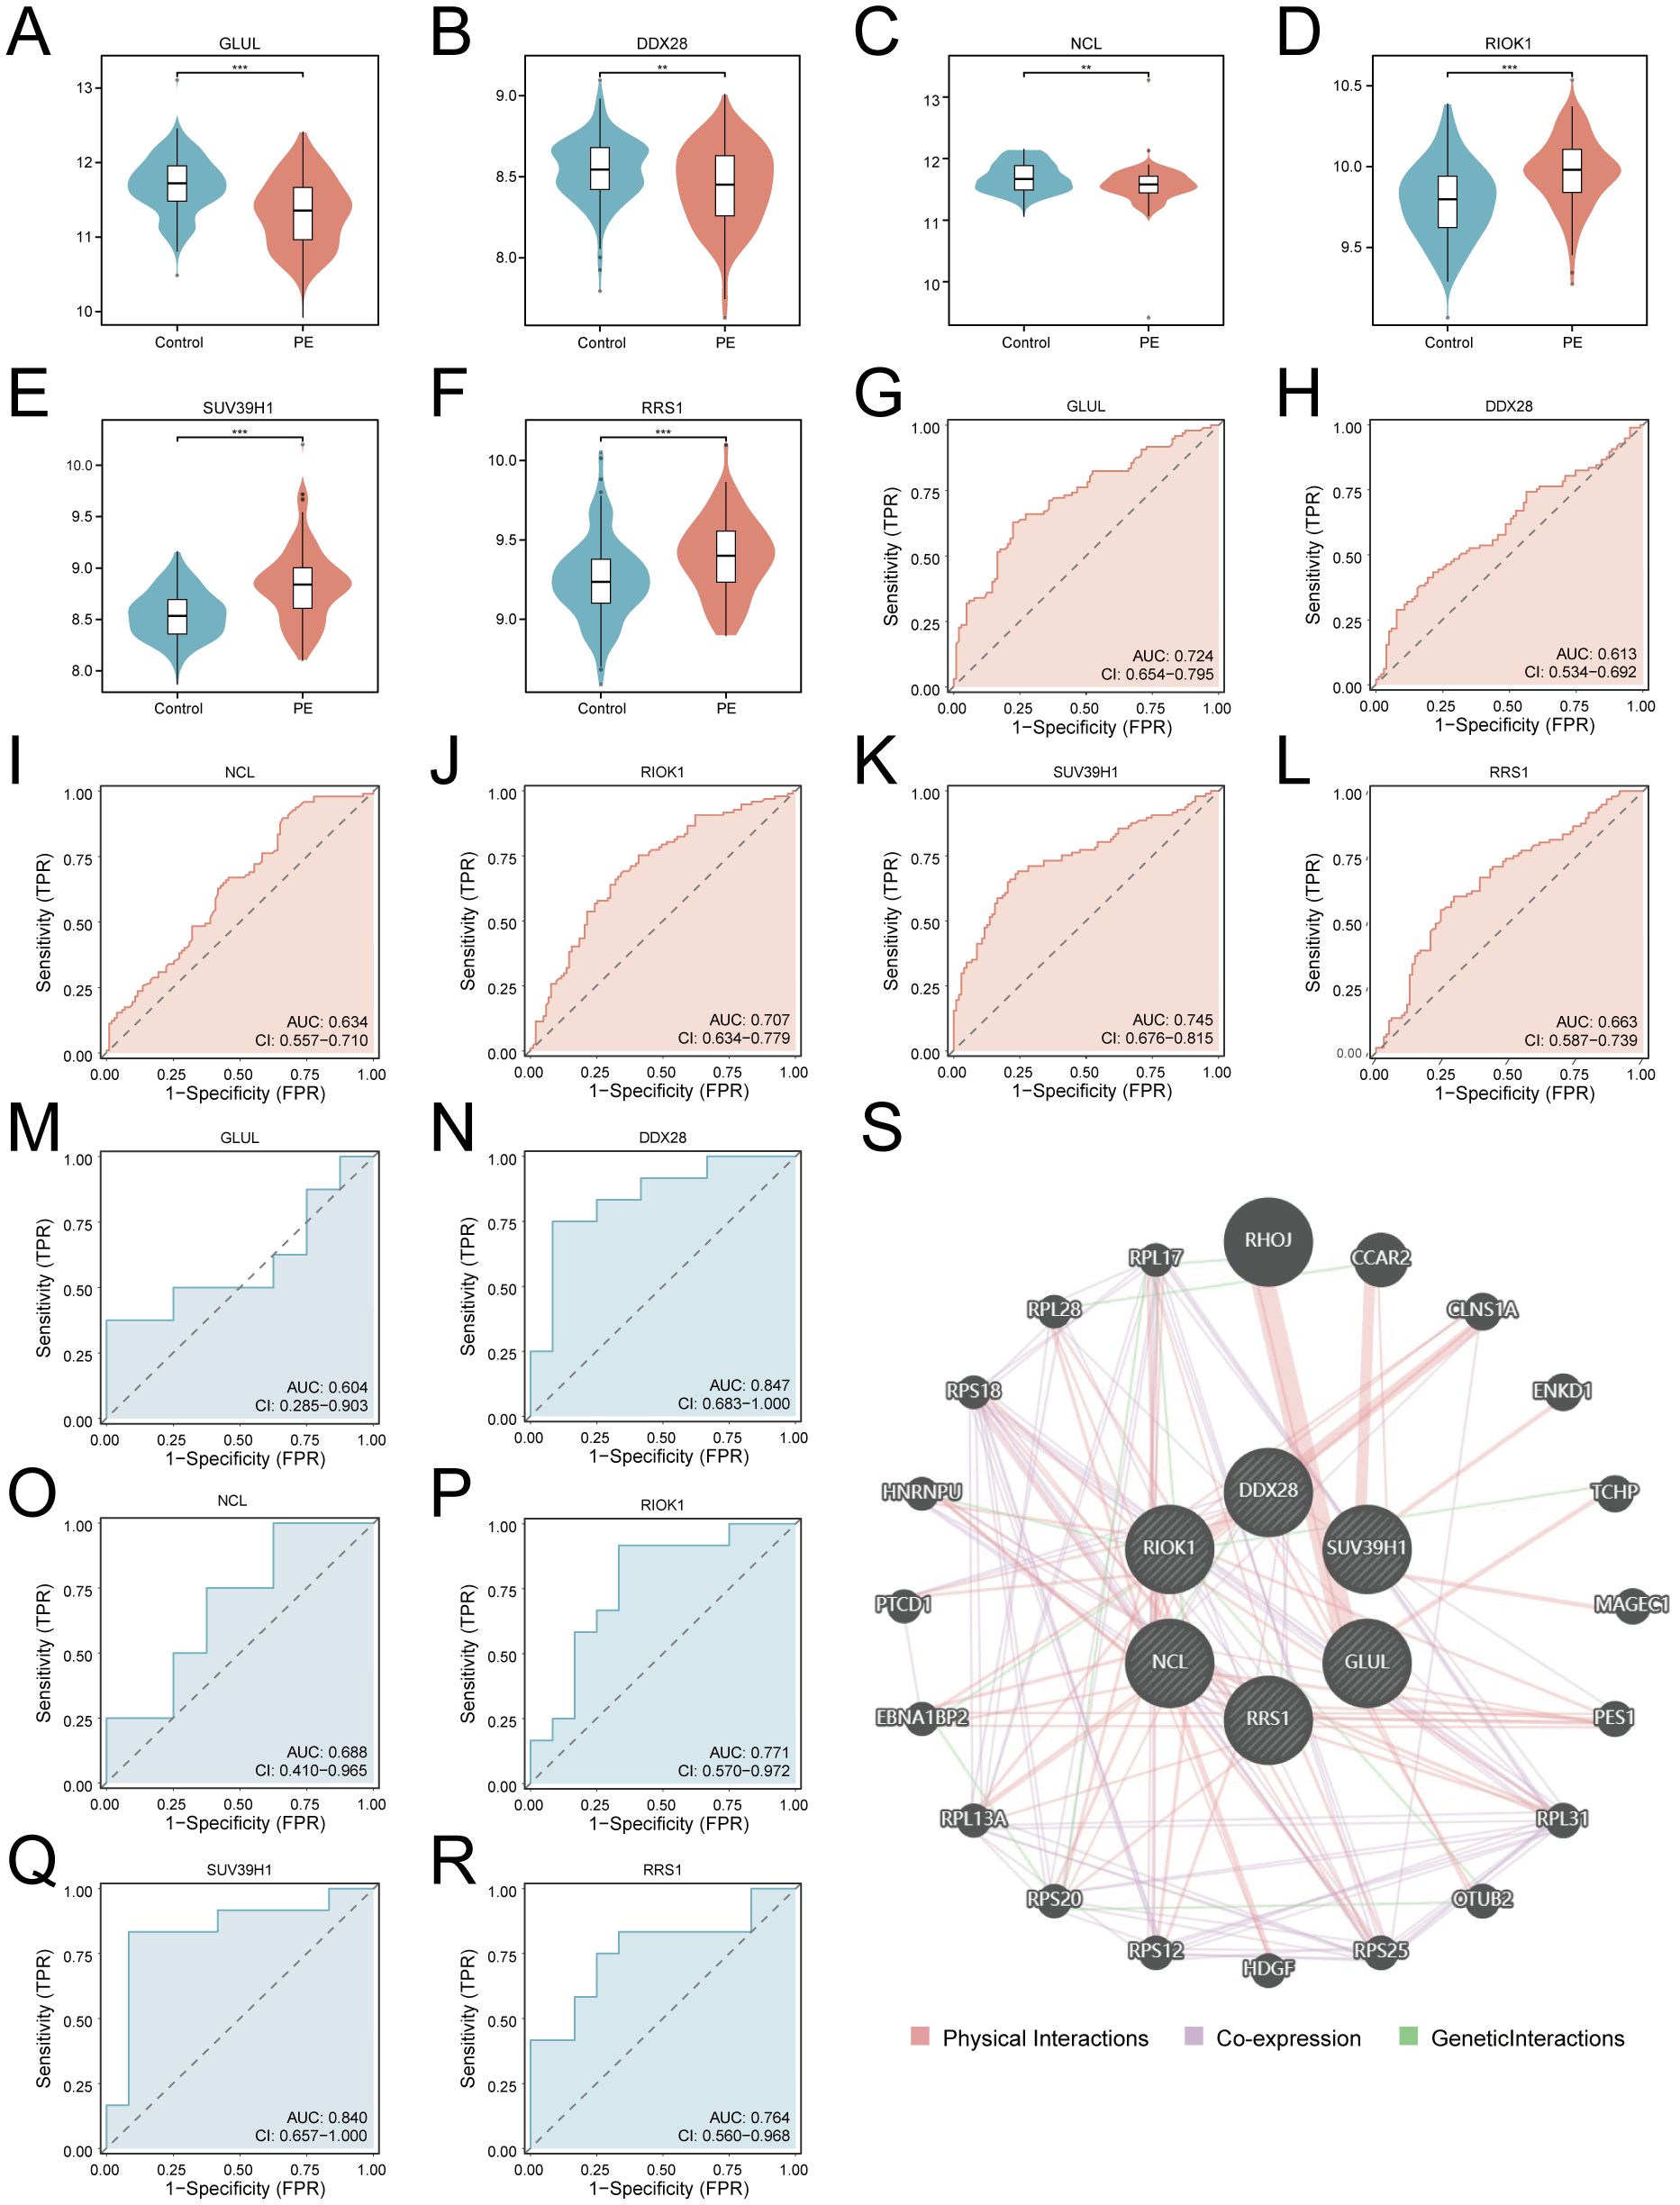
Figure 7. Diagnostic validation and functional interaction networks of key genes. (A–F). Violin plots of key gene expression in PE (red) vs. controls (blue): GLUL (A), DDX28 (B), NCL (C), RIOK1 (D), SUV39H1 (E), RRS1 (F). G-L. ROC curves for training cohort: GLUL (G), DDX28 (H), NCL (I), RIOK1 (J), SUV39H1 (K), RRS1 (L). (M–R). Validation cohort ROC curves: GLUL (M), DDX28 (N), NCL (O), RIOK1 (P), SUV39H1 (Q), RRS1 (R). An AUC of 0.5–0.7 indicates low diagnostic utility, while an AUC of 0.7–0.9 suggests moderate diagnostic value. (S) PPI network (nodes: key genes and functionally associated partners; edges: physical interactions (red), co-expression (purple), geneticlnteractions (green); thickness: interaction confidence). ***p < 0.001; **p < 0.01.
3.7 Reconstruction of regulatory networks
To explore the systematic regulatory network of ribosome biogenesis in preeclampsia, the reconstruction of regulatory networks was conducted. Transcriptional and post-transcriptional regulatory networks were systematically mapped to elucidate molecular interactions involving key genes. The TF network, constructed using ChIPBase with a stringent filtering criterion (combined upstream/downstream supporting samples ≥8), comprised 6 key genes (GLUL, DDX28, NCL, RIOK1, SUV39H1, RRS1) interacting with 32 TFs through 59 regulatory pairs (Supplementary Figure S2A, Supplementary Table S3). RBP interactions predicted via ENCORI (clipExpNum ≥10) revealed 45 functional associations between 6 key genes (GLUL, DDX28, NCL, RIOK1, SUV39H1, RRS1) and 24 RBPs (Supplementary Figure S2B, Supplementary Table S4). miRNA-mediated regulation analysis identified 63 mRNA-miRNA pairs involving GLUL, SUV39H1, and NCL with 62 miRNAs (clipExpNum ≥7; Supplementary Figure S2C, Supplementary Table S5), highlighting transcriptional and post-transcriptional modulation of ribosome biogenesis pathways in PE.
3.8 Immune microenvironment profiling via ssGSEA
To explore the role of Ribosome biogenesis in the immune microenvironment of PE, we conducted an ssGSEA analysis on the combined dataset. ssGSEA revealed significant dysregulation of nine immune cell types in PE placentas compared to controls (p < 0.05; Figure 8A). Activated B cells and Th17 cells were enriched in PE, while central memory CD8+ T cells, eosinophils, immature dendritic cells, macrophages, MDSCs, memory B cells, and Th2 cells exhibited reduced infiltration. Correlation network analysis demonstrated interconnected immune cell dynamics in PE, with key genes showing cell-type-specific associations (Figure 8B). Notably, GLUL expression positively correlated with MDSC (r = 0.352, p < 0.001; Figure 8C) and memory B cell abundance (r = 0.333, p < 0.001; Figure 8D). Conversely, RRS1 displayed negative correlations with macrophages (r = -0.372, p < 0.001; Figure 8E) and MDSCs (r = -0.337, p < 0.001; Figure 8F), while NCL and RIOK1 inversely associated with macrophage (r = -0.334, p < 0.001; Figure 8G) and MDSC infiltration (r = -0.301, p = 0.003; Figure 8H), respectively.
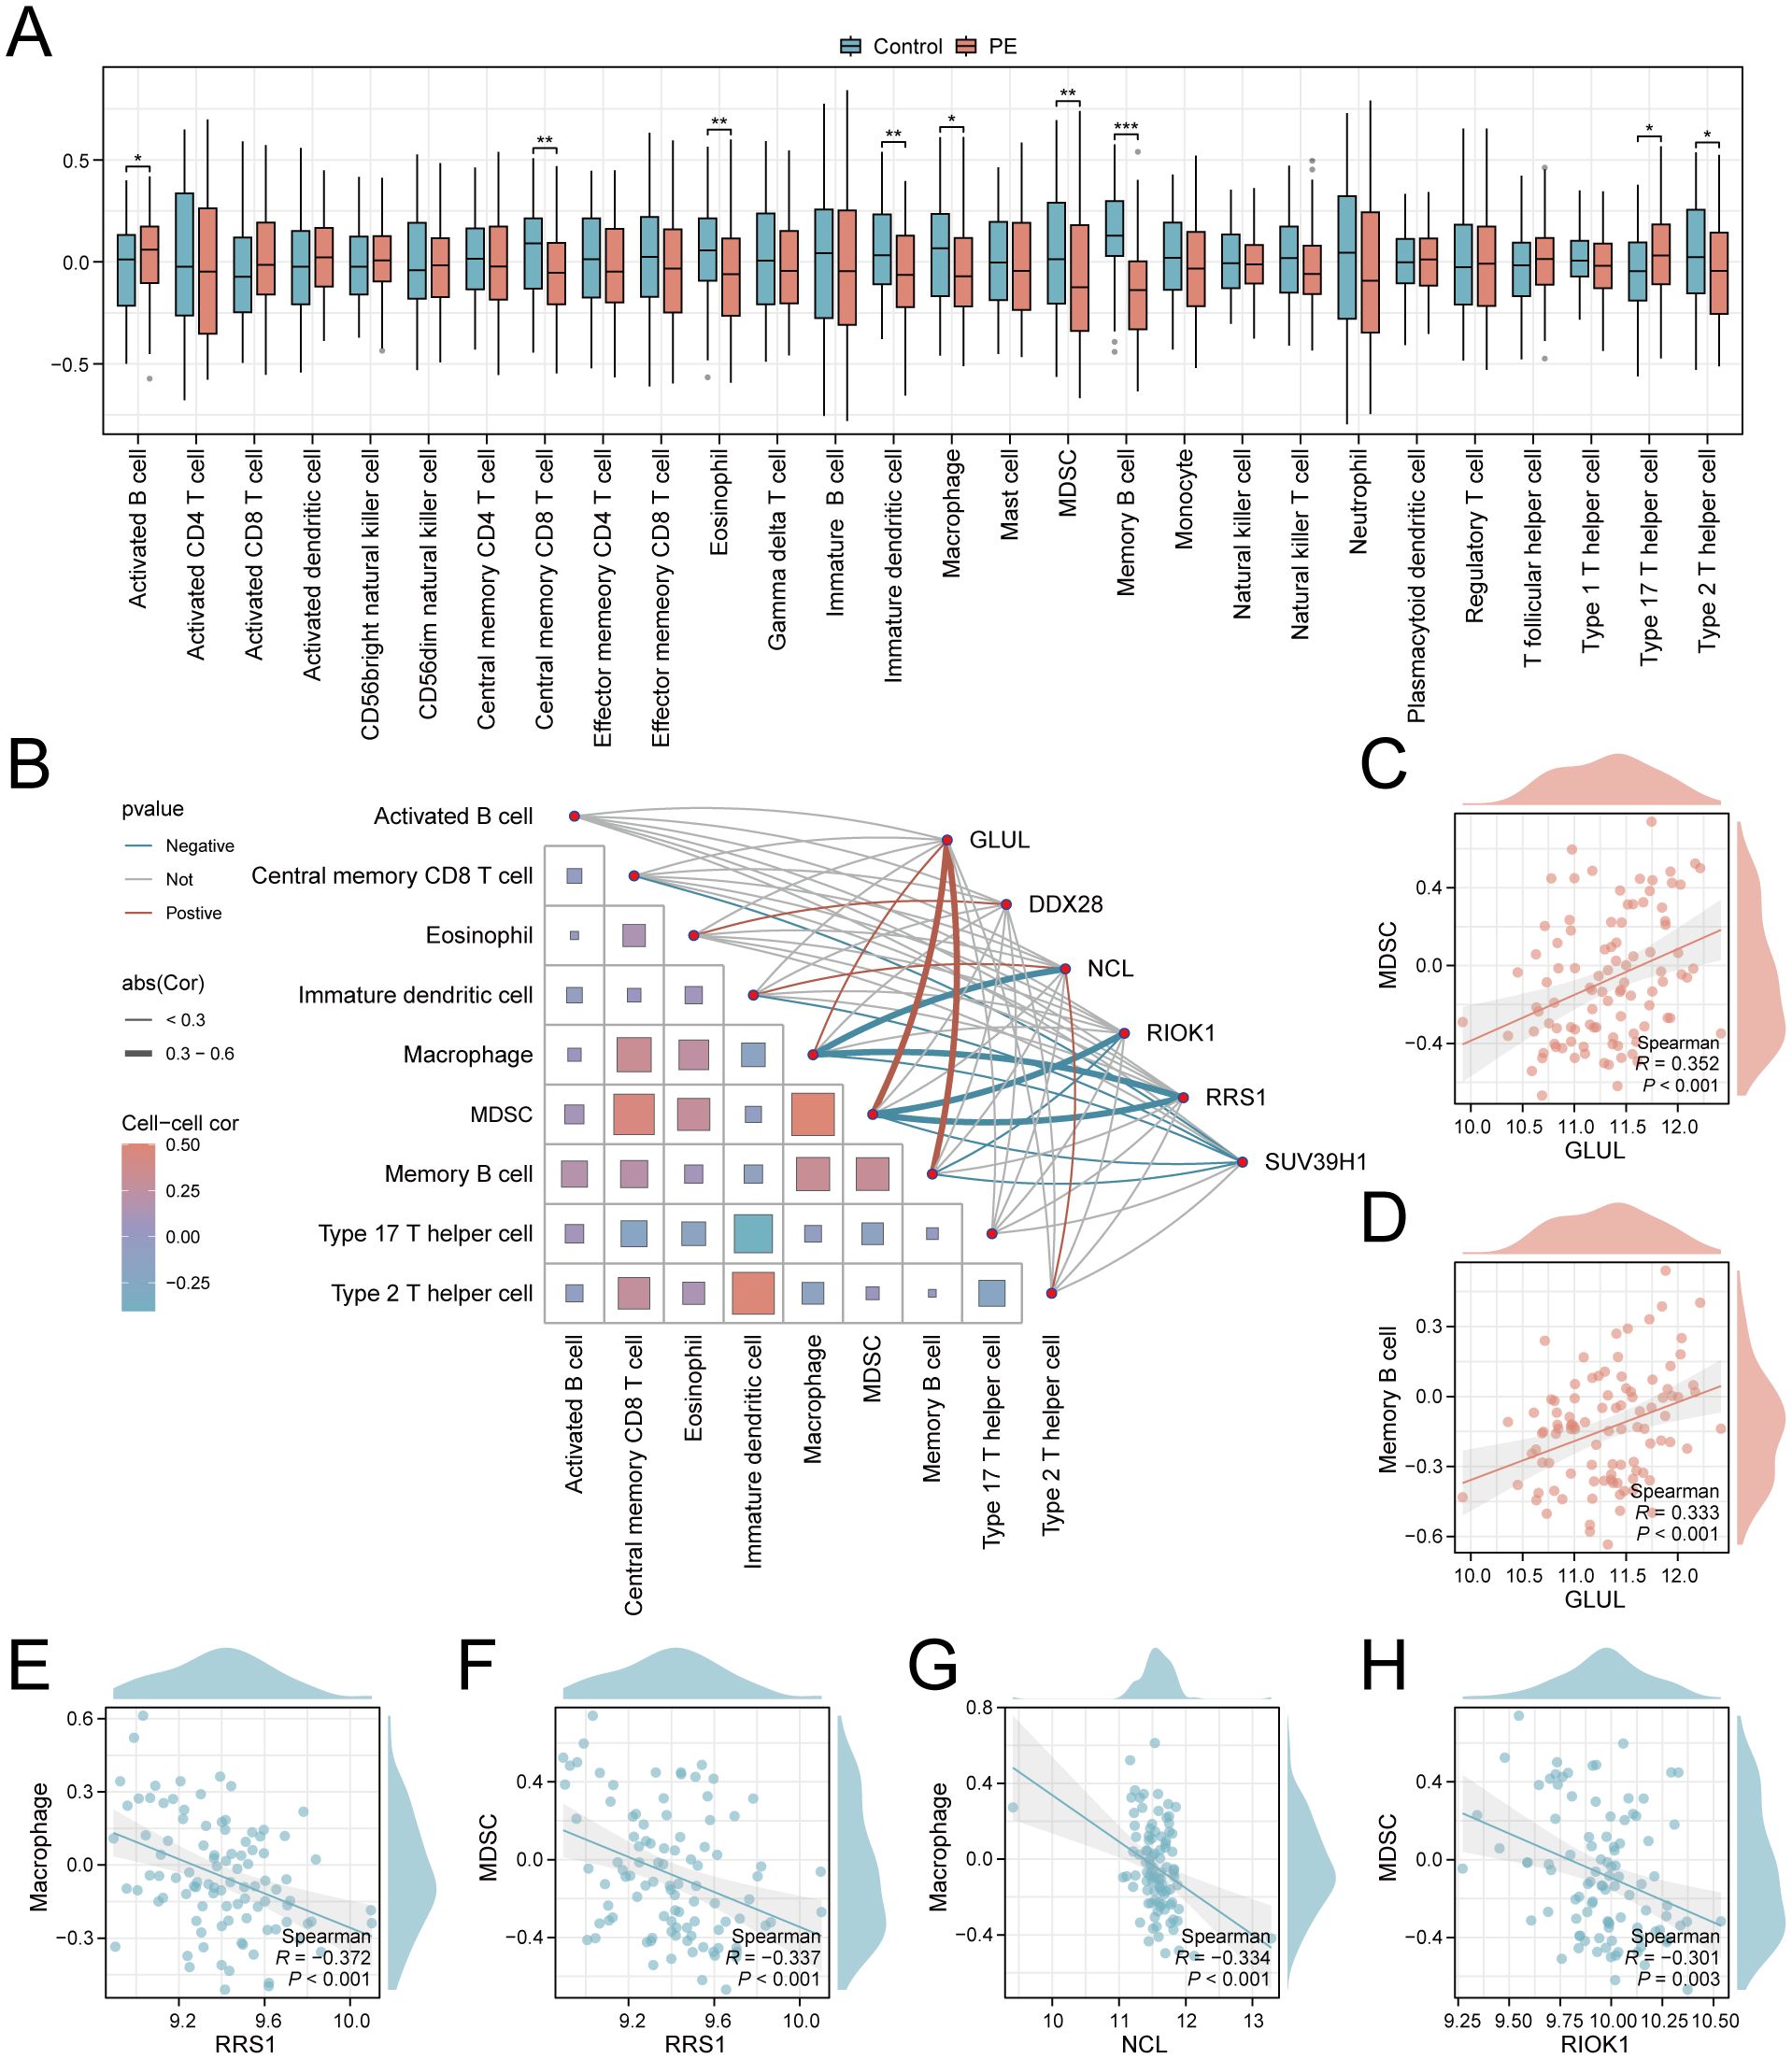
Figure 8. Immune infiltration landscape and key gene correlations in PE. (A) Boxplots comparing immune cell enrichment scores between PE (red) and controls (blue). (B) Correlation network of immune cells and key genes. (C–H). Scatterplots of key gene-immune cell correlations: GLUL-MDSC (C), GLUL-Memory B cell (D), RRS1-Macrophage (E), RRS1-MDSC (F), NCL-Macrophage (G), RIOK1-MDSC (H). *p < 0.05; **p < 0.01; ***p < 0.001. red indicates a positive correlation and blue indicates a negative correlation. 0.3≤|r|<0.5: weakly correlated.
3.9 Experimental validation of key genes in PE
qRT-PCR validation in placental tissues from 10 PE patients and 10 gestational age-matched controls (primers listed in Table 3) confirmed significant dysregulation of ribosome biogenesis-associated genes. DDX28 (p < 0.01) and RIOK1 (p < 0.001) expression was markedly elevated in PE placentas, while GLUL (p < 0.001) and NCL (p < 0.001) showed significant downregulation (Figures 9A–D). SUV39H1 and RRS1 exhibited non-significant expression trends (Figures 9E, F). Clinical assessment revealed significantly elevated systolic blood pressure in PE cases compared to gestational age-matched controls (155.1 ± 24.27 vs. 122.6 ± 7.91 mmHg, p < 0.001), with diastolic pressures similarly increased (92.9 ± 9.73 vs. 74.4 ± 3.69 mmHg, p < 0.001). No significant differences were observed in maternal age (30.4 ± 5.21 vs. 29.7 ± 4.60 years, p = 0.754), neonatal birth weight (2,724 ± 500.16 vs. 3,014 ± 503.42 g, p = 0.213), or Apgar scores at 1 min (9: 10% vs. 0%, p = 0.305) and 5 min (9: 10% vs. 0%, p = 0.305) (Table 4).
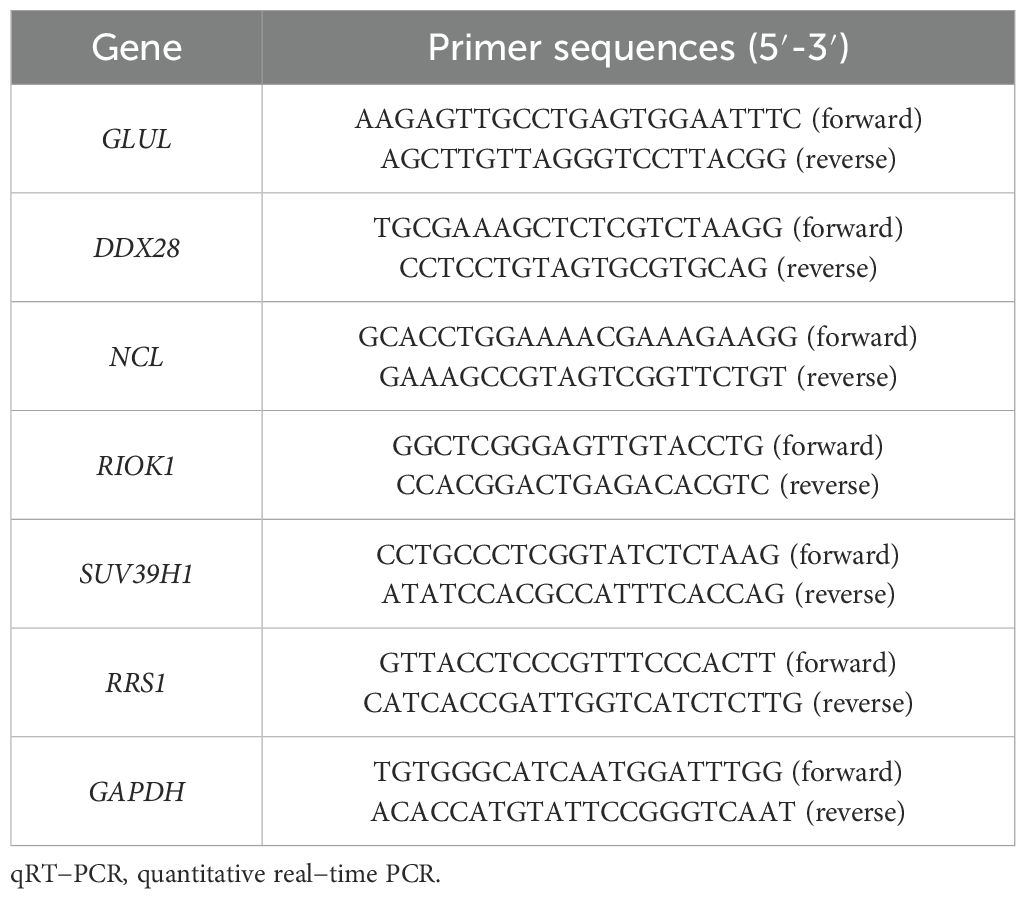
Table 3. Primer sequences for qRT-PCR.
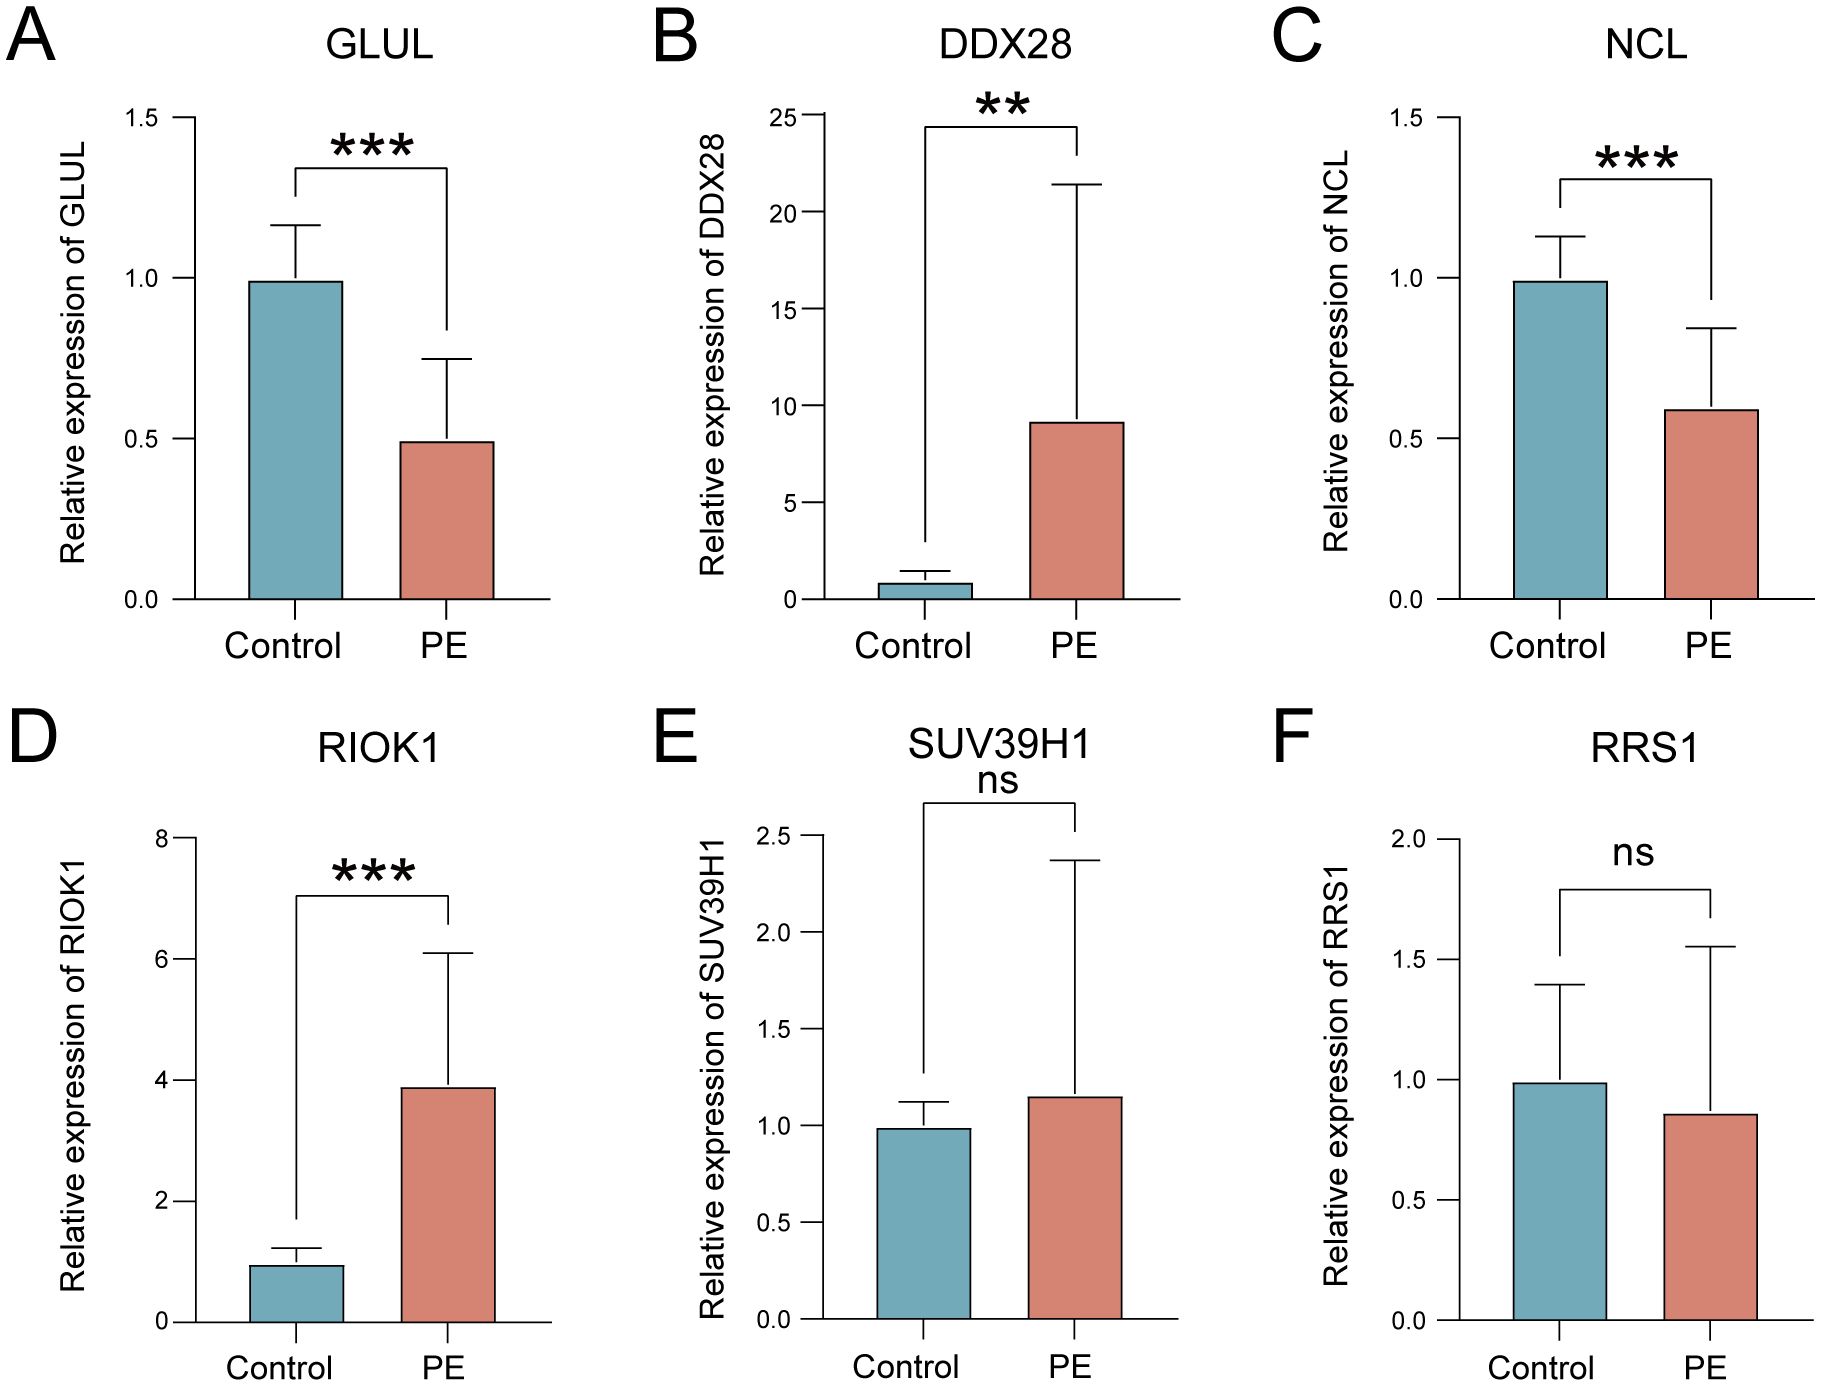
Figure 9. Validation of key gene expression in PE placental tissues. (A–F) mRNA expression levels of GLUL (A), DDX28 (B), NCL (C), RIOK1 (D), SUV39H1 (E), and RRS1 (F) in control (blue) versus PE (red) groups. ns, not significant; **p < 0.01; ***p < 0.001.
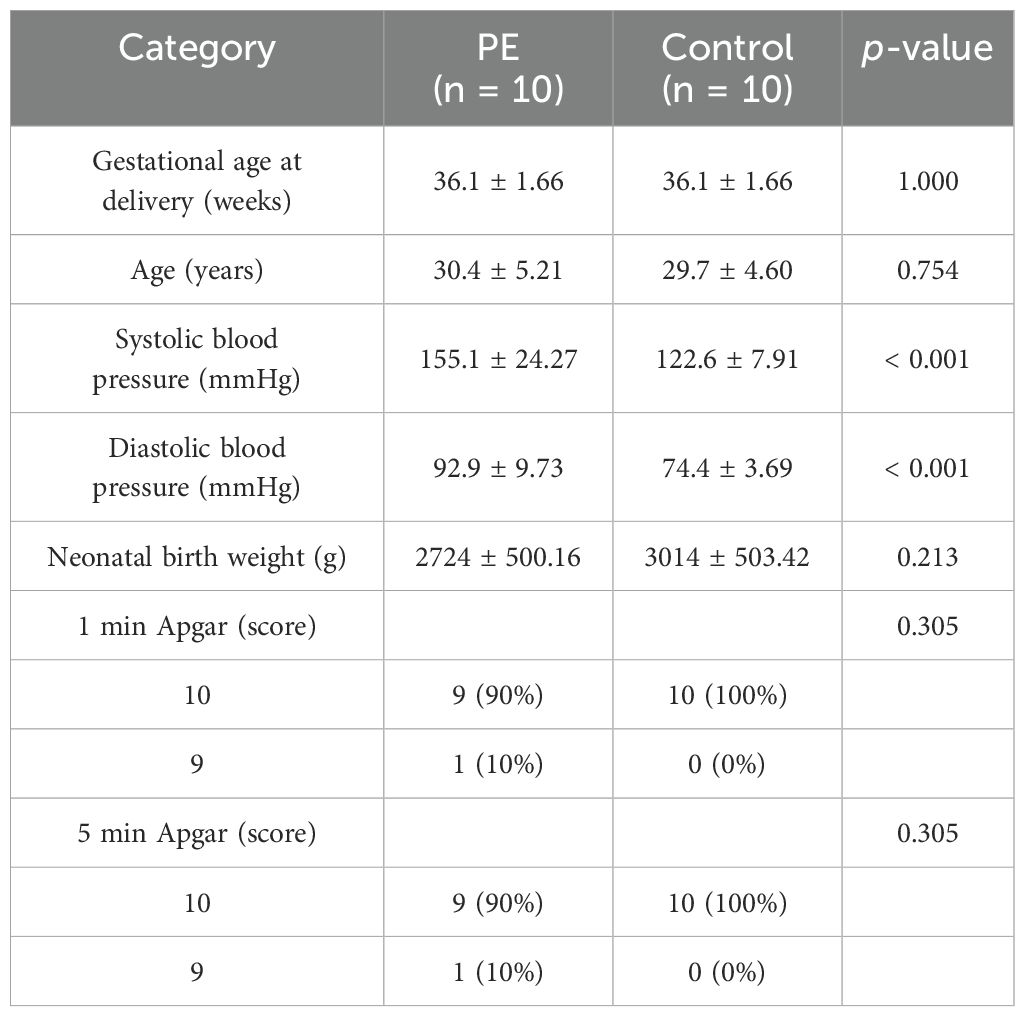
Table 4. Clinical information of the patients.
4 Discussion
Conventional PE biomarkers, including PlGF and sFlt-1, exhibit limited predictive accuracy during early gestation due to insufficient sensitivity and specificity (6). These markers fail to resolve molecular heterogeneity across clinical PE subtypes and primarily reflect angiogenic imbalance while neglecting synergistic pathogenic mechanisms such as inflammatory and metabolic dysregulation (35). Emerging evidence indicates that ribosome biogenesis dysregulation is closely associated with the core PE pathological features, such as placental malperfusion and aberrant vascular remodeling, by disrupting nucleolar structural integrity, inducing oxidative stress, and impairing trophoblast function (36, 37). These evidences collectively suggest that the disruption of ribosome homeostasis may represent a pivotal molecular hub in the early PE pathogenesis.
Our analysis reveals that RiboRDEGs are significantly enriched in rRNA metabolic processes (including ncRNA processing and 90S preribosome assembly) and show strong Bayesian network connectivity to immune pathways (STING/IRF3-mediated interferon responses). These findings suggest that ribosome biogenesis defects in PE may drive placental dysfunction through dual mechanisms: (1) impaired ribosomal stress adaptation via disrupted rRNA maturation (38), and (2) immune activation triggered by nucleolar-derived damage-associated molecular patterns (DAMPs) (39, 40). The co-enrichment of HIF-1 and AMPK signaling pathways aligns with placental hypoxia-reperfusion injury in PE, where hypoxia-inducible factors may suppress rRNA transcription while energy stress activates AMPK-mediated ribophagy to eliminate defective ribosomes (41, 42). Additionally, KEGG pathway analysis demonstrates concurrent proteasome activation, likely representing a compensatory mechanism to remove misfolded ribosomal proteins generated during biogenesis stress, a process previously linked to PE-associated oxidative injury (40, 43). These findings collectively position ribosome biogenesis as a nexus integrating metabolic stress, proteostatic imbalance, and sterile inflammation in PE pathogenesis. The identified RiboDEGs emerge as key molecular mediators linking nucleolar dysfunction to clinical disease manifestations.
Analysis of the combined dataset revealed distinct immune dysregulation in PE placentas, characterized by Th17 polarization, MDSC depletion, and impaired macrophage infiltration, which is consistent with the Th17/Th2 imbalance feature of PE (44). These immunological alterations might represent secondary outcome of ribosome biogenesis stress and the release of DAMPs due to nuclear instability. These DAMPs engage cytoplasmic sensors (e.g., RIG-I, MDA5) and toll-like receptors (TLRs) on placental immune cells, driving NF-κb-dependent pro-inflammatory cytokines (IL-6, IL-17), while suppressing anti-inflammatory mediators (IL-10, TGF-β). This imbalance establishes a self-sustaining inert inflammatory cycle and activates the toll-like receptor (TLR)-mediated inflammatory cascade reaction (39, 44). Notably, GLUL expression positively correlated with MDSC and memory B cell abundance, suggesting glutamine synthetase activity may modulate immunosuppressive niches, potentially through mTORC1-dependent metabolic reprogramming of myeloid cells (45). Conversely, RRS1 and NCL showed negative associations with macrophages and MDSCs, implicating their roles in restraining pro-inflammatory polarization, possibly via ER stress pathways that regulate phagocytic clearance of ribosomal debris (40). The coordinated depletion of tolerogenic MDSCs and macrophages further exacerbates vascular dysfunction, creating a feedforward loop between ribosomal stress, oxidative injury, and immune-mediated endothelial damage (46).
To elucidate the predictive potential of RiboRDEGs in PE risk, we pioneered an explainable machine learning (XML) approach that integrates ribosome biogenesis biology with advanced computational modeling to address the critical need for mechanistically interpretable biomarkers in PE risk prediction. By implementing a multi-algorithm framework encompassing 113 model combinations, we developed a RF model that achieves exceptional diagnostic accuracy while maintaining biological interpretability, representing a significant advance over conventional ‘black-box’ approaches (47). The SHAP interpretability analysis revealed SUV39H1 as the dominant risk contributor (mean |SHAP|=0.0944), with GLUL and RRS1 exhibiting counteractive protective/risk effects, demonstrating how XML disentangles complex gene interactions that collectively drive PE pathogenesis (48). This approach successfully identified six ribosome biogenesis-related biomarkers (GLUL, DDX28, NCL, RIOK1, SUV39H1 and RRS1) and mapped their nonlinear synergies, such as the risk-amplifying SUV39H1-RRS1 interaction and protective GLUL-NCL axis. This findings provide unprecedented insights into how ribosomal stress pathways coalesce to induce placental dysfunction.
The clinical validity of our model was comprehensively demonstrated through two complementary approaches: decision curve analysis confirmed substantial net benefit across clinically relevant risk thresholds, and protein-protein interaction networks revealed these biomarkers functionally coordinate ribosome biogenesis through both physical binding and co-expression relationships. While individual genes showed moderate diagnostic power, their ensemble performance underscores the necessity of multi-gene panels for capturing PE’s molecular heterogeneity — an optimization of current single-biomarker approaches such as the sFlt-1/PlGF ratio (6). Our XML-driven strategy bridges the critical gap between computational prediction and biological mechanism, offering both a clinically deployable risk assessment tool and a systems-level understanding of ribosomal dysregulation in PE pathogenesis (49).
While our explainable machine learning framework provides novel insights into ribosome biogenesis biomarkers for PE risk prediction, several limitations warrant consideration. First, the retrospective design and reliance on public placental transcriptomic datasets may introduce selection bias, as these lack detailed clinical subtyping (e.g., early- vs. late-onset PE) and longitudinal samples to track biomarker dynamics across gestation. Second, the modest clinical validation cohort limits statistical power to detect subtle expression differences, potentially explaining non-significant qRT-PCR trends for SUV39H1 and RRS1. Third, while the model shows promising cross-cohort performance, its generalizability requires testing in multi-ethnic populations and early-pregnancy blood samples, given the inaccessibility of placental biopsies for prenatal screening. Additionally, the exclusive focus on transcriptional regulation overlooks post-translational modifications (e.g., phosphorylation) and epigenetic mechanisms modulating ribosome biogenesis. Furthermore, SHAP-derived gene interactions remain hypothetical without experimental confirmation through CRISPR-based functional validation in trophoblast models. To address these gaps, future studies need to further validate the mechanistic contribution of key biomarkers through functional experiments (such as CRISPR gene editing and ribosome dynamic analysis) and build a multi-omics integration framework — using single-cell transcriptomes to analyze the specific regulatory network of placental trophoblast/immune cell subsets and combining spatial transcriptomes to map the spatial distribution of ribosomal stress signals in the microenvironment. The effect of post-translational modifications (such as phosphorylation) on ribosome assembly was quantitatively analyzed by the proteome, and the synergistic regulatory pattern of DNA methylation/histone modification was characterized by the epigenome. Multi-dimensional data (metabolome, cell free RNA) of prenatal longitudinal blood samples were further integrated to establish a dynamic risk prediction model based on machine learning. This systematic biological strategy from molecular mechanism to clinical phenotype will reveal the cross-scale regulation of PE development driven by the imbalance of ribosome quality control and then promote the transformation process of biomarkers into clinical diagnostic tools.
5 Conclusion
This study establishes dysregulation of ribosome biogenesis as one of the pivotal molecular mechanisms underlying the pathogenesis of PE and leveraging XML to identify clinically actionable biomarkers. Through multi-cohort transcriptomic integration, we identified 25 RiboRDEGs, with six hub genes (GLUL, DDX28, NCL, RIOK1, SUV39H1, RRS1) forming the core of a high-performance predictive model (AUC >0.9). SHAP interpretability analysis revealed SUV39H1 as the dominant risk contributor, while GLUL and NCL exhibited protective effects, highlighting bidirectional regulatory dynamics in placental stress adaptation. Functional enrichment and Bayesian network analyses linked these genes to rRNA processing, nucleolar stress, and immune dysregulation, with immune microenvironment profiling demonstrating significant correlations between RiboRDEGs and altered placental immune cell populations (e.g., MDSCs, macrophages). Experimental validation confirmed dysregulation of key genes. Despite these advances, our study has limitations including retrospective design, potential selection bias in public datasets, and modest validation cohort size. Future work requires CRISPR-based functional validation of key biomarkers and multi-omics integration (single-cell/spatial transcriptomics, proteomics, epigenomics) to map the mechanism of ribosome biogenesis. Development of blood-based machine learning models incorporating longitudinal metabolomic/cfRNA data could enable dynamic risk prediction. Elucidating post-translational modifications (e.g., phosphorylation) and epigenetic regulation of ribosome biogenesis will clarify cross-scale mechanisms underlying PE pathogenesis. These efforts will bridge ribosome biogenesis insights to clinical translation, advancing early diagnosis and targeted therapies for PE.
Data availability statement
Publicly available datasets were analyzed in this study. This data can be found here: https://www.ncbi.nlm.nih.gov/geo/.
Ethics statement
The studies involving humans were approved by The Research Ethics Committee of Ruian People’s Hospital. The studies were conducted in accordance with the local legislation and institutional requirements. The participants provided their written informed consent to participate in this study.
Author contributions
JC: Data curation, Formal analysis, Writing – original draft. DZ: Writing – review & editing, Validation. CZ: Writing – review & editing, Investigation. LL: Visualization, Writing – review & editing. KY: Writing – review & editing. YH: Writing – review & editing, Validation. MP: Conceptualization, Project administration, Writing – review & editing, Methodology.
Funding
The author(s) declare that financial support was received for the research and/or publication of this article. This study was supported by the Wenzhou Medical Health Research Project (No: 2024056) and the Wenzhou Basic Research Project (No: Y20240606).
Acknowledgments
We extend our heartfelt thanks to the patients who generously provided placental samples, making this research possible.
Conflict of interest
The authors declare that the research was conducted in the absence of any commercial or financial relationships that could be construed as a potential conflict of interest.
Generative AI statement
The author(s) declare that Generative AI was used in the creation of this manuscript.
We would like to acknowledge the use of DeepSeek R1 for language refinement and grammar checking in the preparation of this manuscript. DeepSeek-R1, developed by Deepseek Limited, assisted in enhancing the clarity and coherence of the text.
Publisher’s note
All claims expressed in this article are solely those of the authors and do not necessarily represent those of their affiliated organizations, or those of the publisher, the editors and the reviewers. Any product that may be evaluated in this article, or claim that may be made by its manufacturer, is not guaranteed or endorsed by the publisher.
Supplementary material
The Supplementary Material for this article can be found online at: https://www.frontiersin.org/articles/10.3389/fimmu.2025.1595222/full#supplementary-material
References
1. Rana S, Lemoine E, Granger JP, and Karumanchi SA. Preeclampsia: pathophysiology, challenges, and perspectives. Circ Res. (2019) 124:1094–112. doi: 10.1161/CIRCRESAHA.118.313276
2. Mol BWJ, Roberts CT, Thangaratinam S, Magee LA, de Groot CJM, and Hofmeyr GJ. Pre-eclampsia. Lancet. (2016) 387:999–1011. doi: 10.1016/S0140-6736(15)00070-7
3. Hypertension in pregnancy. Report of the American college of obstetricians and gynecologists’ Task force on hypertension in pregnancy. Obstet Gynecol. (2013) 122:1122–31. doi: 10.1097/01.AOG.0000437382.03963.88
4. Steegers EA, von Dadelszen P, Duvekot JJ, and Pijnenborg R. Pre-eclampsia. Lancet. (2010) 376:631–44. doi: 10.1016/S0140-6736(10)60279-6
5. Rana S, Powe CE, Salahuddin S, Verlohren S, Perschel FH, Levine RJ, et al. Angiogenic factors and the risk of adverse outcomes in women with suspected preeclampsia. Circulation. (2012) 125:911–9. doi: 10.1161/CIRCULATIONAHA.111.054361
6. Zeisler H, Llurba E, Chantraine F, Vatish M, Staff AC, Sennstrom M, et al. Predictive value of the sFlt-1:PlGF ratio in women with suspected preeclampsia. N Engl J Med. (2016) 374:13–22. doi: 10.1056/NEJMoa1414838
7. Barrett T, Wilhite SE, Ledoux P, Evangelista C, Kim IF, Tomashevsky M, et al. NCBI GEO: archive for functional genomics data sets–update. Nucleic Acids Res. (2013) 41:D991–5. doi: 10.1093/nar/gks1193
8. Leavey K, Benton SJ, Grynspan D, Kingdom JC, Bainbridge SA, and Cox BJ. Unsupervised placental gene expression profiling identifies clinically relevant subclasses of human preeclampsia. Hypertension. (2016) 68:137–47. doi: 10.1161/HYPERTENSIONAHA.116.07293
9. Leavey K, Benton SJ, Grynspan D, Bainbridge SA, Morgen EK, and Cox BJ. Gene markers of normal villous maturation and their expression in placentas with maturational pathology. Placenta. (2017) 58:52–9. doi: 10.1016/j.placenta.2017.08.005
10. Christians JK, Leavey K, and Cox BJ. Associations between imprinted gene expression in the placenta, human fetal growth and preeclampsia. Biol Lett. (2017) 13. doi: 10.1098/rsbl.2017.0643
11. Leavey K, Wilson SL, Bainbridge SA, Robinson WP, and Cox BJ. Epigenetic regulation of placental gene expression in transcriptional subtypes of preeclampsia. Clin Epigenetics. (2018) 10:28. doi: 10.1186/s13148-018-0463-6
12. Benton SJ, Leavey K, Grynspan D, Cox BJ, and Bainbridge SA. The clinical heterogeneity of preeclampsia is related to both placental gene expression and placental histopathology. Am J Obstet Gynecol. (2018) 219:604 e1–604. doi: 10.1016/j.ajog.2018.09.036
13. Gibbs I, Leavey K, Benton SJ, Grynspan D, Bainbridge SA, and Cox BJ. Placental transcriptional and histologic subtypes of normotensive fetal growth restriction are comparable to preeclampsia. Am J Obstet Gynecol. (2019) 220:110.e1–110. doi: 10.1016/j.ajog.2018.10.003
14. Sitras V, Paulssen RH, Gronaas H, Leirvik J, Hanssen TA, Vartun A, et al. Differential placental gene expression in severe preeclampsia. Placenta. (2009) 30:424–33. doi: 10.1016/j.placenta.2009.01.012
15. Jebbink JM, Boot RG, Keijser R, Moerland PD, Aten J, Veenboer GJ, et al. Increased glucocerebrosidase expression and activity in preeclamptic placenta. Placenta. (2015) 36:160–9. doi: 10.1016/j.placenta.2014.12.001
16. Leek JT, Johnson WE, Parker HS, Jaffe AE, and Storey JD. The sva package for removing batch effects and other unwanted variation in high-throughput experiments. Bioinformatics. (2012) 28:882–3. doi: 10.1093/bioinformatics/bts034
17. Ritchie ME, Phipson B, Wu D, Hu Y, Law CW, Shi W, et al. limma powers differential expression analyses for RNA-sequencing and microarray studies. Nucleic Acids Res. (2015) 43:e47. doi: 10.1093/nar/gkv007
18. Yeung KY and Ruzzo WL. Principal component analysis for clustering gene expression data. Bioinformatics. (2001) 17:763–74. doi: 10.1093/bioinformatics/17.9.763
19. Stelzer G, Rosen N, Plaschkes I, Zimmerman S, Twik M, Fishilevich S, et al. The geneCards suite: from gene data mining to disease genome sequence analyses. Curr Protoc Bioinf. (2016) 54:1.30.1–1.30.33. doi: 10.1002/cpbi.5
20. Zang Y, Ran X, Yuan J, Wu H, Wang Y, Li H, et al. Genomic hallmarks and therapeutic targets of ribosome biogenesis in cancer. Brief Bioinform. (2024) 25. doi: 10.1093/bib/bbae023
21. Gu Z, Eils R, and Schlesner M. Complex heatmaps reveal patterns and correlations in multidimensional genomic data. Bioinformatics. (2016) 32:2847–9. doi: 10.1093/bioinformatics/btw313
22. Subramanian A, Tamayo P, Mootha VK, Mukherjee S, Ebert BL, Gillette MA, et al. Gene set enrichment analysis: a knowledge-based approach for interpreting genome-wide expression profiles. Proc Natl Acad Sci U S A. (2005) 102:15545–50. doi: 10.1073/pnas.0506580102
23. Yu G, Wang LG, Han Y, and He QY. clusterProfiler: an R package for comparing biological themes among gene clusters. OMICS. (2012) 16:284–7. doi: 10.1089/omi.2011.0118
24. Kanehisa M and Goto S. KEGG: kyoto encyclopedia of genes and genomes. Nucleic Acids Res. (2000) 28:27–30. doi: 10.1093/nar/28.1.27
25. Mi H, Muruganujan A, Ebert D, Huang X, and Thomas PD. PANTHER version 14: more genomes, a new PANTHER GO-slim and improvements in enrichment analysis tools. Nucleic Acids Res. (2019) 47:D419–26. doi: 10.1093/nar/gky1038
26. Sato N, Tamada Y, Yu G, and Okuno Y. CBNplot: Bayesian network plots for enrichment analysis. Bioinformatics. (2022) 38:2959–60. doi: 10.1093/bioinformatics/btac175
27. Langfelder P and Horvath S. WGCNA: an R package for weighted correlation network analysis. BMC Bioinf. (2008) 9:559. doi: 10.1186/1471-2105-9-559
28. Dietterich TG. Ensemble methods in machine learning. In: International workshop on multiple classifier systems. Berlin, Heidelberg: Springer Berlin Heidelberg (2000). p. 1–15.
29. Aas K, Jullum M, and Løland AJAI. Explaining individual predictions when features are dependent: More accurate approximations to Shapley values. Artificial Intelligence (2021) 298:103502.
30. Robin X, Turck N, Hainard A, Tiberti N, Lisacek F, Sanchez JC, et al. pROC: an open-source package for R and S+ to analyze and compare ROC curves. BMC Bioinf. (2011) 12:77. doi: 10.1186/1471-2105-12-77
31. Franz M, Rodriguez H, Lopes C, Zuberi K, Montojo J, Bader GD, et al. GeneMANIA update 2018. Nucleic Acids Res. (2018) 46:W60–4. doi: 10.1093/nar/gky311
32. Zhou KR, Liu S, Sun WJ, Zheng LL, Zhou H, Yang JH, et al. ChIPBase v2.0: decoding transcriptional regulatory networks of non-coding RNAs and protein-coding genes from ChIP-seq data. Nucleic Acids Res. (2017) 45, D43–50 doi: 10.1093/nar/gkw965
33. Li JH, Liu S, Zhou H, Qu LH, and Yang JH. starBase v2.0: decoding miRNA-ceRNA, miRNA-ncRNA and protein-RNA interaction networks from large-scale CLIP-Seq data. Nucleic Acids Res. (2014) 42:D92–7. doi: 10.1093/nar/gkt1248
34. Xiao B, Liu L, Li A, Xiang C, Wang P, Li H, et al. Identification and verification of immune-related gene prognostic signature based on ssGSEA for osteosarcoma. Front Oncol. (2020) 10:607622. doi: 10.3389/fonc.2020.607622
35. Hahn S, Lapaire O, and Than NG. Biomarker development for presymptomatic molecular diagnosis of preeclampsia: feasible, useful or even unnecessary? Expert Rev Mol Diagn. (2015) 15:617–29. doi: 10.1586/14737159.2015.1025757
36. Hong Y, Lin Q, Zhang Y, Liu J, and Zheng Z. Research progress of ribosomal proteins in reproductive development. Int J Mol Sci. (2024) 25. doi: 10.3390/ijms252313151
37. Jiao L, Liu Y, Yu XY, Pan X, Zhang Y, Tu J, et al. Ribosome biogenesis in disease: new players and therapeutic targets. Signal Transduct Target Ther. (2023) 8:15. doi: 10.1038/s41392-022-01285-4
38. Boulon S, Westman BJ, Hutten S, Boisvert FM, and Lamond AI. The nucleolus under stress. Mol Cell. (2010) 40:216–27. doi: 10.1016/j.molcel.2010.09.024
39. Ma M, Jiang W, and Zhou R. DAMPs and DAMP-sensing receptors in inflammation and diseases. Immunity. (2024) 57:752–71. doi: 10.1016/j.immuni.2024.03.002
40. Banerjee S, Huang Z, Wang Z, Nakashima A, Saito S, Sharma S, et al. Etiological value of sterile inflammation in preeclampsia: is it a non-infectious pregnancy complication? Front Cell Infect Microbiol. (2021) 11:694298. doi: 10.3389/fcimb.2021.694298
41. Liu L and Simon MC. Regulation of transcription and translation by hypoxia. Cancer Biol Ther. (2004) 3:492–7. doi: 10.4161/cbt.3.6.1010
42. Ni C and Buszczak M. The homeostatic regulation of ribosome biogenesis. Semin Cell Dev Biol. (2023) 136:13–26. doi: 10.1016/j.semcdb.2022.03.043
43. Hetz C. The unfolded protein response: controlling cell fate decisions under ER stress and beyond. Nat Rev Mol Cell Biol. (2012) 13:89–102. doi: 10.1038/nrm3270
44. Peng X, Chinwe Oluchi-Amaka I, Kwak-Kim J, and Yang X. A comprehensive review of the roles of T-cell immunity in preeclampsia. Front Immunol. (2025) 16:1476123. doi: 10.3389/fimmu.2025.1476123
45. Dai W, Shen J, Yan J, Bott AJ, Maimouni S, Daguplo HQ, et al. Glutamine synthetase limits beta-catenin-mutated liver cancer growth by maintaining nitrogen homeostasis and suppressing mTORC1. J Clin Invest. (2022) 132. doi: 10.1172/JCI161408
46. Burton GJ and Jauniaux E. Placental oxidative stress: from miscarriage to preeclampsia. J Soc Gynecol Investig. (2004) 11:342–52. doi: 10.1016/j.jsgi.2004.03.003
47. Lundberg SM and Lee S-I. A unified approach to interpreting model predictions. Neural computing and applications (2017) 30:.
48. Vellido A. The importance of interpretability and visualization in machine learning for applications in medicine and health care. (2020) 32:18069–83. doi: 10.1007/s00521-019-04051-w
Keywords: preeclampsia, ribosome biogenesis dysregulation, multi-algorithm machine learning, risk model, biomarker validation
Citation: Chen J, Zhang D, Zhu C, Lin L, Ye K, Hua Y and Peng M (2025) Explainable machine learning reveals ribosome biogenesis biomarkers in preeclampsia risk prediction. Front. Immunol. 16:1595222. doi: 10.3389/fimmu.2025.1595222
Received: 17 March 2025; Accepted: 22 May 2025;
Published: 09 June 2025.
Edited by:
Sruthi Alahari, University of Toronto, CanadaReviewed by:
Iane Oliveira Pires Porto, University of Rio Verde, BrazilYongbo Zhao, Shanghai First Maternity and Infant Hospital, China
Copyright © 2025 Chen, Zhang, Zhu, Lin, Ye, Hua and Peng. This is an open-access article distributed under the terms of the Creative Commons Attribution License (CC BY). The use, distribution or reproduction in other forums is permitted, provided the original author(s) and the copyright owner(s) are credited and that the original publication in this journal is cited, in accordance with accepted academic practice. No use, distribution or reproduction is permitted which does not comply with these terms.
*Correspondence: Mengjia Peng, cGVtZWppQHdtdS5lZHUuY24=; Ying Hua, d3pmZXloeTEwMTVAMTI2LmNvbQ==