 Shengfang Xia
 Qi An
Qi An Rui Lin
 Yalan Tu
 Zhu Chen
 Dongmei Wang
- Department of Science and Education Division, Public Health Clinical Center of Chengdu, Chengdu, Sichuan, China
Introduction: Diagnostic delays in tuberculosis (TB) threaten global control efforts, necessitating early detection of active TB (ATB). This study explores neutrophil extracellular traps (NETs) as key mediators of TB immunopathology to identify NETs-related biomarkers for differentiating ATB from latent TB infection (LTBI).
Methods: We analyzed transcriptomic datasets (GSE19491, GSE62525, GSE28623) using differential expression analysis (|log, FC| ≥ 0.585, adj. p < 0.05), immune cell profiling (CIBERSORT), and machine learning (SVM-RFE, LASSO, Random Forest). Regulatory networks and drug-target interactions were predicted using NetworkAnalyst, Tarbase, and DGIdb.
Results: We identified three hub genes (CD274, IRF1, HPSE) showing high diagnostic accuracy (AUC 0.865-0.98, sensitivity/specificity >80%) validated through ROC/precision-recall curves. IRF1 and HPSE correlated with neutrophil infiltration (r > 0.6, p < 0.001), suggesting roles in NETosis. FOXC1, GATA2, and hsa-miR-106a-5p emerged as core regulators, and 46 candidate drugs (e.g., PD-1 inhibitors, heparin) were prioritized for repurposing.
Discussion: CD274, IRF1, and HPSE represent promising NETs-derived diagnostic biomarkers for ATB. Their dual roles in neutrophil-mediated immunity highlight therapeutic potential, though drug predictions require preclinical validation. Future studies should leverage spatial omics and CRISPR screening to elucidate mechanistic pathways.
Introduction
TB, caused by Mycobacterium tuberculosis (MTB), remains one of the major public health challenges globally. Despite the significant progress made in the global fight against TB in recent years, according to the Global Tuberculosis Report 2024 released by the World Health Organization (WHO) (1), there were an estimated 10.8 million new TB cases worldwide in 2023, a slight increase from the 10.7 million cases in 2022. TB is transmitted through the air, and individuals exposed to an environment with MTB approximately 30% risk of developing LTBI, which is an asymptomatic and non - infectious state (2). However, without timely treatment, about 5% - 10% of LTBI patients with normal immune function may progress to ATB, and those with underlying diseases may develop ATB more rapidly (3). Delayed diagnosis of ATB and LTBI not only facilitates disease progression but also increases the risk of person-to-person transmission, posing a substantial threat to global TB control efforts. Early detection of ATB and LTBI is therefore critical for initiating timely treatment and implementing effective public health strategies to mitigate transmission.
The pathogenesis of TB involves a complex interplay between MTB and the host immune system (4, 5). Upon inhalation, MTB are phagocytosed by alveolar macrophages, triggering a cascade of innate and adaptive immune responses. During this process, neutrophils, as the first line of defense of the host immune system, participate in anti-TB defense through phagocytosis, production of reactive oxygen species (ROS), and release of NETs,web-like structures composed of DNA, histones, and antimicrobial proteins (6, 7). Existing studies have shown that neutrophils are significantly enriched in the blood and bronchoalveolar lavage fluid of patients with ATB (8), and these cells demonstrate their anti-mycobacterial ability by phagocytosing MTB (9, 10). However, excessive activation of neutrophils may lead to immunopathological damage. For example, although the excessive release of NETs can capture MTB, it can trigger pulmonary inflammation and tissue damage (11, 12). This dual role of NETs—host protection versus pathological damage—highlights their complex regulatory function in TB pathogenesis. These discrepancies underscore the necessity to systematically analyze NETs-related genes (NRGs) and clarify their roles in TB pathogenesis.
Distinguishing between LTBI and ATB is particularly challenging due to overlapping clinical and immunological features. Current diagnostic methods, such as tuberculin skin tests (TSTs) and interferon-gamma release assays (IGRAs), cannot reliably predict disease progression or differentiate between active and latent infection (13, 14). Genomic profiling studies have identified transcriptional signatures associated with TB progression, but these signatures often lack specificity for NETs-related pathways (15, 16). This knowledge gap underscores the need for novel biomarkers that can accurately discriminate between LTBI and ATB, particularly in high-risk populations such as household contacts of TB patients. The immune microenvironments of LTBI and ATB differ significantly. In LTBI, the immune response is characterized by a balanced Th1/Th17 cytokine profile, which restricts MTB replication without causing tissue damage (17, 18). In contrast, ATB is marked by a hyperinflammatory state dominated by neutrophil infiltration and pro-inflammatory cytokine secretion, leading to granuloma formation and lung destruction (19–22). These divergent immune responses likely involve distinct NRG expression patterns. Identifying these differentially expressed NRGs could provide critical insights into disease progression and enable the development of targeted diagnostic tools.
This study addresses these unmet needs by integrating bioinformatics and machine learning approaches to systematically analyze NRG expression profiles in ATB and LTBI. By leveraging publicly available transcriptomic datasets (GSE19491, GSE62525, GSE28623), we aim to 1) identify NRGs that are differentially expressed between ATB and LTBI; 2) validate their diagnostic potential using machine learning algorithms; 3) characterize their functional roles in immune cell infiltration and signaling pathways; and 4) predict potential therapeutic targets by mapping NRGs to druggable pathways. These findings may provide a theoretical basis for the development of new treatment strategies, especially by targeting the NETs regulatory pathway to intervene in the immune response of TB and ultimately improve the treatment prognosis of patients.
Materials and methods
Data collection
Gene expression datasets related to ATB were obtained from the GEO database (https://www.ncbi.nlm.nih.gov/geo/) using the GEOquery R package (version 3.20) (23). NRGs were curated from previously validated studies (24, 25). A total of 123 NRGs were manually extracted and compiled into a reference list (Supplementary Table S1).
Identification of DE-NRGs
Differential expression analysis was performed using the limma package (version 3.20) (26). Genes with |log2 (fold change) | ≥ 0.585 (equivalent to a 1.5 - fold change)and adjusted p-value < 0.05 (Benjamini-Hochberg correction) were considered significantly differentially expressed. Subsequently, an intersection analysis was performed between the DEGs and NRGs to screen out significantly DE-NRGs. These genes likely contribute to ATB pathogenesis.
Functional enrichment analysis
Gene Ontology (GO) and Kyoto Encyclopedia of Genes and Genomes (KEGG) pathway enrichment analyses were conducted using the ClusterProfiler package (version 4.6.0) (27). The analysis results were presented in various visualization methods to help uncover the potential mechanisms of these genes in the occurrence and development of ATB.
Immune cell infiltration analysis
Immune cell infiltration levels were quantified using the CIBERSORT algorithm with the LM22 signature matrix (28). Gene expression data and the LM22 signature file were processed through the CIBERSORT R script to estimate the relative proportions of 22 immune cell subtypes in each sample. To ensure robustness, only samples with a CIBERSORT output p-value < 0.05 were retained for downstream analysis.
For correlation analysis between hub genes (CD274, IRF1, HPSE) and immune cell subsets, Spearman’s rank correlation was applied. Statistical significance was defined as p < 0.05. Visualization of correlation matrices and gene-immune cell interactions was performed using linkET (version 0.0.7.4) (29) and ggplot2(version 3.5.1) (30), with color gradients representing correlation coefficients and point sizes indicating statistical significance. The final plots integrated immune cell-cell correlations (lower triangle) and gene-immune cell correlations (upper triangle).
Identification of hub genes using machine learning algorithms
To identify the key genes associated with ATB, we employed three classic machine - learning algorithms, including SVM - RFE, LASSO, and RF. These algorithms were implemented using the R packages e1071 (31, 32), glmnet (33), and randomForest (34). The overlapping genes of the three algorithms were considered as hub genes, and the results were visualized using the Venn package (35).
Prediction of potential drug targets
Potential drug targets were identified using the Drug-Gene Interaction database (DGIdb) (version 5.0.8) (36). Drug-gene interaction networks were constructed using Cytoscape (version 3.7.2) (35). Aiming to provide new drug targets for the treatment of ATB.
Construction of TFs-gene and miRNAs-gene regulatory networks
Based on the regulatory roles of TFs and miRNAs, we used NetworkAnalyst 3.0 (37) and the Tarbase database (38) to construct the regulatory networks of TFs-genes and miRNAs-genes, respectively. By analyzing the transcriptional regulation and miRNA regulation relationships of these genes, we can better understand the mechanism of action of NETs - related genes in ATB. All the regulatory networks were visualized using Cytoscape to intuitively display the interactions among these molecules.
Results
Identification and functional characterization of DEGs
The overall flowchart of this study is shown in Figure 1. In the GSE19491 dataset, we conducted a differential expression analysis for 69 samples of LTBI and 54 samples of ATB. Finally, a total of 7,959 differentially expressed genes were identified, among which 3,471 genes were upregulated, and 4,488 genes were downregulated in the ATB group (Figure 2A). To explore the biological functions and potential roles of these DEGs during the development of ATB, we performed GO and KEGG enrichment analyses. Specifically, a total of 46 significantly enriched KEGG pathways were identified (Supplementary File 2), as well as 1,028 GO items (Supplementary File 3).
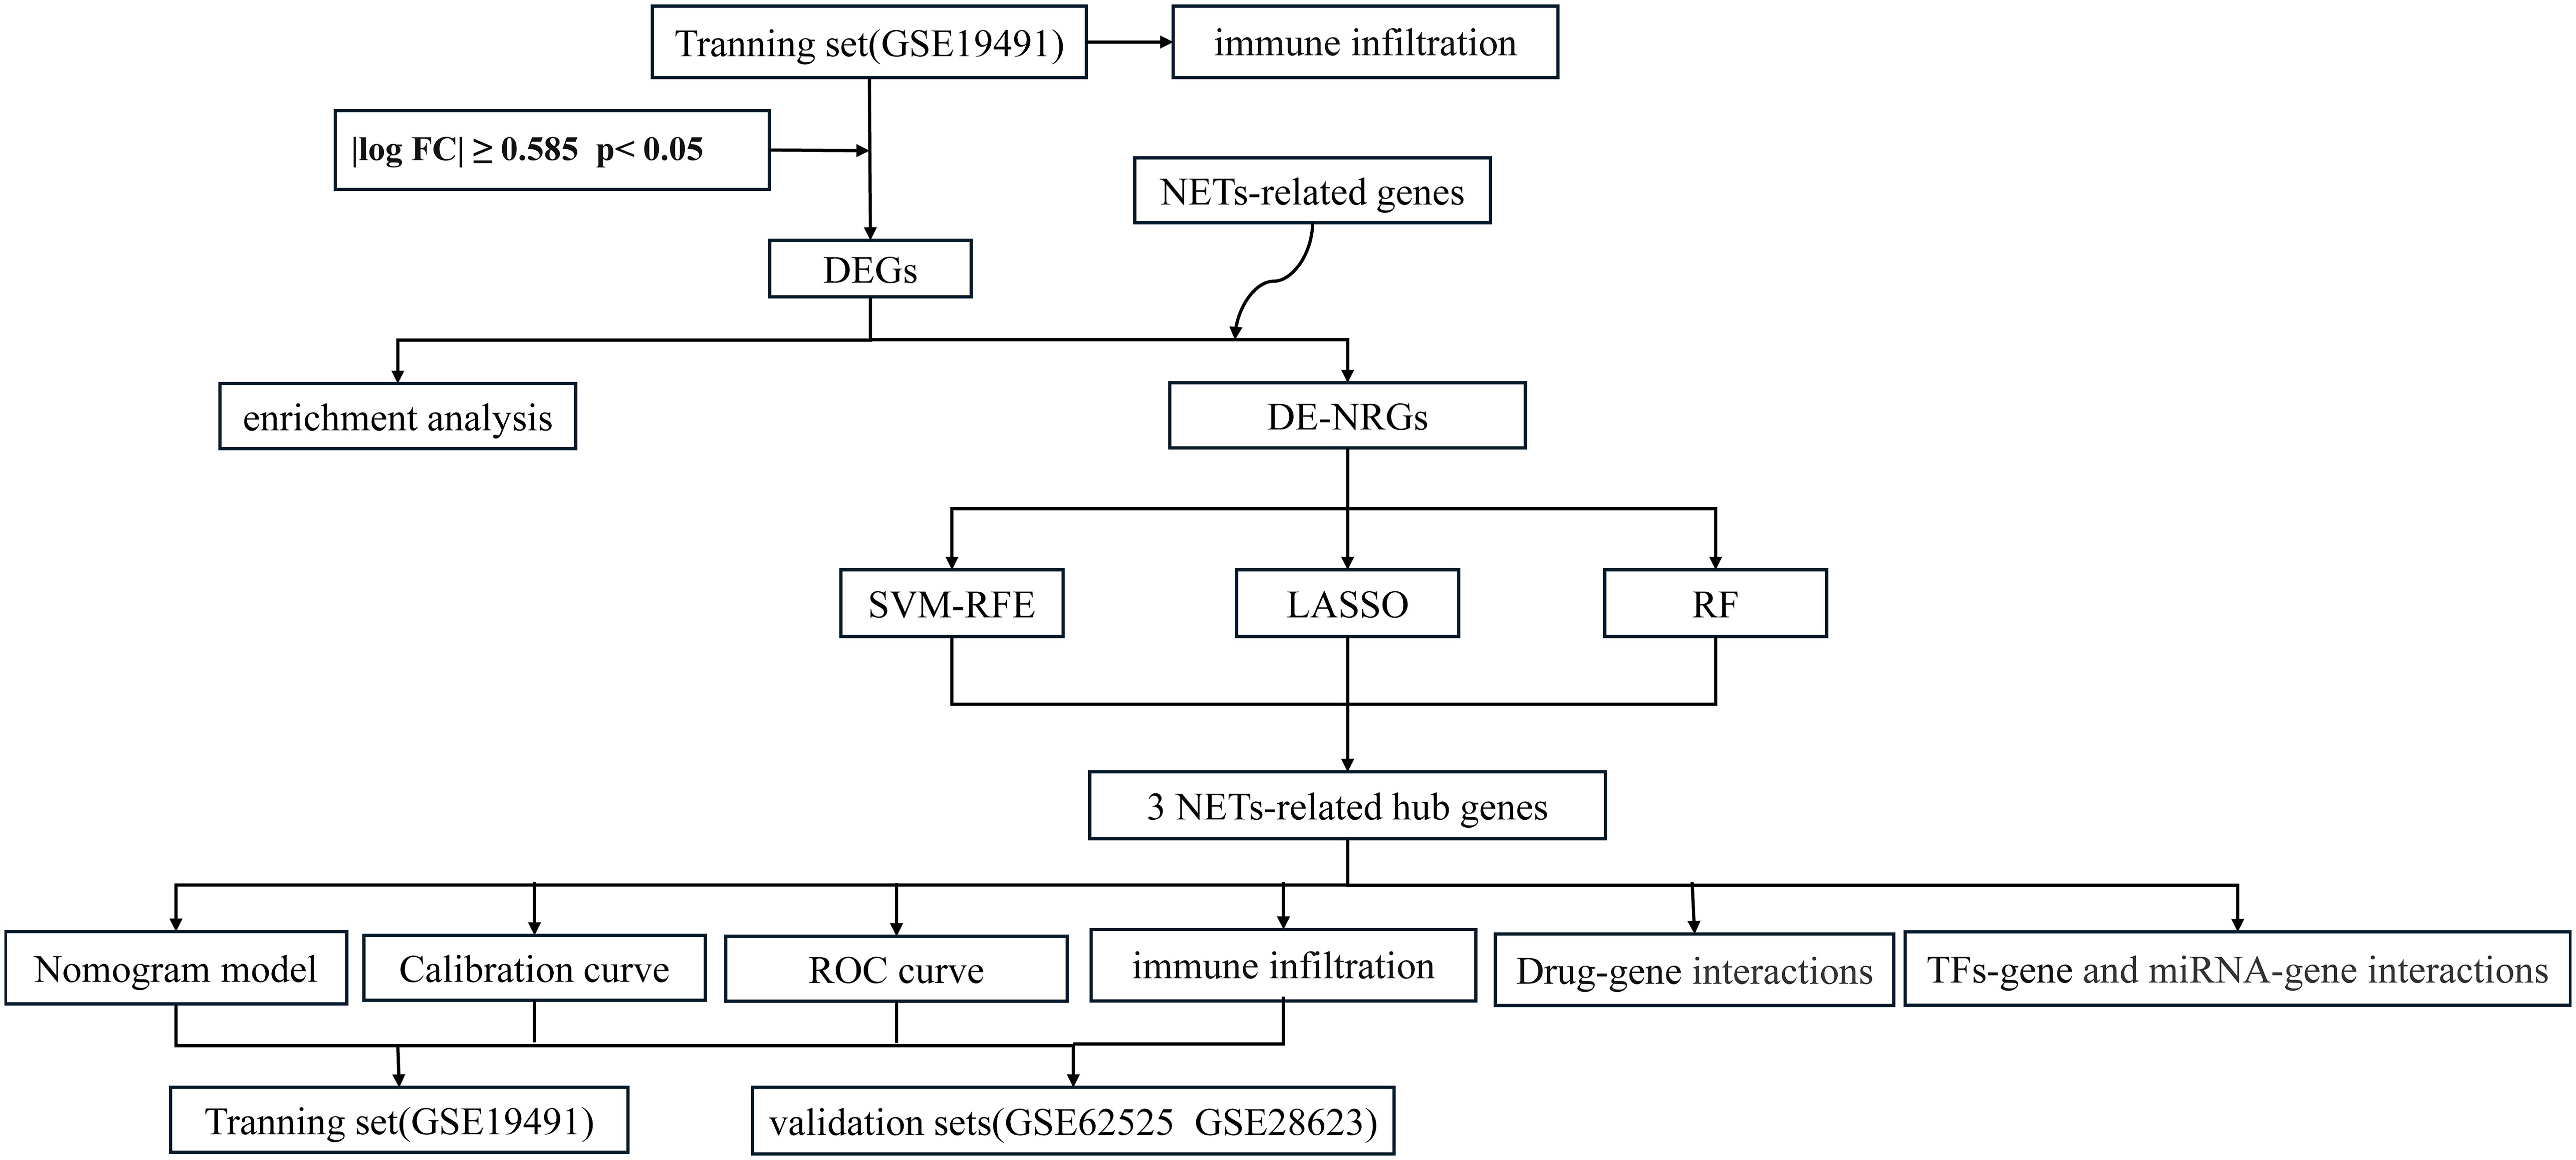
Figure 1. Flowchart of this study.
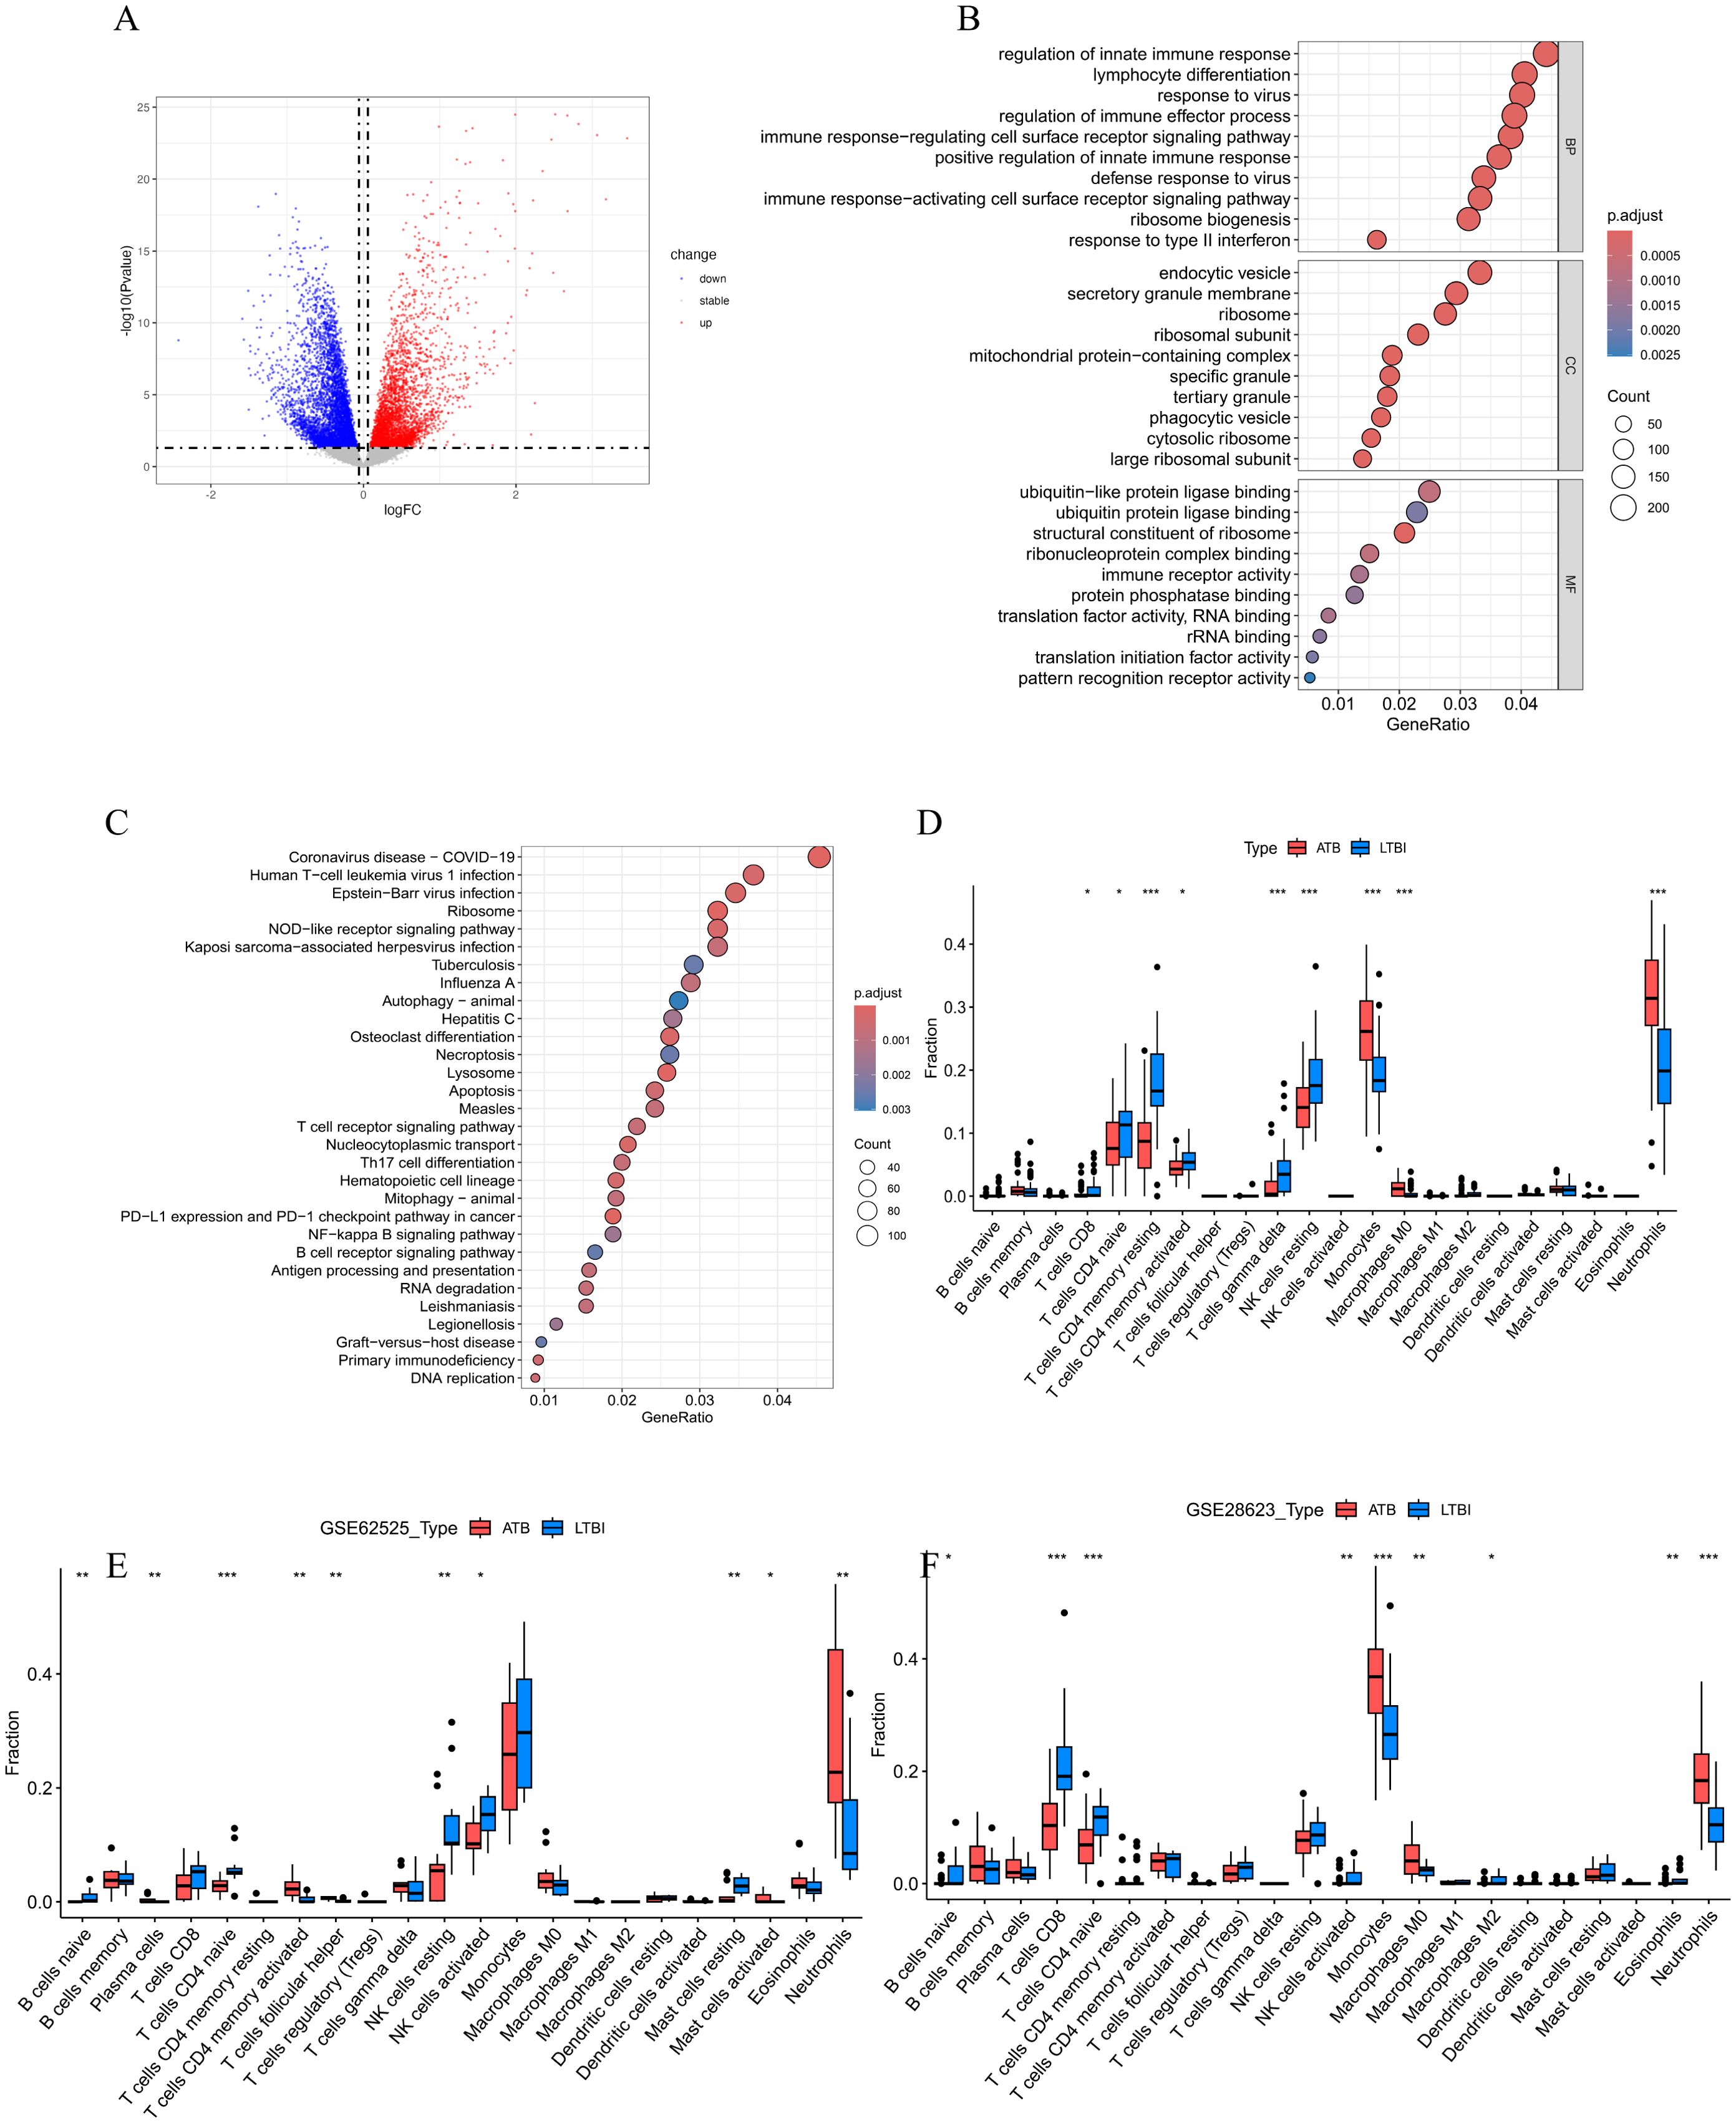
Figure 2. (A)The volcano plot of DEGs between ATB and LTBI groups in GSE19491. (B) The bubble plots of the GO enrichment analysis results for DEGs, which show Top 10 GO BPs; Top 10 GO CCs; Top 10 GO MFs. (C) Bubble plot of KEGG pathway analysis results for DEGs, showing Top 30 KEGG pathways. The size of the bubbles correlates with the number of genes enriched in the pathway, while the color indicates the magnitude of the adjusted p-value, with red indicating a smaller adjusted p-value and blue indicating a larger adjusted p-value. (D-F) Comparison of immune cell infiltration profiles between active tuberculosis (ATB) and latent tuberculosis infection (LTBI) patients across three datasets. Relative proportions of 22 immune cell subtypes in ATB and LTBI groups were estimated using the CIBERSORT algorithm in (D) GSE19491, (E) GSE62525, and (F) GSE28623 datasets. Bar plots illustrate the mean infiltration levels of immune cell subtypes (e.g., neutrophils, monocytes, cluster of differentiation 8-positive T cells [CD8+ T cells], natural killer [NK] cells, and memory CD4+ T cells) in ATB (red) and LTBI (blue). Statistical significance was assessed using the student’s t test (*p < 0.05, **p < 0.01, ***p < 0.001). Error bars represent standard deviation.
In the GO analysis (Figure 2B), we found that in the Biological Process (BP) category, the DEGs were mainly enriched in key immune response pathways such as regulation of innate immune response, lymphocyte differentiation, regulation of immune effector process, and immune response−regulating cell surface receptor signaling pathway. In the Cellular Component (CC) category, the DEGs were significantly enriched in structural components such as endocytic vesicles, secretory granule membrane, and ribosome. In the Molecular Function (MF) category, the DEGs were mainly involved in important functions such as ubiquitin−like protein ligase binding, ubiquitin protein ligase binding, andstructural constituent of ribosome.
The KEGG pathway analysis (Figure 2C) indicated that these DEGs were significantly enriched in various pathways, especially those related to immune responses and cell signaling, including the NOD-like receptor signaling pathway, DNA replication, Apoptosis, T cell receptor signaling pathway, Th17 cell differentiation, NF-kappa B signaling pathway, Autophagy–animal, as well as infectious diseases such as Coronavirus disease (COVID-19), Epstein-Barr virus infection, Tuberculosis, etc.
To further explore the role of immune cells in the occurrence of ATB, we used the CIBERSORT algorithm to evaluate the infiltration status of immune cells in the ATB and LTBI groups (Figure 2D). According to the results (Figure 2D), patients with LTBI exhibited higher levels of CD8+ T cells, naïve CD4+ T cells, resting memory CD4+ T cells, activated memory CD4+ T cells, gamma delta T cells, and resting natural killer (NK) cells. In contrast, patients with ATB showed significantly higher levels of monocytes and neutrophils. Analyses in two validation datasets, GSE62525 (Figure 2E) and GSE28623 (Figure 2F), further confirmed the high infiltration of neutrophils in patients with ATB.
Identification of NETs-related hub genes in ATB
To identify the DE-NRGs closely associated with the occurrence of ATB, we performed an intersection analysis between the DEGs and the known NRGs, obtaining 88 DE-NRGs (Figure 3A). Subsequently, we used three machine learning algorithms (SVM-RFE, LASSO, and RF) to screen key genes from these DE-NRGs.
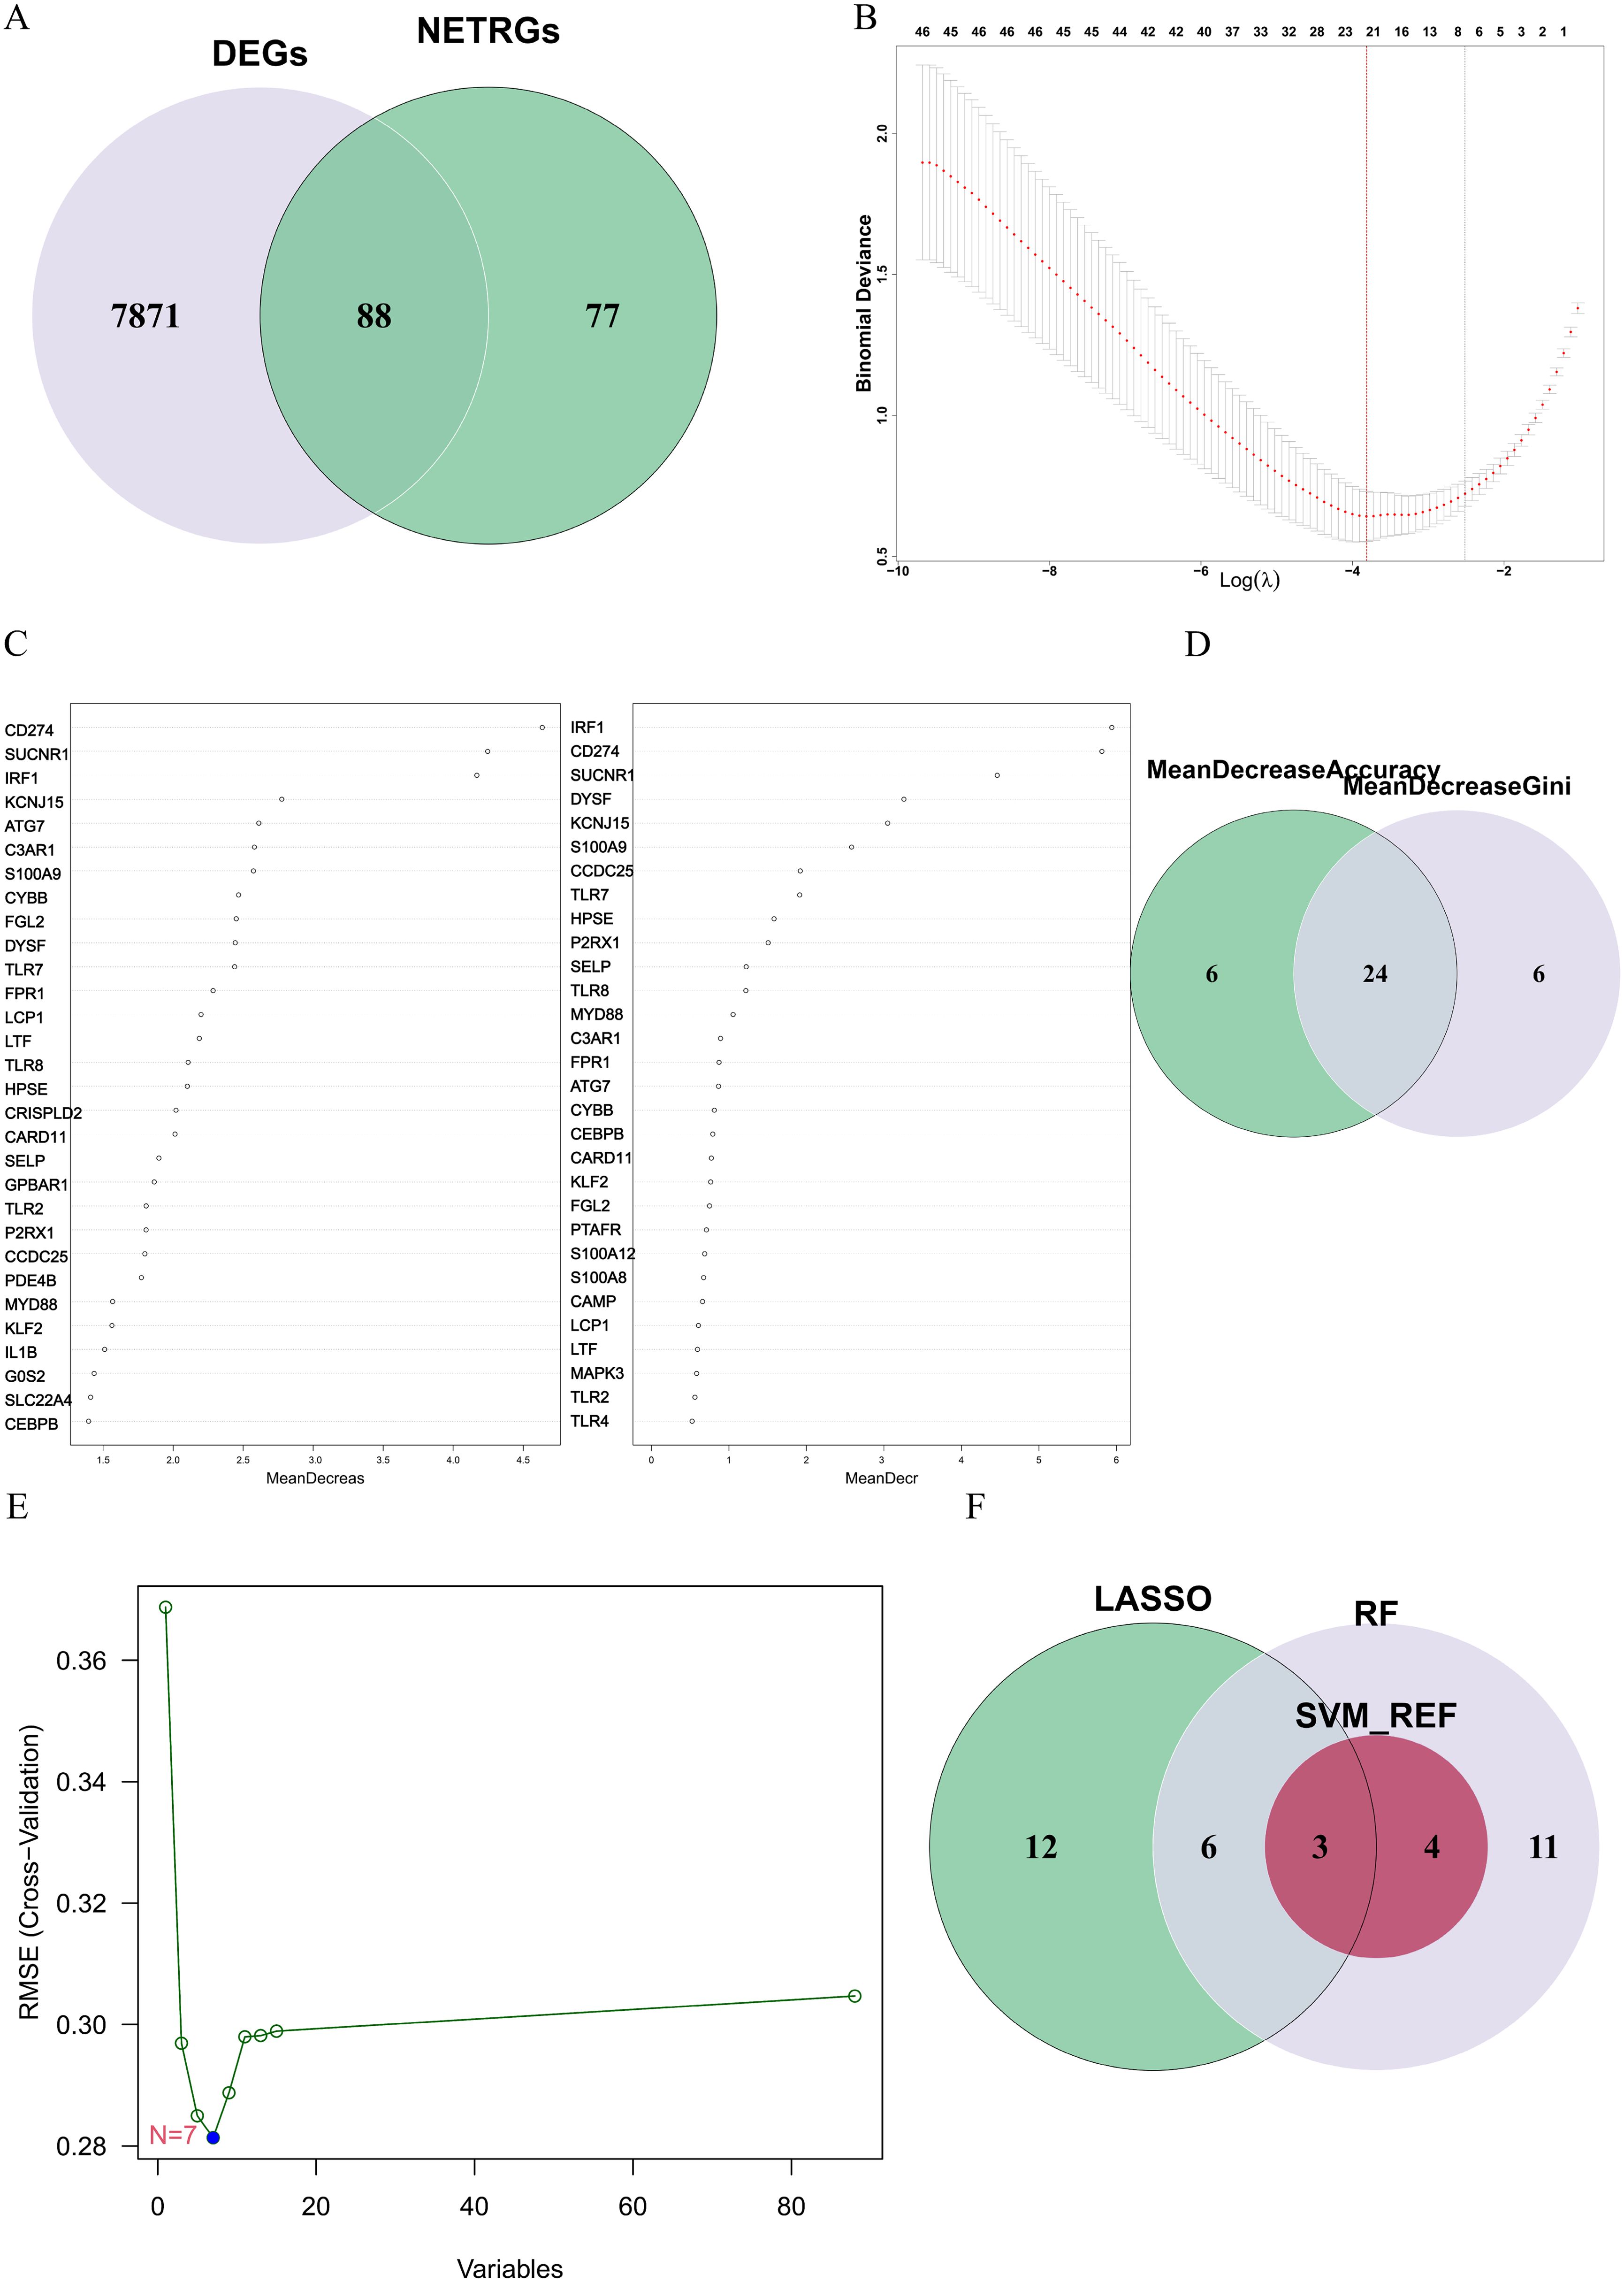
Figure 3. (A) The gene overlap between DEGs and NRGs. (B) The LASSO algorithm was used to obtain the hub genes associated with ATB, and the error was minimized when 21 genes were included. (C) Random forest (RF) algorithm ranked genes by mean decrease accuracy (MDA) and mean decrease Gini (MDG). Top 30 genes from each metric were intersected. (D) The overlapping genes between the 30 genes with the mean decrease accuracy and the 30 genes with the mean decrease Gini. (E) Error plot of different number of features in SVM-RFE. The minimum error was obtained for the inclusion of 7 genes. (F) Venn diagram showing the overlap of candidate genes for the above three machine learning algorithms.
In the LASSO algorithm (Figure 3B), with the best lambda of 0.0220116, 21 key genes were identified. In the RF algorithm (Figure 3C), by setting the optimal number of trees to 65, we conducted an intersection analysis of the top 30 genes ranked by “mean decrease Accuracy” and “mean decrease Gini”, ultimately screening out 24 key genes (Figure 3D). The SVM-RFE algorithm (Figure 3E) identified 7 key genes.
Finally, through the intersection of the results from the three algorithms, we identified 3 key hub genes: CD274, IRF1, and HPSE (Figure 3F). These genes are considered NETs-related hub genes and may play important roles in the pathogenesis of ATB.
Identification and validation of the diagnostic value of NETs-related hub genes
To determine the diagnostic value of the above three hub genes in ATB, first, this study analyzed the correlations between the three genes and immune cells. As shown in Figure 4A, in the training dataset GSE19491, CD274, IRF1, and HPSE were significantly positively correlated with neutrophils. Then, a nomogram model was constructed based on the three genes. The relative expression level of each gene corresponded to a score, and the total score was calculated by adding up the scores of each gene (Figure 4B).

Figure 4. (A) Correlation between immune cells and between NETs-related hub genes and immune cells in the GSE19491 dataset. (B) Nomogram construction of three NETs-related hub genes in the GSE19491 dataset. (C) ROC curve of the three NETs-related hub genes and nomogram in discovery datasets for GSE19491.
ROC curve analysis indicated that all three genes had good diagnostic performance. Figure 4C shows that for CD274 (AUC: 0.901, 95% CI: 0.84 - 0.962), IRF1 (AUC: 0.93, 95% CI: 0.886 - 0.975), HPSE (AUC: 0.865, 95% CI: 0.798 - 0.933), and the Nomoscore (AUC: 0.949, 95% CI: 0.908 - 0.99). Surprisingly, it could be inferred from the AUC values that CD274 and IRF1 had outstanding diagnostic efficiency, while HPSE also had good diagnostic value.
In addition, to further evaluate the accuracy of the above results, this study conducted validation in two training datasets (GSE62525, GSE28623). Consistent with the previous results, in the training dataset GSE28623, CD274, IRF1, and HPSE were significantly positively correlated with neutrophils (Figure 5B). In the validation dataset GSE62525, CD274 and HPSE were significantly positively correlated with neutrophils. However, unfortunately, there was no significant correlation between IRF1 and neutrophils (Figure 5A). Moreover, the nomogram model and ROC curve analysis confirmed the good diagnostic value of the three genes (Figures 5C–F).
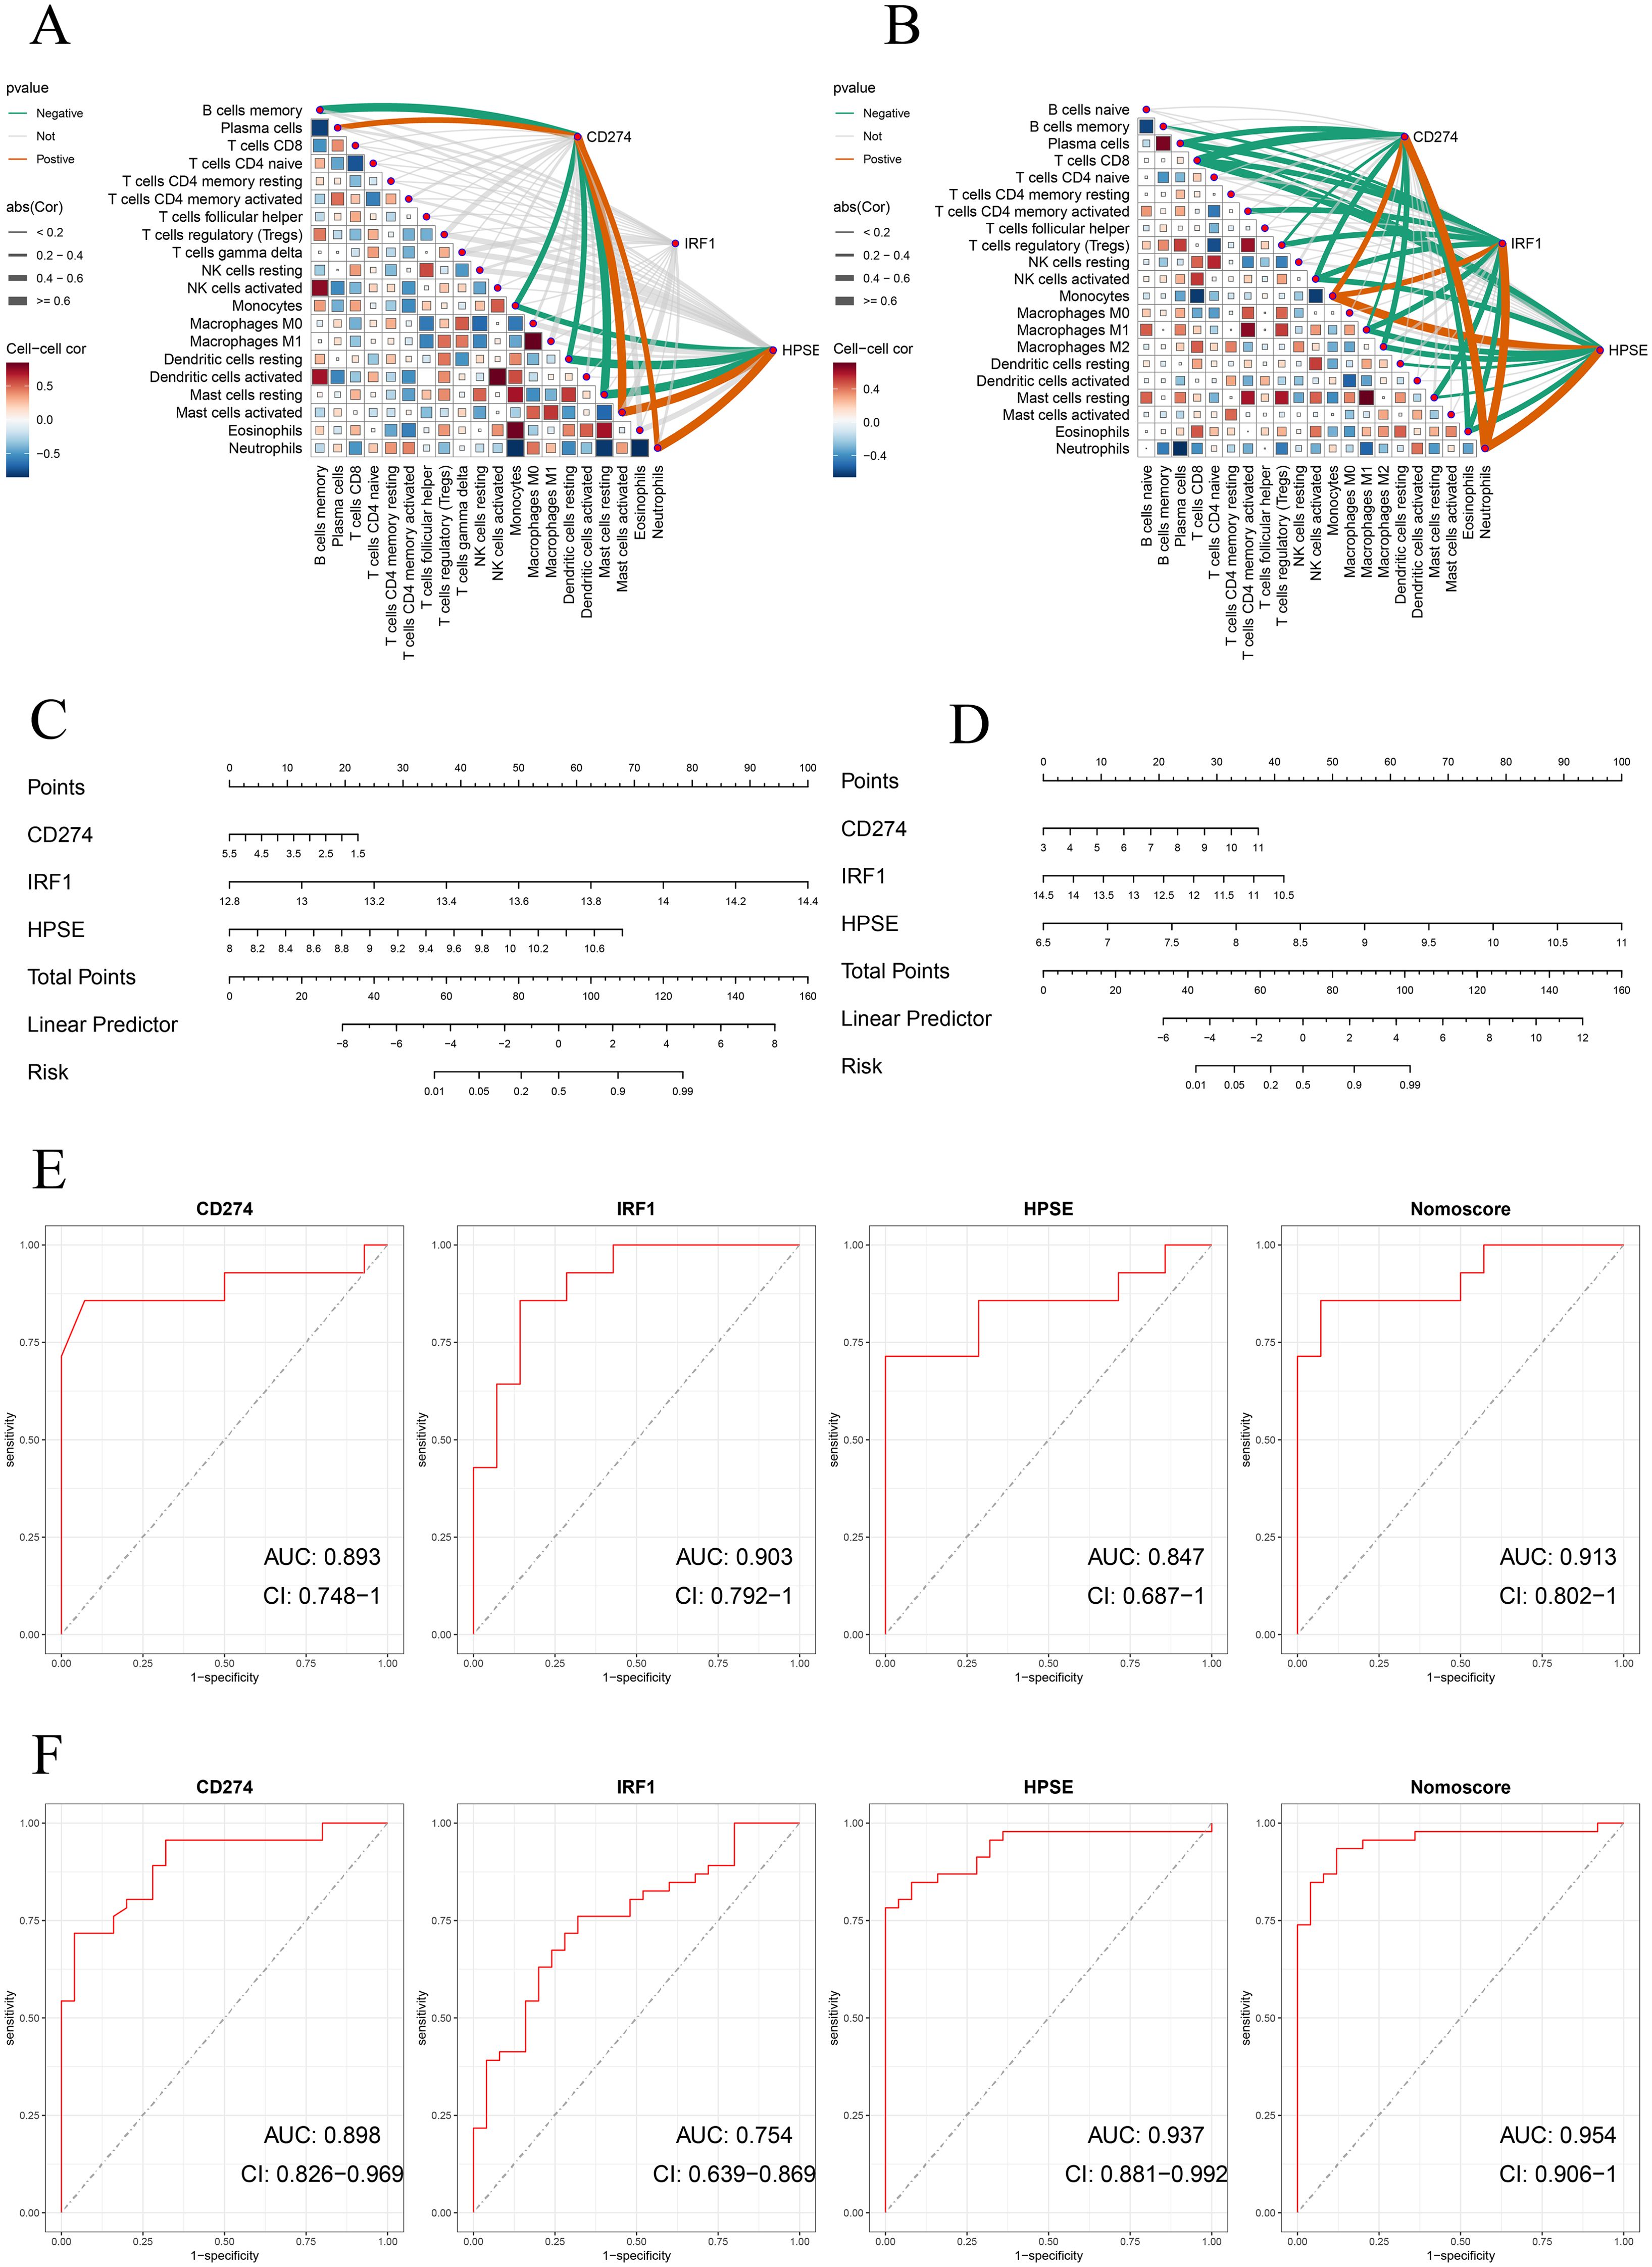
Figure 5. (A, B) Correlation analysis of neutrophil extracellular traps (NETs)-related hub genes with immune cell infiltration in validation datasets. Spearman’s rank correlation heatmaps show the association between expression levels of NETs-related hub genes (CD274, IRF1, HPSE) and immune cell subtypes in (A) GSE62525 and (B) GSE28623 datasets. Correlation coefficients are represented by color gradients (red: positive; blue: negative), and point sizes indicate statistical significance. Key immune cell subtypes include neutrophils, monocytes, CD8+ T cells, and NK cells. (C, D) Nomogram construction of three NETs-related hub genes in validation datasets for GSE62525 and GSE2862. (E, F) ROC curve of the three NETs-related hub genes and nomogram in validation datasets for GSE62525 and GSE2862.
We further validated the diagnostic performance of the three hub genes (CD274, IRF1, HPSE) using precision-recall (PR) curves across all datasets (Supplementary Figures 2–4). The area under the PR curve (AUPR) for CD274, IRF1, and HPSE ranged from 0.875 to 0.971 in the cohorts (GSE62525: CD274 AUPR = 0.901, IRF1 AUPR = 0.859, HPSE AUPR = 0.896; GSE28623: CD274 AUPR = 0.859, IRF1 AUPR = 0.971, HPSE AUPR = 0.978; GSE19491: CD274 AUPR = 0.915, IRF1 AUPR = 0.875, HPSE AUPR = 0.948). The Nomoscore, integrating all three genes, achieved AUPR values exceeding 0.93 in all datasets (Supplementary Figures 2–4). These results corroborate the high diagnostic accuracy observed in ROC analyses. Table 1 summarizes the specificity, sensitivity, F1 score, and 95% confidence intervals (CIs) for the hub genes across discovery and validation datasets.
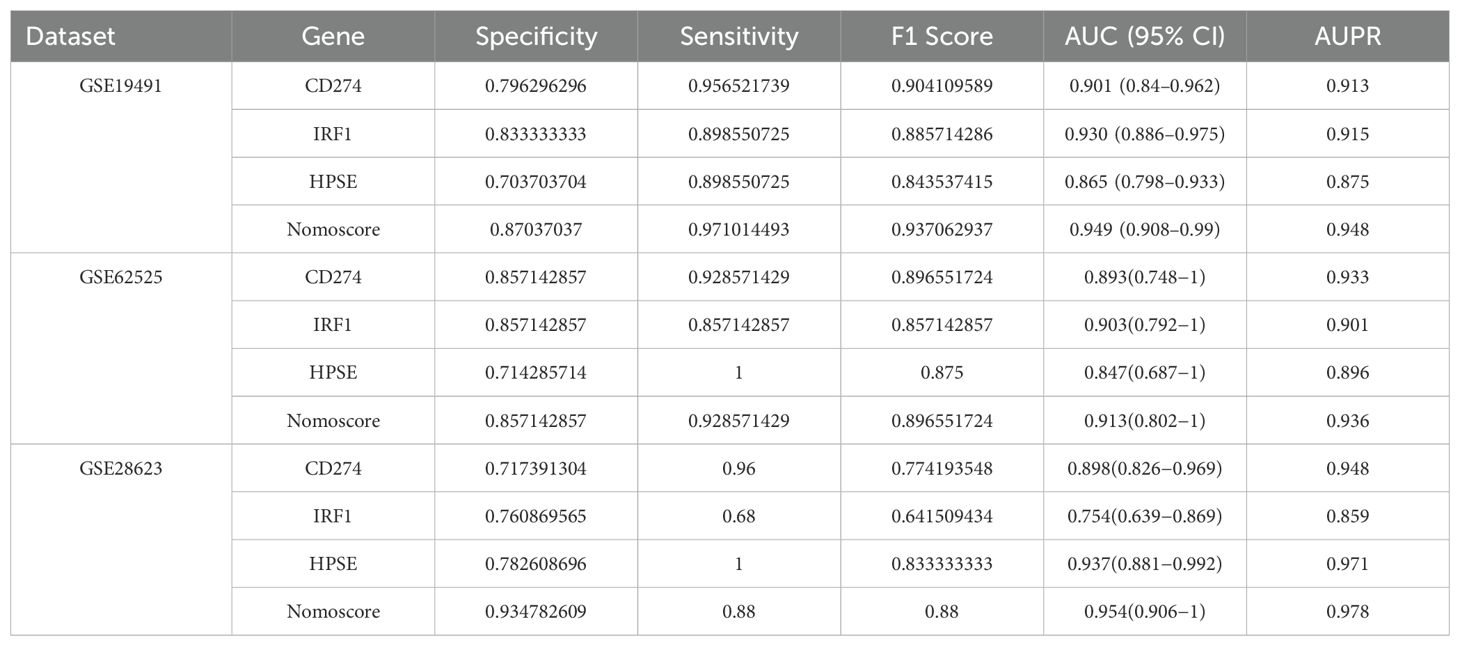
Table 1. Diagnostic performance of NETs-related hub genes.
Identification of drug-gene interactions
In this study, the DGIdb database was utilized to predict potential drugs that could interact with the hub genes related to NETs. A total of 46 potential drugs were screened out, including AMOPYROQUINE, RECOMBINANT CYTOKINE, PACMILIMAB, ENVAFOLIMAB, PIXATIMOD, and other drugs (Supplementary File 4). Additionally, in this study, Cytoscape 3.10.3 was employed to visualize the gene-drug interactions (Figure 6A).
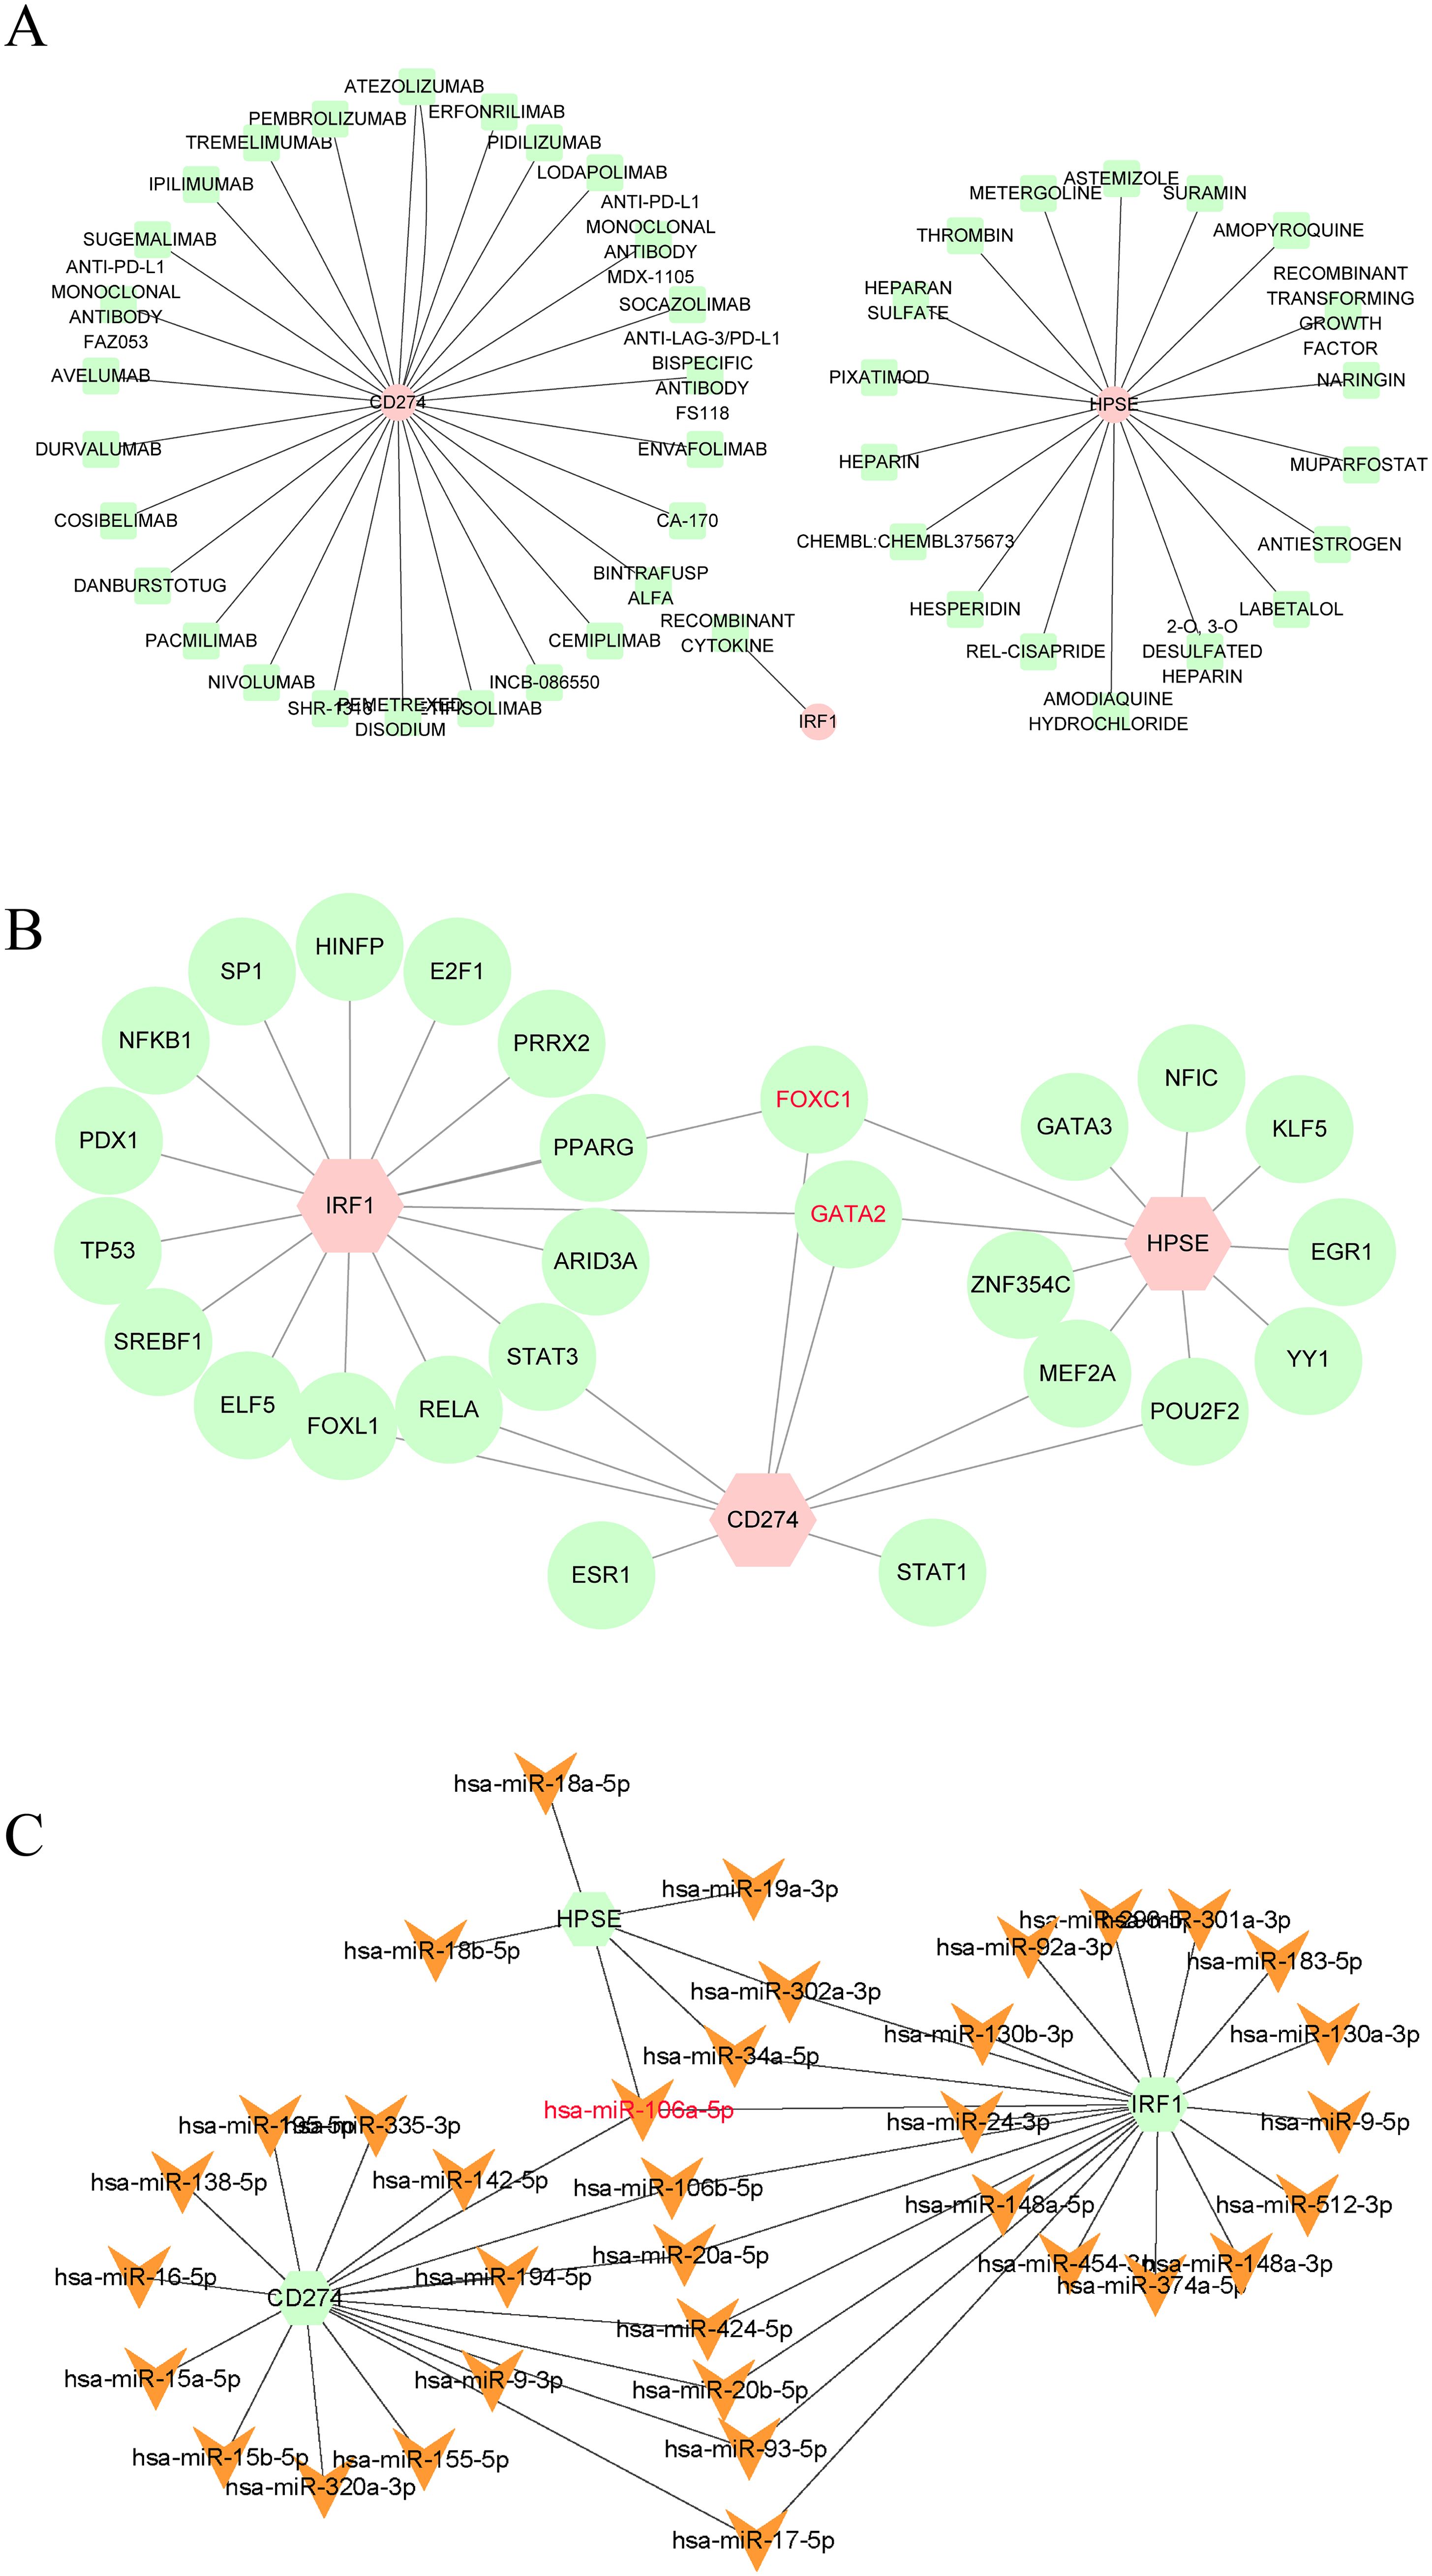
Figure 6. (A) Drugs-genes network of three hub genes. (B) TFs-genes regulatory network of three hub genes. (C) Genes-miRNAs regulatory network of three hub genes.
Construction of gene-TFs and gene-miRNAs interaction networks
In this study, we also constructed the gene-TFs and gene - miRNAs interaction networks to further explore the regulatory mechanisms of NETs-related hub genes. TFs and miRNAs have shown nonnegligible roles in the occurrence of diseases. Existing studies have demonstrated that TFs and miRNAs play crucial roles in the occurrence and development of TB (39–42). Therefore, in this study, we constructed the Gene-TFs and Gene-miRNAs interaction networks. According to the results (Figures 6B, C), FOXC1, GATA2, and hsa-miR-106a-5p interacted with the three hub genes, indicating that they may be the common regulatory factors of the three hub genes. FOXC1, GATA2, and hsa-miR-106a-5p may be the key core regulatory factors for the expression of the three hub genes.
Discussion
TB remains a major global public health challenge. ATB is the most infectious form of TB, and the early detection of ATB and LTBI is crucial for the control and cure of TB. The IGRA and the TST are currently the most commonly used methods for TB diagnosis. However, unfortunately, neither of these two methods can distinguish between ATB and LTBI (13, 14). This diagnostic gap urgently requires the identification of reliable biomarkers that can accurately distinguish between these two states. In this study, we aimed to identify NETs- related biomarkers for ATB and LTBI through bioinformatics analysis and machine - learning algorithms. The identified hub genes, CD274, IRF1, and HPSE, exhibited significant diagnostic performance, which provides a potential breakthrough for the diagnosis of TB.
Neutrophils are a key cell type in the host immune response to TB, and their role in TB has gradually received increasing attention. They have both protective effects and potential hazards (15, 43–47). In this study, we identified 88 DE - NRGs associated with ATB. Through machine learning algorithms, including the least absolute shrinkage and LASSO, RF, and SVM-RFE, CD274, IRF1, and HPSE were screened as key hub genes. These genes exhibited powerful diagnostic performance in differentiating ATB from LTBI, and the ROCcurve analysis confirmed their high accuracy.
CD274, also known as programmed death - ligand 1 (PD - L1), is involved in immune regulation. Previous studies have shown (48) that it plays a crucial role in immune regulation and immune escape mechanisms of various diseases. In the context of TB, previous studies (49, 50) have demonstrated its involvement in immune regulation and its potential role in host pathogen interactions. Research has shown (49) that MTB infection can induce high expression of CD274 in macrophages and neutrophils, thereby weakening the host’s anti - TB immune response. This phenomenon is closely related to the activation of the NF-κB signaling pathway, which drives the release of inflammatory factors (such as TNF-α, IL-6) in TB and simultaneously promotes the expression of CD274 (50). Additionally, The upregulation of CD274 may contribute to the progression from latent infection to ATB by inhibiting T-cell proliferation (49). Therefore, CD274 not only serves as a diagnostic biomarker, but the immune checkpoint pathway it regulates may also provide a new target for TB immunotherapy. In our study, the expression of CD274 in ATB was significantly higher than that in LTBI (Supplementary Figure 1), with an AUC value of 0.901 in the training set, further emphasizing its diagnostic value. The upregulation of CD274 in ATB may reflect an adaptive immune escape strategy adopted by MTB. By interacting with receptors on immune cells, CD274 may inhibit the immune response and promote the survival and reproduction of pathogens. The high diagnostic accuracy of CD274, as well as its biological significance, make it a promising therapeutic target and object for diagnostic development.
IRF1, a key transcription factor in immune responses (51, 52). regulates genes critical for host defense against MTB (53). Moreover, IRF1 is involved in the regulation of the Th1-type immune response, and IFN-γ secreted by Th1 cells is a key factor in controlling MTB infection (52). However, overactivation of IRF1 may trigger an excessive inflammatory response, leading to lung tissue damage, a phenomenon particularly prominent in the pathological process of ATB patients (53). IRF1 showed significant differential expression between ATB and LTBI (Supplementary Figure 1). The high diagnostic accuracy of IRF1 (AUC: 0.93) highlights its potential as a biomarker. Notably, the expression of IRF1 was positively correlated with the abundance of neutrophils, further supporting its role in NET formation and immune regulation. Dysregulated IRF1 activity may lead to the excessive inflammatory response observed in ATB, exacerbating tissue damage and disease severity. Targeting the IRF1-related pathway may thus emerge as a novel therapeutic strategy to mitigate TB-related inflammation.
Among mammalian endoglycosidases, heparanase (HPSE) is currently the only known enzyme capable of cleaving heparan sulfate (HS). By cleaving heparan sulfate, it can regulate the remodeling process of the basement membrane and the extracellular matrix. Additionally, it can also promote the release of numerous HS-related molecules, including cytokines, growth factors, and various enzymes. In previous studies (54–58), HPSE has been shown to contribute to the occurrence, metastasis, drug resistance, and poor prognosis of various tumors. Some studies have indicated (54, 59) that HPSE may act as an effector component of NETosis and be released by neutrophils, leading to tissue damage. Additionally, HPSE exacerbates the inflammatory response by activating the TLR4/NF-κB pathway (62), which is associated with the formation of chronic granulomas in TB. This study shows that HPSE is significantly positively correlated with Neutrophils, with an AUC value of 0.865, indicating its diagnostic relevance.
The diagnostic potential of CD274, IRF1 and HPSE in active tuberculosis (ATB) is supported by their strong positive correlation with neutrophil infiltration, as shown in validation datasets (GSE62525 and GSE28623). These genes maintained their diagnostic accuracy in the validation datasets, consistent with the discovery dataset. However, the lack of a significant correlation between IRF1 and neutrophils in GSE62525 indicates potential dataset - specific differences and suggests that further validation in larger cohorts is necessary. While the observed correlations highlight the clinical relevance of these genes, the observational nature of transcriptomic data limits causal inference. Emerging mechanistic studies in non-TB models provide plausible hypotheses: CD274 (PD-L1) promotes NET release via PI3K/Akt/mTOR signaling in endotoxin-induced lung injury (60), IRF1 drives ROS-dependent NETosis in LPS-challenged neutrophils (61), HPSE facilitates NET extrusion through heparan sulfate cleavage in cancer-associated inflammation (54, 59). Notably, whether these pathways operate in MTB-infected neutrophils remains unproven. The dataset-specific discrepancy in IRF1-neutrophil correlations further underscores the need for functional validation in TB-specific contexts. Future studies should integrate neutrophil-specific gene perturbation (e.g., CRISPR/Cas9 knockout in primary human neutrophils infected with virulent MTB) with single-cell transcriptomics to resolve whether these hub genes are selectively expressed in NETosis-committed subsets. Such approaches will clarify if these genes act as drivers of NETosis or merely bystanders marking neutrophil activation, ultimately bridging the gap between correlation and causality in ATB pathogenesis.
To ensure the robustness of the research results, we validated the excellent diagnostic performance of CD274, IRF1, and HPSE in the validation datasets (GSE62525 and GSE28623). Consistent with the discovery dataset, these hub genes showed a significant positive correlation with neutrophil abundance in the validation datasets and maintained their diagnostic accuracy. However, IRF1 did not show a significant correlation with neutrophils in the GSE62525 dataset, indicating that there may be dataset - specific differences and further validation in a larger cohort is needed.
In this study, 46 candidate drugs with potential interactions with NETs-related hub genes (CD274, IRF1, HPSE) were screened out through the DGIdb database. Existing evidence shows that Iron dysregulation plays an important role in the pathogenesis of TB: hepcidin serum can significantly increase the susceptibility to TB (62), and the abnormally elevated serum hepcidin levels in patients coinfected with MTB and HIV are closely related to disease progression (63, 64). Heparin, as a hepcidin inhibitor, has been confirmed by research (65) to be able to significantly inhibit the expression of hepcidin in human macrophages after MTB infection, thereby effectively inhibiting the replication process of intracellular MTB. Suramin, as a drug for the treatment of trypanosomiasis, is considered to enhance the sensitivity of multidrug-resistant (MDR-TB) and extensively drug-resistant (XDR-TB) strains to existing antibiotics by inhibiting the SOS repair system mediated by the RecA protein of MTB (66). Recombinant human interleukin-2 (IL-2) (67) and interferon-gamma (IFN-γ) (68), as recombinant cytokines, have shown positive effects in the treatment of TB. In the list of candidate drugs in this study, there are also various monoclonal antibodies against programmed death receptor 1 (PD-1), such as Pembrolizumab, Nivolumab, etc. Although these drugs are currently mainly used in the treatment of cancer, numerous studies (69–74) have shown that anti-PD-1 therapy has also demonstrated encouraging positive effects in the treatment of TB. These findings suggest hypothetical therapeutic potential of candidate drugs, including heparin and PD-1 inhibitors, for further investigation in tuberculosis, although their clinical application necessitates rigorous risk-benefit analysis. For instance, the anticoagulant properties of heparin may significantly elevate bleeding risk in TB patients with comorbidities (e.g., cirrhosis or peptic ulcers), and this risk could be synergistically amplified by first-line anti-TB agents such as rifampicin and isoniazid, which are known to induce thrombocytopenia (75–77). Additionally, the immunosuppressive effects of PD-1 inhibitors might compromise host defense mechanisms against MTB potentially leading to MTB reactivation or secondary infections (78). Therefore, the hypothetical anti-TB effects of these candidates would require rigorous validation in preclinical models to assess efficacy and safety, followed by clinical trials to systematically assess safety profiles, with particular emphasis on risk stratification for bleeding complications and immunosuppression-related adverse events.
We constructed regulatory networks linking genes, transcription factors (TFs), and miRNAs, identifying FOXC1, GATA2, and hsa-miR-106a-5p as core regulators (79). FOXC1 and GATA2 are transcription factors that play crucial roles in cell differentiation and immune response (80). Regulation of these genes may alter immune response-related gene expression against MTB. As a microRNA, hsa-miR-106a-5p may regulate the expression of key genes at the post-transcriptional level. Understanding these regulatory mechanisms can provide a deeper insight into the molecular basis of ATB and contribute to the development of novel therapeutic strategies targeting these regulators.
In conclusion, as a key factor in the pathogenesis of TB, especially ATB, the study of NETs can not only provide new biomarkers for the early diagnosis of TB but also offer a new direction for immunotherapy. However, there are still some limitations. The three GEO datasets utilized in this study (GSE19491, GSE62525, GSE28623) exhibit inherent variability in sample size (e.g., ATB sample sizes: 54, 14, and 49, respectively) and population sources (e.g., geographic and clinical characteristics, as detailed in Table 2), which may introduce demographic or clinical heterogeneity into the gene expression profiles. For instance, GSE62525 has a relatively small sample size, and the datasets likely derive from distinct patient cohorts. Nevertheless, despite these differences, the three hub genes (CD274, IRF1, HPSE) demonstrated consistent diagnostic performance across independent validation sets (AUC >0.75 for all genes). Prior studies have similarly shown that biomarker-based diagnostic models maintain robustness across heterogeneous populations and sample sizes (15, 16). This study is based on the bioinformatics analysis of existing datasets, and the results need to be further verified in a larger clinical cohort and through experimental studies. Future studies could further leverage cutting-edge spatial omics technologies to deepen our understanding of NETs-related gene dynamics in TB pathogenesis. For instance, whole transcriptome co-mapping at cellular resolution with spatial CITE-seq (81) could validate the spatial expression patterns of CD274, IRF1, and HPSE within granulomas or inflammatory niches, clarifying their roles in local immune modulation. Additionally, spatially resolved in vivo CRISPR screen sequencing via perturb-DBiT (82) would enable functional dissection of these hub genes in NETosis and bacterial containment, directly testing their causality in TB progression. Beyond infectious diseases, integrating multimodal tri-omics mapping (e.g., transcriptome-epigenome-proteome) (83) could unravel the spatial dynamics of these genes in neuroinflammation or brain development, potentially identifying conserved regulatory networks across pathologies. These approaches would bridge molecular signatures to tissue-scale pathophysiology, accelerating therapeutic discovery.
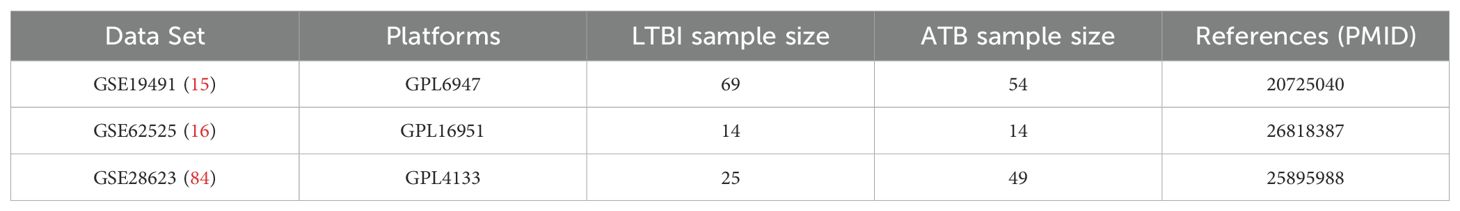
Table 2. Details regarding the 3 data sets, test platforms, numbers of samples and source documentation.
Data availability statement
The original contributions presented in the study are included in the article/Supplementary Material. Further inquiries can be directed to the corresponding authors.
Ethics statement
The manuscript presents research on animals that do not require ethical approval for their study.
Author contributions
SX: Methodology, Writing – original draft, Software, Data curation, Visualization. QA: Writing – review & editing, Data curation, Visualization, Validation. RL: Validation, Writing – review & editing, Visualization. YT: Supervision, Writing – review & editing, Funding acquisition. ZC: Supervision, Writing – review & editing, Data curation. DW: Conceptualization, Writing – review & editing, Supervision.
Funding
The author(s) declare that financial support was received for the research and/or publication of this article. This study was supported by the National Natural Science Foundation of China (No.32401117) and the Chengdu Municipal Bureau of Science and Technology (2024-YF05-01305-SN).
Conflict of interest
The authors declare that the research was conducted in the absence of any commercial or financial relationships that could be construed as a potential conflict of interest.
Generative AI statement
The author(s) declare that no Generative AI was used in the creation of this manuscript.
Publisher’s note
All claims expressed in this article are solely those of the authors and do not necessarily represent those of their affiliated organizations, or those of the publisher, the editors and the reviewers. Any product that may be evaluated in this article, or claim that may be made by its manufacturer, is not guaranteed or endorsed by the publisher.
Supplementary material
The Supplementary Material for this article can be found online at: https://www.frontiersin.org/articles/10.3389/fimmu.2025.1599667/full#supplementary-material
References
1. W.H. Organization. Global tuberculosis report (2024). Available online at: https://www.who.int/teams/global-tuberculosis-programme/tb-reports/global-tuberculosis-report-2024 (Accessed June 10, 2025).
2. Marks SM, Taylor Z, Qualls NL, Shrestha-Kuwahara RJ, Wilce MA, and Nguyen CH. Outcomes of contact investigations of infectious tuberculosis patients. Am J Respir Crit Care Med. (2000) 162:2033–8. doi: 10.1164/ajrccm.162.6.2004022
3. American Thoracic Society, MMWR. Targeted tuberculin testing and treatment of latent tuberculosis infection. In: Recommendations and reports: Morbidity and mortality weekly report. Recommendations and reports, (United States: American Thoracic Society) vol. 49. (2000). p. 1–51.
4. Kanabalan RD, Lee LJ, Lee TY, Chong PP, Hassan L, Ismail R, et al. Human tuberculosis and Mycobacterium tuberculosis complex: A review on genetic diversity, pathogenesis and omics approaches in host biomarkers discovery. Microbiological Res. (2021) 246:126674. doi: 10.1016/j.micres.2020.126674
5. Scriba TJ, Coussens AK, and Fletcher HA. Human immunology of tuberculosis. Microbiol Spectr. (2016) 4:TBTB2-0016-2016. doi: 10.1128/microbiolspec.TBTB2-0016-2016
6. Borkute RR, Woelke S, Pei G, and Dorhoi A. Neutrophils in tuberculosis: cell biology, cellular networking and multitasking in host defense. Int J Mol Sci. (2021) 22:4801. doi: 10.3390/ijms22094801
7. Hilda JN, Das S, Tripathy SP, and Hanna LE. Role of neutrophils in tuberculosis: A bird’s eye view. Innate Immun. (2020) 26:240–7. doi: 10.1177/1753425919881176
8. Panteleev AV, Nikitina IY, Burmistrova IA, Kosmiadi GA, Radaeva TV, Amansahedov RB, et al. Severe tuberculosis in humans correlates best with neutrophil abundance and lymphocyte deficiency and does not correlate with antigen-specific CD4 T-cell response. Front Immunol. (2017) 8:963. doi: 10.3389/fimmu.2017.00963
9. Parker HA, Forrester L, Kaldor CD, Dickerhof N, and Hampton MB. Antimicrobial activity of neutrophils against mycobacteria. Front Immunol. (2021) 12:782495. doi: 10.3389/fimmu.2021.782495
10. Arcos J, Diangelo LE, Scordo JM, Sasindran SJ, Moliva JI, Turner J, et al. Lung mucosa lining fluid modification of mycobacterium tuberculosis to reprogram human neutrophil killing mechanisms. J Infect Dis. (2015) 212:948–58. doi: 10.1093/infdis/jiv146
11. Ramos-Kichik V, Mondragón-Flores R, Mondragón-Castelán M, Gonzalez-Pozos S, Muñiz-Hernandez S, Rojas-Espinosa O, et al. Neutrophil extracellular traps are induced by Mycobacterium tuberculosis. Tuberculosis (Edinburgh Scotland). (2009) 89:29–37. doi: 10.1016/j.tube.2008.09.009
12. Van Der Meer AJ, Zeerleder S, Blok DC, Kager LM, Lede IO, Rahman W, et al. Neutrophil extracellular traps in patients with pulmonary tuberculosis. Respir Res. (2017) 18:181. doi: 10.1186/s12931-017-0663-1
13. Pai M and Behr M. Latent mycobacterium tuberculosis infection and interferon-gamma release assays. Microbiol Spectr. (2016) 4:TBTB2-0023-2016. doi: 10.1128/microbiolspec.TBTB2-0023-2016
14. Ludi Z, Sule AA, Samy RP, Putera I, Schrijver B, Hutchinson PE, et al. Diagnosis and biomarkers for ocular tuberculosis: From the present into the future. Theranostics. (2023) 13:2088–113. doi: 10.7150/thno.81488
15. Berry MP, Graham CM, Mcnab FW, Xu Z, Bloch SA, Oni T, et al. An interferon-inducible neutrophil-driven blood transcriptional signature in human tuberculosis. Nature. (2010) 466:973–7. doi: 10.1038/nature09247
16. Lee SW, Wu LS, Huang GM, Huang KY, Lee TY, Weng JT, et al. Gene expression profiling identifies candidate biomarkers for active and latent tuberculosis. BMC Bioinf. (2016) 17 Suppl 1:3. doi: 10.1186/s12859-015-0848-x
17. Shanmugasundaram U, Bucsan AN, Ganatra SR, Ibegbu C, Quezada M, Blair RV, et al. Pulmonary Mycobacterium tuberculosis control associates with CXCR3- and CCR6-expressing antigen-specific Th1 and Th17 cell recruitment. JCI Insight. (2020) 5:e137858. doi: 10.1172/jci.insight.137858
18. Tait DR, Hatherill M, Van Der Meeren O, Ginsberg AM, Van Brakel E, Salaun B, et al. Final analysis of a trial of M72/AS01(E) vaccine to prevent tuberculosis. N Engl J Med. (2019) 381:2429–39. doi: 10.1056/NEJMoa1909953
19. Eum SY, Kong JH, Hong MS, Lee YJ, Kim JH, Hwang SH, et al. Neutrophils are the predominant infected phagocytic cells in the airways of patients with active pulmonary TB. Chest. (2010) 137:122–8. doi: 10.1378/chest.09-0903
20. Mayer-Barber KD and Barber DL. Innate and adaptive cellular immune responses to mycobacterium tuberculosis infection. Cold Spring Harbor Perspect Med. (2015) 5:a018424. doi: 10.1101/cshperspect.a018424
21. Ulrichs T, Kosmiadi GA, Jörg S, Pradl L, Titukhina M, Mishenko V, et al. Differential organization of the local immune response in patients with active cavitary tuberculosis or with nonprogressive tuberculoma. J Infect Dis. (2005) 192:89–97. doi: 10.1086/430621
22. Ulrichs T and Kaufmann SH. New insights into the function of granulomas in human tuberculosis. J Pathol. (2006) 208:261–9. doi: 10.1002/path.1906
23. Davis S and Meltzer PS. GEOquery: a bridge between the gene expression omnibus (GEO) and bioConductor. Bioinf (Oxford England). (2007) 23:1846–7. doi: 10.1093/bioinformatics/btm254
24. Wu J, Zhang F, Zheng X, Zhang J, Cao P, Sun Z, et al. Identification of renal ischemia reperfusion injury subtypes and predictive strategies for delayed graft function and graft survival based on neutrophil extracellular trap-related genes. Front Immunol. (2022) 13:1047367. doi: 10.3389/fimmu.2022.1047367
25. Zhang Y, Guo L, Dai Q, Shang B, Xiao T, Di X, et al. A signature for pan-cancer prognosis based on neutrophil extracellular traps. J immunotherapy Cancer. (2022) 10:e004210. doi: 10.1136/jitc-2021-004210
26. Li C, Gao Z, Su B, Xu G, and Lin X. Data analysis methods for defining biomarkers from omics data. Analytical Bioanalytical Chem. (2022) 414:235–50. doi: 10.1007/s00216-021-03813-7
27. Yu G, Wang LG, Han Y, and He QY. clusterProfiler: an R package for comparing biological themes among gene clusters. Omics: J Integr Biol. (2012) 16:284–7. doi: 10.1089/omi.2011.0118
28. Newman AM, Liu CL, Green MR, Gentles AJ, Feng W, Xu Y, et al. Robust enumeration of cell subsets from tissue expression profiles. Nat Methods. (2015) 12:453–7. doi: 10.1038/nmeth.3337
29. Huang H. linkET: everything is linkable. In: R package version 0.0.3. San Francisco, California, USA: GitHub (2021). Available at: https://github.com/Hy4m/linkET. (Accessed June 10, 2025).
30. Wickham H. ggplot2: elegant graphics for data analysis. New York, NY, USA: Springer-Verlag New York (2016).
31. Li Z, Qin Y, Liu X, Chen J, Tang A, Yan S, et al. Identification of predictors for neurological outcome after cardiac arrest in peripheral blood mononuclear cells through integrated bioinformatics analysis and machine learning. Funct Integr Genomics. (2023) 23:83. doi: 10.1007/s10142-023-01016-0
32. Meyer D, Dimitriadou E, Hornik K, Weingessel A, Leisch F, Chang CC, et al. Misc functions of the department of statistics. Wien TU, (Austria: TU Wien) editor (2015). doi: 10.32614/CRAN.package.e1071.
33. Friedman J, Hastie T, and Tibshirani R. Regularization paths for generalized linear models via coordinate descent. J Stat software. (2010) 33:1–22. doi: 10.18637/jss.v033.i01
34. Liaw A and Wiener MC. Classification and regression by randomForest. (United States: R Foundation for Statistical Computing) (2007).
35. Dusa A. venn: draw venn diagrams. (United Kingdom: Comprehensive R Archive Network (CRAN)) (2024). doi: 10.32614/CRAN.package.venn.
36. Cannon M, Stevenson J, Stahl K, Basu R, Coffman A, Kiwala S, et al. DGIdb 5.0: rebuilding the drug-gene interaction database for precision medicine and drug discovery platforms. Nucleic Acids Res. (2024) 52:D1227–d1235. doi: 10.1093/nar/gkad1040
37. Zhou G, Soufan O, Ewald J, Hancock REW, Basu N, Xia J, et al. NetworkAnalyst 3.0: a visual analytics platform for comprehensive gene expression profiling and meta-analysis. Nucleic Acids Res. (2019) 47:W234–w241. doi: 10.1093/nar/gkz240
38. Skoufos G, Kakoulidis P, Tastsoglou S, Zacharopoulou E, Kotsira V, Miliotis M, et al. TarBase-v9.0 extends experimentally supported miRNA–gene interactions to cell-types and virally encoded miRNAs. Nucleic Acids Res. (2023) 52:D304–10. doi: 10.1093/nar/gkad1071
39. Grant NL, Kelly K, Maiello P, Abbott H, O'connor S, Lin PL, et al. Mycobacterium tuberculosis-specific CD4 T cells expressing transcription factors T-bet or RORγT associate with bacterial control in granulomas. mBio. (2023) 14:e0047723. doi: 10.1128/mbio.00477-23
40. Yang T and Ge B. miRNAs in immune responses to Mycobacterium tuberculosis infection. Cancer Lett. (2018) 431:22–30. doi: 10.1016/j.canlet.2018.05.028
41. Sinigaglia A, Peta E, Riccetti S, Venkateswaran S, Manganelli R, and Barzon L. Tuberculosis-associated microRNAs: from pathogenesis to disease biomarkers. Cells. (2020) 9:2160. doi: 10.3390/cells9102160
42. Gong Z, Li H, Cai Y, Stojkoska A, and Xie J. Biology of MarR family transcription factors and implications for targets of antibiotics against tuberculosis. J Cell Physiol. (2019) 234:19237–48. doi: 10.1002/jcp.28720
43. Brinkmann V, Reichard U, Goosmann C, Fauler B, Uhlemann Y, Weiss DS, et al. Neutrophil extracellular traps kill bacteria. Sci (New York N.Y.). (2004) 303:1532–5. doi: 10.1126/science.1092385
44. Papayannopoulos V. Neutrophil extracellular traps in immunity and disease, Nature reviews. Immunology. (2018) 18:134–47. doi: 10.1038/nri.2017.105
45. Cavalcante-Silva LHA, Almeida FS, Andrade AG, Comberlang FC, Cardoso LL, Vanderley SER, et al. Mycobacterium tuberculosis in a trap: the role of neutrophil extracellular traps in tuberculosis. Int J Mol Sci. (2023) 24:11385. doi: 10.3390/ijms241411385
46. Filio-Rodríguez G, Estrada-García I, Arce-Paredes P, Moreno-Altamirano MM, Islas-Trujillo S, Ponce-Regalado MD, et al. In vivo induction of neutrophil extracellular traps by Mycobacterium tuberculosis in a Guinea pig model. Innate Immun. (2017) 23:625–37. doi: 10.1177/1753425917732406
47. Nakamura K, Nakayama H, Sasaki S, Takahashi K, and Iwabuchi K. Mycobacterium avium-intracellulare complex promote release of pro-inflammatory enzymes matrix metalloproteinases by inducing neutrophil extracellular trap formation. Sci Rep. (2022) 12:5181. doi: 10.1038/s41598-022-09017-y
48. Topalian SL, Drake CG, and Pardoll DM. Targeting the PD-1/B7-H1(PD-L1) pathway to activate anti-tumor immunity. Curr Opin Immunol. (2012) 24:207–12. doi: 10.1016/j.coi.2011.12.009
49. Yu XW, Zhang JA, and Xie JP. Progress in PD-1/PD-L1, PD-L2 signaling pathway and its role in host anti-tuberculosis immunity. Zhonghua jie he he hu xi za zhi = Zhonghua jiehe he huxi zazhi = Chin J tuberculosis Respir Dis. (2024) 47:485–9. doi: 10.3760/cma.j.cn112147-20230904-00133
50. Yang Y, Fu Y, Sheng S, Ji C, Pu X, and Xu G. Screening for diagnostic targets in tuberculosis and study on its pathogenic mechanism based on mRNA sequencing technology and miRNA-mRNA-pathway regulatory network. Front Immunol. (2023) 14:1038647. doi: 10.3389/fimmu.2023.1038647
51. Taniguchi T, Ogasawara K, Takaoka A, and Tanaka N. IRF family of transcription factors as regulators of host defense. Annu Rev Immunol. (2001) 19:623–55. doi: 10.1146/annurev.immunol.19.1.623
52. Taki S, Sato T, Ogasawara K, Fukuda T, Sato M, Hida S, et al. Multistage regulation of Th1-type immune responses by the transcription factor IRF-1. Immunity. (1997) 6:673–9. doi: 10.1016/s1074-7613(00)80443-4
53. Wu L, Cheng Q, Wen Z, Song Y, Zhu Y, and Wang L. IRF1 as a potential biomarker in Mycobacterium tuberculosis infection. J Cell Mol Med. (2021) 25:7270–9. doi: 10.1111/jcmm.16756
54. Hammond E, Khurana A, Shridhar V, and Dredge K. The role of heparanase and sulfatases in the modification of heparan sulfate proteoglycans within the tumor microenvironment and opportunities for novel cancer therapeutics. Front Oncol. (2014) 4:195. doi: 10.3389/fonc.2014.00195
55. Zheng LD, Tong QS, Tang ST, Du ZY, Liu Y, Jiang GS, et al. Expression and clinical significance of heparanase in neuroblastoma. World J pediatrics: WJP. (2009) 5:206–10. doi: 10.1007/s12519-009-0039-9
56. Rivara S, Milazzo FM, and Giannini G. Heparanase: a rainbow pharmacological target associated to multiple pathologies including rare diseases. Future medicinal Chem. (2016) 8:647–80. doi: 10.4155/fmc-2016-0012
57. Edovitsky E, Elkin M, Zcharia E, Peretz T, and Vlodavsky I. Heparanase gene silencing, tumor invasiveness, angiogenesis, and metastasis. J Natl Cancer Institute. (2004) 96:1219–30. doi: 10.1093/jnci/djh230
58. Shteingauz A, Boyango I, Naroditsky I, Hammond E, Gruber M, Doweck I, et al. Heparanase enhances tumor growth and chemoresistance by promoting autophagy. Cancer Res. (2015) 75:3946–57. doi: 10.1158/0008-5472.Can-15-0037
59. Ishai-Michaeli R, Eldor A, and Vlodavsky I. Heparanase activity expressed by platelets, neutrophils, and lymphoma cells releases active fibroblast growth factor from extracellular matrix. Cell Regul. (1990) 1:833–42. doi: 10.1091/mbc.1.11.833
60. Zhu CL, Xie J, Zhao ZZ, Li P, Liu Q, Guo Y, et al. PD-L1 maintains neutrophil extracellular traps release by inhibiting neutrophil autophagy in endotoxin-induced lung injury. Front Immunol. (2022) 13:949217. doi: 10.3389/fimmu.2022.949217
61. Liu S, Yue Y, Pan P, Zhang L, Su X, Li H, et al. IRF-1 intervention in the classical ROS-dependent release of NETs during LPS-induced acute lung injury in mice. Inflammation. (2019) 42:387–403. doi: 10.1007/s10753-018-0903-7
62. Gangaidzo IT, Moyo VM, Mvundura E, Aggrey G, Murphree NL, Khumalo H, et al. Association of pulmonary tuberculosis with increased dietary iron. J Infect Dis. (2001) 184:936–9. doi: 10.1086/323203
63. Minchella PA, Armitage AE, Darboe B, Jallow MW, Drakesmith H, Jaye A, et al. Elevated hepcidin at HIV diagnosis is associated with incident tuberculosis in a retrospective cohort study. Int J tuberculosis Lung disease: Off J Int Union against Tuberculosis Lung Dis. (2014) 18:1337–9. doi: 10.5588/ijtld.14.0143
64. Kerkhoff AD, Meintjes G, Burton R, Vogt M, Wood R, Lawn SD, et al. Relationship between blood concentrations of hepcidin and anemia severity, mycobacterial burden, and mortality among patients with HIV-associated tuberculosis. J Infect Dis. (2016) 213:61–70. doi: 10.1093/infdis/jiv364
65. Abreu R, Essler L, Loy A, Quinn F, and Giri P. Heparin inhibits intracellular Mycobacterium tuberculosis bacterial replication by reducing iron levels in human macrophages. Sci Rep. (2018) 8:7296. doi: 10.1038/s41598-018-25480-y
66. Zaragoza-Huesca D, Rodenas MC, Peñas-Martínez J, Pardo-Sánchez I, Peña-García J, Espín S, et al. Suramin, a drug for the treatment of trypanosomiasis, reduces the prothrombotic and metastatic phenotypes of colorectal cancer cells by inhibiting hepsin. BioMed Pharmacother. (2023) 168:115814. doi: 10.1016/j.biopha.2023.115814
67. Zhang R, Xi X, Wang C, Pan Y, Ge C, Zhang L, et al. Therapeutic effects of recombinant human interleukin 2 as adjunctive immunotherapy against tuberculosis: A systematic review and meta-analysis. PloS One. (2018) 13:e0201025. doi: 10.1371/journal.pone.0201025
68. Reljic R. IFN-gamma therapy of tuberculosis and related infections. J Interferon Cytokine research: Off J Int Soc Interferon Cytokine Res. (2007) 27:353–64. doi: 10.1089/jir.2006.0103
69. Kee S-J, Kwon Y-S, Park Y-W, Cho Y-N, Lee S-J, Kim T-J, et al. Dysfunction of natural killer T cells in patients with active Mycobacterium tuberculosis infection. Infect Immun. (2012) 80:2100–8. doi: 10.1128/iai.06018-11
70. Singh A, Dey AB, Mohan A, and Mitra DK. Programmed death-1 receptor suppresses γ-IFN producing NKT cells in human tuberculosis. Tuberculosis (Edinburgh Scotland). (2014) 94:197–206. doi: 10.1016/j.tube.2014.01.005
71. Adekambi T, Ibegbu CC, Kalokhe AS, Yu T, Ray SM, Rengarajan J, et al. Distinct effector memory CD4+ T cell signatures in latent Mycobacterium tuberculosis infection, BCG vaccination and clinically resolved tuberculosis. PloS One. (2012) 7:e36046. doi: 10.1371/journal.pone.0036046
72. Hassan SS, Akram M, King EC, Dockrell HM, and Cliff JM. PD-1 PD-L1 and PD-L2 gene expression on T-cells and natural killer cells declines in conjunction with a reduction in PD-1 protein during the intensive phase of tuberculosis treatment. PloS One. (2015) 10:e0137646. doi: 10.1371/journal.pone.0137646
73. Zumla A, Rao M, Parida SK, Keshavjee S, Cassell G, Wallis R, et al. Inflammation and tuberculosis: host-directed therapies. J Intern Med. (2015) 277:373–87. doi: 10.1111/joim.12256
74. Bandaru A, Devalraju KP, Paidipally P, Dhiman R, Venkatasubramanian S, Barnes PF, et al. Phosphorylated STAT3 and PD-1 regulate IL-17 production and IL-23 receptor expression in Mycobacterium tuberculosis infection. Eur J Immunol. (2014) 44:2013–24. doi: 10.1002/eji.201343680
75. Martins MA, Reis AM, Sales MF, Nobre V, Ribeiro DD, Rocha MO, et al. Rifampicin-warfarin interaction leading to macroscopic hematuria: a case report and review of the literature. BMC Pharmacol Toxicol. (2013) 14:27. doi: 10.1186/2050-6511-14-27
76. Hwang KW, Choi JH, Lee SY, Lee SH, Chon MK, Lee J, et al. Oral anticoagulants and concurrent rifampin administration in tuberculosis patients with non-valvular atrial fibrillation. BMC Cardiovasc Disord. (2023) 23:182. doi: 10.1186/s12872-023-03212-z
77. Kuwabara G, Tazoe K, Imoto W, Yamairi K, Shibata W, Oshima K, et al. Isoniazid-induced immune thrombocytopenia. Intern Med. (2021) 60:3639–43. doi: 10.2169/internalmedicine.6520-20
78. Chai Q, Lu Z, and Liu CH. Host defense mechanisms against Mycobacterium tuberculosis. Cell Mol Life Sci. (2020) 77:1859–78. doi: 10.1007/s00018-019-03353-5
79. Onodera K, Fujiwara T, Onishi Y, Itoh-Nakadai A, Okitsu Y, Fukuhara N, et al. GATA2 regulates dendritic cell differentiation. Blood. (2016) 128:508–18. doi: 10.1182/blood-2016-02-698118
80. Wang Y, Ma X, Huang J, Yang X, Kang M, Sun X, et al. Somatic FOXC1 insertion mutation remodels the immune microenvironment and promotes the progression of childhood acute lymphoblastic leukemia. Cell Death Dis. (2022) 13:431. doi: 10.1038/s41419-022-04873-y
81. Liu Y, Distasio M, Su G, Asashima H, Enninful A, Qin X, et al. High-plex protein and whole transcriptome co-mapping at cellular resolution with spatial CITE-seq. Nat Biotechnol. (2023) 41:1405–9. doi: 10.1038/s41587-023-01676-0
82. Baysoy A, Tian X, Zhang F, Renauer P, Bai Z, Shi H, et al. Spatially Resolved in vivo CRISPR Screen Sequencing via Perturb-DBiT. bioRxiv: preprint server Biol. (2024). doi: 10.1101/2024.11.18.624106
83. Zhang D, Rubio Rodríguez-Kirby LA, Lin Y, Song M, Wang L, Wang L, et al. Spatial dynamics of mammalian brain development and neuroinflammation by multimodal tri-omics mapping. bioRxiv: preprint server Biol. (2024). doi: 10.1101/2024.07.28.605493
Keywords: active tuberculosis (ATB), latent tuberculosis infection (LTBI), diagnosis, neutrophil extracellular traps (NETs), machine learning
Citation: Xia S, An Q, Lin R, Tu Y, Chen Z and Wang D (2025) Identification and validation of NETs-related biomarkers in active tuberculosis through bioinformatics analysis and machine learning algorithms. Front. Immunol. 16:1599667. doi: 10.3389/fimmu.2025.1599667
Received: 25 March 2025; Accepted: 30 May 2025;
Published: 18 June 2025.
Edited by:
Ramalingam Bethunaickan, National Institute of Research in Tuberculosis (ICMR), IndiaReviewed by:
Fu Gao, Yale University, United StatesXiaoqing Cathy Cheng, Washington University in St. Louis, United States
Wanjie Yang, The University of Texas at Austin, United States
Shuozhen Bao, Yale University, United States
Copyright © 2025 Xia, An, Lin, Tu, Chen and Wang. This is an open-access article distributed under the terms of the Creative Commons Attribution License (CC BY). The use, distribution or reproduction in other forums is permitted, provided the original author(s) and the copyright owner(s) are credited and that the original publication in this journal is cited, in accordance with accepted academic practice. No use, distribution or reproduction is permitted which does not comply with these terms.
*Correspondence: Dongmei Wang, aGVycmluZ2RvbmdAMTI2LmNvbQ==; Zhu Chen, Mjc3Nzk2MzYwQHFxLmNvbQ==