 Leonie Caroline Voß1
 Constantin Schmidt1,2
 Aenne Harberts1,2,3
 Michael Spohn4,5,6Peter Bradtke1Alina Borchers7,8,9Stefanie Fertig1Joanna Schmid1
 Friedrich Koch-Nolte1
 Christian F. Krebs7,8,9
 Friederike Raczkowski1*†
 Hans-Willi Mittrücker1,8*†
- 1Department for Immunology, University Medical Center Hamburg-Eppendorf, Hamburg, Germany
- 2I. Department of Medicine, University Medical Center Hamburg-Eppendorf, Hamburg, Germany
- 3Division of Gastroenterology, Department of Medicine, University of California San Diego, La Jolla, CA, United States
- 4Clinic of Pediatric Hematology and Oncology, University Medical Center Hamburg-Eppendorf, Hamburg, Germany
- 5Research Institute Children’s Cancer Center Hamburg, Hamburg, Germany
- 6Bioinformatics Core, University Medical Center Hamburg-Eppendorf, Hamburg, Germany
- 7III. Department of Medicine, Division of Translational Immunology, University Medical Center Hamburg-Eppendorf, Hamburg, Germany
- 8Hamburg Center for Translational Immunology (HCTI), University Medical Center Hamburg-Eppendorf, Hamburg, Germany
- 9Hamburg Center for Kidney Health (HCKH), University Medical Center Hamburg-Eppendorf, Hamburg, Germany
FoxP3+ regulatory T (Treg) cells restrict excessive immune responses and immunopathology as well as reactivity to self or environmental antigens and thus are crucial for peripheral immune tolerance. The transcription factor Interferon Regulatory Factor 4 (IRF4) controls differentiation and function of T cells. In Treg cells, IRF4 is required for peripheral activation and maturation to effector Treg (eTreg) cells with enhanced suppressive function. However, the mechanisms of Treg cell regulation by IRF4 are not fully understood. Here, we analyze the role of IRF4 in differentiation and maintenance of Treg cells using IRF4-deficient mice and a T cell transfer model, that allows Irf4 inactivation in peripheral T cells. We demonstrate that loss of one Irf4 allele already results in impaired eTreg cell differentiation and decreased Treg cell homeostasis, indicating that IRF4 controls peripheral Treg cell differentiation in a gene dosage dependent mode. Peripheral Irf4 inactivation was also associated with enhanced production of inflammatory but also inhibitory cytokines by Treg cells. ATAC sequencing of Treg cells after mutation of one or both Irf4 alleles revealed regions with altered accessibility in genes involved in Treg cell function. In the FoxP3 gene, Irf4 inactivation resulted in reduced ATAC signals in the promoter region and in the conserved non-coding sequence (CNS) 2, required for stability of FoxP3 expression in peripheral Treg cells in response to TCR stimulation. IRF4-deficient Treg cells also displayed a reduction in open chromatin in several Treg cell specific super enhancers, mainly located in proximity to potential IRF4 binding sites. In conclusion, our results demonstrate that IRF4 controls peripheral Treg cell differentiation and homeostasis in a gene dosage dependent manner.
Introduction
The transcription factor Interferon Regulatory Factor-4 (IRF4) is expressed in T and B cells as well as myeloid cells such as dendritic cells, monocytes, and macrophages (1). In T cells, IRF4 targets include genes involved in differentiation and effector function but also genes controlling fundamental cellular processes such as proliferation and metabolism. Due to the wide spectrum of target genes, IRF4 regulates differentiation and function of most, if not all peripheral CD4+ and CD8+ T cell subsets (2–6). Because of this crucial role in T cells and similar important functions in B cells, deficiency of IRF4 or point mutation in its DNA binding or regulatory domains cause severe immunodeficiency in humans (7–9). Binding sites for IRF4 are found in promotors but also in regulatory elements distant from the promotors of target genes. IRF4 is therefore also considered a pioneering factor associated with chromatin remodeling and thereby enhancing accessibility of genes for other transcription factors including lineage-specific transcription factors (10–12). Several sequence motifs have been identified as IRF4 binding sites. IRF4 can bind as a homodimer to interferon stimulated response elements (ISRE). Ets-IRF composite elements (EICE) are recognized in cooperation with the transcription factors PU.1 and SpiB, and activator protein 1 (AP-1)-IRF composite elements (AICE) in cooperation with BATF and heterodimers of Jun family members (13–16). IRF4 binds with different affinities to these elements, thus occupation of individual binding sites depends on the concentration of IRF4. It could also be shown, that induction of IRF4 expression directly correlates with the strength of the TCR signal. Therefore, IRF4 is able to translate the quality of the TCR signal into distinct fates of T cell differentiation (6, 11, 16). As a consequence, even mutation of one Irf4 allele can already cause significantly altered T cell responses (17–21).
FoxP3+ regulatory T (Treg) cells are essential for limiting excessive immune responses and immunopathology. They also restrict reaction to self or harmless environmental antigens and thus are crucial for peripheral immune tolerance. Treg cells are either generated in the thymus as a consequence of moderate reactivity to self-antigens or can mature from peripheral CD4+ T cells in response to environmental antigens, e.g. food or gut commensal-derived antigens (22–24). Expression of the transcription factor FoxP3 is essential for Treg cell differentiation, maintenance, and suppressive function (25–31), and FoxP3 deficiency results in severe autoimmunity in mice and humans (32, 33). FoxP3 expression does not require continuous TCR signaling. However, inactivation of the TCR in peripheral Treg cells results in impaired Treg cell homeostasis and inability to mature to highly suppressive effector Treg cells (eTreg cells) with systemic autoimmunity as a consequence (34, 35).
FoxP3 interacts with several transcription factors including IRF4 (36, 37). Treg cells express IRF4, and the transcription factor is further upregulated in CD44+ eTreg cells (4). In Irf4-/- mice, Treg cells have a naïve-like phenotype with impaired CD62L downregulation and reduced expression of activation markers such as CTLA-4, ICOS, or ST2 (encoded by Il1Rl1), and Irf4-/- mice show absence of Treg cells in mucosal sites (4, 38). Treg-cell restricted Irf4 inactivation results in autoimmunity due to impaired eTreg-cell formation (36, 39) but also delayed tumor growth as consequence of reduced accumulation of eTreg cells in tumors (40). In line with these results, impaired suppressive function of Treg cells after peripheral TCR inactivation is in large part caused by a failure to upregulate IRF4 (34, 35). Furthermore, impaired stability of IRF4 in Treg cells due to a defect in protein SUMOylation results in development of autoimmunity (41). Overall, these observations demonstrate a crucial role for IRF4 in Treg cells, particularly in the differentiation of eTreg cells.
Here, we analyze the differentiation and maintenance of peripheral Treg cells using mice constitutively deficient in one or both Irf4 alleles as well as a T cell transfer model that allows inactivation of Irf4 alleles in peripheral T cells. Our results show that IRF4 controls peripheral Treg cell differentiation and homeostasis in a gene dosage-dependent manner. Induced inactivation of one or both Irf4 alleles resulted in reduced expression of proteins associated with eTreg cell function and reduced suppressive capacity, as well as impaired maintenance of peripheral Treg cell populations. ATAC sequencing revealed that Irf4 inactivation was associated with reduced accessibility of genes involved in Treg cell function including Foxp3 and several genes associated with Treg cell specific super enhancers.
Materials and methods
Mice and infection with Listeria monocytogenes
Irf4-/- mice (B6.129P2-Irf4tm1Mak/J) (42), Irf4fl/fl mice (43), Rosa-CreERT2 mice (44), congenic CD90.1 mice (B6.PL-Thy1a/CyJ), congenic CD45.1 mice (B6.SJL-Ptprca Pepcb/BoyJ), Rag1-/- mice (B6.129S7-Rag1tm1Mom/J) (45) and FIR FoxP3 reporter mice (C57BL/6-Foxp3tm1Flv/J) (46) were maintained on a C57BL/6 background. All other mice used in experiments were derived from intercrosses of these strains. Genotypes of mice were determined by PCR or by flow cytometry of tail blood samples as described previously (21, 42, 43). Mice were housed under specific pathogen-free conditions in the animal facility of the University Medical Center Hamburg-Eppendorf. Mouse experiments were performed according to the guidelines of the German animal protection law and experimental protocols were approved by the local committee for animal experiments of the City of Hamburg (registration numbers: N017/2017, N055/2019, N068/2021, N150/2021). Mice were infected i.v. with 5-10×103 colony-forming units of a L. monocytogenes strain recombinant for ovalbumin (LmOVA) (47). Titers in inocula were controlled by plating serial dilutions on tryptic soy broth agar plates and counting the colonies after 2 days of incubation at room temperature.
T cell isolation and in vitro stimulation
Three minutes before harvesting the organs, mice received an i.v. injection with 50 μg anti-ART2A nanobody (clone: s+16) to prevent NAD+-induced cell death and 2.5 μg of PerCP-conjugated anti-CD45 antibody (clone 30F-11, Biolegend) to stain intravascular cells (48, 49). Peripheral blood was aspirated from the heart and mixed with heparin to prevent coagulation. Lysis buffer containing 155 mM NH4Cl, 10 mM KHCO3, 100 μM EDTA, pH 7.2 was added for an incubation time of 3 minutes to lyse erythrocytes. Spleens were forced through a 70 μm cell strainer, then erythrocytes were lysed as described above and cells were filtered through a 40 μm cell strainer. Mesenteric lymph nodes were forced through a 30 μm cell strainer. Bone marrow was extracted from the femur and erythrocytes were lysed as described before. The gall bladder was removed from the liver. Liver, kidney and lung were minced, then digested for 45 minutes at 37°C in RPMI medium containing DNAse 1 (10 U/ml, Sigma Aldrich, St. Louis, MO) and collagenase D (0,25 mg/ml, Roche Diagnostics, Basel, Switzerland). After digestion, tissues were further dispersed in a gentleMACS Octo Dissociator (Milteny Biotec, Bergisch Gladbach, Germany). The cell suspension was then centrifuged with 40% Percoll solution (GE Healthcare, Chicago, IL) for lymphocyte enrichment. Cells were collected, washed with PBS, filtered through a 30 μm cell strainer, and remaining erythrocytes were lysed as described above. Colon and caecum were harvested and after removal of lymphoid tissue, they were cut open longitudinally and washed with PBS. Intraepithelial lymphocytes (IEL) were isolated by incubating the intestinal tissue in HBSS with 1mM dithioerythritol for 20 minutes at 37°C. After collecting the supernatants that contained the IELs, the lamina propria lymphocytes (LPL) were isolated from the tissue by incubation in Hanks’ Balanced Salt Solution (HBSS without Ca2+ and Mg2+) containing collagenase (1 mg/ml, Roche) and DNAse (10 U/ml, Sigma Aldrich, St. Louis, MO) for 45 minutes at 37°C and subsequent forcing through a 100 μm cell strainer. Cells were washed and pooled with the supernatants containing the IELs. Using a 2-phase density centrifugation with Percoll 40% and Percoll 70% (GE Healthcare), lymphocytes were enriched and then washed again with PBS containing 0.2% bovine serum albumin.
In some experiments, spleen cells were stimulated before FACS analysis. Cells were incubated for 4h at 37°C with IMDM medium containing 5% FCS, L-glutamine, gentamicin, 2-mercaptoethanol. For polyclonal stimulation, phorbol 12-myristate 13-acetatae (PMA, 50 ng/ml, Sigma Aldrich, St. Louis, MO) and ionomycin (1 μM, Sigma Aldrich) were added. Brefeldin A (10 μg/ml, Sigma Aldrich) was added to all samples to impede cytokine secretion. Cytokines and activation markers were analyzed with antibody staining and flow cytometry.
Flow cytometry analysis
For extracellular staining, cells were incubated on ice with PBS containing 1:100 rat serum and 10 μg/ml anti-Fc-receptor mAb (clone 2.4G2, BioXCell, West Lebanon, NH) to reduce unspecific antibody binding and then stained with fluorochrome-conjugated antibodies for 15 minutes. The fixable dead cell stain Pacific Orange succinimidyl ester (Life Technologies, Carlsbad, CA) was used to identify dead cells. For intracellular staining, the FoxP3/Transcription Factor Staining Buffer Set (eBioscience) was used according to the manufacturer`s protocol. To stain Irf4+/fl×CreERT2 and Irf4-/fl×CreERT2 T cells intracellularly, they were first fixated with 3.7% formaldehyde for 30 minutes, then washed with PBS 1% FCS and then permeabilized for 5 minutes at RT with 0,1% Igepal CA-630 (Sigma Aldrich). Cells were washed again with PBS 1% FCS and then incubated with the fluorochrome-conjugated antibodies in PBS 1% FCS for 20 minutes. Cells were washed twice with PBS 1% FCS and stored at 4°C until acquisition.
Cells were measured using a FACS Canto II, a FACSCelesta, a FACSSymphony A1 or a FACS Fortessa (all BD Biosciences) and analyzed with FlowJo Software (BD Bioscience).
Fluorochrome-conjugated antibodies against murine TCRß (clone H57-597, BV605), CD4 (clone RM4-5, BV650, AF700), CD11b (clone M1/70, V500), CD19 (clone 6D5, V500), CD39 (clone 24DMS1, PE-Cy7), CD44 (clone IM7, BV785), CD45 (clone 30F-11, PerCP, PercPCy5.5), CD45.1 (clone A20, V500), CD62L (clone MEL-14, APC-Cy7), CD73 (clone TY/11.8, PE), CD90.1 (clone OX-7, BV786, APCCy7), ICOS (clone 7E.17G9, APC), CTLA-4 (Clone UC10-4F10-11, PE), TIGIT (Clone 1G9, V421), Btla (clone 6A6, PE-Cy7), GITR (clone DTA-1, PE), ST2 (Clone RMST2-2, PE-Cy7), LRRC32 (clone F011-5, PE-Cy7), CXCR3 (clone CXCR3-173, APC), CCR6 (clone 140706, V450), IRF4 (clone 3E4, PE-Cy7), FoxP3 (clone FJK-16S, V450, APC), TCF-7 (clone S33-966, V450), Bcl-2 (clone BCL/10C4, PE-Cy7), Bcl-X (clone 54H6, PE-Cy7), Helios (Clone 22F6, PE), Tbet (clone 4B10, PE-Cy7), Blimp-1 (clone 5E7, PE), TGF-β/LAP (clone TW7-16B4, V450), IL-2 (clone JES6-5H4, PE), IFN-γ (clone XMG1.2, APCCy7), Ki-67 (clone SolA15, PE), and PCNA (PC10, APC) were obtained from Biolegend, eBioscience or BD Bioscience.
PCR for modified Irf4 alleles
The Cre-induced deletion of exons I and II was determined using flow cytometry to sort GFP+ and GFP- CD4+ T cells from Irf4+/fl×CreERT2 and Irf4−/fl×CreERT2 mice following tamoxifen treatment. Genomic DNA was PCR amplified using primers targeting a region 5′ of Exon I (TGC CTT TGG GAC GGA TGC TC) and a region within Exon III (CAG AGC ACA TCG TAA TCT TGT CTT CC).
T cell transfer
T cells were isolated by negative selection from spleens of donor mice using the EasySep™ Mouse T cell Isolation Kit (Stemcell Technologies, Vancouver, Canada) according to the manufacturer’s protocol. For co-transfer experiments, purified T cells from donor mice, which differed in CD90.1 and CD90.2 expression, were mixed to a 1:1 ratio, and 4-8×10⁵ T cells per mouse in 200 μl of sterile PBS were transferred intravenously into CD45.1+ Rag1-/- mice. Purification and subsequent mixing of cells were controlled by FACS analysis. To activate the Cre recombinase in vivo, mice received i.p. 2mg per day of tamoxifen (Sigma Aldrich) dissolved in corn oil (Sigma Aldrich) on 5 consecutive days.
In vitro suppression assay
CD4+ T cells were isolated by negative selection from spleens of FIR×Irf4−/fl×CreERT2 mice using the EasySepTM Mouse CD4+ T cell Isolation Kit (Stemcell Technologies) according to the manufacturer’s protocol. FIR+ FoxP3+ cells were FACS-sorted and then expanded in the presence of Dynabeads™ Mouse T-Activator CD3/CD28 (Life Technologies, Carlsbad, CA) and 2000 U IL-2/mL. After 3 days, 4-hydroxytamoxifen was added to some of the cultures. After 9 days, GFP- and GFP+ Treg cells were sorted and co-cultured in different ratios with Treg cell-depleted and eFluor 670-labelled responder CD4+ T cells from CD90.1+ mice in the presence of Dynabeads™ Mouse T-Activator CD3/CD28 and 30 U IL-2/mL. After 3 days, proliferation of CD90.1+ CD4+ T cells was determined by analyzing loss of eFluor 670 staining by flow cytometry.
Assay for transposase-accessible chromatin sequencing
T cells of CD90.1+ and CD90.2+ Irf4+/fl×CreERT2 mice and T cells of CD90.1- and CD90.2+ Irf4-/fl×CreERT2 mice were isolated, mixed to a 1:1 ratio, and 8×10⁵ T cells per mouse were transferred intravenously into naïve CD45.1+ Rag1-/- mice. Rag1-/- mice received tamoxifen injections as described above 4–5 weeks after reconstitution. Mice were infected with LmOVA after 5 more weeks and analyzed after another 8 days. CD4+ T cells were isolated from the spleen and FACS-sorted for GFP- Irf4+/fl, GFP+ Irf4+/fl, GFP- Irf4-/fl and GFP+ Irf4-/fl subsets. Cells were analyzed by ATAC-seq (Assay for Transposase-Accessible Chromatin using sequencing) using the Chromium Single Cell ATAC-Sequencing Kit (10x Genomics, Leiden, The Netherlands) according to the manufacturer’s protocols.
Raw reads of each sample were first processed by cellranger-atac v1.2.0 with mm10 as reference, force-cells parameter was set to 5,000 to obtain an appropriate number of cells. Generated counts and peaks were further analyzed with R package Signac v1.0.0. Each sample was preprocessed separately and respective samples were merged into a final dataset afterwards. For those, a gene activity matrix was calculated and cells with open Foxp3 locus were defined by Foxp3 activity > 0. Differentially opened regions between groups were detected by the FindMarkers function, with min.pct set to 0.2 and LR-test employed. Peaks were matched to genes using the program ClosestFeature and peaks were analyzed separately. After quality control, we obtained information from 1.276 GFP- lrf4+/fl, 772 GFP+ Irf4+/fl, 1.233 GFP- Irf4-/fl, and 1.430 GFP+ lrf4-/fl T cells. From these 127 GFP- lrf4+/fl (10,0%), 66 GFP+ lrf4+/fl (8,5%), 78 GFP- Irf4-/fl (6,3%), and 69 GFP+ lrf4-/fl cells, respectively, were identified as Treg cells due to their open Foxp3 locus. For the comparison between different Treg cells populations, we used a p-value of <0,05 and a LogFC-Cutoff of 0.25.
For integration of IRF4 binding and super enhancers, Irf4 mm9 ChIP-Seq peaks were downloaded from GSE98263 (50) and converted to mm10 coordinates via the UCSC LiftOver webtool. Resulting peak-regions were intersected with Treg super enhancers identified by Sakaguchi and colleagues (51) with intersect from bedtools v2.29.2.
Statistical analyses
Statistical analyses were performed using GraphPad Prism (GraphPad Software Inc., La Jolla, CA). Results were analyzed with the tests indicated in the figure legends. In the case of three or more groups, one-way analysis of variance (ANOVA) with Tukey’s multiple comparisons test as indicated was used. In T cell transfer experiments with subsequent deletion of Irf4 alleles, GFP+ cells and GFP− cells with deleted and non-modified alleles, respectively, were detected in the same mouse. In these experiments, GFP+ and GFP− FoxP3+ CD4+ T cells in individual mice were matched and results of groups of mice were analyzed with paired t test. A p-value of < 0.05 was considered significant and is indicated in the graphs (*p < 0.05; **p < 0.01; ***p < 0.001; ****p < 0.0001). Values without any indication were not significant. Results of statistical analyses are provided in Supplementary Table 1.
Results
IRF4 controls numbers and phenotype of Treg cells in a gene dosage-dependent manner
IRF4 is central for activation and effector cell differentiation of all T cell lineages including Treg cells. For both CD4+ Th cells and CD8+ T cells, it has further been demonstrated that the expression level of IRF4 affects the fate of T cell differentiation (17–21). In order to test if the Irf4 gene dosage also influences the formation of Treg cells, percentages of these cells were analyzed in Irf4+/+, Irf4+/- and Irf4-/- mice under homeostatic conditions and after infection with ovalbumin-recombinant listeria (LmOVA). Under both conditions, we detected a gene dosage-dependent reduction in percentages of FoxP3+ Treg cells in spleens, with a strong reduction in Irf4-/- mice and moderate reduction in Irf4+/- mice (Figure 1A, Gating strategy in Supplementary Figure 1A). Phenotypic characterization revealed a strong decrease of CD44+ Treg cells in naive and infected lrf4-/- mice and a slight decrease in Irf4+/- mice (Figure 1B). Consistent with a more resting phenotype, Irf4-/- FoxP3+ Treg cells from naïve mice expressed enhanced levels of the anti-apoptotic proteins Bcl-2 and Bcl-X (Bcl-2L1) and of the transcription factor TCF-7 (Figure 1C). Irf4-/- mice had lower percentages of Treg cells positive for the effector cell markers ICOS, CTLA-4, TIGIT, CCR6, GITR (TNFRSF18) and ST2 (IL1RL1) (Figure 1D) indicating a reduction of effector Treg (eTreg) cells. For some of these markers, we also observed an intermediate phenotype in Irfr4+/- Treg cells. Consistent with a largely thymic origin, Irf4-/- Treg cells displayed a higher expression level of Helios (IKZF2) (Figure 1E). To test, if the Irf4 gene dosage is mirrored by protein expression, IRF4 was measured in Treg cells by intracellular staining (Supplementary Figure 1B). Compared to the background level of Irf4-/- Treg cells, Irf4+/+ and Irf4+/- Treg cells showed only marginally enhanced IRF4 staining indicating low IRF4 expression levels under homeostatic conditions. Interestingly, IRF4 levels were slightly higher in Irf4+/- Treg cells when compared to Irf4+/+ Treg cells. In conclusion, our results indicate that IRF4 controls in a gene dosage dependent mode the formation of eTreg cells.
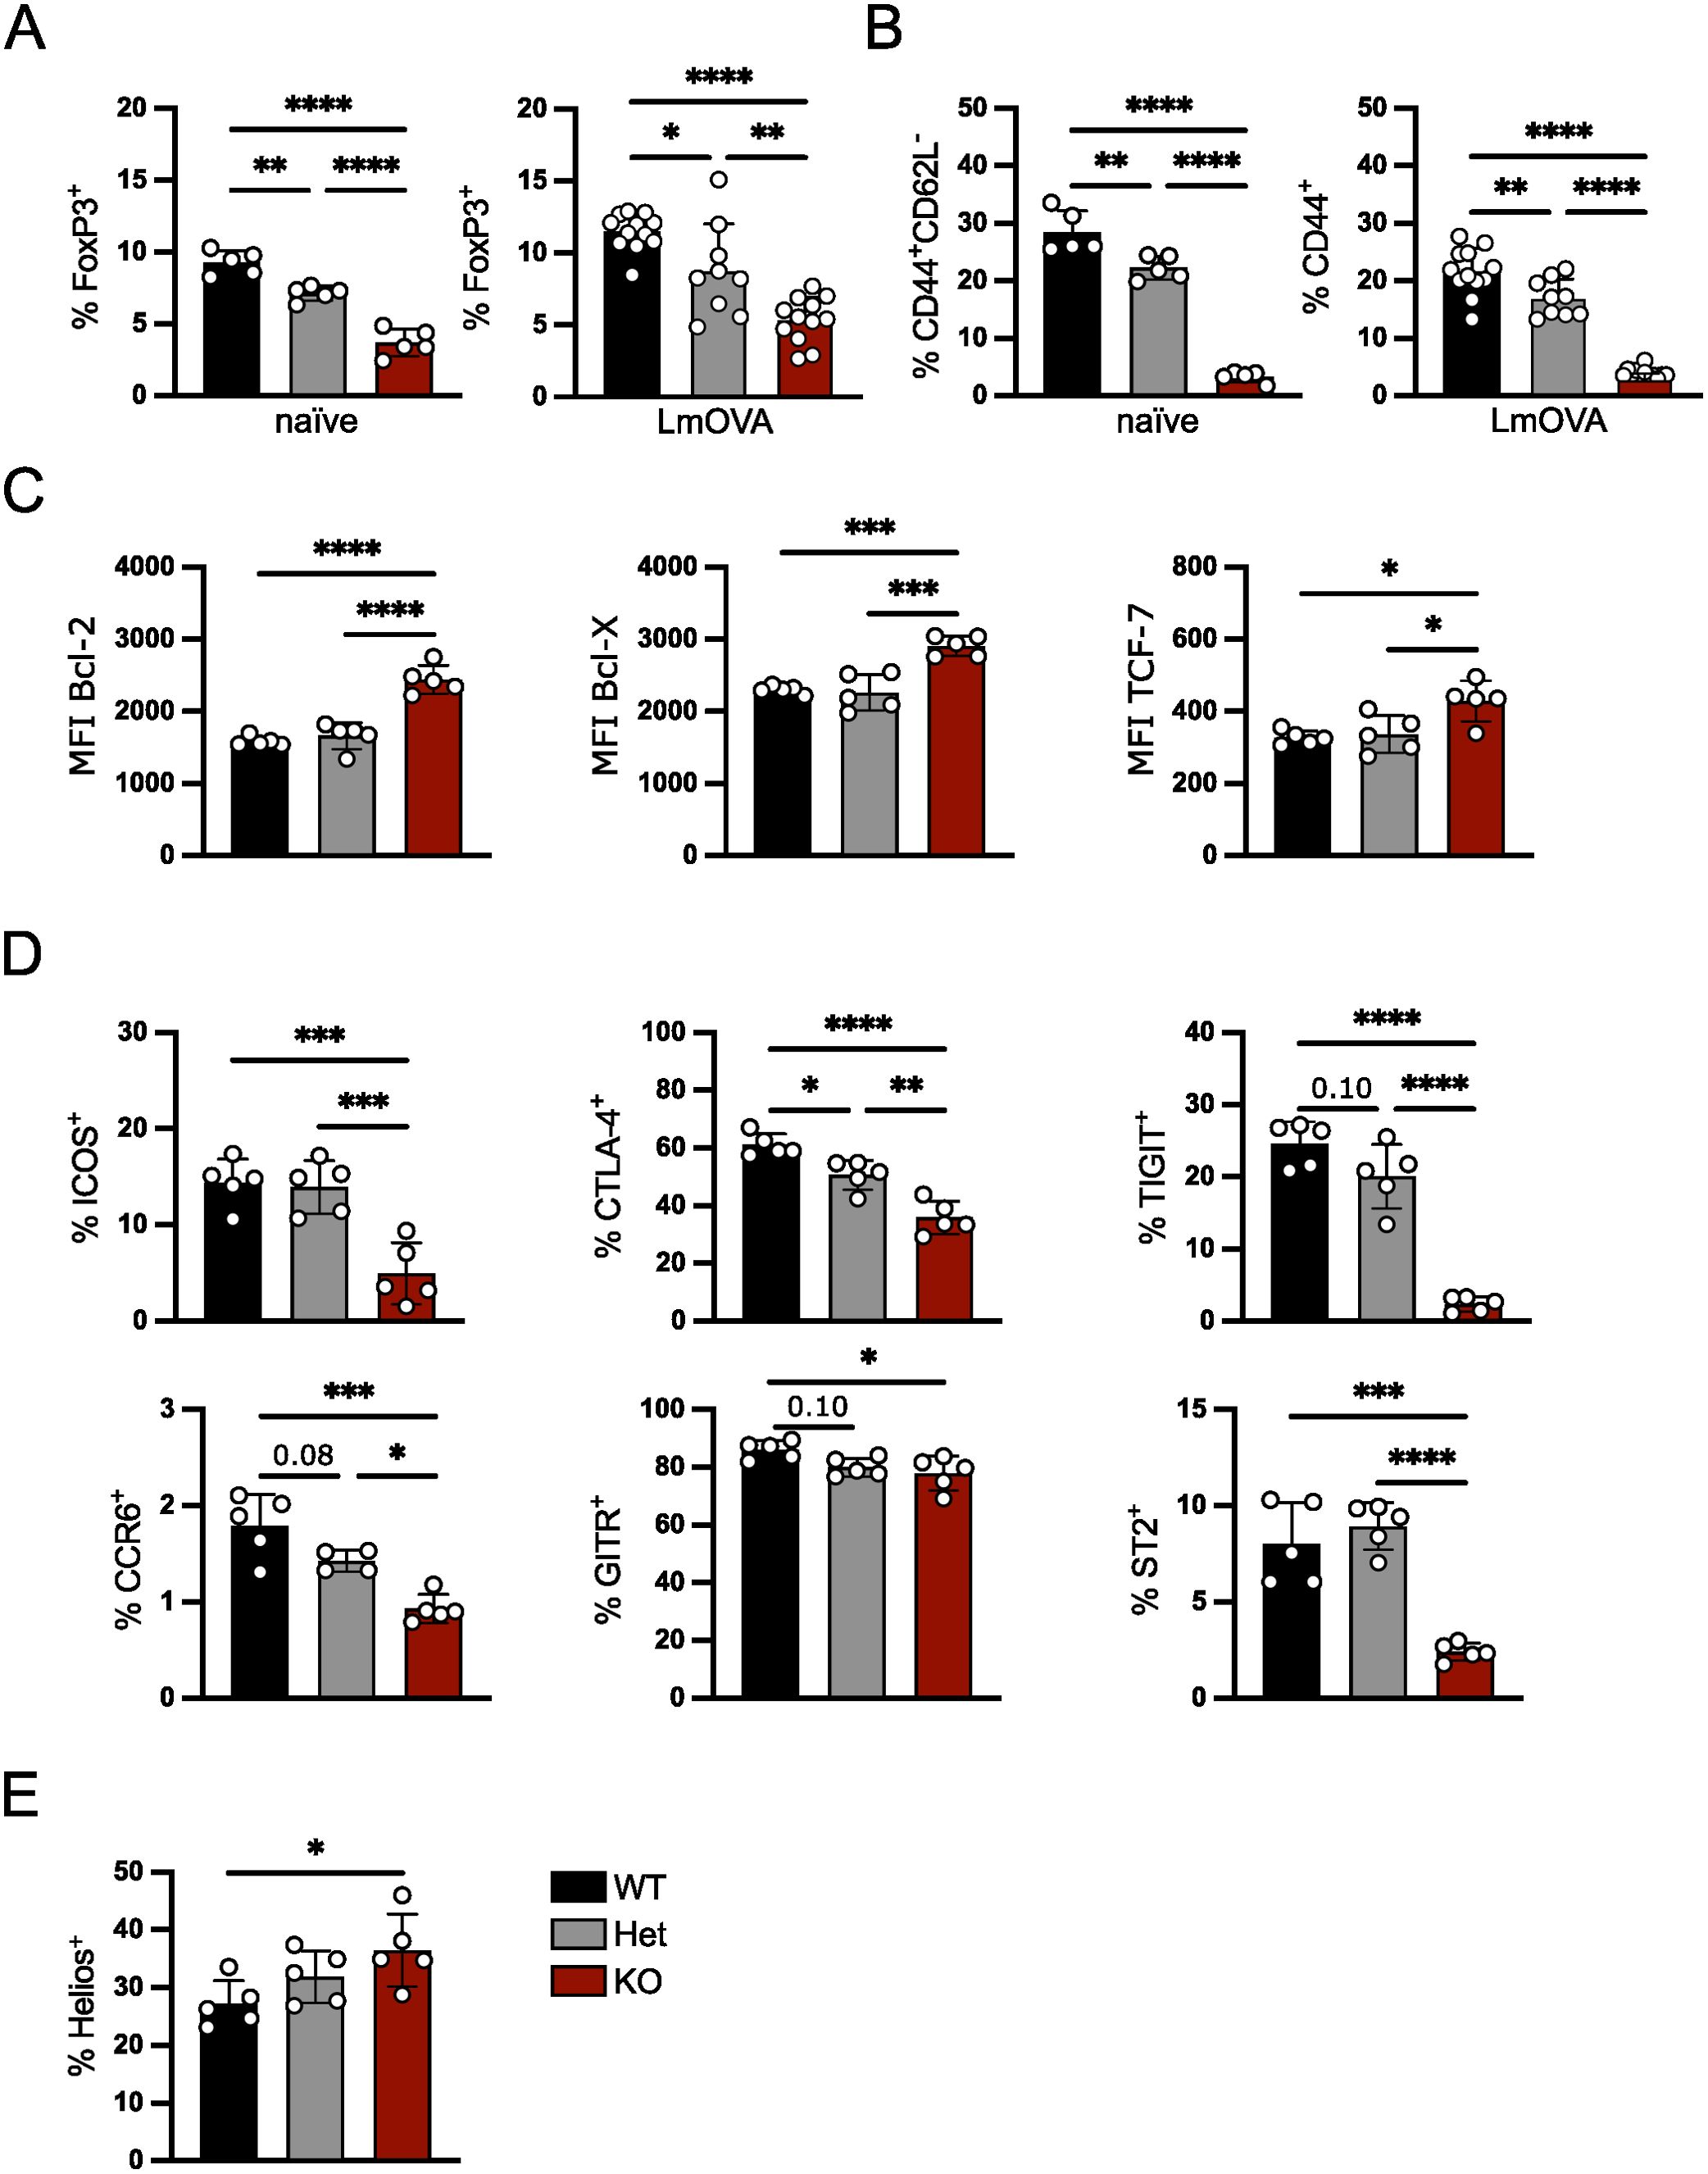
Figure 1. IRF4 controls Treg cells in a gene dosage-dependent manner. FoxP3+ Treg cells from spleens of naïve Irf4+/+, Irf4+/- and Irf4-/- mice or mice i.v. infected 10 days before with LmOVA were analyzed. (A) Percentages of FoxP3+ cells of CD4+ T cells. (B) percentages of CD44+CD62L- or CD44+ cells of FoxP3+ T cells from naïve and infected mice. (C) Mean fluorescence intensity (MFI) of staining for anti-apoptotic proteins Bcl-2, Bcl-X, and the transcription factor TCF-7 of FoxP3+ T cells. (D) Percentages of ICOS+, CTLA-4+, TIGIT+, CCR6+, GITR+ and ST2+ cells of FoxP3+ Treg cells. (E) Percentages of Helios+ cells of FoxP3+ Treg cells. (A–E) Representative results of three independent experiments with 2–5 mice per group in naïve mice and three independent experiments with 3–12 mice per group in infected mice. Mean ± SEM, one-way ANOVA with Tukey’s multiple comparisons test. (*p < 0.05, **p < 0.01, ***p < 0.001, ****p < 0.0001).
IRF4 expression level in peripheral Treg cells regulates effector cell maintenance
IRF4 expression is not restricted to Treg cells but also detected in conventional T cells as well as other hematopoietic cell populations including B cells and dendritic cells which could affect peripheral Treg cell differentiation. To analyze the consequences of altered IRF4 expression in peripheral Treg cells, we used Irf4fl/fl×CreERT2 or Irf4+/fl×CreERT2 mice and Irf4-/fl×CreERT2 mice in which tamoxifen-treatment induced the inactivation of the floxed Irf4 alleles resulting in a switch of the Irf4 wt genotype to an Irf4 heterozygous or homozygous mutant genotype in Irf4fl/fl×CreERT2 or Irf4+/fl×CreERT2 T cells and from an Irf4 heterozygous to an Irf4 KO genotype in Irf4-/fl×CreERT2 cells. Cre-mediated conversion of the Irf4fl allele also causes expression of eGFP from the gene locus (Supplementary Figure 2A) (20, 21, 43). Treatment of Irf4fl/fl×CreERT2 or Irf4-/fl×CreERT2 mice with tamoxifen resulted in conversion of Irf4 alleles in some 5% of Treg cells (Supplementary Figures 1A, 2B). This low efficacy is consistent with our observations in conventional CD4+ and CD8+ T cells (20, 21). Due to this low efficacy, the vast majority of GFP+ Treg cells derived from Irf4fl/fl×CreERT2 cells will have an Irf4 heterozygous mutant genotype. PCR with primers specific for the Cre-modified gene segment amplified the expected 2 kb product only in GFP+ but not in GFP- CD4+ T cells sorted from spleens of Irf4+/fl×CreERT2 and Irf4-/fl×CreERT2 mice after tamoxifen treatment, indicating that GFP expression closely correlated with the Cre-mediated inactivation of the Irf4fl locus (Supplementary Figure 2C). Similar to the IRF4 expression in Treg cells from Irf4+/+ and Irf4+/- mice, there was a small increase in IRF4 expression in GFP- Irf4+/fl, GFP+ Irf4+/fl and GFP- Irf4-/fl Treg cells when compared to IRF4-deficient GFP+ Irf4-/fl Treg cells under homeostatic conditions (Supplementary Figure 2D). Phenotypical characterization of these Treg cells after induced heterozygous or homozygous knockout revealed lower CD44 expression and upregulation of Bcl-2, particularly in induced homozygous Irf4 KO cells, consistent with results from Irf4+/- and Irf4-/- Treg cells (Supplementary Figure 2E).
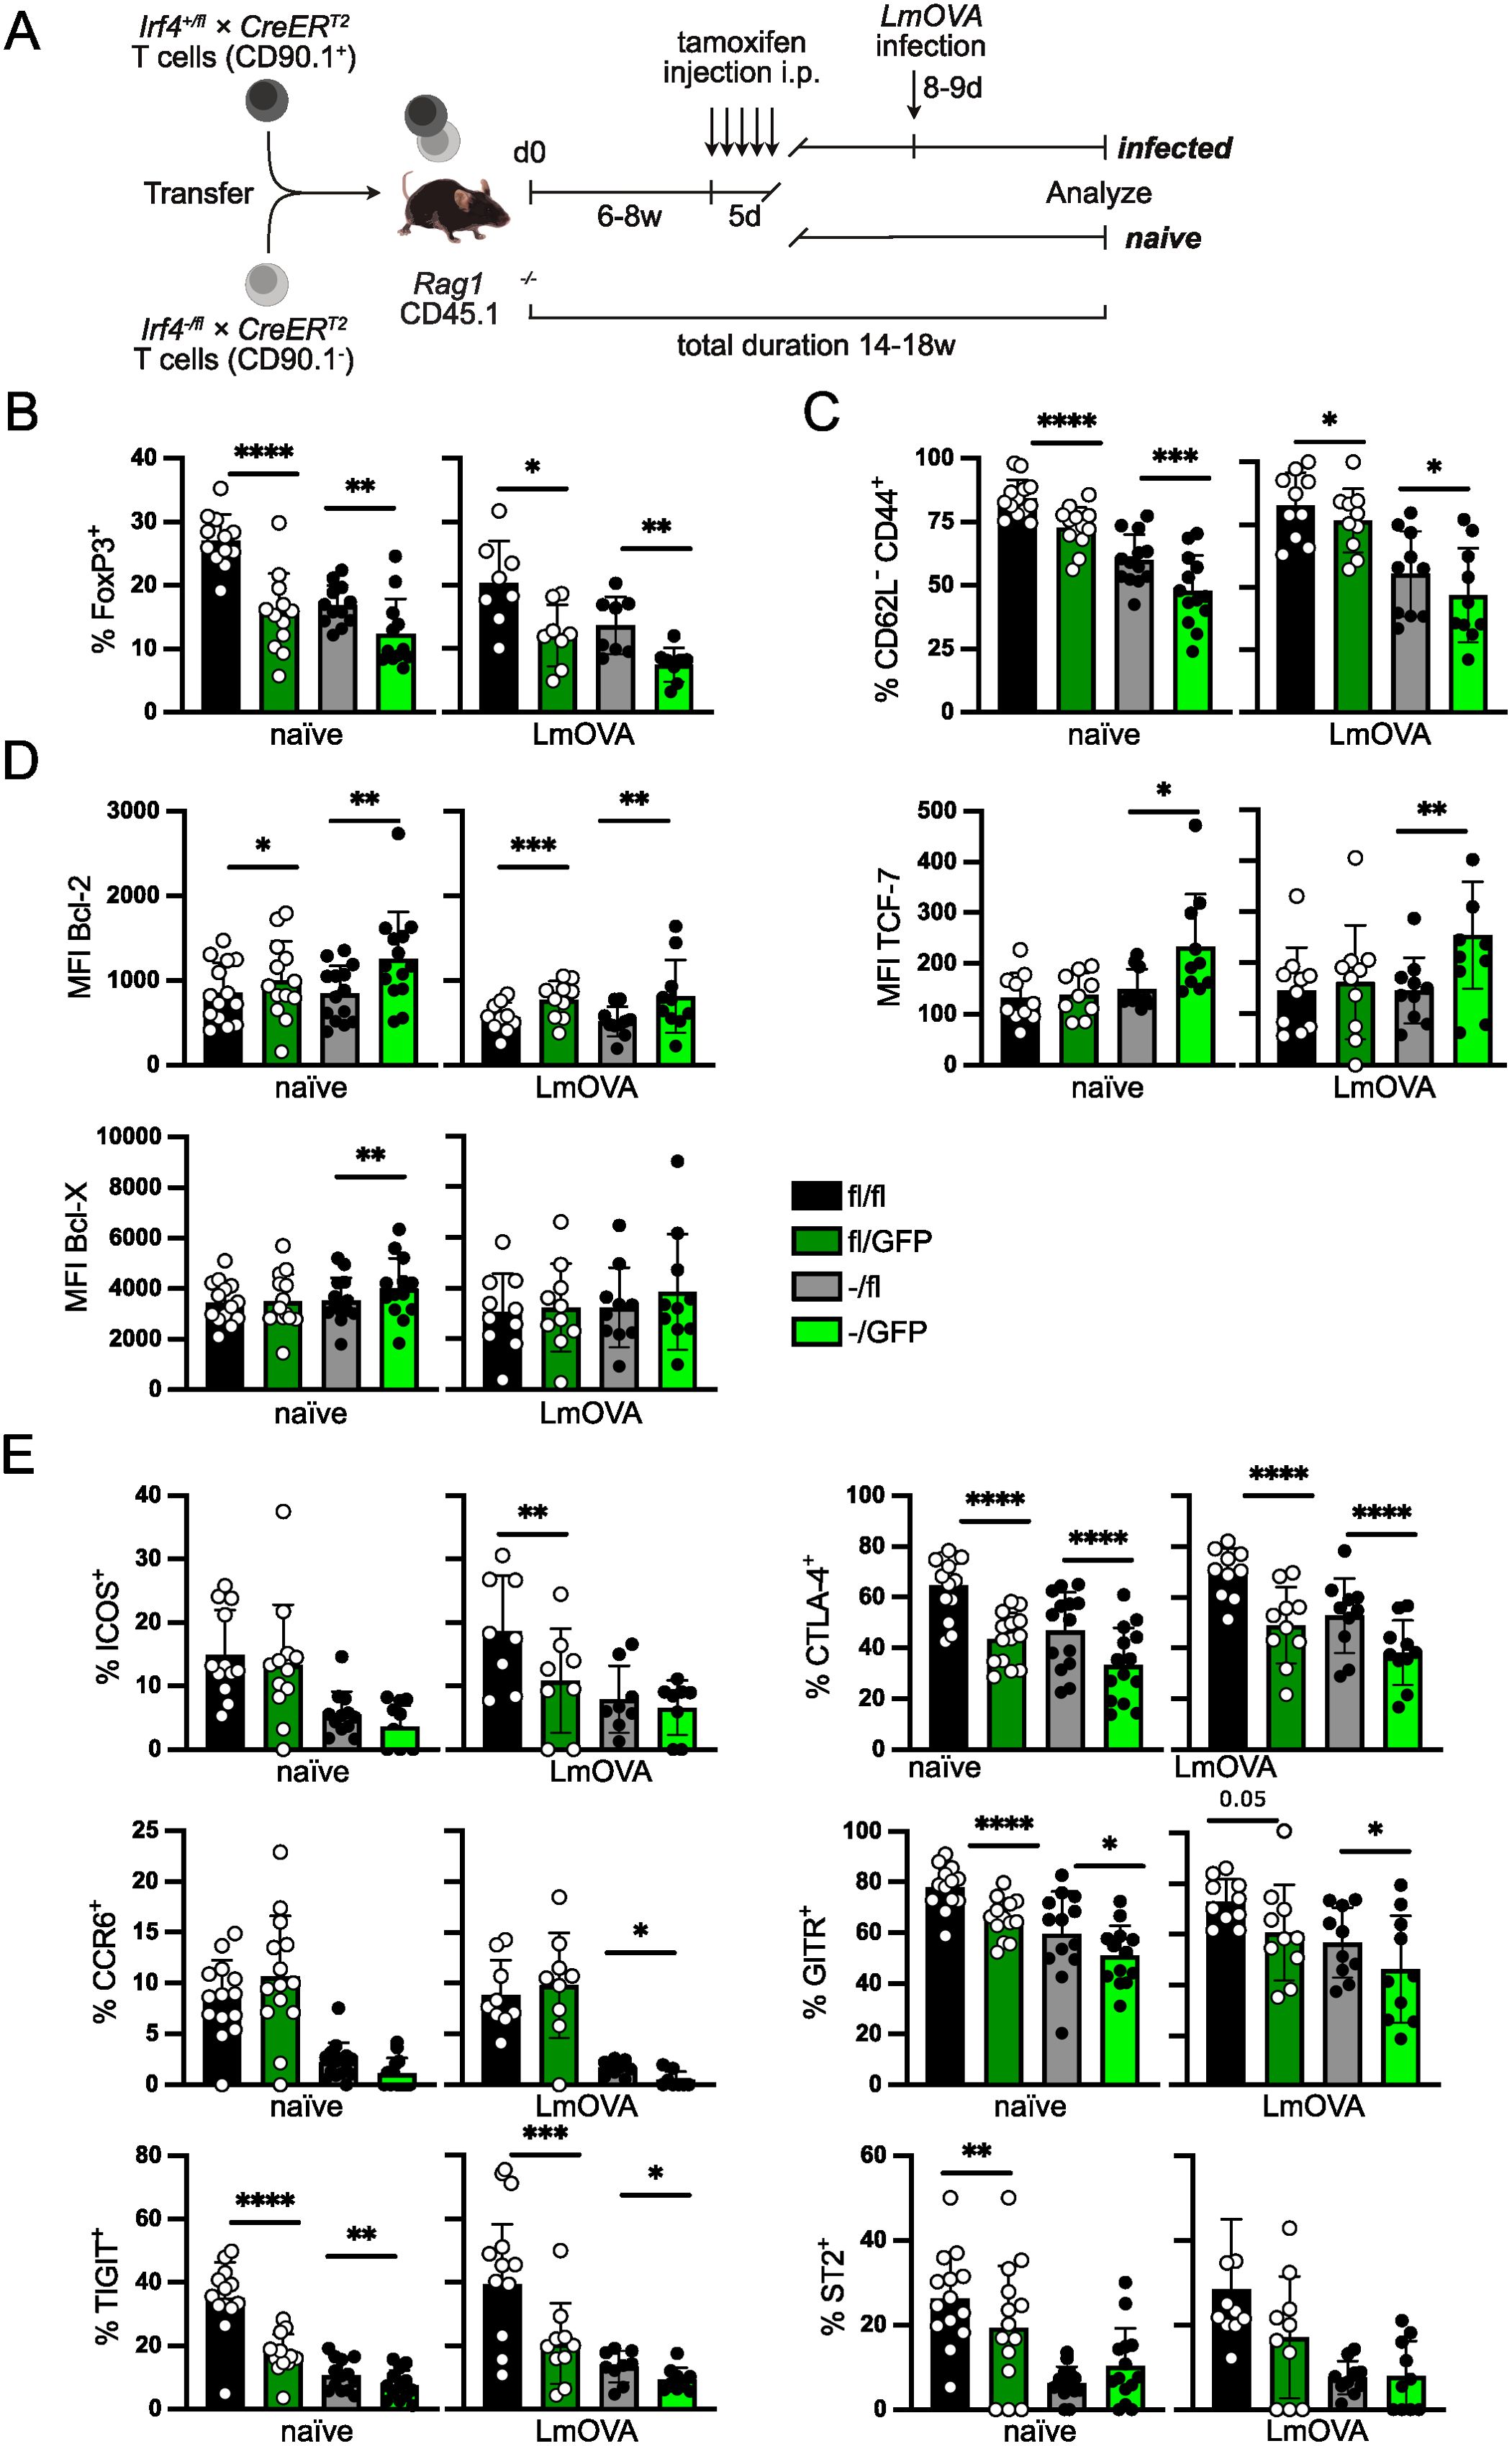
Figure 2. IRF4 expression level regulates effector Treg cell maintenance. (A) Scheme of T cell transfer experiments. T cells from Irf4+/fl×CreERT2 or Irf4fl/fl×CreERT2 mice (CD90.1+) and from Irf4-/fl×CreERT2 mice (CD90.1-) were mixed in a ratio of 1:1. T cells were i.v. transferred into naïve CD45.1+ Rag1-/- mice. Six to 8 weeks after transfer, recipient mice were treated i.p. with tamoxifen for 5 consecutive days. Mice were analyzed after tamoxifen treatment as indicated in the individual experiments. In some of the experiments, tamoxifen-treated recipient mice were in addition i.v. infected with LmOVA prior to analysis. (Of note: due to the low efficacy of recombination, GFP+ cells derived from Irf4fl/fl×CreERT2 donors largely acquire an Irf4fl/GFP genotype.) (B–E) Spleen cells from reconstituted and tamoxifen treated Rag1−/− mice were analyzed 14–18 weeks after transfer. In the LmOVA groups, mice were additionally infected i.v. with LmOVA 8–9 days before analysis. (B) Percentages of FoxP3+ cells of CD4+ T cells. (C) Percentages of CD44+ CD62L- cells of Treg cells. (D) Mean fluorescence intensity (MFI) of staining for Bcl-2, Bcl-X, and TCF-7. (E) Percentages of ICOS+, CTLA-4+, TIGIT+, CCR6+, GITR+ and ST2+ cells of Treg cells. (B–E) Pooled results of three independent experiments for naïve mice and two independent experiments for LmOVA-infected mice. Mean ± SEM. Results of corresponding GFP+ and GFP- donor cell populations in individual mice were analyzed with paired t-test. (*p < 0.05, **p < 0.01, ***p < 0.001, ****p < 0.0001). Statistics for comparison of all groups are provided in Supplementary Table 1.
IRF4 expression in thymocytes but also in thymic epithelial cells might alter Treg cell selection in the thymus (52, 53). To restrict our analysis to the function of IRF4 in peripheral FoxP3+ Treg cells, we transferred T cells from Irf4fl/fl×CreERT2 and Irf4-/fl×CreERT2 mice into Rag1-/- mice. Six to eight weeks after transfer, recipient mice were treated on five consecutive days with tamoxifen and on different days post-treatment, Treg cells were analyzed (Figure 2A). Analysis of recipients of Irf4fl/fl×CreERT2 and Irf4-/fl×CreERT2 cells revealed lower percentages of Treg cells in heterozygous (Irf4-/fl×CreERT2) donor cells (Figure 2B), consistent with results from Irf4+/- mice (Figure 1A). Induced inactivation of the Irf4fl alleles caused a significant reduction of Treg cells in both donor cell populations. A similar pattern was observed after LmOVA infection of tamoxifen-treated recipient mice (Figure 2B). Inactivation of Irf4 alleles did not affect the expression level of Foxp3 in Treg cells (Supplementary Figure 3A). Phenotypical characterization of the Treg cell populations revealed a reduction of CD62L-CD44+ cells (Figure 2C) and an increase in Bcl-2 expression after induced deletion of Irf4fl alleles in both GFP+ Irf4fl/fl×CreERT2 and GFP+ Irf4-/fl×CreERT2 Treg cells (Figure 2D). Bcl-X and TCF-7 were only upregulated in GFP+ Treg cells derived from Irf4-/fl×CreERT2 donors (Figure 2D). Compared to Treg cells of Irf4+/- mice, we observed a more pronounced reduction of Irf4-/fl×CreERT2 Treg cells expressing the effector cell markers ICOS, CTLA-4, TIGIT, CCR6, GITR and ST2 (Figure 2E). Percentages of cells positive for these markers were further reduced upon tamoxifen-induced loss of Irf4fl alleles. There was a reduction for most of the marker+ cells in GFP+ Treg cells from Irf4fl/fl×CreERT2 donors, however, reduction was less pronounced and less consistent than that observed in those from Irf4-/fl×CreERT2 donors. The Irf4 genotype did not affect the percentages of CD73+ and CD39+ Treg cells (Supplementary Figure 3B). Overall, these results indicate that under competitive conditions, mutation of one Irf4 allele causes a significant reduction of eTreg cells and that peripheral loss of functional Irf4 alleles in both Irf4 wt and Irf4 heterozygous cells further diminishes the eTreg cell populations.
IRF4 expression is not essential for cytokine expression in peripheral Treg cells
After tamoxifen treatment, GFP+ and GFP- Treg cells were analyzed for cytokine production. Upon stimulation with PMA and ionomycin, Treg cells from Irf4+/fl×CreERT2 and Irf4-/fl×CreERT2 mice were equally able to produce TGF-β1/LAP (Figure 3A). Induced deletion of Irf4fl alleles did not reduce TGF-β1/LAP expression, we rather observed an increased percentage of TGF-β1/LAP cells in both GFP+ Treg cell populations. Consistent with the enhanced TGF-β1/LAP expression in GFP+ Treg cells, we also observed upregulation of LRRC32, a protein involved in the activation of latent TGF-β1, after induced deletion of Irf4 in Treg cells (Supplementary Figure 4A).
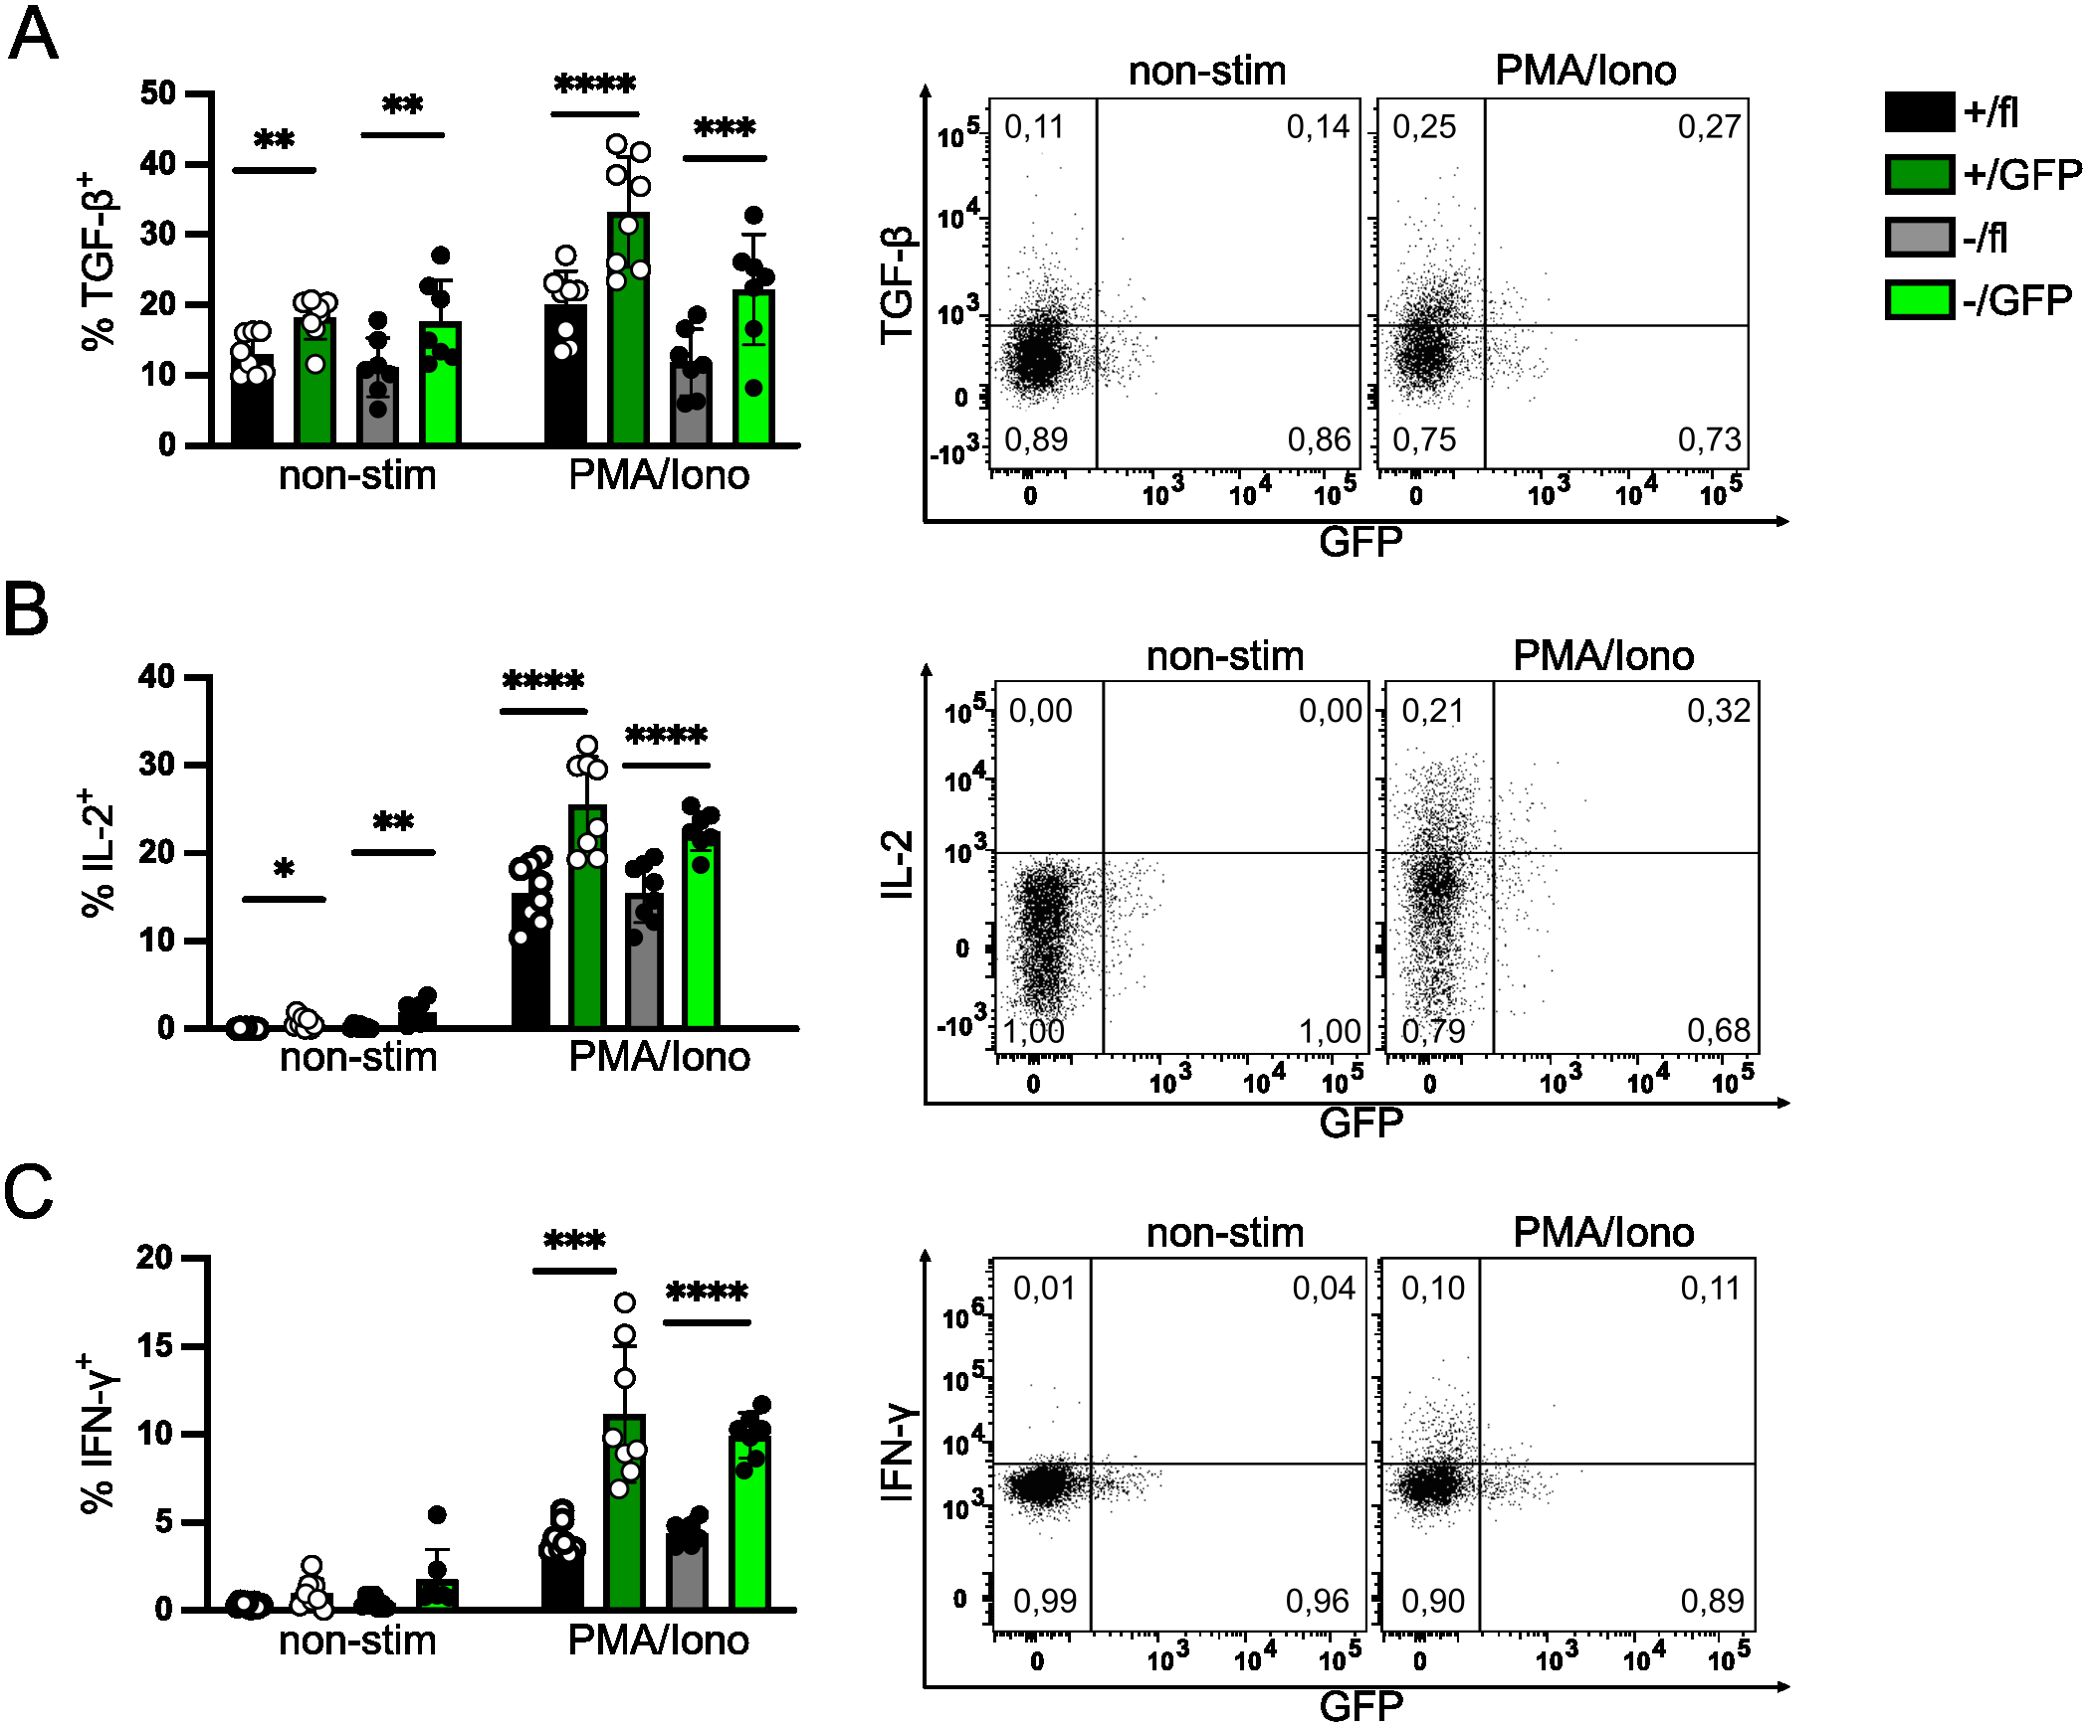
Figure 3. IRF4 expression is not essential for cytokine expression in peripheral Treg cells. Cytokine expression of Treg cells with induced deletion of Irf4 alleles. Irf4+/fl×CreERT2 and Irf4-/fl×CreERT2 mice were treated with tamoxifen on 5 consecutive days and analyzed 6–7 weeks later. Spleen cells were cultured without stimulation or with PMA and ionomycin for 4h and cytokine expression in Treg cells was analyzed by intracellular antibody staining. Representative staining (gated on CD4+ CD90.1+ FoxP3+ Irf4+/fl×CreERT2 T cells) and results for TGF-β/LAP+ (A), IL-2+ (B) and IFN-γ+ (C) of CD4+ FoxP3+ Treg cells. Figures in FACS plots give the fraction of cytokine+ cells of GFP- or GFP+ FoxP3+ cells, respectively. Graphs represent one of three independent experiments with 6–10 mice per group. Mean ± SEM. Results of corresponding GFP+ and GFP- donor cell populations in individual mice were analyzed with paired t-test. (*p < 0.05, **p < 0.01, ***p < 0.001, ****p < 0.0001). Statistics for comparison of all groups are provided in Supplementary Table 1.
Treg cells with induced Irf4-inactivation were also analyzed for their production of IL-2 and IFN-γ. Loss of functional Irf4 alleles did not diminish the percentage of IL-2+ or IFN-γ+ Treg cells (Figures 3B, C). Similar to TGF-β1/LAP, we rather detected an increase in the percentages of IL-2+ and IFN-γ+ Treg cells in the GFP+ populations compared to their respective parental cell populations. Enhanced percentages of IFN-γ+ Treg cells correlated with enhanced expression of CXCR3, the hallmark chemokine receptor of Th1 cells, on GFP+ Treg cells (Supplementary Figure 4B). In addition, we observed slightly enhanced expression of the transcription factors TBX21 (T-bet) and PRDM1 (Blimp1), both associated with T cell effector functions (4) (Supplementary Figures 4C, D). Overall, these results indicate that although IRF4 expression was essential for the maintenance of eTreg cells, as indicated by the expression of surface markers, peripheral inactivation of Irf4 alleles did not reduce but rather increased the expression of the inhibitory cytokine TGF-β1 after stimulation and caused enhanced expression of IL-2 and IFN-γ.
Induced deletion of Irf4 in Treg cells results in reduced suppressive function
Inactivation of Irf4 alleles in Treg cells caused downregulation of surface proteins involved in T cell suppression but did not impair the production of inhibitory cytokines. In order to directly test the suppressive capacity of FoxP3+ Treg cells with induced Irf4 inactivation, Treg cells were isolated from spleens of FIR×Irf4-/fl×CreERT2 mice, which express a fluorescent protein under the control of the Foxp3 promoter (Supplementary Figure 5) (46). FoxP3+ T cells were stimulated in vitro and after 3 days, 4-hydroxy tamoxifen was added to the culture. After 9 days, GFP+ and GFP- Treg cells were sorted and tested in an in vitro suppression assay (Figures 4A, B). Compared to GFP- Treg cells, we observed less suppression of proliferation of conventional CD4+ T cells by GFP+ Treg cells, however, there was still remaining suppressive activity, indicating that after tamoxifen-induced deletion, IRF4-deficient Treg cells still retained some suppressive capacity.
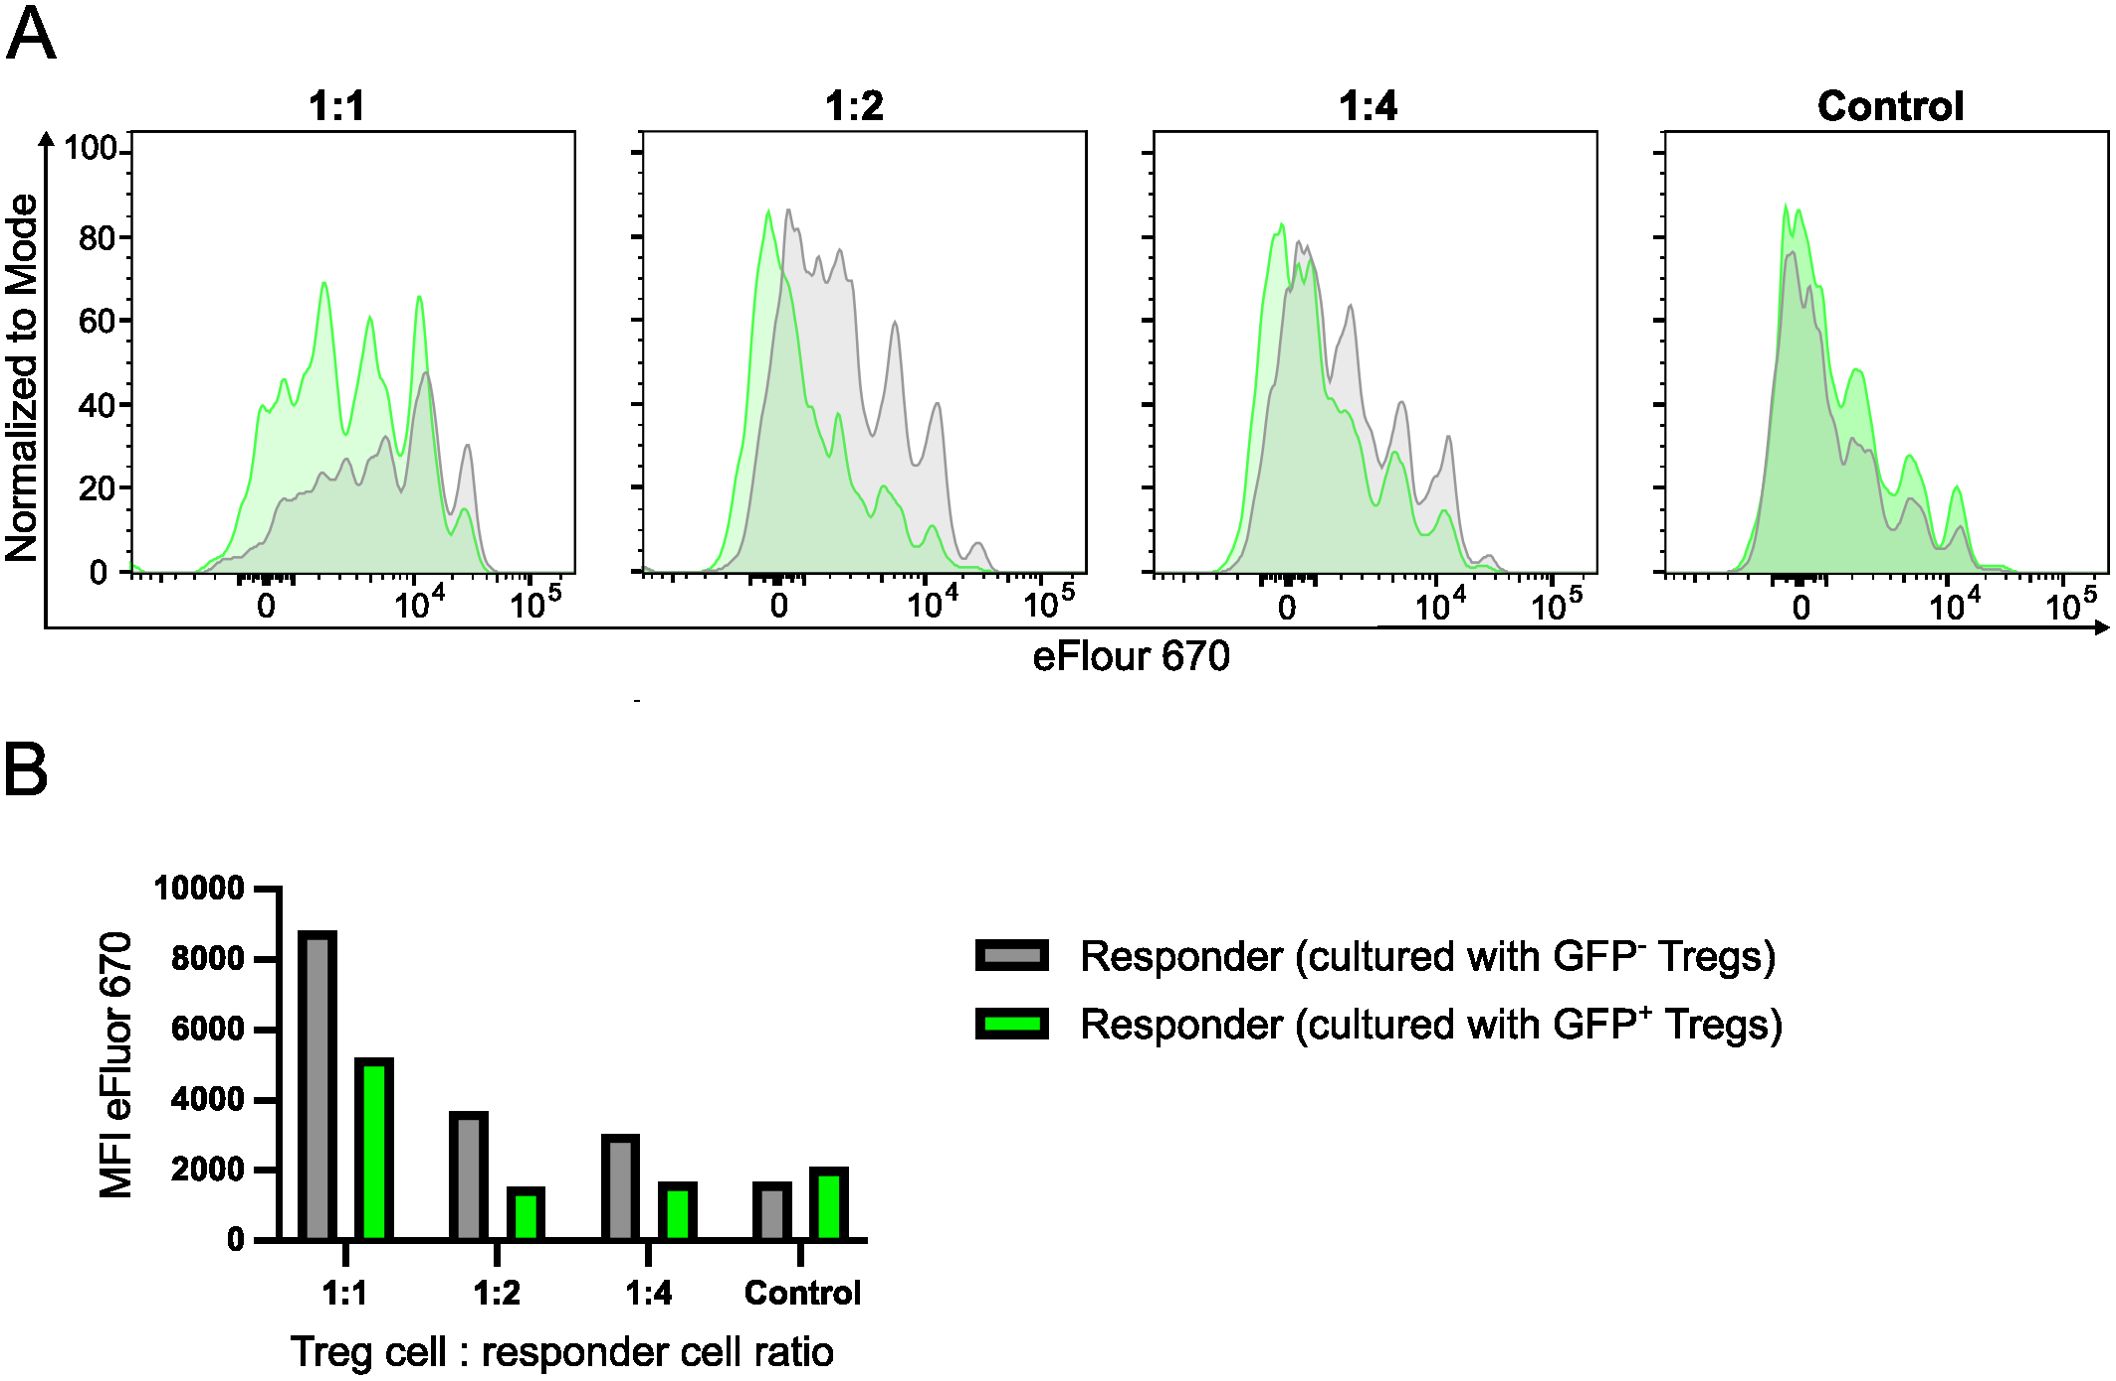
Figure 4. Induced deletion of Irf4 in Treg cells results in reduced suppressive function. CD4+ T cells were isolated from spleens of FIR×Irf4-/fl×CreERT2 mice. FIR+ FoxP3+ cells were FACS-sorted and then cultured in the presence of anti-CD3 and anti-CD28 antibody-coated beads and IL-2. After 3 days, 4-Hydroxytamoxifen was added to the cultures. After 9 days, GFP- and GFP+ Treg cells were sorted and co-cultured in different ratios with Treg cell-depleted and eFluor 670-labelled responder CD4+ T cells from CD90.1+ mice in the presence of anti-CD3 antibodies. After 3 days, proliferation of CD90.1+ CD4+ T cells was determined by loss of eFluor 670 staining. (A). eFluor 670 staining of responder T cells cultured with GFP+ (green) and GFP- Treg cells (grey) at different Treg-to-responder cell ratios. Control: responder cells cultured without Treg cells. (B) Mean fluorescence intensity (MFI) of eFluor 670 staining of responder cells cultured under different conditions. (A, B) Results are representative of two independent experiments.
IRF4 is required for long-term survival of Treg cells
Induced deletion of Irf4 alleles caused a reduction of effector Treg cells within a few weeks (Figure 2). In order to test whether IRF4 is required for long-term survival of Treg cells, we applied the transfer assay to test if deletion of Irf4 alleles causes diminished maintenance of Treg cells. FIR×Irf4+/fl×CreERT2 and FIR×Irf4-/fl×CreERT2 mice were treated with tamoxifen. Three to four weeks after treatment, CD4+ T cells were transferred into naïve Rag1-/- mice and the composition of the Treg cell populations in peripheral blood of recipients was followed for up to 32 weeks. Within the first two weeks, we observed a drop in the ratio of FIR×Irf4-/fl×CreERT2 to FIR×Irf4+/fl×CreERT2 Treg cells which then remained relatively stable over the observation period (Figure 5A). In contrast, after an initial reduction in their percentages, GFP+ Treg cells in both populations steadily declined over the whole observation period (Figure 5B). Six to seven months after the transfer, the percentage of Treg cells within the donor cell subsets was determined in several tissues of recipient mice (Figure 5C). Compared to FIR×Irf4+/fl×CreERT2 CD4+ T cells, FIR×Irf4-/fl×CreERT2 CD4+ T cells had lower percentages of Treg cells in all analyzed tissues. In GFP+ FIR×Irf4+/fl×CreERT2 T cells, percentages of Treg cells were further reduced in all tissues similar to those observed in the spleen. FoxP3+ T cells showed the strongest reduction in GFP+ FIR×Irf4-/fl×CreERT2 T cells, particularly in the non-lymphatic tissues colon, kidney, lung, and liver.
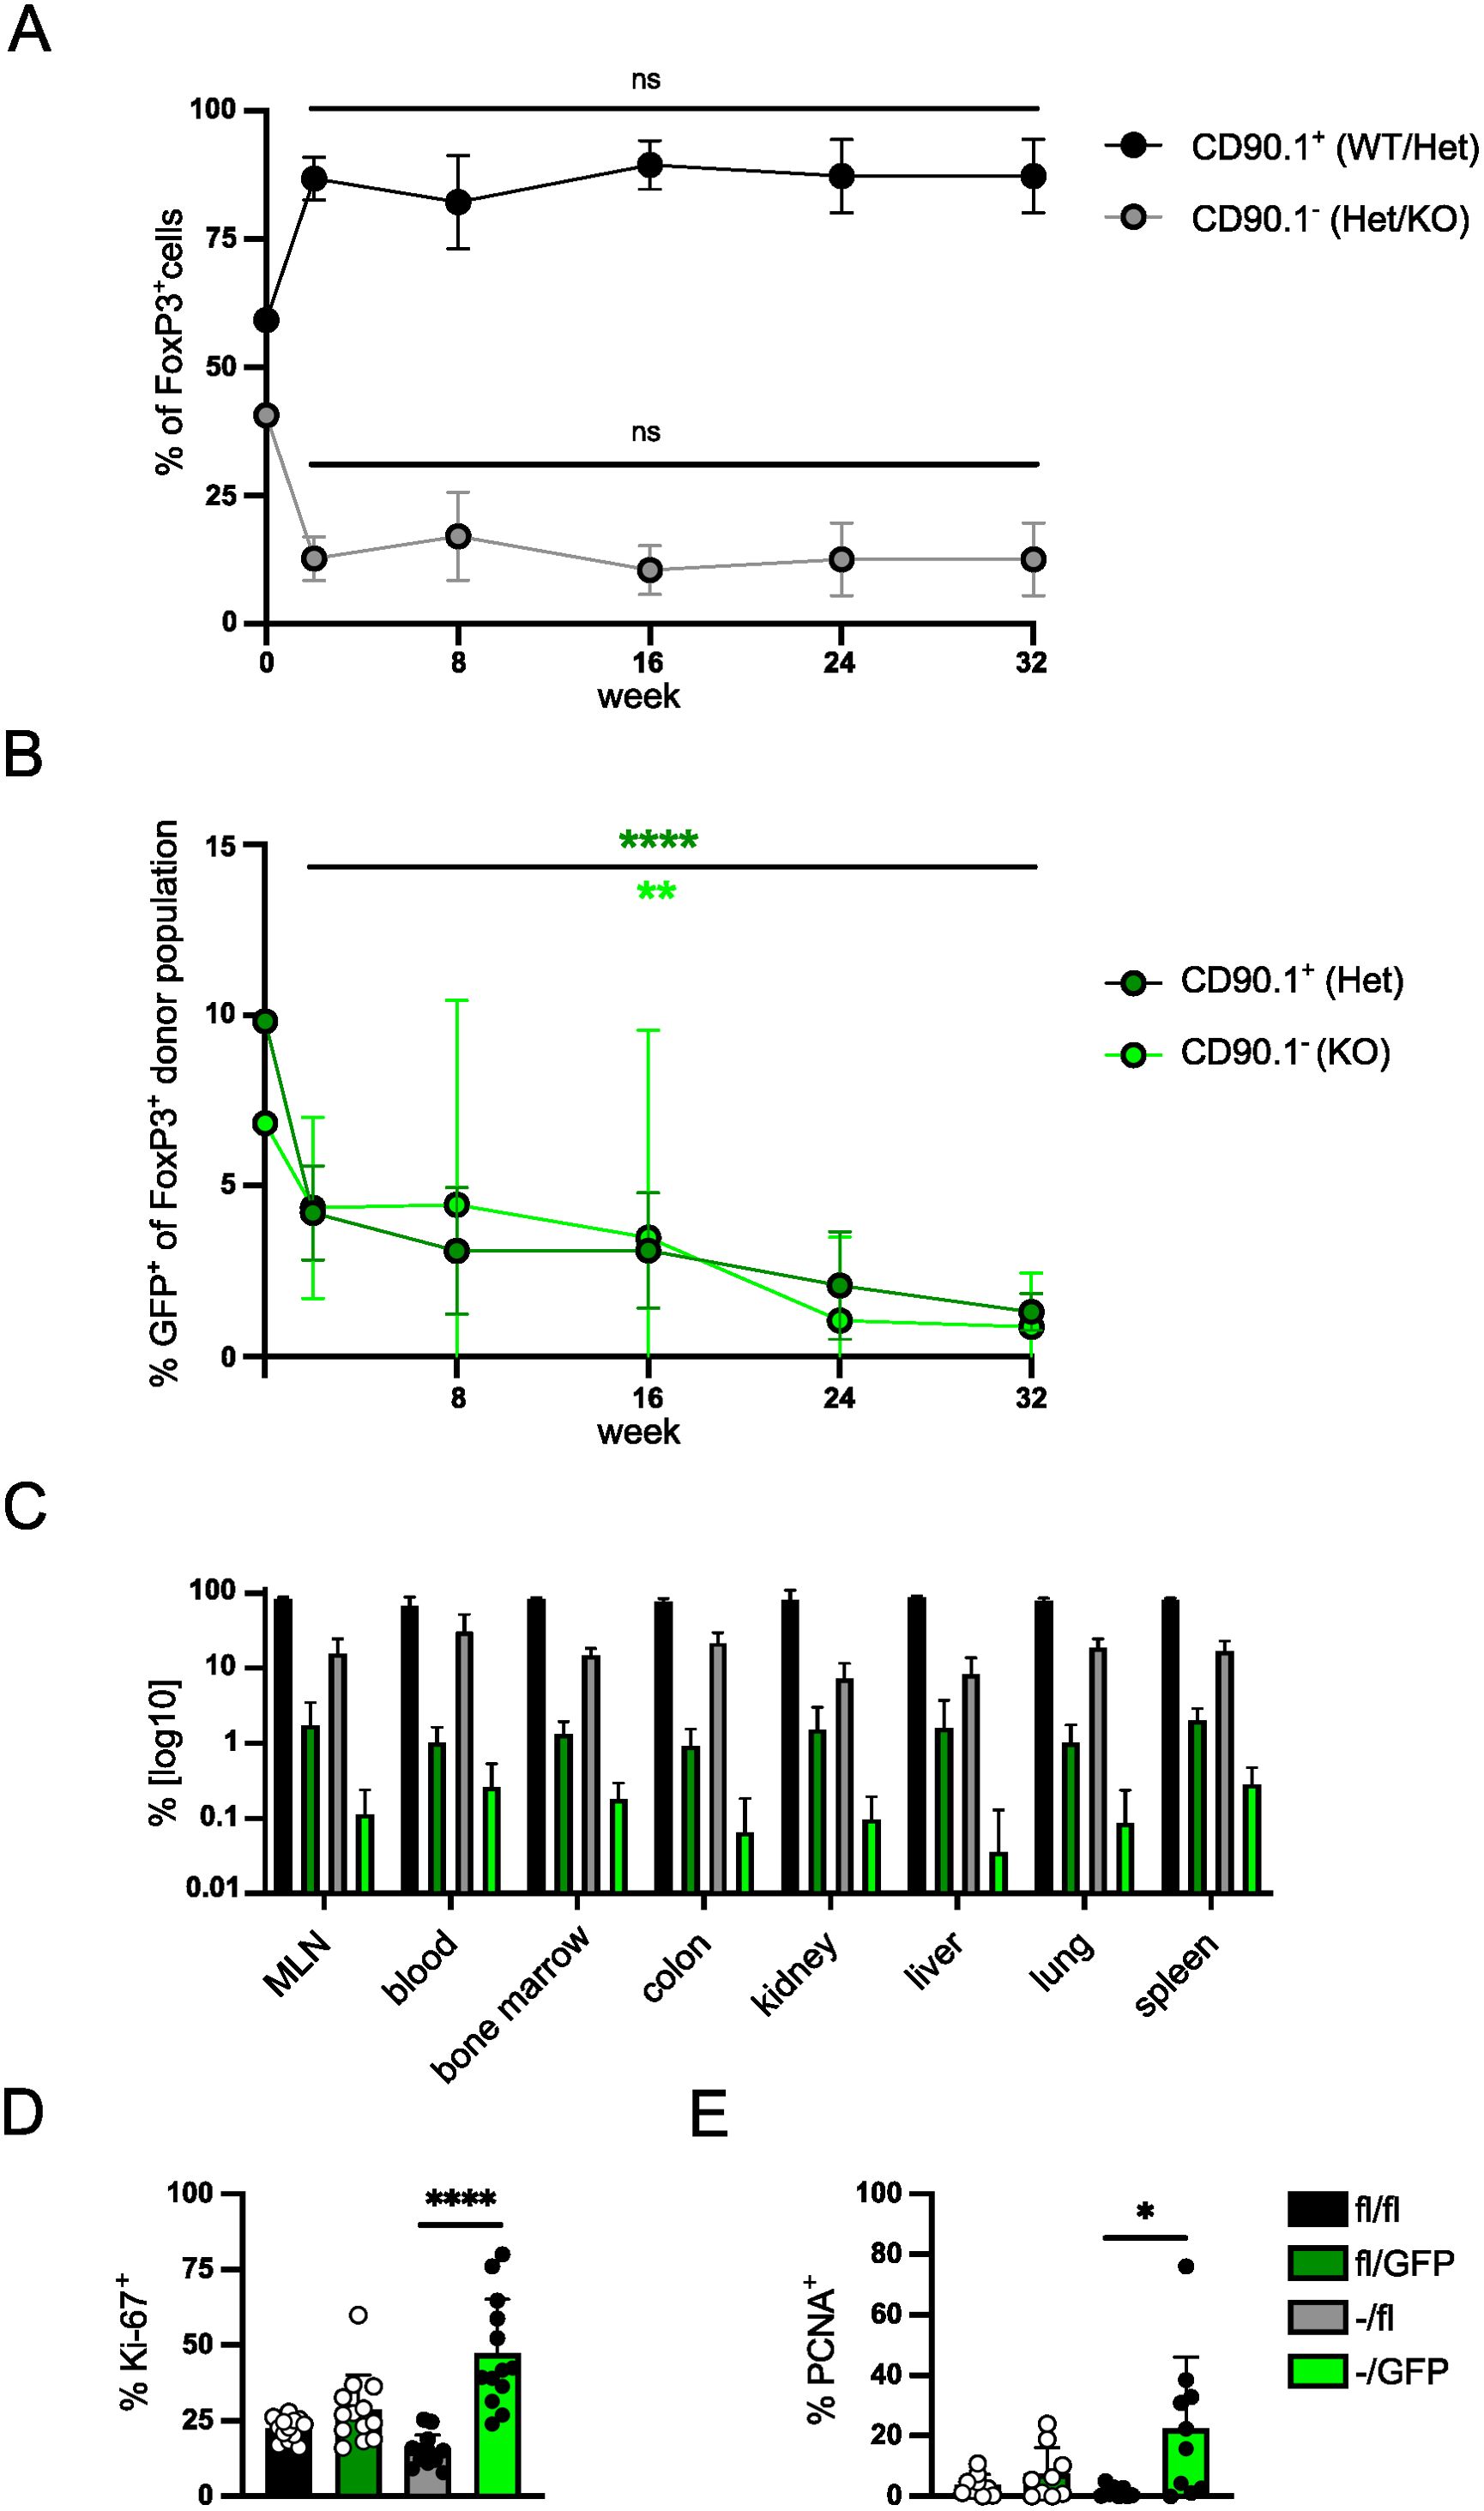
Figure 5. IRF4 is required for long-term survival of Treg cells. (A, B) FIR×Irf4+/fl×CreERT2 (CD90.1+) and FIR×Irf4-/fl×CreERT2 (CD90.1-) mice were treated with tamoxifen for 5 consecutive days. 3–4 weeks after tamoxifen treatment, T cells from spleens were mixed at a ratio of roughly 1:1 (0 weeks) and 8×10⁵ cells were transferred into naïve Rag1−/− mice. T cells from peripheral blood were analyzed at the indicated time points for percentages of CD90.1- and CD90.1+ Treg cells (A) and for percentages of GFP+ cells within CD90.1- and CD90.1+ Treg cells (B). (C) After 32 weeks, T cells were isolated from blood, lymphoid tissues and peripheral tissues. Percentages of Treg cells in different CD4+ donor T cell populations were determined. (D, E) Spleen cells from Rag1-/- mice reconstituted, treated, and analyzed as described in Figure 2 were analyzed for percentages of Ki-67+ cells (D) and of PCNA+ cells (E) of Treg cells. Graphs represent one of two independent experiments with at least 10 mice per group (A–C) or are pooled from three (D) or two (E) independent experiments. Mean ± SEM. Results of corresponding GFP+ and GFP- donor cell populations in individual mice were analyzed with paired t-test. (*p < 0.05, **p < 0.01, ****p < 0.0001). Statistics for comparison of all groups are provided in Supplementary Table 1.
Next, we determined the expression of Ki-67 and PCNA to test whether inactivation of Irf4 alleles was associated with changes in the level of proliferation under homeostatic conditions (Figures 5D, E). GFP- Treg cells of Irf4fl/fl×CreERT2 and Irf4-/fl×CreERT2 donors showed similar expression for both proliferation markers. However, we observed a significant increase in the expression of both proteins in Treg cells with induced inactivation of the second Irf4 allele (GFP+ Irf4-/fl×CreERT2 Treg cells) indicating enhanced proliferation of these Treg cells (Figures 5D, E). Overall, the results indicate that under competing conditions, IRF4-deficient Treg cell populations slowly contract despite enhanced proliferation of cells.
Peripheral deletion of Irf4 alleles causes altered chromatin accessibility in Treg cells
To determine the consequences of peripheral Irf4 deletion on the chromatin accessibility of Treg cells, T cells from Irf4+/fl×CreERT2 and Irf4-/fl×CreERT2 donor mice were transferred into Rag1-/- mice. After 4–5 weeks, recipients were treated with tamoxifen, and after further 5 weeks, recipients were infected with LmOVA. Eight days after infection, GFP- Irf4+/fl, GFP+ Irf4+/fl, GFP- Irf4-/fl and GFP+ Irf4-/fl CD4+ T cells were sorted and analyzed by single cell ATACseq (assay for transposase-accessible chromatin sequencing). Treg cells were identified by an accessible Foxp3 locus. In these Treg cells, we detected a total of 95.230 differentially accessible regions (DAR). 2.397 DAR were up regulated in GFP+ Irf4+/fl and 2.507 DAR in GFP- Irf4+/fl FoxP3+ Treg cells in this comparison. The comparison between GFP+ Irf4-/fl and GFP- Irf4-/fl FoxP3+ Treg cells revealed upregulation of 1.578 in the former and of 4.546 DAR in the latter population. Compared to GFP- Irf4+/fl Treg cells, GFP+ Irf4+/fl Treg cells showed reduced ATAC signals in several gene loci including those for Runx1, Trib1, Hif1a and Hopx. (Figure 6A). Reduced ATAC signals in GFP+ Irf4-/fl Treg cells compared to GFP- Irf4-/fl Treg cells were found in Rasa3, Trib1, Cd44, Cebpa, Btg1 and Bcl2l1. Here loci with diminished ATAC signals in GFP- Irf4-/fl Treg cells included Btla and Def6 (Figure 6A). For Cd44 and Btla reduced or enhanced ATAC signals corresponded to lower or higher protein expression, respectively, in Treg cells with inactivated Irf4 alleles (Figures 1B, 2C, 6B, C), however, enhanced Bcl-X expression in IRF4-deficient Treg cells was not consistent with reduced ATAC signals in the Bcl2l1 loci coding for Bcl-X (Figures 1C, 2D).
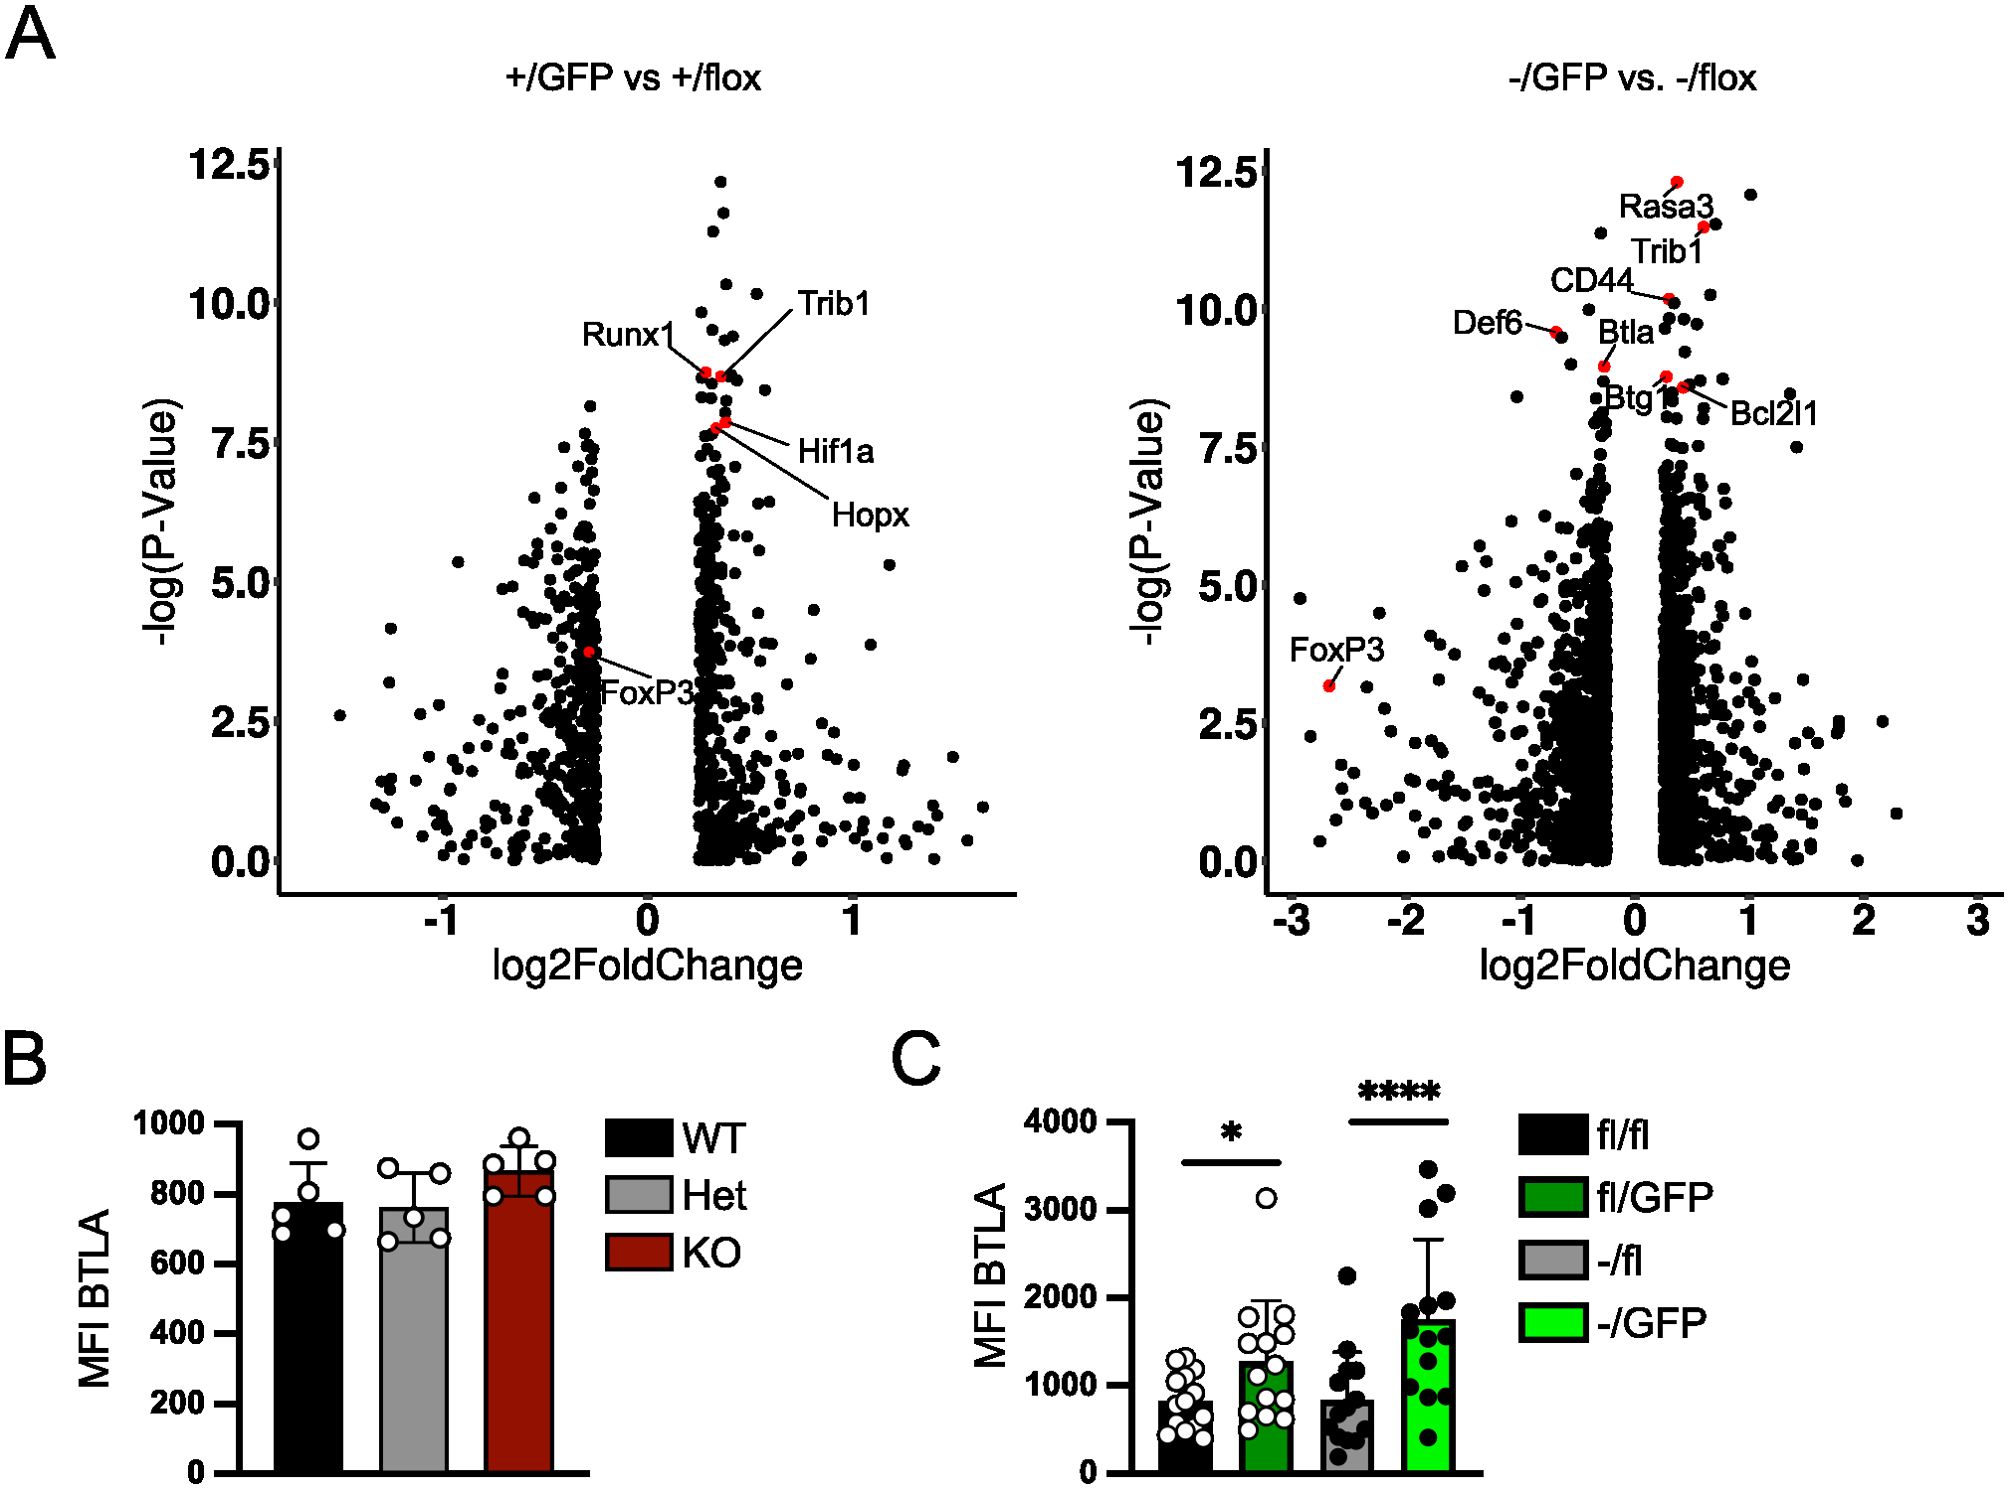
Figure 6. Peripheral deletion of Irf4 alleles causes altered chromatin accessibility in Treg cells. (A–C) Rag1−/− mice were reconstituted with 4×10⁵ T cells from each naïve Irf4+/fl×CreERT2 (CD90.1+) and Irf4-/fl×CreERT2 (CD90.1-) mice. After 5 weeks, recipients were treated with tamoxifen on 5 consecutive days and after further 5 weeks, recipients were infected with LmOVA. Eight days after infection, CD90.1+ GFP- Irf4+/fl, CD90.1+ GFP+Irf4+/fl, CD90.1- GFP- Irf4-/fl, and CD90.1- GFP+ Irf4-/fl CD4+ T cells were sorted and similar numbers of each population were analyzed by single cell ATACseq. (A) Cells with an open Foxp3 locus were analyzed for differential accessibility between GFP+ Irf4+/fl and GFP- Irf4+/fl Treg cells (left) and GFP+ Irf4-/fl and GFP- Irf4-/fl Treg cells (right). (B) Mean fluorescence intensity (MFI) of staining for BTLA of FoxP3+ Treg cells from spleens of naïve Irf4+/+, Irf4+/- and Irf4-/- mice. Representative results of three independent experiments. Mean ± SEM, one-way ANOVA with Tukey’s multiple comparisons test. (C) Rag1−/− mice were reconstituted with 4×10⁵ T cells from each naïve Irf4fl/fl×CreERT2 (CD90.1+) and Irf4-/fl×CreERT2 mice. After 6–8 weeks, recipients were treated with tamoxifen on 5 consecutive days. Spleen cells were analyzed 14–18 weeks after transfer. Mean fluorescence intensity (MFI) of staining for BTLA. Pooled results of three independent experiments. Mean ± SEM. Results of corresponding GFP+ and GFP- donor cell populations in individual mice were analyzed with paired t-test. (*p < 0.05, ****p < 0.0001). Statistics for comparison of all groups are provided in Supplementary Table 1.
Peripheral deletion of Irf4 alleles results in reduced chromatin accessibility in the Foxp3 locus and Treg cell-specific super enhancers
Treg cell differentiation and stability are controlled by FoxP3 expression and the formation of Treg cell-specific super enhancers. The Foxp3 gene locus is controlled by the promotor and four enhancer elements, the conserved non-coding sequences (CNS) 0-4, required for induction and stabilization of Foxp3 expression in CD4+ T cells (54, 55). Analysis of these regulatory elements in cells with an open Foxp3 locus revealed that cells with different Irf4 genotypes differed in accessibility of these elements (Figure 7A). Accessibility of the Foxp3 promotor region and of CNS0, which together with CNS3 is required for FoxP3 induction during thymic development of Treg cells and then contributes to stability of peripheral Treg cells (54–57), was only marginally affected by inactivation of Irf4 alleles. For CNS3, we observed even slightly enhanced accessibility in GFP+ Irf4+/fl compared to GFP- Irf4+/fl Treg cells (p = 0,0477), GFP+ Irf4-/fl compared to GFP- Irf4-/fl Treg cells (p = 0.0281), and GFP+ Irf4-/fl compared to GFP- Irf4+/fl Treg cells (p = 0.0391). In contrast, CNS2, which is required for stable FoxP3 expression in activated and dividing Treg cells (54, 58, 59), showed significantly lower accessibility in GFP+ Irf4-/fl Treg cells when compared to GFP- Irf4+/fl Treg cells (p = 0.0252). CNS1, which contains a TGF-β response element and is involved in extrathymic Treg cell development (60), displayed only weak ATAC signals in all genotypes (not shown). These results indicate that Irf4 inactivation affects the regulation of Foxp3 expression and that reduced accessibility of the CNS2 locus could be responsible for the decline of FoxP3+ Treg cells.
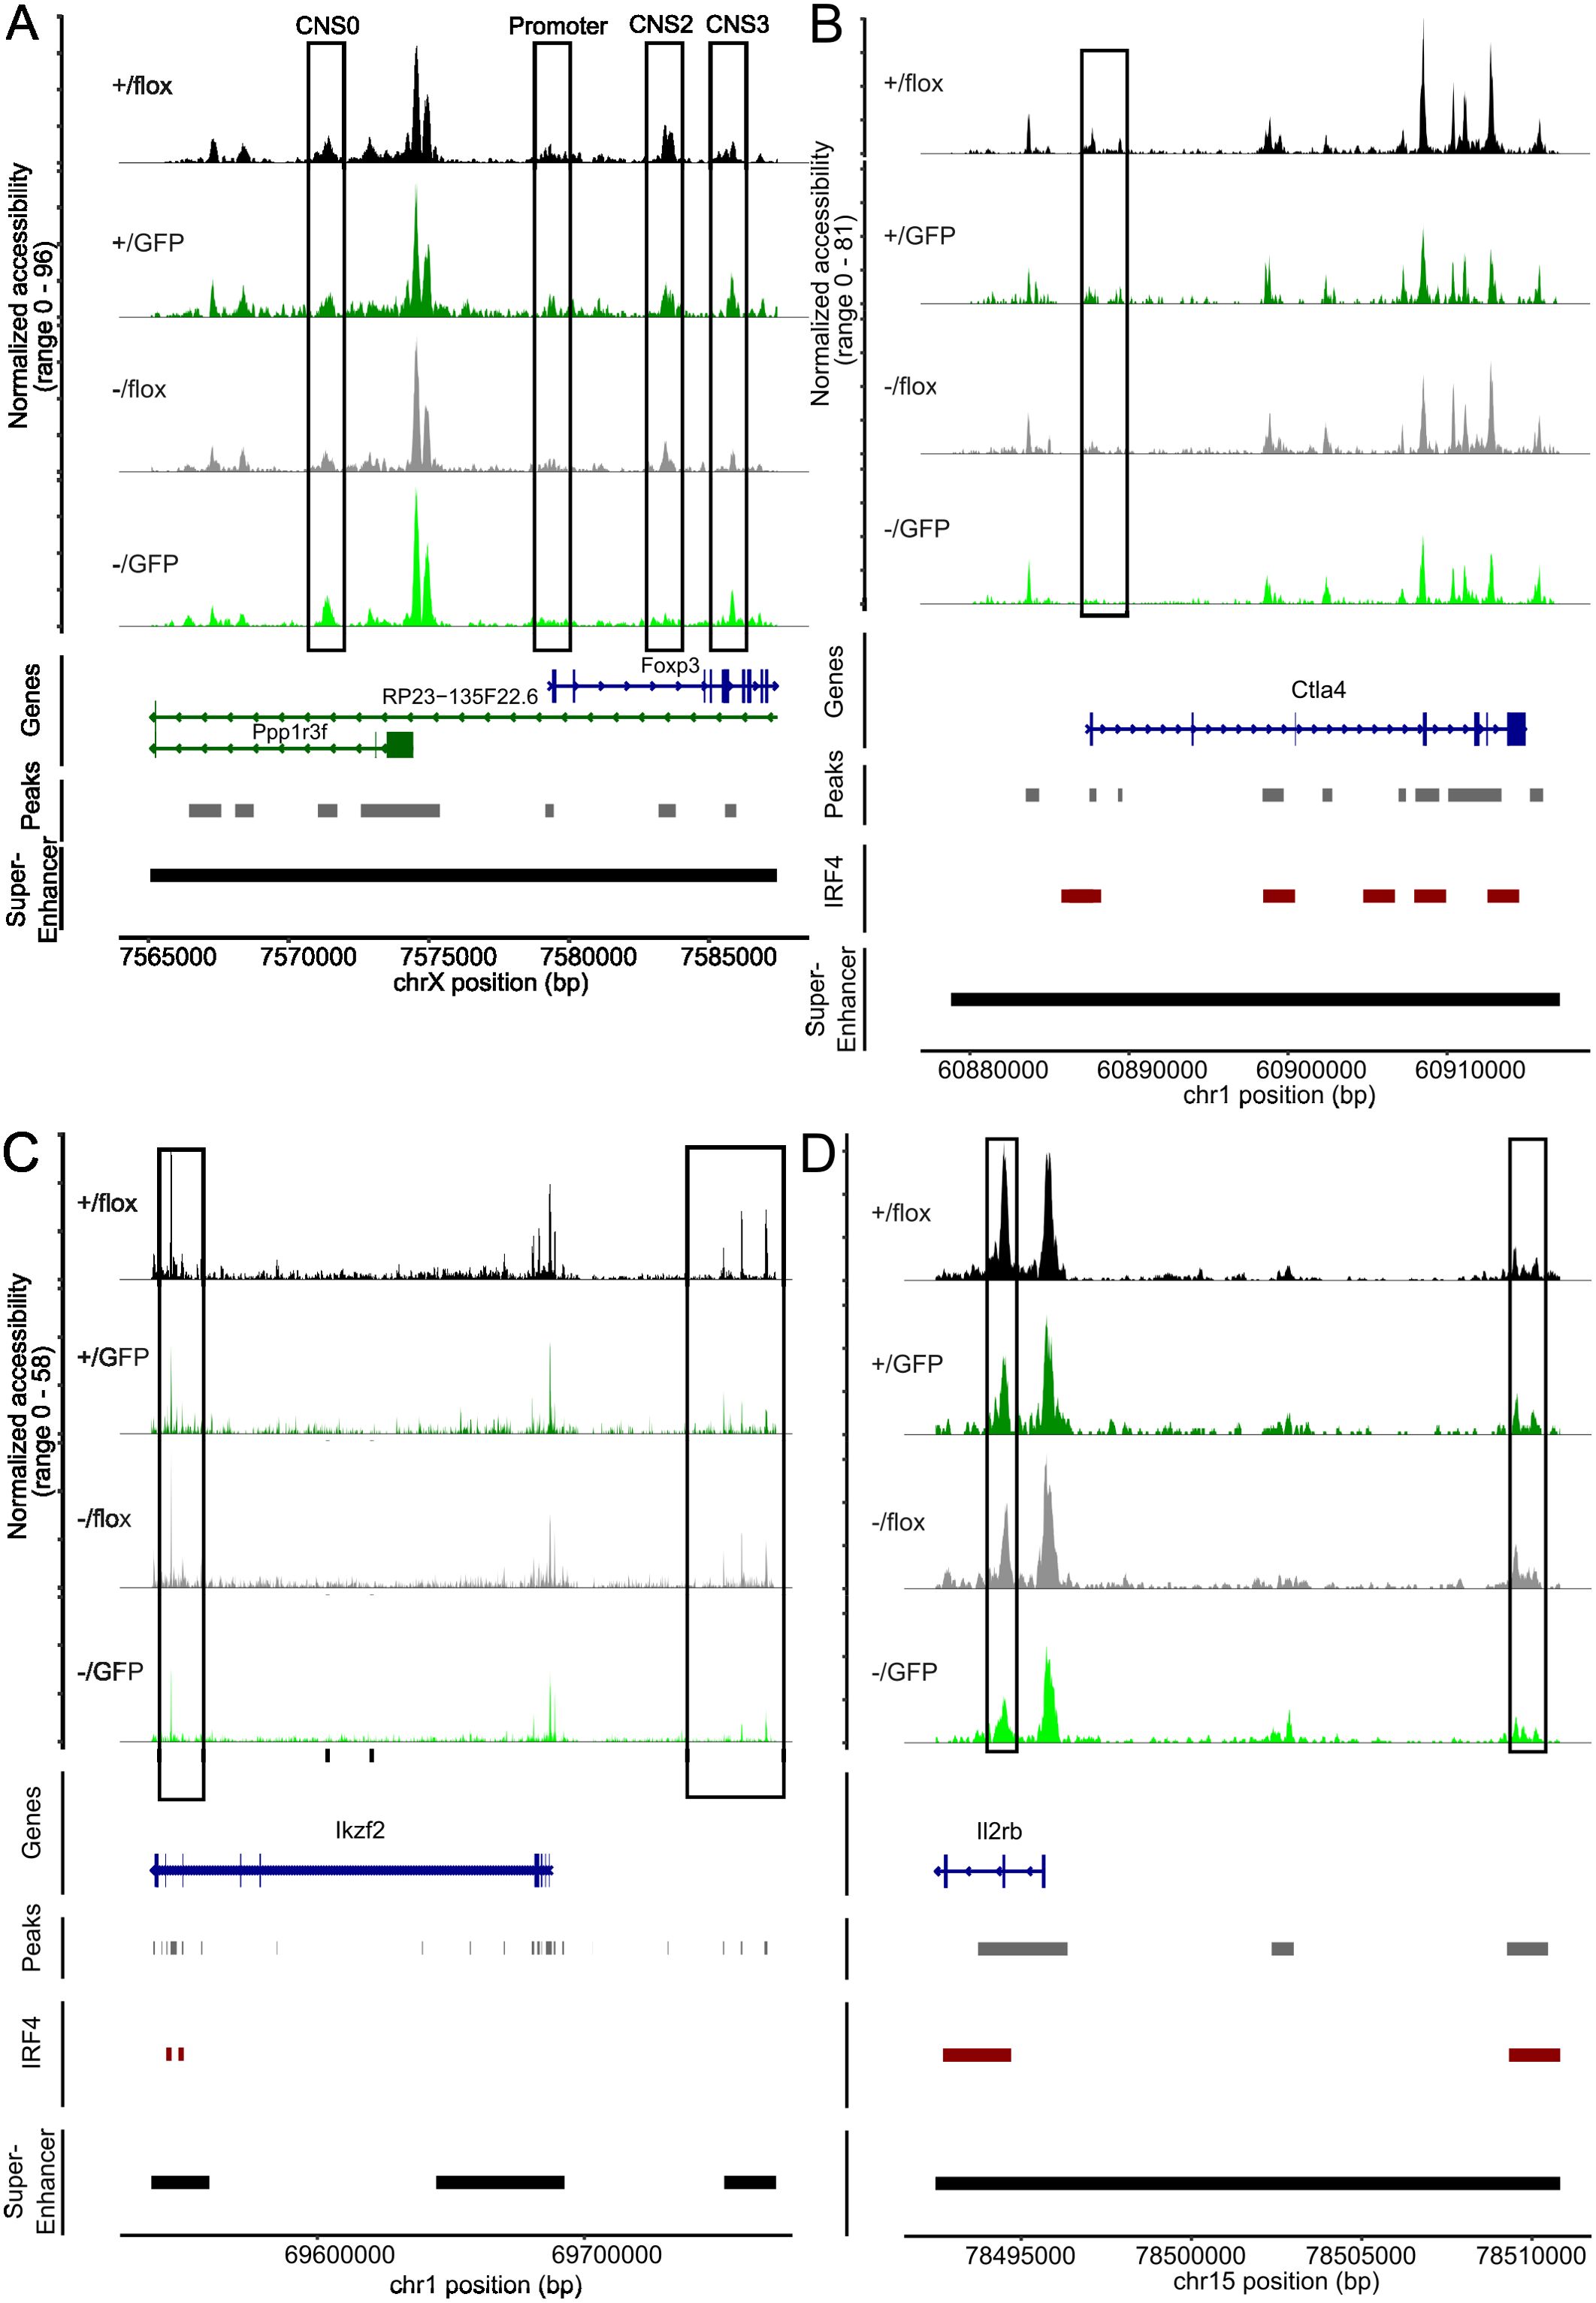
Figure 7. Peripheral deletion of Irf4 alleles results in reduced chromatin accessibility in the gene loci of Foxp3, Ctla4, Ikzf2 and Il2rb. (A) ATAC profiles for the of Foxp3 gene locus of GFP- Irf4+/fl, GFP+ Irf4+/fl, GFP- Irf4-/fl, and GFP+ Irf4-/fl Treg cells. The positions of the Foxp3 promotor and the regulatory sites CNS0, CNS2, and CNS3, as well as the position of the Treg-cell specific super enhancer on the X chromosome are indicated. (B–D) ATAC profiles for the Ctla4 (B), Ikzf2 (C) and Il2rb (D) gene loci in GFP⁻ Irf4+/fl, GFP⁺ Irf4+/fl, GFP⁻ Irf4-/fl, and GFP⁺ Irf4-/fl Treg cells. Positions with altered ATAC signals, potential IRF4 binding sites and super enhancer are indicated.
Treg cells are characterized by a set of specific super enhancers which comprise extended Treg cell-specific demethylated DNA regions. These super enhancers are established independently from FoxP3 expression during Treg cell development and control the expression of Treg cell signature genes (51, 61). Genes linked to Treg cell specific super enhancers include Ctla4, Ikzf2 (Helios), Ikzf1 (Ikaros), Il2rb, Il2ra, Tnfrsf18 (GITR), Hopx, Lrrc32 and Foxp3. There is also a set of super enhancers in conventional T cells which is not established in Treg cells and is associated with genes such as Tcf7, Satb1 and Lef1 (51). Using an IRF4 ChIP-Seq data set for Treg cells (50), IRF4 binding sites are found in several of these enhancers (Ctla4, Ikzf2, Ikzf2, Il2rb, Il2ra, Tnfrsf18, Tcf7 and Lef1) but not in Foxp3 (Supplementary Table 2). In Treg cells with inactivation of one or both Irf4 alleles, we detected areas with reduced chromatin accessibility in Treg cell-specific super enhancers associated with Ctla4, Ikzf2, Il2rb, Il2ra, Tnfrsf18, and Hopx. (Figures 7B–D, 8A–C). Reduced ATAC signals were detected in regions without and with IRF4 binding sites. Irf4 inactivation did also affect super enhancers restricted to conventional T cells. Here, we observed stronger ATAC signals in the super enhancer connected to Tcf7 (Figure 8D). Altered super enhancer accessibility correlated with reduced protein expression for CTLA4 and GITR and with enhanced expression for TCF7 in Treg cells with inactivation of one or both Irf4 alleles (Figures 2D, E).

Figure 8. Peripheral deletion of Irf4 alleles results in reduced chromatin accessibility in the gene loci of Il2ra, Tnfrsf18, Hopx and Tcf7. ATAC profiles for the gene loci of IL2Ra (A), Tnfrsf18 (B), Hopx (C) and Tcf7 (D) of GFP- Irf4+/fl, GFP+ Irf4+/fl, GFP- Irf4-/fl, and GFP+ Irf4-/fl Treg cells. Positions with altered ATAC signals, potential IRF4 binding sites and super enhancer are indicated.
Discussion
Under homeostatic conditions and at the peak of an acute listeria infection, Irf4-/- mice showed a significant reduction of FoxP3+ Treg cells. This reduction was also observed in the GFP+ Irf4-/fl cell population with induced inactivation of the remaining Irf4 allele. In both situations, reduction was associated with a profound decrease in cells expressing the eTreg cell markers CD44, ICOS, CTLA-4, TIGIT, and ST2, and with an elevated expression of Bcl-2, Bcl-X and TCF-7, characteristic for resting T cells. This result is consistent with a requirement for Irf4 for the formation of eTreg cells (4, 34–36, 38–40, 62). We also observed reduction of Treg cells in Irf4+/- mice and after co-transfer of Irf4+/fl and Irf4-/fl T cells. In the transfer approach, there was also a reduction in the expression of eTreg markers in Irf4-/fl Treg cells when compared to Irf4+/fl Treg cells, which was less pronounced in Treg cells from Irf4+/- mice. The difference might be a consequence of the competitive transfer to Rag1-/- mice. In this approach, there is no replenishment by newly generated Treg cells from the thymus. Consequently, even minor deficiencies of Irf4-/fl Treg cells in activation, survival, or peripheral proliferation could over time lead to pronounced differences when compared to Irf4+/fl Treg cells in the same environment. Additionally, differences in the peripheral generation of Treg cells would become more apparent. The situation is different for Treg cells in Irf4+/- mice, where there is ongoing replenishment of Treg cells from the thymus and no competition from Irf4+/+ Treg cells. In conclusion, these results indicate that loss of already one Irf4 allele results in impaired Treg cell formation and their differentiation to effector cells. Irf4 wild-type and Irf4 heterozygous mutant Treg cells showed low expression of IRF4 compared to the background level of Treg cells with complete Irf4 knock-out and there was even slightly enhanced IRF4 expression in Irf4+/- Treg cells. Thus, under homeostatic conditions, IRF4 expression does not fully reflect the Irf4 gene dosage. However, IRF4 is rapidly induced to high levels after TCR stimulation. Thus, Irf4 gene dosage might become more relevant following Treg cell activation. A significantly impaired effector T cell differentiation has been described for Irf4 heterozygous CD4+ and CD8+ T cells (17–21). Thus, in Treg cells as in conventional T cells, the efficacy of effector cell differentiation correlates with the Irf4 gene dosage. Induced inactivation of Irf4 alleles in peripheral Irf4+/fl and Irf4-/fl Treg cells only partially reproduced the phenotype of Treg cells from Irf4+/- and Irf4-/- mice. After peripheral inactivation of Irf4 alleles, expression of ICOS, CCR6, and ST2 largely remained at the level of their parental cell populations, thus, for some genes, IRF4 might be required for rendering gene loci accessible for transcription but be dispensable for maintenance of their transcription.
In contrast to the loss of eTreg markers, expression of TGF-β, and Lrrc32 was only marginally reduced in heterozygous Irf4-/fl Treg cells. Peripheral inactivation of Irf4 alleles in Irf4+/fl and Irf4-/fl Treg cells even resulted in enhanced percentages of Treg cells producing the proteins. Thus, high IRF4 concentration appears to be not required for the production of these proteins by Treg cells, and in peripheral Treg cells, IRF4 might even restrict the expression of these proteins. The ability to produce TGF-β together with the residual expression of inhibitory surface proteins such as CTLA-4 could also be responsible for the remaining low level in vitro suppressive capacity of Irf4-/fl Treg cells with induced inactivation of the second Irf4 allele. Enhanced production after induced inactivation of Irf4 alleles was also observed for IL-2 and IFN-γ, and elevated cytokine expression was associated with enhanced levels of CXCR3, typical for Th1 cells, and of the transcription factors T-bet and Blimp-1 associated with effector functions of T cells. It has been suggested, that several transcription factors cooperate with FoxP3 to reinforce gene networks involved in Treg cell function (63, 64). In human Treg cells, IRF4 together with FOXO1 cooperates with FoxP3 in activation or repression of genes. As a consequence, inactivation of either FOXO1 or IRF4 in human Treg cells results in upregulation of cytokines including IL-2 and IFN-γ (65). A similar loss of repression could cause upregulation of cytokines and transcription factors after inactivation of Irf4 alleles in peripheral Treg cells.
After competitive injection of a 1:1 mix of T cells from tamoxifen-treated Irf4+/fl×CreERT2 and Irf4-/fl×CreERT2 donors, Treg cells of both populations established within two weeks in a 10:1 ratio and then remained at this ratio over the whole observation period and in all analyzed tissues. Hence, Irf4 heterozygosity appears to be of disadvantage for establishing stable Treg cell populations but not for their long-term maintenance. In contrast, inactivation of Irf4 alleles in peripheral Treg cells resulted in a slow decline of these populations over time. Thus, reduction of an established IRF4 expression level in Treg cells appears to impair long-term survival of these cells. This result could indicate that peripheral Treg cells have adapted to a continuous TCR signal and reduction of the strength of this signal results in impaired survival. Particularly in GFP+ Irf4-/fl T cells with induced inactivation of the remaining Irf4 allele, we paradoxically observed increased expression of Bcl-2 and TCF-7, both associated with survival, but also elevated levels of Ki-67+ or PCNA+ proliferating cells. Similar to cytokine expression, peripheral loss of Irf4 alleles might also allow enhanced expression of genes required for proliferation. However, enhanced proliferation together with increased expression of survival markers appears to be not sufficient to prevent the slow decline of these IRF4-deficient Treg cell populations.
ATAC sequencing revealed gene loci with altered accessibility after peripheral inactivation of Irf4 alleles. Genes with mRNA expression in Treg cells - according to the immgen database [immgen.org, (66)] - and a potential role in Treg cells included Runx1, Trib1, Hif1a, and Hopx with reduced accessibility after Irf4 inactivation in Irf4+/fl Treg cells, and Rasa3, Trib1, Cd44, Btg1 and Bcl2l1 with reduced or Btla and Def6 with enhanced accessibility after Irf4 inactivation in Irf4-/fl Treg cells. Information on these genes is provided in (Table 1) (39, 51, 64, 67–83). Reduced protein expression, or enhanced expression in the case of BTLA and DEF6, could alter Treg cell maintenance or function after loss of Irf4 alleles. For Cd44 and Btla, altered accessibility correlated with reduced or enhanced protein expression, respectively, in Treg cells with inactivation of Irf4 alleles. Reduced accessibility of Bcl2l1 did not correlate with higher expression of Bcl-X (encoded by Bcl2l1). However, we cannot exclude that cells with reduced accessibility of Bcl2l1 and with elevated expression of Bcl-X comprise different Treg cell subsets.
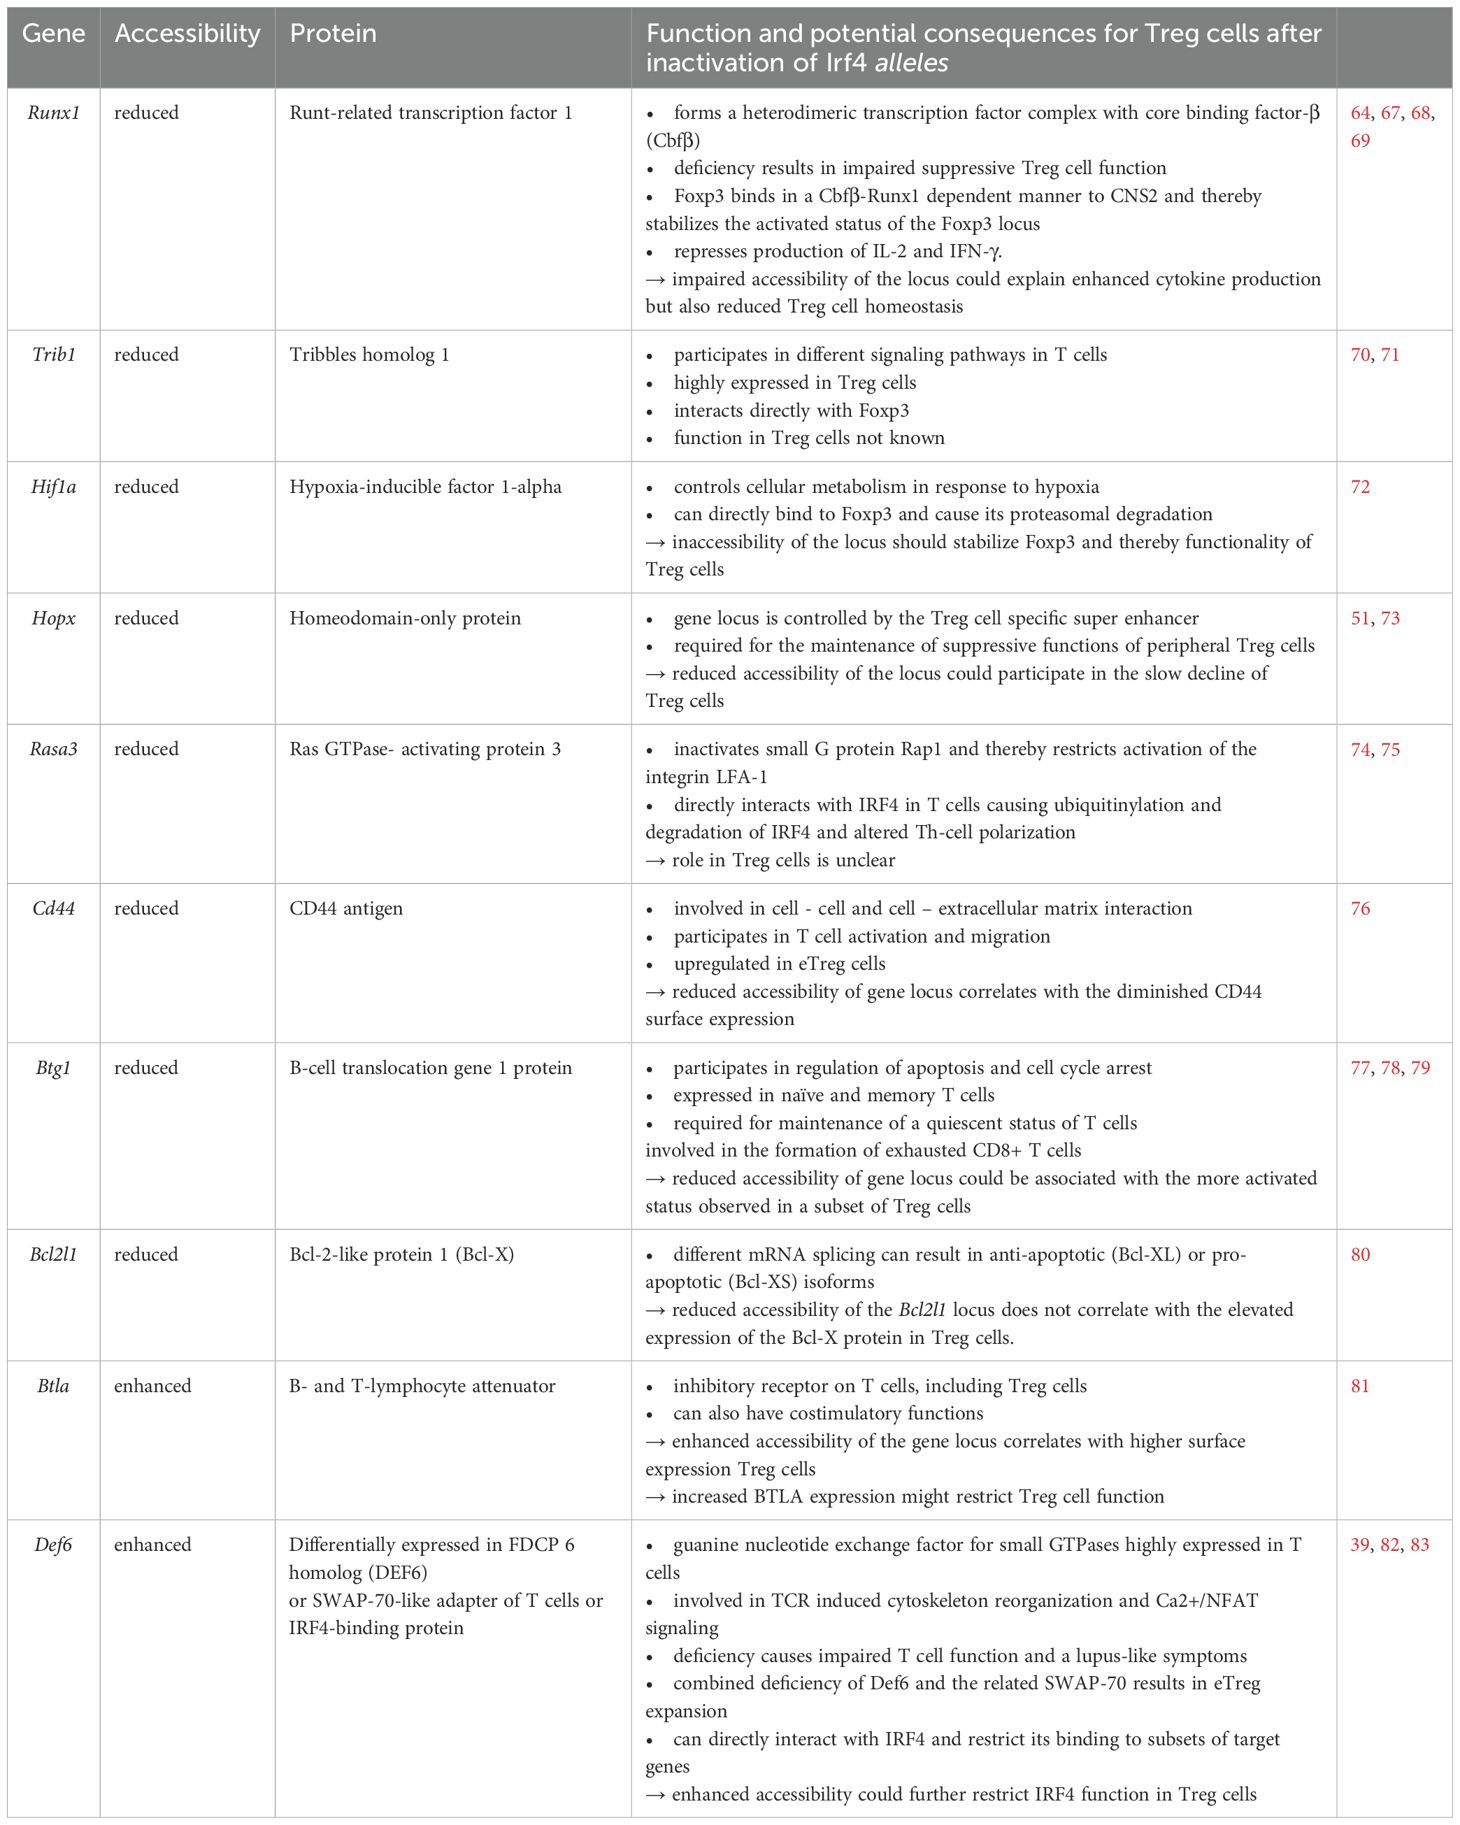
Table 1. Genes with differential accessibility after induced peripheral inactivation of Irf4 alleles.
Analysis of the ATAC profiles of the Foxp3 locus after Irf4 inactivation revealed enhanced accessibility of CNS3 and reduced accessibility of CNS2. In T cells of all Irf4 genotypes, only weak signals were detected in CNS1. CNS1 is important for extrathymic Treg cell differentiation (60), which might occur only at a low level in the spleen in homeostasis. CNS0 and CNS3 control FoxP3 induction during thymic Treg cell development, and subsequently contribute to FoxP3 stability in Treg cells in the periphery (54–57). In contrast, CNS2 is required for the stability of FoxP3 after TCR stimulation of Treg cells (58, 59), and deletion of the CNS2 results in loss of activated and dividing Treg cells (54). Inactivation of the TCR in peripheral Treg cells causes defective eTreg cell differentiation but also impaired Treg cell homeostasis which can be in part attributed to restricted IRF4 expression (34, 35). Reduced accessibility of the CNS2 region observed after inactivation of IRF4 could mirror the absence of TCR signaling and thus be responsible for the failure of Treg cell homeostasis.
Inactivation of one or both Irf4 alleles caused reduced ATAC signals in Treg cell-specific super enhancers associated with Ctla4, Ikzf2, Il2rb, Il2ra, Tnfrsf18, and Hopx. Reduced ATAC signals were most prominent at IRF4 binding sites and after induced inactivation of the remaining Irf4 allele of Irf4-/fl Treg cells indicating that IRF4 binding is required for maintaining accessibility of these regions in Treg cells. For Ctla4 and Tnfrsf18, reduced ATAC signals at IRF4 binding sites correlated well with the reduced expression level, thus lack of or reduced IRF4 binding to sites might be directly responsible for the impaired gene expression. Tcf7 is associated with a super enhancer restricted to conventional T cells (51). Consistent with stronger ATAC signals in the promotor region, we also observed enhanced TCF-7 expression in Treg cells with complete Irf4 deletion. However, increased ATAC signals did not match with the IRF4-binding site and therefore might not be a consequence of direct IRF4 binding to the Tcf7 gene loci.
Overall, our results demonstrate that IRF4 has an essential role in the function of peripheral Treg cells by modulating chromatin accessibility and that loss of one Irf4 allele can already influence the differentiation status and homeostasis of these cells.
Data availability statement
The datasets presented in this study can be found in online repositories. The names of the repository/repositories and accession number(s) can be found below: https://www.ncbi.nlm.nih.gov/geo/, GSE293231.
Ethics statement
The animal study was approved by local committee for animal experiments of the City of Hamburg. The study was conducted in accordance with the local legislation and institutional requirements.
Author contributions
LCV: Conceptualization, Data curation, Formal Analysis, Investigation, Methodology, Visualization, Writing – original draft, Writing – review & editing. CS: Conceptualization, Data curation, Formal Analysis, Investigation, Validation, Writing – review & editing. AH: Conceptualization, Data curation, Formal Analysis, Investigation, Validation, Writing – review & editing. MS: Data curation, Formal Analysis, Investigation, Methodology, Software, Writing – review & editing. PB: Investigation, Writing – review & editing. AB: Investigation, Writing – review & editing. SF: Investigation, Writing – review & editing. JS: Investigation, Writing – review & editing. FK-N: Resources, Writing – review & editing. CFK: Resources, Writing – review & editing. FR: Conceptualization, Data curation, Formal Analysis, Funding acquisition, Investigation, Methodology, Project administration, Supervision, Writing – original draft, Writing – review & editing. H-WM: Conceptualization, Formal Analysis, Funding acquisition, Project administration, Supervision, Validation, Writing – original draft, Writing – review & editing.
Funding
The author(s) declare that financial support was received for the research and/or publication of this article. This study was supported by grants from the Deutsche Forschungsgemeinschaft: GRK 841 to CS and AH, SFB 841 and MI 471/7 to H-WM, and RA 2893/2 to FR. LCV was supported by a grant from the Else Kröner-Fresenius-Stiftung (iPRIME). We further acknowledge financial support from the Open Access Publication Fund of UKE - Universitätsklinikum Hamburg-Eppendorf.
Acknowledgments
We thank Drs. Dietmar Zehn (Freising, Germany), Tobias Bopp (Mainz, Germany), Ulf Klein (Leeds, UK), and Hanna Taipaleenmäki (Munich, Germany) for providing bacteria strains and mouse lines, and the Single Cell Core Facility of the University Medical center Hamburg-Eppendorf for processing of ATAC samples.
Conflict of interest
The authors declare that the research was conducted in the absence of any commercial or financial relationships that could be construed as a potential conflict of interest.
Generative AI statement
The author(s) declare that no Generative AI was used in the creation of this manuscript.
Publisher’s note
All claims expressed in this article are solely those of the authors and do not necessarily represent those of their affiliated organizations, or those of the publisher, the editors and the reviewers. Any product that may be evaluated in this article, or claim that may be made by its manufacturer, is not guaranteed or endorsed by the publisher.
Supplementary material
The Supplementary Material for this article can be found online at: https://www.frontiersin.org/articles/10.3389/fimmu.2025.1604888/full#supplementary-material.
References
1. Huber M and Lohoff M. IRF4 at the crossroads of effector T-cell fate decision. Eur J Immunol. (2014) 44:1886–95. doi: 10.1002/eji.201344279
2. Lohoff M, Mittrücker HW, Prechtl S, Bischof S, Sommer F, Kock S, et al. Dysregulated T helper cell differentiation in the absence of interferon regulatory factor 4. Proc Natl Acad Sci USA. (2002) 99:11808–12. doi: 10.1073/pnas.182425099
3. Brüstle A, Heink S, Huber M, Rosenplänter C, Stadelmann C, Yu P, et al. The development of inflammatory T(H)-17 cells requires interferon-regulatory factor 4. Nat Immunol. (2007) 8:958–66. doi: 10.1038/ni1500
4. Cretney E, Xin A, Shi W, Minnich M, Masson F, Miasari M, et al. The transcription factors Blimp-1 and IRF4 jointly control the differentiation and function of effector regulatory T cells. Nat Immunol. (2011) 12:304–11. doi: 10.1038/ni.2006
5. Raczkowski F, Ritter J, Heesch K, Schumacher V, Guralnik A, Höcker L, et al. The transcription factor Interferon Regulatory Factor 4 is required for the generation of protective effector CD8+ T cells. Proc Natl Acad Sci USA. (2013) 110:15019–24. doi: 10.1073/pnas.1309378110
6. Krishnamoorthy V, Kannanganat S, Maienschein-Cline M, Cook SL, Chen J, Bahroos N, et al. The IRF4 gene regulatory module functions as a read-write integrator to dynamically coordinate T helper cell fate. Immunity. (2017) 47:481–497.e7. doi: 10.1016/j.immuni.2017.09.001
7. Bravo García-Morato M, Aracil Santos FJ, Briones AC, Blázquez Moreno A, Del Pozo Maté Á, Domínguez-Soto Á, et al. New human combined immunodeficiency caused by interferon regulatory factor 4 (IRF4) deficiency inherited by uniparental isodisomy. J Allergy Clin Immunol. (2018) 141:1924–1927.e18. doi: 10.1016/j.jaci.2017.12.995
8. Thouenon R, Chentout L, Moreno-Corona N, Poggi L, Lombardi EP, Hoareau B, et al. A neomorphic mutation in the interferon activation domain of IRF4 causes a dominant primary immunodeficiency. J Exp Med. (2023) 220:e20221292. doi: 10.1084/jem.20221292
9. IRF4 International Consortium, Fornes O, Jia A, Kuehn HS, Min Q, Pannicke U, et al. A multimorphic mutation in IRF4 causes human autosomal dominant combined immunodeficiency. Sci Immunol. (2023) 8:eade7953. doi: 10.1126/sciimmunol.ade7953
10. Ciofani M, Madar A, Galan C, Sellars M, Mace K, Pauli F, et al. A validated regulatory network for Th17 cell specification. Cell. (2012) 151:289–303. doi: 10.1016/j.cell.2012.09.016
11. Man K, Miasari M, Shi W, Xin A, Henstridge DC, Preston S, et al. The transcription factor IRF4 is essential for TCR affinity-mediated metabolic programming and clonal expansion of T cells. Nat Immunol. (2013) 14:1155–65. doi: 10.1038/ni.2710
12. Man K and Kallies A. Synchronizing transcriptional control of T cell metabolism and function. Nat Rev Immunol. (2015) 15:574–84. doi: 10.1038/nri3874
13. Glasmacher E, Agrawal S, Chang AB, Murphy TL, Zeng W, Vander Lugt B, et al. A genomic regulatory element that directs assembly and function of immune-specific AP-1-IRF complexes. Science. (2012) 338:975–80. doi: 10.1126/science.1228309
14. Li P, Spolski R, Liao W, Wang L, Murphy TL, Murphy KM, et al. BATF-JUN is critical for IRF4-mediated transcription in T cells. Nature. (2012) 490:543–6. doi: 10.1038/nature11530
15. Murphy TL, Tussiwand R, and Murphy KM. Specificity through cooperation: BATF-IRF interactions control immune-regulatory networks. Nat Rev Immunol. (2013) 13:499–509. doi: 10.1038/nri3470
16. Iwata A, Durai V, Tussiwand R, Briseño CG, Wu X, Grajales-Reyes GE, et al. Quality of TCR signaling determined by differential affinities of enhancers for the composite BATF-IRF4 transcription factor complex. Nat Immunol. (2017) 18:563–72. doi: 10.1038/ni.3714
17. Nayar R, Schutten E, Bautista B, Daniels K, Prince AL, Enos M, et al. Graded levels of IRF4 regulate CD8+ T cell differentiation and expansion, but not attrition, in response to acute virus infection. J Immunol. (2014) 192:5881–93. doi: 10.4049/jimmunol.1303187
18. Nayar R, Schutten E, Jangalwe S, Durost PA, Kenney LL, Conley JM, et al. IRF4 regulates the ratio of T-bet to eomesodermin in CD8+ T cells responding to persistent LCMV infection. PloS One. (2015) 10:e0144826. doi: 10.1371/journal.pone.0144826
19. Man K, Gabriel SS, Liao Y, Gloury R, Preston S, Henstridge DC, et al. Transcription factor IRF4 promotes CD8+ T cell exhaustion and limits the development of memory-like T cells during chronic infection. Immunity. (2017) 47:1129–1141.e5. doi: 10.1016/j.immuni.2017.11.021
20. Harberts A, Schmidt C, Schmid J, Reimers D, Koch-Nolte F, Mittrücker HW, et al. Interferon regulatory factor 4 controls effector functions of CD8+ memory T cells. Proc Natl Acad Sci USA. (2021) 118:e2014553118. doi: 10.1073/pnas.2014553118
21. Schmidt C, Harberts A, Reimers D, Bertram T, Voß LC, Schmid J, et al. IRF4 is required for migration of CD4+ T cells to the intestine but not for Th2 and Th17 cell maintenance. Front Immunol. (2023) 14:1182502. doi: 10.3389/fimmu.2023.1182502
22. Sakaguchi S, Mikami N, Wing JB, Tanaka A, Ichiyama K, and Ohkura N. Regulatory T cells and human disease. Annu Rev Immunol. (2020) 38:541–66. doi: 10.1146/annurev-immunol-042718-041717
23. Brown CC and Rudensky AY. Spatiotemporal regulation of peripheral T cell tolerance. Science. (2023) 380:472–8. doi: 10.1126/science.adg6425
24. Dikiy S and Rudensky AY. Principles of regulatory T cell function. Immunity. (2023) 56:240–55. doi: 10.1016/j.immuni.2023.01.004
25. Fontenot JD, Gavin MA, and Rudensky AY. Foxp3 programs the development and function of CD4+CD25+ regulatory T cells. Nat Immunol. (2003) 4:330–6. doi: 10.1038/ni904
26. Hori S, Nomura T, and Sakaguchi S. Control of regulatory T cell development by the transcription factor Foxp3. Science. (2003) 299:1057–61. doi: 10.1126/science.1079490
27. Khattri R, Cox T, Yasayko SA, and Ramsdell F. An essential role for Scurfin in CD4+CD25+ T regulatory cells. Nat Immunol. (2003) 4:337–42. doi: 10.1038/ni909
28. Fontenot JD, Rasmussen JP, Williams LM, Dooley JL, Farr AG, and Rudensky AY. Regulatory T cell lineage specification by the forkhead transcription factor foxp3. Immunity. (2005) 22:329–41. doi: 10.1016/j.immuni.2005.01.016
29. Gavin MA, Rasmussen JP, Fontenot JD, Vasta V, Manganiello VC, Beavo JA, et al. Foxp3-dependent programme of regulatory T-cell differentiation. Nature. (2007) 445:771–5. doi: 10.1038/nature05543
30. Williams LM and Rudensky AY. Maintenance of the Foxp3-dependent developmental program in mature regulatory T cells requires continued expression of Foxp3. Nat Immunol. (2007) 8:277–84. doi: 10.1038/ni1437
31. Zheng Y, Josefowicz SZ, Kas A, Chu TT, Gavin MA, and Rudensky AY. Genome-wide analysis of Foxp3 target genes in developing and mature regulatory T cells. Nature. (2007) 445:936–40. doi: 10.1038/nature05563
32. Bennett CL, Christie J, Ramsdell F, Brunkow ME, Ferguson PJ, Whitesell L, et al. The immune dysregulation, polyendocrinopathy, enteropathy, X-linked syndrome (IPEX) is caused by mutations of FOXP3. Nat Genet. (2001) 27:20–1. doi: 10.1038/83713
33. Brunkow ME, Jeffery EW, Hjerrild KA, Paeper B, Clark LB, Yasayko SA, et al. Disruption of a new forkhead/winged-helix protein, scurfin, results in the fatal lymphoproliferative disorder of the scurfy mouse. Nat Genet. (2001) 27:68–73. doi: 10.1038/83784
34. Levine AG, Arvey A, Jin W, and Rudensky AY. Continuous requirement for the TCR in regulatory T cell function. Nat Immunol. (2014) 15:1070–8. doi: 10.1038/ni.3004
35. Vahl JC, Drees C, Heger K, Heink S, Fischer JC, Nedjic J, et al. Continuous T cell receptor signals maintain a functional regulatory T cell pool. Immunity. (2014) 41:722–36. doi: 10.1016/j.immuni.2014.10.012
36. Zheng Y, Chaudhry A, Kas A, deRoos P, Kim JM, Chu TT, et al. Regulatory T-cell suppressor program co-opts transcription factor IRF4 to control T(H)2 responses. Nature. (2009) 458:351–6. doi: 10.1038/nature07674
37. Darce J, Rudra D, Li L, Nishio J, Cipolletta D, Rudensky AY, et al. An N-terminal mutation of the Foxp3 transcription factor alleviates arthritis but exacerbates diabetes. Immunity. (2012) 36:731–41. doi: 10.1016/j.immuni.2012.04.007
38. Vasanthakumar A, Moro K, Xin A, Liao Y, Gloury R, Kawamoto S, et al. The transcriptional regulators IRF4, BATF and IL-33 orchestrate development and maintenance of adipose tissue-resident regulatory T cells. Nat Immunol. (2015) 16:276–85. doi: 10.1038/ni.3085
39. Chandrasekaran U, Yi W, Gupta S, Weng CH, Giannopoulou E, Chinenov Y, et al. Regulation of effector Treg cells in murine lupus. Arthritis Rheumatol. (2016) 68:1454–66. doi: 10.1002/art.39599
40. Alvisi G, Brummelman J, Puccio S, Mazza EM, Tomada EP, Losurdo A, et al. IRF4 instructs effector Treg differentiation and immune suppression in human cancer. J Clin Invest. (2020) 130:3137–50. doi: 10.1172/JCI130426
41. Ding X, Wang A, Ma X, Demarque M, Jin W, Xin H, et al. Protein SUMOylation Is required for regulatory T cell expansion and function. Cell Rep. (2016) 16:1055–66. doi: 10.1016/j.celrep.2016.06.056
42. Mittrücker HW, Matsuyama T, Grossman A, Kündig TM, Potter J, and Shahinian A. Requirement for the transcription factor LSIRF/IRF4 for mature B and T lymphocyte function. Science. (1997) 275:540–3. doi: 10.1126/science.275.5299.540
43. Klein U, Casola S, Cattoretti G, Shen Q, Lia M, Mo T, et al. Transcription factor IRF4 controls plasma cell differentiation and class-switch recombination. Nat Immunol. (2006) 7:773–82. doi: 10.1038/ni1357
44. Hameyer D, Loonstra A, Eshkind L, Schmitt S, Antunes C, Groen A, et al. Toxicity of ligand-dependent Cre recombinases and generation of a conditional Cre deleter mouse allowing mosaic recombination in peripheral tissues. Physiol Genomics. (2007) 31:32–41. doi: 10.1152/physiolgenomics.00019.2007
45. Mombaerts P, Iacomini J, Johnson RS, Herrup K, Tonegawa S, and Papaioannou VE. RAG-1-deficient mice have no mature B and T lymphocytes. Cell. (1992) 68:869–77. doi: 10.1016/0092-8674(92)90030-g
46. Wan YY and Flavell RA. Identifying Foxp3-expressing suppressor T cells with a bicistronic reporter. Proc Natl Acad Sci USA. (2005) 102:5126–31. doi: 10.1073/pnas.0501701102
47. Zehn D, Lee SY, and Bevan MJ. Complete but curtailed T-cell response to very low-affinity antigen. Nature. (2009) 458:211–4. doi: 10.1038/nature07657
48. Anderson KG, Mayer-Barber K, Sung H, Beura L, James BR, Taylor JJ, et al. Intravascular staining for discrimination of vascular and tissue leukocytes. Nat Protoc. (2014) 9:209–22. doi: 10.1038/nprot.2014.005
49. Rissiek B, Lukowiak M, Raczkowski F, Magnus T, Mittrücker HW, and Koch-Nolte F. In vivo blockade of murine ARTC2.2 during cell preparation preserves the vitality and function of liver tissue-resident memory T cells. Front Immunol. (2018) 9:1580. doi: 10.3389/fimmu.2018.01580
50. Vasanthakumar A, Liao Y, Teh P, Pascutti MF, Oja AE, Garnham AL, et al. The TNF receptor superfamily-NF-κB Axis is critical to maintain effector regulatory T cells in lymphoid and non-lymphoid tissues. Cell Rep. (2017) 20:2906–20. doi: 10.1016/j.celrep.2017.08.068
51. Kitagawa Y, Ohkura N, Kidani Y, Vandenbon A, Hirota K, Kawakami R, et al. Guidance of regulatory T cell development by Satb1-dependent super-enhancer establishment. Nat Immunol. (2017) 18:173–83. doi: 10.1038/ni.3646
52. Cao Y, Li H, Sun Y, Chen X, Liu H, Gao X, et al. Interferon regulatory factor 4 regulates thymocyte differentiation by repressing Runx3 expression. Eur J Immunol. (2010) 40:3198–209. doi: 10.1002/eji.201040570
53. Haljasorg U, Dooley J, Laan M, Kisand K, Bichele R, Liston A, et al. Irf4 expression in thymic epithelium is critical for thymic regulatory T cell homeostasis. J Immunol. (2017) 198:1952–60. doi: 10.4049/jimmunol.1601698
54. Zheng Y, Josefowicz S, Chaudhry A, Peng XP, Forbush K, and Rudensky AY. Role of conserved non-coding DNA elements in the Foxp3 gene in regulatory T-cell fate. Nature. (2010) 463:808–12. doi: 10.1038/nature08750
55. Iizuka-Koga M, Nakatsukasa H, Ito M, Akanuma T, Lu Q, and Yoshimura A. Induction and maintenance of regulatory T cells by transcription factors and epigenetic modifications. J Autoimmun. (2017) 83:113–21. doi: 10.1016/j.jaut.2017.07.002
56. Kawakami R, Kitagawa Y, Chen KY, Arai M, Ohara D, Nakamura Y, et al. Distinct Foxp3 enhancer elements coordinate development, maintenance, and function of regulatory T cells. Immunity. (2021) 54:947–961.e8. doi: 10.1016/j.immuni.2021.04.005
57. Dikiy S, Li J, Bai L, Jiang M, Janke L, Zong X, et al. A distal Foxp3 enhancer enables interleukin-2 dependent thymic Treg cell lineage commitment for robust immune tolerance. Immunity. (2021) 54:931–946.e11. doi: 10.1016/j.immuni.2021.03.020
58. Feng Y, Arvey A, Chinen T, van der Veeken J, Gasteiger G, and Rudensky AY. Control of the inheritance of regulatory T cell identity by a cis element in the Foxp3 locus. Cell. (2014) 158:749–63. doi: 10.1016/j.cell.2014.07.031
59. Li X, Liang Y, LeBlanc M, Benner C, and Zheng Y. Function of a Foxp3 cis-element in protecting regulatory T cell identity. Cell. (2014) 158:734–48. doi: 10.1016/j.cell.2014.07.030
60. Josefowicz SZ, Niec RE, Kim HY, Treuting P, Chinen T, Zheng Y, et al. Extrathymically generated regulatory T cells control mucosal TH2 inflammation. Nature. (2012) 482:395–9. doi: 10.1038/nature10772
61. Ohkura N and Sakaguchi S. Transcriptional and epigenetic basis of Treg cell development and function: its genetic anomalies or variations in autoimmune diseases. Cell Res. (2020) 30:465–74. doi: 10.1038/s41422-020-0324-7
62. Sidwell T, Liao Y, Garnham AL, Vasanthakumar A, Gloury R, Blume J, et al. Attenuation of TCR-induced transcription by Bach2 controls regulatory T cell differentiation and homeostasis. Nat Commun. (2020) 11:252. doi: 10.1038/s41467-019-14112-2
63. Fu W, Ergun A, Lu T, Hill JA, Haxhinasto S, Fassett MS, et al. A multiply redundant genetic switch ‘locks in’ the transcriptional signature of regulatory T cells. Nat Immunol. (2012) 13:972–80. doi: 10.1038/ni.2420
64. Konopacki C, Pritykin Y, Rubtsov Y, Leslie CS, and Rudensky AY. Transcription factor Foxp1 regulates Foxp3 chromatin binding and coordinates regulatory T cell function. Nat Immunol. (2019) 20:232–42. doi: 10.1038/s41590-018-0291-z
65. Schumann K, Raju SS, Lauber M, Kolb S, Shifrut E, Cortez JT, et al. Functional CRISPR dissection of gene networks controlling human regulatory T cell identity. Nat Immunol. (2020) 21:1456–66. doi: 10.1038/s41590-020-0784-4
66. Heng TS, Painter MW, and Immunological Genome Project Consortium. The Immunological Genome Project: networks of gene expression in immune cells. Nat Immunol. (2008) 9:1091–4. doi: 10.1038/ni1008-1091
67. Ono M, Yaguchi H, Ohkura N, Kitabayashi I, Nagamura Y, Nomura T, et al. Foxp3 controls regulatory T-cell function by interacting with AML1/Runx1. Nature. (2007) 446:685–9. doi: 10.1038/nature05673
68. Kitoh A, Ono M, Naoe Y, Ohkura N, Yamaguchi T, Yaguchi H, et al. Indispensable role of the Runx1-Cbfbeta transcription complex for in vivo-suppressive function of FoxP3+ regulatory T cells. Immunity. (2009) 31:609–20. doi: 10.1016/j.immuni.2009.09.003
69. Klunker S, Chong MM, Mantel PY, Palomares O, Bassin C, Ziegler M, et al. Transcription factors RUNX1 and RUNX3 in the induction and suppressive function of Foxp3+ inducible regulatory T cells. J Exp Med. (2009) 206:2701–15. doi: 10.1084/jem.20090596
70. Dugast E, Kiss-Toth E, Docherty L, Danger R, Chesneau M, Pichard V, et al. Identification of tribbles-1 as a novel binding partner of Foxp3 in regulatory T cells. J Biol Chem. (2013) 288:10051–60. doi: 10.1074/jbc.M112.448654
71. Danger R, Feseha Y, and Brouard S. The pseudokinase TRIB1 in immune cells and associated disorders. Cancers (Basel). (2022) 14:1011. doi: 10.3390/cancers14041011
72. Dang EV, Barbi J, Yang HY, Jinasena D, Yu H, Zheng Y, et al. Control of T(H)17/T(reg) balance by hypoxia-inducible factor 1. Cell. (2011) 146:772–84. doi: 10.1016/j.cell.2011.07.033
73. Hawiger D, Wan YY, Eynon EE, and Flavell RA. The transcription cofactor Hopx is required for regulatory T cell function in dendritic cell-mediated peripheral T cell unresponsiveness. Nat Immunol. (2010) 11:962–8. doi: 10.1038/ni.1929
74. Wu B, Zhang S, Guo Z, Wang G, Zhang G, Xie L, et al. RAS P21 protein activator 3 (RASA3) specifically promotes pathogenic T helper 17 cell generation by repressing T-helper-2-cell-biased programs. Immunity. (2018) 49:886–898.e5. doi: 10.1016/j.immuni.2018.09.004
75. Johansen KH, Golec DP, Okkenhaug K, and Schwartzberg PL. Mind the GAP: RASA2 and RASA3 GTPase-activating proteins as gatekeepers of T cell activation and adhesion. Trends Immunol. (2023) 44:917–31. doi: 10.1016/j.it.2023.09.002
76. McDonald B and Kubes P. Interactions between CD44 and hyaluronan in leukocyte trafficking. Front Immunol. (2015) 6:68. doi: 10.3389/fimmu.2015.00068
77. Hwang SS, Lim J, Yu Z, Kong P, Sefik E, Xu H, et al. mRNA destabilization by BTG1 and BTG2 maintains T cell quiescence. Science. (2020) 367:1255–60. doi: 10.1126/science.aax0194
78. Kim SH, Jung IR, and Hwang SS. Emerging role of anti-proliferative protein BTG1 and BTG2. BMB Rep. (2022) 55:380–8. doi: 10.5483/BMBRep.2022.55.8.092
79. Giles JR, Ngiow SF, Manne S, Baxter AE, Khan O, Wang P, et al. Shared and distinct biological circuits in effector, memory and exhausted CD8(+) T cells revealed by temporal single-cell transcriptomics and epigenetics. Nat Immunol. (2022) 23:1600–13. doi: 10.1038/s41590-022-01338-4
80. Warren CFA, Wong-Brown MW, and Bowden NA. BCL-2 family isoforms in apoptosis and cancer. Cell Death Dis. (2019) 10:177. doi: 10.1038/s41419-019-1407-6
81. Wakamatsu E, Mathis D, and Benoist C. Convergent and divergent effects of costimulatory molecules in conventional and regulatory CD4+ T cells. Proc Natl Acad Sci USA. (2013) 110:1023–8. doi: 10.1073/pnas.1220688110
82. Gupta S, Lee A, Hu C, Fanzo J, Goldberg I, Cattoretti G, et al. Molecular cloning of IBP, a SWAP-70 homologous GEF, which is highly expressed in the immune system. Hum Immunol. (2003) 64:389–401. doi: 10.1016/s0198-8859(03)00024-7
Keywords: Interferon Regulatory Factor 4, T cells, regulatory T cells, FoxP3, assay for transposase-accessible chromatin (ATAC) sequencing
Citation: Voß LC, Schmidt C, Harberts A, Spohn M, Bradtke P, Borchers A, Fertig S, Schmid J, Koch-Nolte F, Krebs CF, Raczkowski F and Mittrücker H-W (2025) Interferon Regulatory Factor 4 dose-dependently controls peripheral Treg cell differentiation and homeostasis by modulating chromatin accessibility in mice. Front. Immunol. 16:1604888. doi: 10.3389/fimmu.2025.1604888
Received: 02 April 2025; Accepted: 16 June 2025;
Published: 14 July 2025.
Edited by:
Moanaro Biswas, Indiana University, United StatesReviewed by:
Stephen Nutt, The University of Melbourne, AustraliaYohei Sato, University of Fukui, Japan
Copyright © 2025 Voß, Schmidt, Harberts, Spohn, Bradtke, Borchers, Fertig, Schmid, Koch-Nolte, Krebs, Raczkowski and Mittrücker. This is an open-access article distributed under the terms of the Creative Commons Attribution License (CC BY). The use, distribution or reproduction in other forums is permitted, provided the original author(s) and the copyright owner(s) are credited and that the original publication in this journal is cited, in accordance with accepted academic practice. No use, distribution or reproduction is permitted which does not comply with these terms.
*Correspondence: Hans-Willi Mittrücker, aC5taXR0cnVlY2tlckB1a2UuZGU=; Friederike Raczkowski, Zi5yYWN6a293c2tpQHVrZS5kZQ==
†These authors share last authorship