 Zhenjie Guan1
 Xinyu Gu
 Lian Zheng
- 1Department of Stomatology, The First Affiliated Hospital of Zhengzhou University, Zhengzhou, China
- 2Department of Oncology, The First Affiliated Hospital, College of Clinical Medicine, Henan University of Science and Technology, Zhengzhou, China
- 3Department of Oral and Maxillofacial Surgery, The First Affiliated Hospital of Zhengzhou University, Zhengzhou, China
Background: Patients suffering from head and neck squamous cell carcinoma (HNSCC) have a high recurrence rate and poor prognosis. Nicotinamide adenine dinucleotide (NAD+) is crucial in the progression of the tumor. Currently, the specific role of NAD+ in HNSCC remains elusive.
Methods: First, weighted gene co-expression network analysis (WGCNA) was utilized to screen gene modules linked to NAD+ metabolism-related genes (NMRGs), and the expression profiles obtained were taken as intersections with differentially expressed genes (DEGs) between HNSCC and control samples. The genes were further compressed and risk modeled using LASSO and stepwise regression analyses. Then the gene mutation landscapes of different risk subgroups of HNSCC were analyzed using MuTect 2 software. Differences in biological function and immune infiltration analyses between different subgroups were explored. In addition, scratch and transwell assays were carried out to explore the role of PSME1 in HNSCC cells.
Results: Here, we screened two specific modules with the strongest relation to HNSCC by WGCNA and subsequently took the intersection of 6160 DEGs with the module genes, obtaining a total of 359 intersected genes. 6 (ICOS, PSME1, SERPINA1, SH3KBP1, SP100 and ZAP70) characterized genes linked to HNSCC prognosis were selected for risk modeling. We categorized patients by the risk scores into high- and low-risk groups. Overall survival (OS) of patients in the low-risk group was significantly better than those in the high-risk group. Compared to the low-risk group, the mutation rates of FAT1, TP53, TTN genes were higher in the high-risk group, with a coexistence between the mutated genes. The expression of the characterized genes showed a positive association with the level immune cell infiltration, for example, activated CD8 T cells. The enrichment analysis demonstrated that differential genes in the high-risk HNSCC group were significantly enriched in the ribosome and other pathways, while the differential genes in the low-risk group were mainly involved in arachidonic acid metabolism and other pathways. Further in vitro assay revealed that downregulated PSME1 attenuated the migratory and invasive abilities of FaDu cells.
Conclusions: The current work provided theoretical references for future study on potential biomarkers of prognosis and immune infiltration in patients suffering from HNSCC.
Introduction
Head and neck squamous cell carcinoma (HNSCC) ranks as the sixth most frequent malignancy globally, affecting the larynx, pharynx, and oral cavity (1, 2). It has an annual incidence of approximately 600,000 and causes over 300,000 deaths (3). Most newly diagnosed HNSCC patients are in locally advanced stages, and most of them also have regional lymph node metastasis at presentation (4–6). Although current therapies (surgical and adjuvant) have shown good progress, the 5-year survival for HNSCC patients is only around 50% because of high rates of lymphatic metastasis and postoperative recurrence (7). Human tumor virus, alcohol, and tobacco have all been identified as significant risk factors for HNSCC (8). New treatment targets have been shown to potentially enhance the results of HNSCC (9). Although some progress has been made on some of the molecular mechanisms of HNSCC, the overall pathogenesis is not yet fully understood and still needs to be further explored.
Metabolic reprogramming to promote high rates of proliferation and biomass production—both essential for tumor formation and survival—is one of the characteristics of cancer (10, 11). Cancer cells depend on glycolysis and several pathways related to glycolysis, such as serine and fatty acid synthesis, pentose phosphate pathway (PPP), glutamine catabolism, to produce macromolecules and mitigate oxidative stress caused by accelerated proliferation (12). The essential metabolite nicotinamide adenine dinucleotide (NAD+), which has been linked to several redox and non-redox processes, including inflammatory responses, post-translational modifications, cell signaling, senescence, apoptosis, DNA repair, is necessary for all of these up-regulated pathways (13). In addition to being a crucial coenzyme in oxidative processes, NAD+ is also essential for immunological response, genomic stability, cell homeostasis, and cell division and death (14, 15). During glycolysis, the cytoplasmic lactate dehydrogenase (LDH) process can produce NAD+, which promotes the proliferation of tumor cells. In comparison to non-cancerous cells, tumor cells have greater ratios of NADP+/NADPH and NAD+/NAD, indicating that NAD+ is crucial to this metabolic change (16). In addition, disturbed NAD+ metabolism not only affects the redox homeostasis of tumor cells, but is also closely associated with malignant phenotypes such as immune escape, therapeutic resistance, and cell proliferation in cancer (17). However, the mechanism of this role in HNSCC remains unclear.
The present study created NAD+ metabolism-related genes (NMRGs) model to improve the prognostic outcomes and immune infiltration of HNSCC patients. Based on the expressions of NMRGs, a prognosis model of HNSCC patients was established to separate patients into low- and high-risk groups. We also analyzed the correlation between characterized genes independently linked to HNSCC prognosis and immune infiltration based on NMRGs, and explored the differences between related signaling pathways and biological functions among different subgroups. Overall, the present work offered a new method for evaluating patient prognosis and immune infiltration based on prognosis-related features by combining several common bioinformatics algorithms for HNSCC, which offers a novel direction for the treatment and prognostic assessment for patients with HNSCC.
Methods
Data collection
The Cancer Genome Atlas (TCGA) database (https://portal.gdc.cancer.gov/) included the gene expression profiling, somatic mutation, and clinical phenotype data of HNSCC. The RNA-seq data were then log2 transformed and converted to TPM format. All patients were assured to have a survival time longer than 0 days, and samples with missing survival time and survival status were eliminated when processing the TCGA-HNSCC data. Screening produced 499 HNSCC samples and 44 control samples. Furthermore, the GSE41613 data was collected from Gene Expression Omnibus (GEO, https://www.ncbi.nlm.nih.gov/geo/) database. A sum of 97 tumor samples were acquired by selecting the GEO cohort with survival time, converting the probes to Symbol according to the annotation file, and excluding samples lacking clinical follow-up information and overall generation rate data. The set of NAD+-related genes was then acquired from the MSigDB database (https://www.gsea-msigdb.org/gsea/msigdb/index.jsp), which contained the reactome database (R-HSA-196807) and KEGG pathway database (pathway: hsa00760).
Weighted gene co-expression network construction
Using ssGSEA in the “GSVA” package, we determined the NMRGs correlation scores for every TCGA-HNSCC sample (18). We next used the “WGCNA” package to create weighted gene co-expression network to find co-expression networks and select genes from various clusters (19, 20). All samples and missing genes are first clustered. Second, the optimal soft threshold power (β=16) is found using the “pickSoftThreshold” R function to identify significant correlations between modules more effectively. Then, using the requirement of at least 60 genes per module (minModuleSize = 60) to identify gene modules, we conducted a hierarchical cluster analysis. Last but not least, we employed the R package "Heatmap" (21) to extract various module signature genes according to the first principal component of module expression. Then, we assessed the relationship between the module genes and the diagnosis of clinical signature to test the association between module and signature scores. The genes contained in the modules were extracted by filtering the modules with the highest correlations (22).
Identification of DEGs and enrichment analysis
In the TCGA cohort, the “limma” package was utilized to find DEGs between HNSCC and control samples (23). Using p-adj < 0.05 and |log 2(FC)|>log2(1.5), the gene expression profile was professionally summarized, quartile normalized, and background adjusted in order to screen for significant DEGs. Following their intersection with the DEGs, the midnightblue and green modular genes were found and examined using the R package “clusterProfiler” (24) to examine the module genes’ KEGG function and gene ontology (GO) (the screening criteria was p-value < 0.05). To assess the modular gene enrichment pathways and biological processes, respectively, we created bubble diagrams by charting the top 10 functions enriched to the three terms of the GO enrichment results and the top 10 enriched KEGG pathway results. We used the R package “clusterProfiler” to compute the GSEA of the high- and low-risk groups of TCGA-HNSCC to look into the pathways of various biological processes in various subgroups. The KEGG database was used the reference for enriched pathways during analysis (25).
Risk modeling and validation
To find genes significantly linked with prognosis in TCGA-HNSCC patients (p<0.05), the R package “survival” (26) was used to conduct univariate Cox proportional risk regression on intersecting genes. To enhance the model generalization, 10-fold cross-validation was employed and LASSO Cox regression analysis of the R package "glmnet" (27) to compress the genes in order to maximize gene number in the risk model. Furthermore, multifactorial stepwise regression analysis was employed to check for important genes and correlation coefficients that were independently linked to the prognosis of HNSCC, and risk scores were computed for every patient. The following is the formula: Riskscore=Σβi×Expi, where Expi is the expression of each gene gathered, i is the gene expression level, and β is the associated gene’s Cox regression coefficient. Following zscore normalization, the Riskscore was used to assign the TCGA-HNSCC patients into high- and low-risk groups by the Riskscore’s optimal critical value. The R package “survminer” (28) was then utilized to conduct survival analysis between the low- and high-risk groups. Kaplan-Meier (KM) survival curves were then displayed for prognosis analysis, followed by using log-rank test to evaluate significant differences. Further, we examined the prediction of the model by displaying time-dependent receiver operating characteristic (ROC) curves using the R package “timeROC” (29) and calculated 1-, 2-, 3-, 4- and 5-year area under the curve (AUC). Finally, we validated the GSE41613 dataset using the same methodology to better validate the stability and reliability of our constructed clinical prognostic model based on risk-related gene signatures.
Analysis of gene mutations
Since genomic mutations are closely associated with disease onset and progression (30), we analyzed each sample in the TCGA-HNSCC cohort for gene mutations. The mutation dataset of HNSCC samples was processed using MuTect 2 software (31), and the mutation profiles of the top 10 mutated genes in the low- and high-risk groups were plotted separately.
Immunological characterization of HNSCC
The association between Riskscore and immune function in HNSCC was evaluated by analyzing the immune infiltration of the TCGA dataset samples using the R package “estimate” (32) and expressed as their respective scores (StromalScore, ImmuneScoreh and ESTIMATEScore). The association between the Riskscore of the TCGA dataset and the 10 immune cell scores was calculated using the “MCPcounter” package (33). According to the transcriptomic expression profiles of the samples, we computed the scores of 28 tumor-infiltrating immune cells (34) in the TCGA-HNSCC cohort with the ssGSEA function of the R package "GSVA".
Cell culture and siRNA transfection
MEM medium (Gibco, USA) and DMEM medium (Gibco, Grand Island, NY, USA) were used to culture human pharyngeal squamous carcinoma cell line (FaDu) and human normal squamous epithelial cell line (NOK) ordered from Procell Life Science and Technology Co. Ltd (Wuhan, China), respectively. All cultures were added with 1% penicillin-streptomycin (Solarbio, Beijing, China) and 10% fetal bovine serum (Clark, Richmond, VA, USA). All the cells were cultured in an incubator with 5% CO2 at 37°C. Utilizing Lipofectamine 3000 Transfection Reagent (Thermo Fisher Scientific, Waltham, MA, USA), si-PSME1 and negative control si-RNA were transiently transfected. si-PSME1 sequences were as follows, sense. UGGAUUUGUACCAUUCUUCUG, antisense: GAAGAAUGGUACAAAUCCAAG.
RNA extraction and quantitative real-time PCR
Total RNA from NOK and FaDu cells was separated applying RNA Extraction Kit (TRIzol, Invitrogen, Carlsbad, CA, USA) according to the manufacturer’s protocols. The purity and concentration of the total RNA were assessed, and cDNA templates were generated using the HiScript II kit (Vazyme, Nanjing, China). Quantitative real-time PCR (qRT-PCR) was conducted using specific primers and the KAPA SYBR® FAST kit (Sigma Aldrich, St Louis, MO, USA). GAPDH was an internal control, and the 2-ΔΔCT method was used for data analysis (35). Table 1 shows the primer sequences of the specific genes.
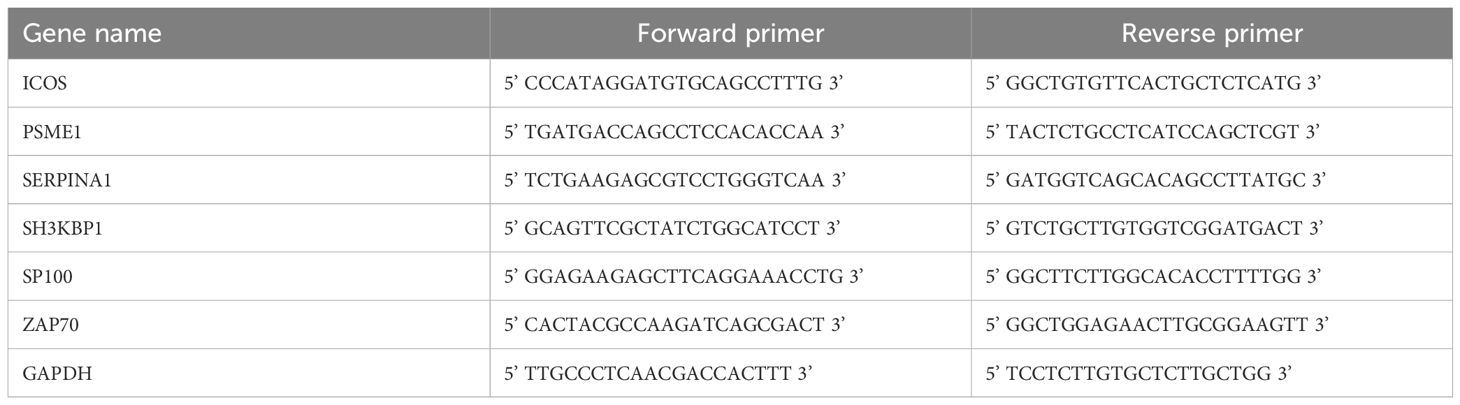
Table 1. The sequences of primers for RT−qPCR used in this study.
Wound-healing experiment
Scratch and transwell assays were subsequently carried out to examine the effect of PSME1 expression on FaDu cell migration and invasion. For migration assays, collective cell migration was detected in a wound healing assay. Transfected cells were inoculated into 6-well plates (5 × 10⁵/ml). 2 ml of cell suspension was inoculated into 6-well plates and incubated with 5% CO2 in an incubator at 37°C. When the cell density was approximately 80%, the monolayer was scraped with a 10 μL plastic pipette tip to create a uniform wound. PBS was used to wash the monolayers, which were then incubated in a non-FBS medium. The wound edge distances between two edges of migrating cell sheet were imaged at 0 h and 48 h, respectively. All the experiments were conducted three times.
Transwell experiments
For the invasion assay, 1 × 10⁵ cells were inoculated into the upper chamber covered with 10% Matrigel (Corning, Inc., Corning, NY, USA) for 24-h incubation. After the incubation, cells in the upper chamber were eliminated by swabbing, while those on the lower chamber were then fixed by 4% paraformaldehyde and dyed by 0.1% crystal violet solution. These migrated or invaded cells in the lower chamber were counted under a microscope using 6 different fields of view (36).
Statistical tests
All statistical analyses were performed using Prism 8 (GraphPad Software, San Diego, CA, USA) and R software version 3.6.0 ((R Foundation, Vienna, Austria)). Wilcoxon rank-sum test was utilized to calculate the difference between the two groups of continuous variables. Correlations were calculated using the spearman method, and the log-rank test was employed to compare the survival between patients in each subgroup. p<0.05 was defined to be statistically different.
Result
WGCNA identifies gene modules associated with NMRG
Next, we used the ssGSEA method to determine each sample’s NMRG score in the TCGA dataset. NMRG-related gene modules were identified using the R package “WGCNA”. To satisfy the scale-free topology of the network, we selected a soft threshold power of 16 to construct the topological network (Figure 1A). 9 co-expression modules were ultimately produced when the module correlation was computed and the module contained a minimum of 60 genes (Figures 1B, C). Out of the 9 modules, the grey module had a comparatively large number of genes, followed by the salmon module, as seen in Figure 1D. The gene that was unable to aggregate to other modules was known as the grey module. To select clinically important modules, we calculated the correlation of each module with NMRG scores and plotted a heat map of module-shape correlation. Among the nine modules, significant strong positive correlations were found between midnightblue and green modules and NMRG scores (midnightblue: cor = 0.7, p = 7.87e-76; green: cor = 0.49, p = 1.25e-31 and Figure 1E).
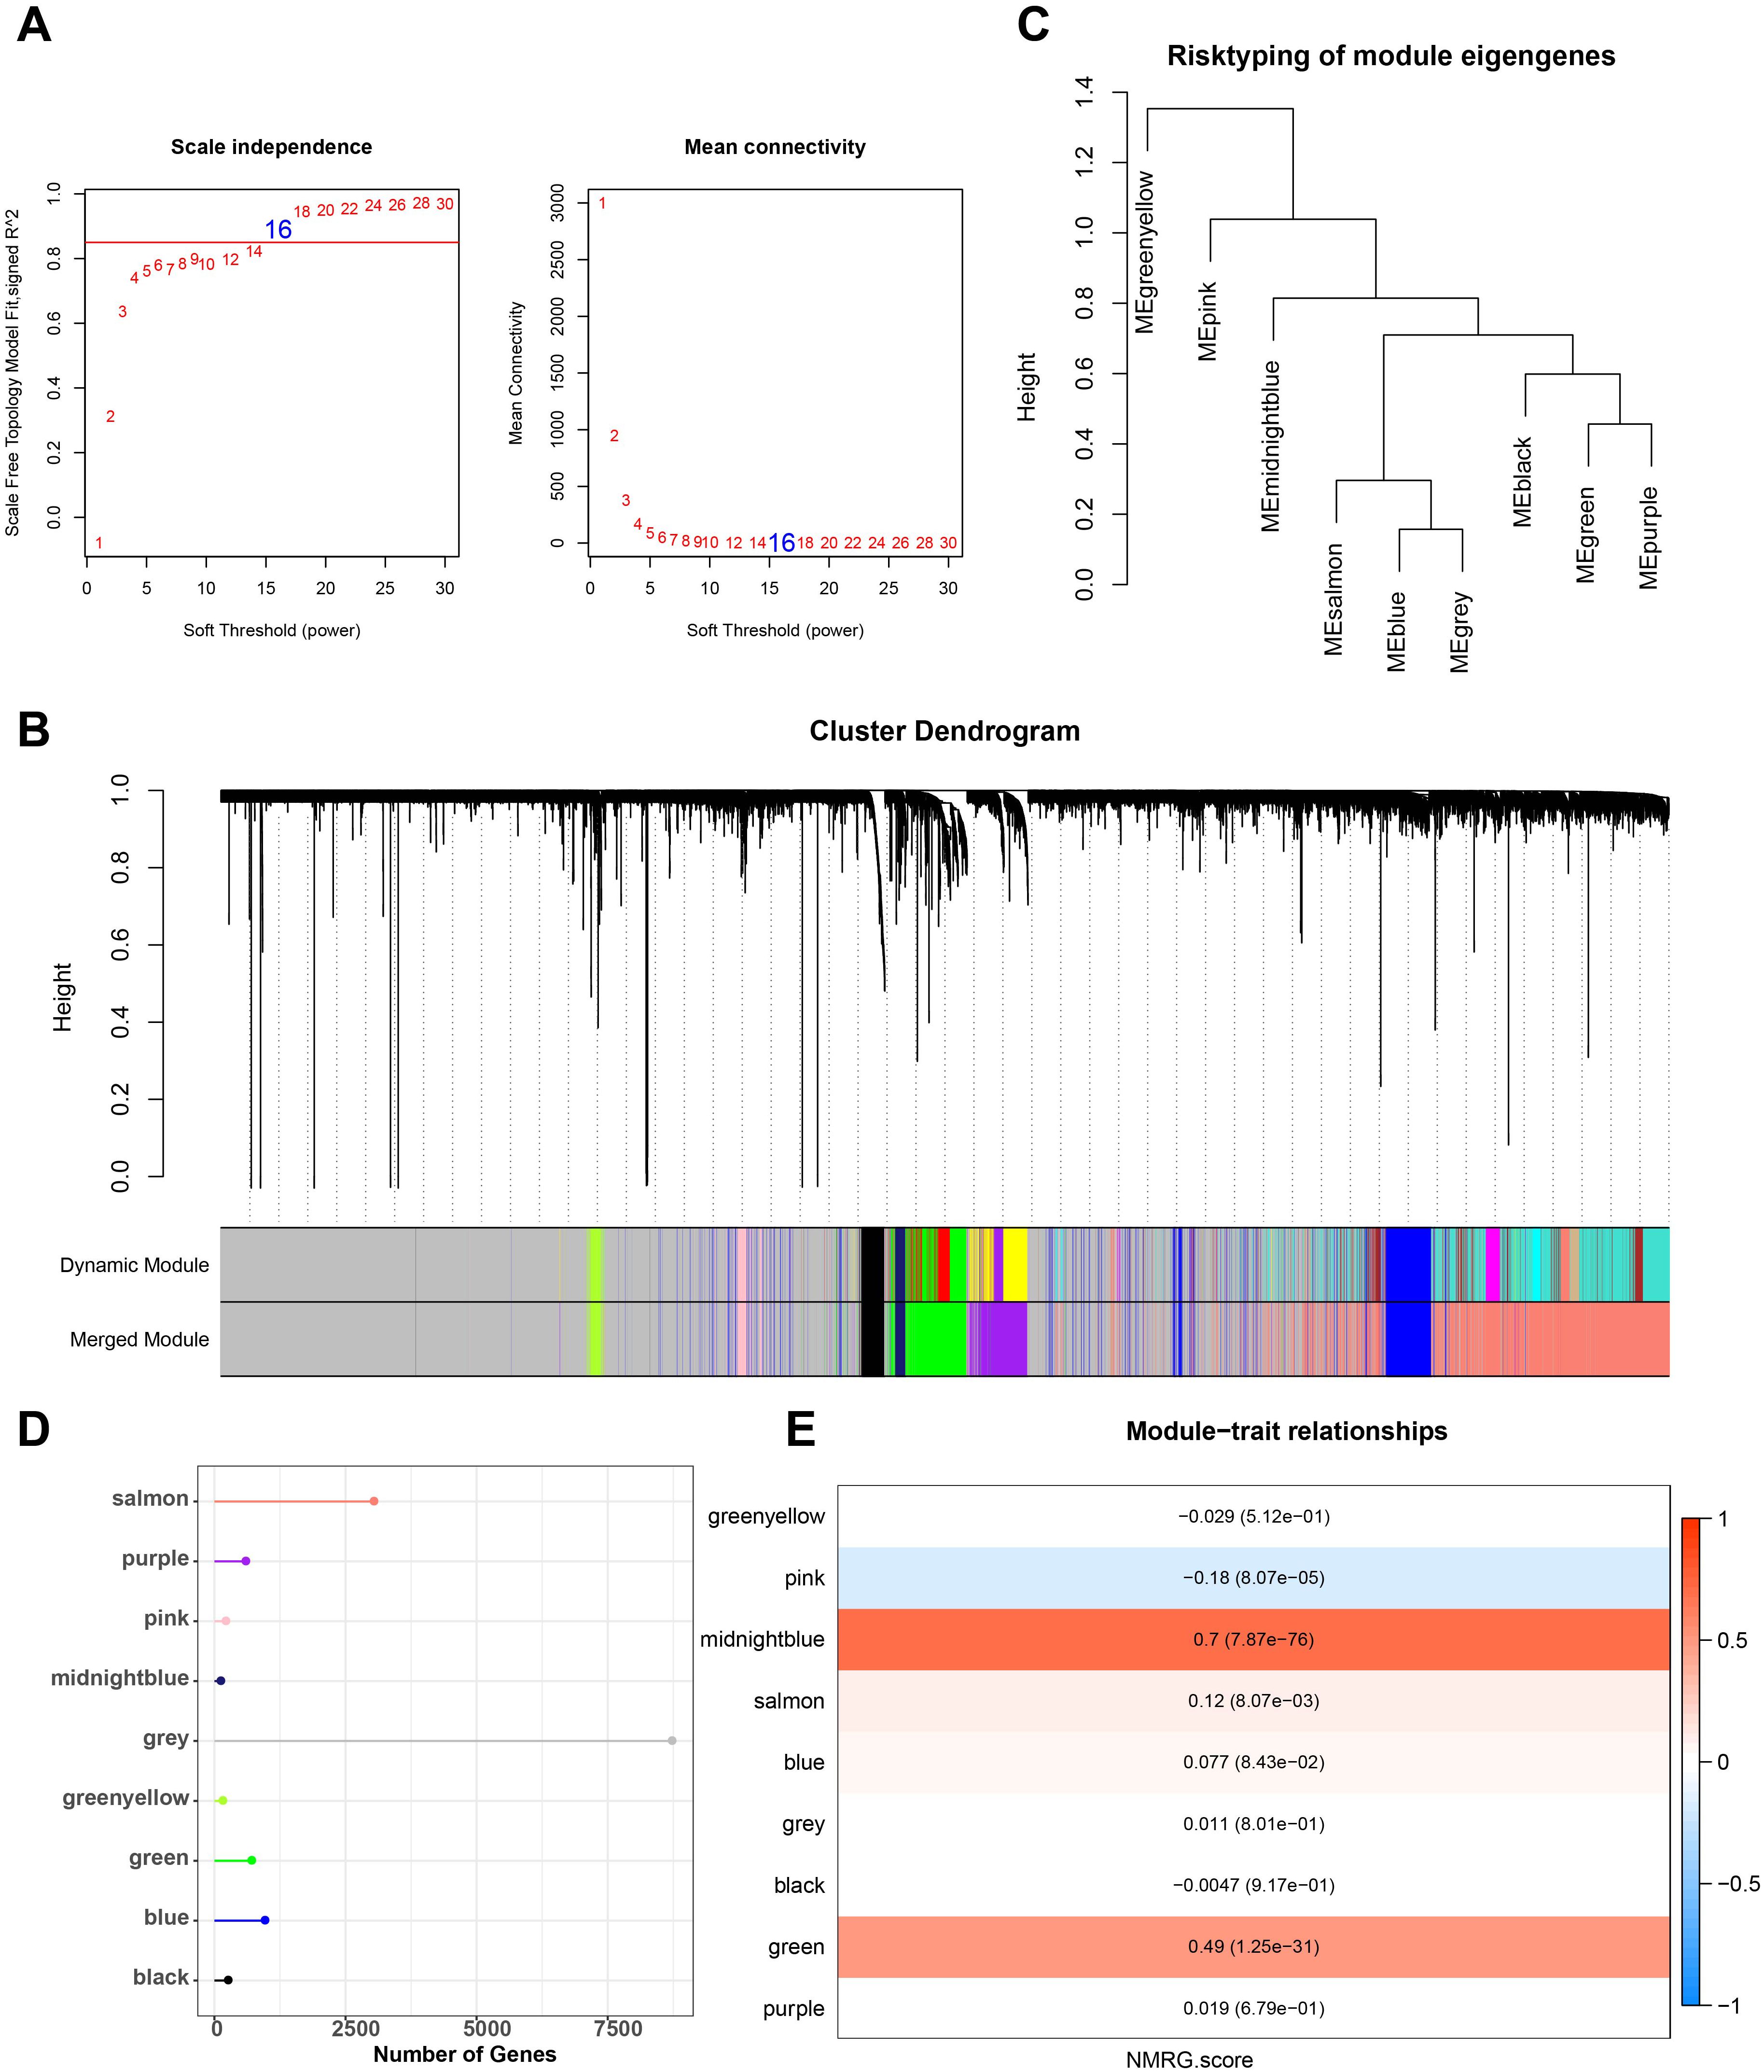
Figure 1. Construction of co-expression network for TCGA cohort. (A) Scale-free fit index analysis on different soft threshold powers (β), and average connectivity analysis on different soft threshold powers. (B, C) Gene dendrograms based on dissimilarity metric (1-TOM) clustering. (D) Gene numbers in each module. (E) Correlation of module eigenvectors with features for each module.
Differential gene analysis and enrichment analysis
Figure 2A shows the volcano map of DEGs. Next, we found DEGs between HNSCC cases and control samples in the TCGA dataset. In total, we found 1206 strongly down-regulated genes and 4954 significantly up-regulated genes. After that, we found 359 intersecting genes by taking the genes of the midnightblue and green modules and DEGs (Figure 2B). We used GO and KEGG to enrich the intersecting genes in order to investigate their regulatory involvement in the pathophysiology of HNSCC. According to KEGG analysis, pathways such as epstein-barr virus infection and cytokine-cytokine receptor interaction were significantly enriched with the intersecting genes (Figure 2C). GO enrichment analysis showed that the BPs in which the intersecting genes were largely involved were defense pathways, for instance, T cell activation and defense response to another organism (Figure 2D). The CCs that were mainly localized were side of the membrane, secretory granule membrane, endocytic vesicle and other structures (Figure 2E). The MFs most significantly enriched for intersecting genes were pathways such as cytokine receptor activity and chemokine activity (Figure 2F).
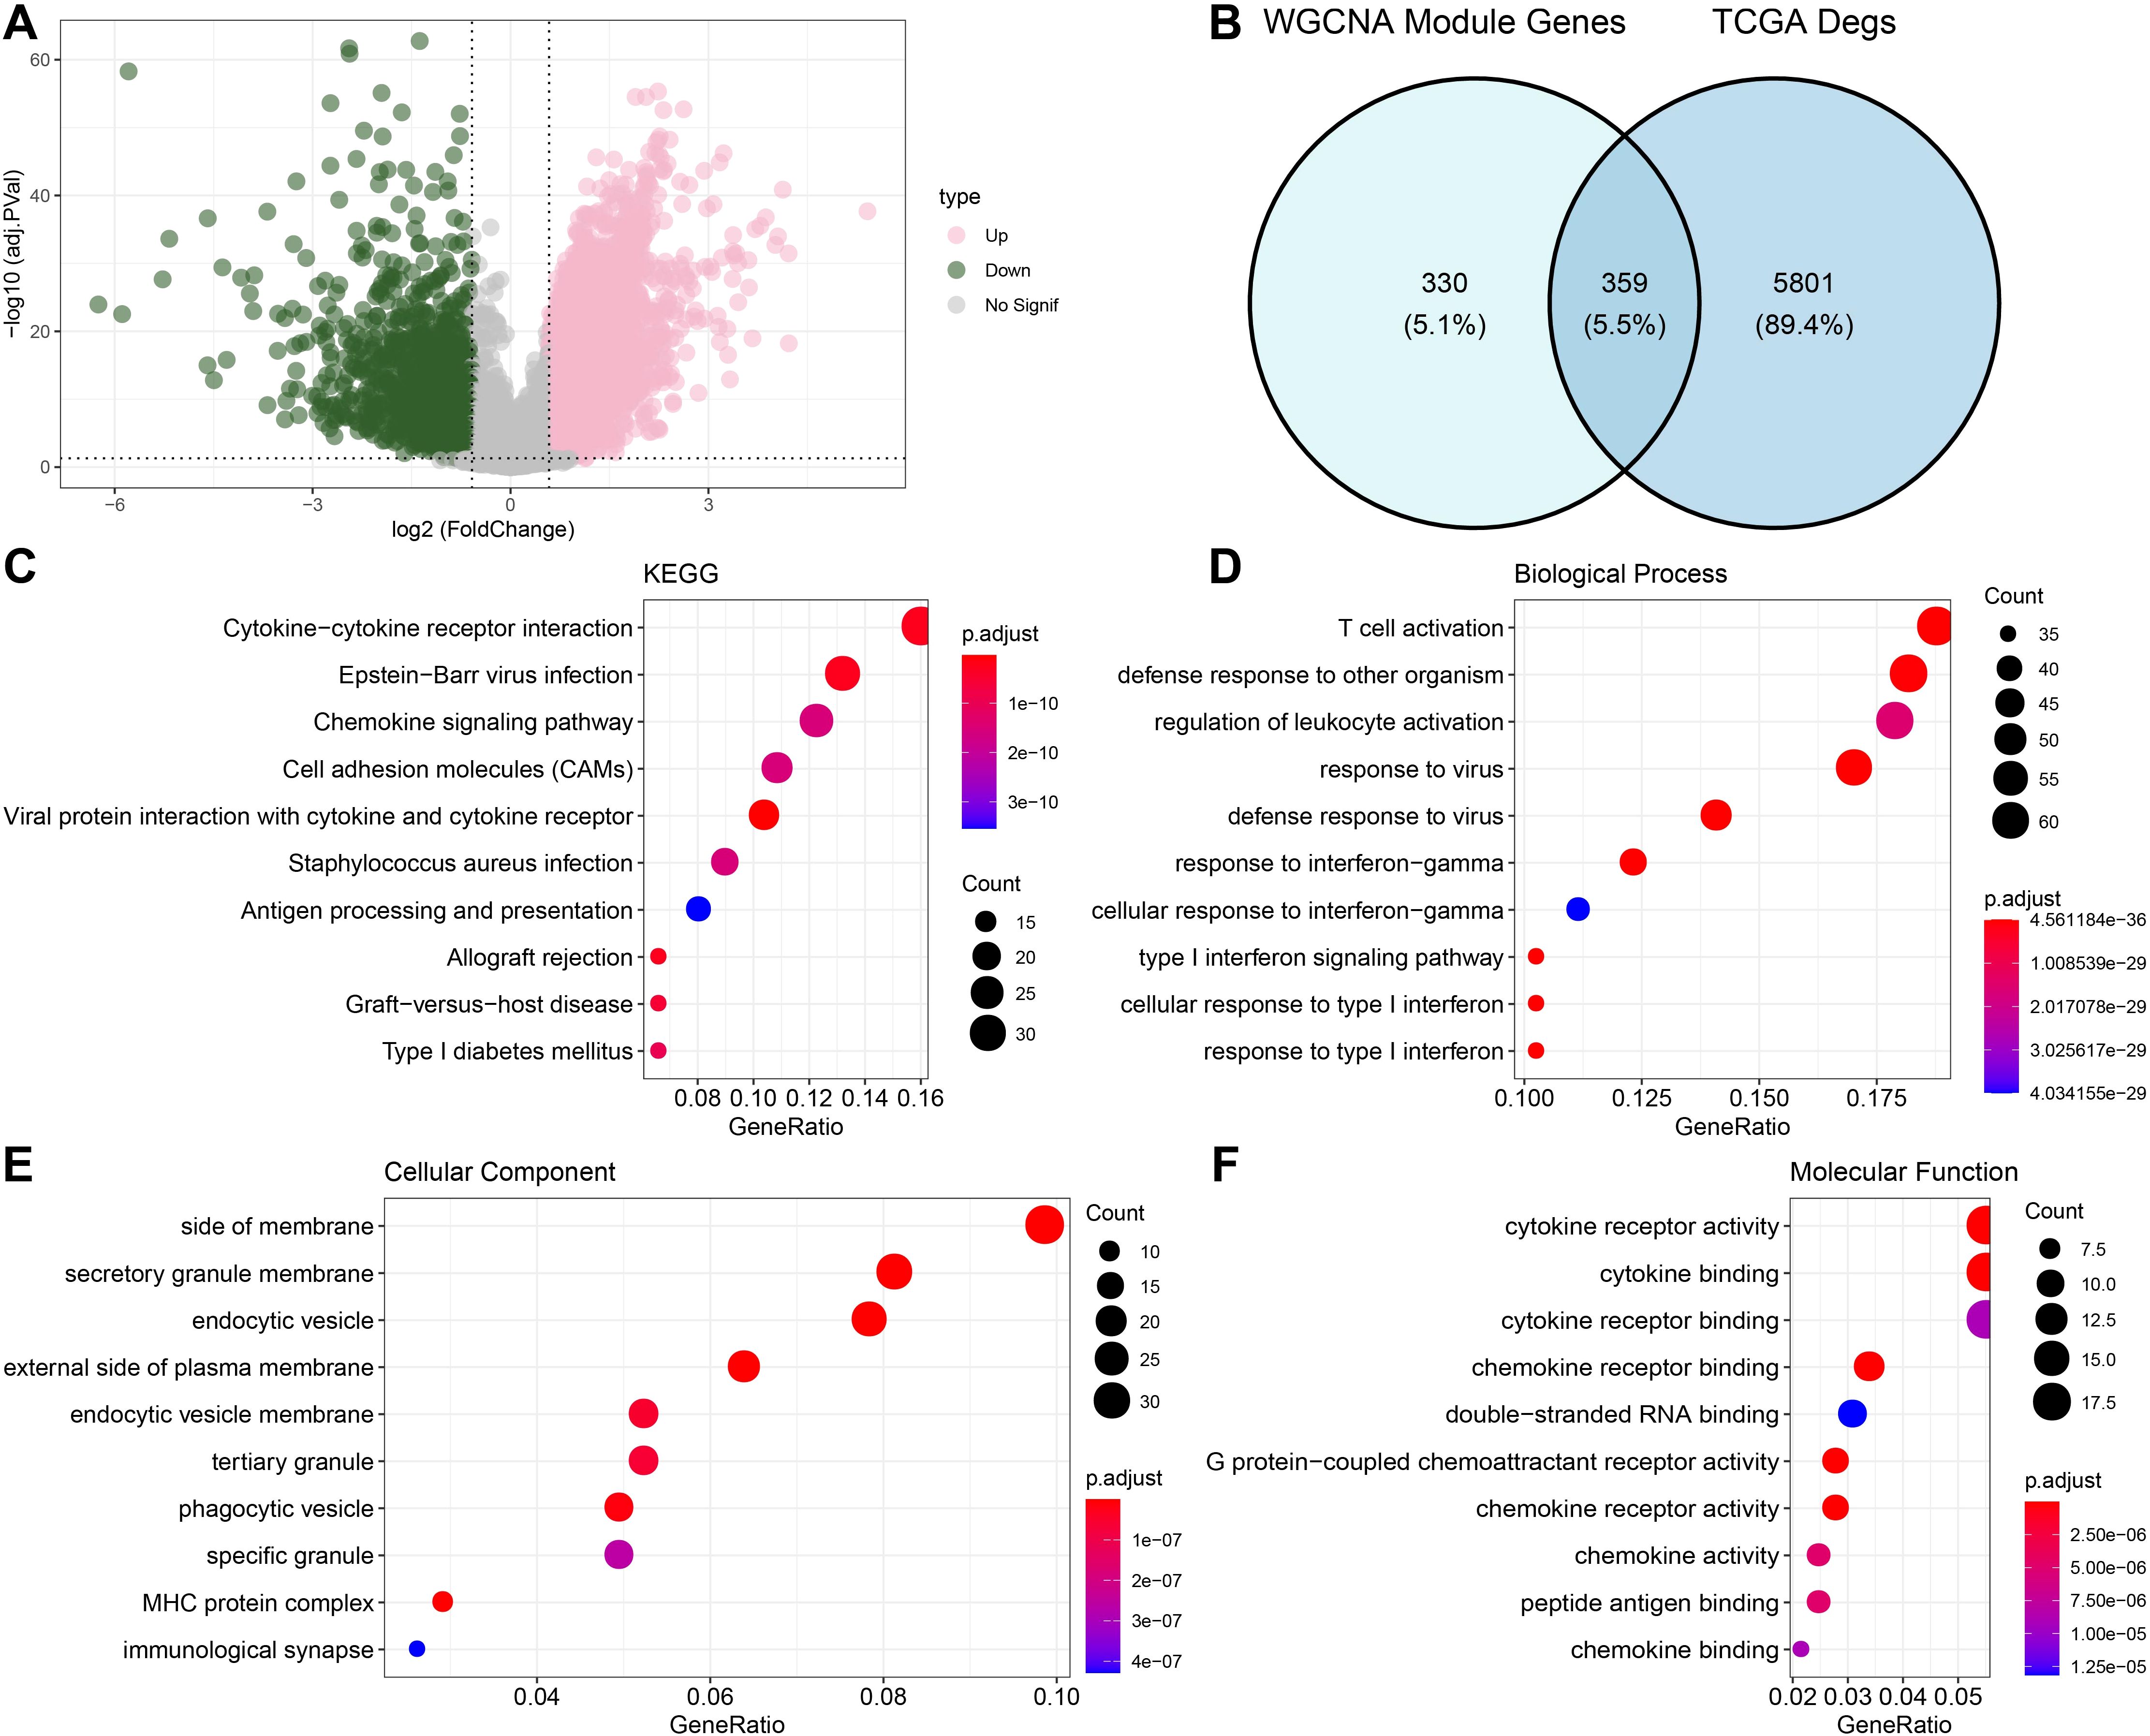
Figure 2. Functional enrichment analysis of DEGs with modular gene intersection genes. (A) Volcano map displaying the DEGs of tumor and normal group based on TCGA cohort. (B) The intersection of differential genes and midnightblue and green module genes. (C-F) Results of enrichment analysis of intersecting gene pathways.
Prognostic model building and validation
To create the risk model, we split the TCGA-HNSCC samples into training and test sets in a 5:5 ratio. For LASSO, its effectiveness hinges on the sparsity assumption, which may not hold in the complex genetic landscape of TCGA-HNSC, potentially causing misidentification of prognostic genes and coefficient underestimation (37). Moreover, the data-dependent variable selection process increases the risk of overfitting. As for stepwise regression, the arbitrary selection criteria based on statistical significance, the order-dependence of variable entry/removal, and the susceptibility to overfitting when the gene to sample size ratio is high can all lead to suboptimal model performance and biased results (38). In order to remove redundant confounding genes and identify the genes that have the biggest influence on patients’ prognosis, the R package “survival” was employed to run univariate Cox proportional risk regression on the aforementioned intersecting genes using the training set data. To minimize the gene range in the risk model, we compressed these genes using the “glmnet” package’s LASSO Cox regression approach. To enhance the model generalization, we further performed 10-fold cross-validation (Figure 3A). We then used multifactorial stepwise regression analysis to determine which six distinctive genes (ICOS, PSME1, SERPINA1, SH3KBP1, SP100 and ZAP70) were independently linked to prognosis (Figure 3B). Characteristics indicative of the prognostic outcomes in the TCGA-HNSCC training set were developed based on the expressions of the characterized genes and the regression coefficients as described below: Riskscore = (-0.685*ICOS) +0.749*PSME1 + 0.25*SERPINA1 + 0.41*SH3KBP1 + 0.24*SP100+(-0.368*ZAP70). Based on the best critical value of the Riskscore, TCGA training set patients were classified into low-risk and high-risk groups. KM curves showed that compared with the high-risk group, patients in the TCGA-HNSCC training set (p< 0.0001), validation set (p< 0.0019), and the low-risk group of the TCGA cohort (p< 0.0001) had better overall survival (OS) (Figures 3C–E). To investigate the diagnostic accuracy of the prognostic risk model, ROC analyses for 1-, 2-, 3-, 4- and 5-year prognostic predictions were conducted using the “timeROC” R package. The results indicated that the TCGA-HNSCC training set, test set, and TCGA cohort displayed high AUC values at 1-, 2-, 3-, 4- and 5-years (training set: 0.77, 0.78, 0.78, 0.75 and 0.7; test set: 0.59, 0.65, 0.59, 0.62 and 0.52; TCGA cohort: 0.68, 0.71, 0.69, 0.68 and 0.62, Figures 3F–H), demonstrating good classification accuracy for prognosis features. Subsequently, we analyzed the expressions of the characterized genes between patients in the low- and high-risk groups of the TCGA cohort. ICOS and ZAP70 were low-expressed in the high-risk group than the low-risk group, whereas PSME1, SERPINA1, SH3KBP1 and SP100 had markedly higher expression in the high-risk group than the low-risk group (Figure 3I).
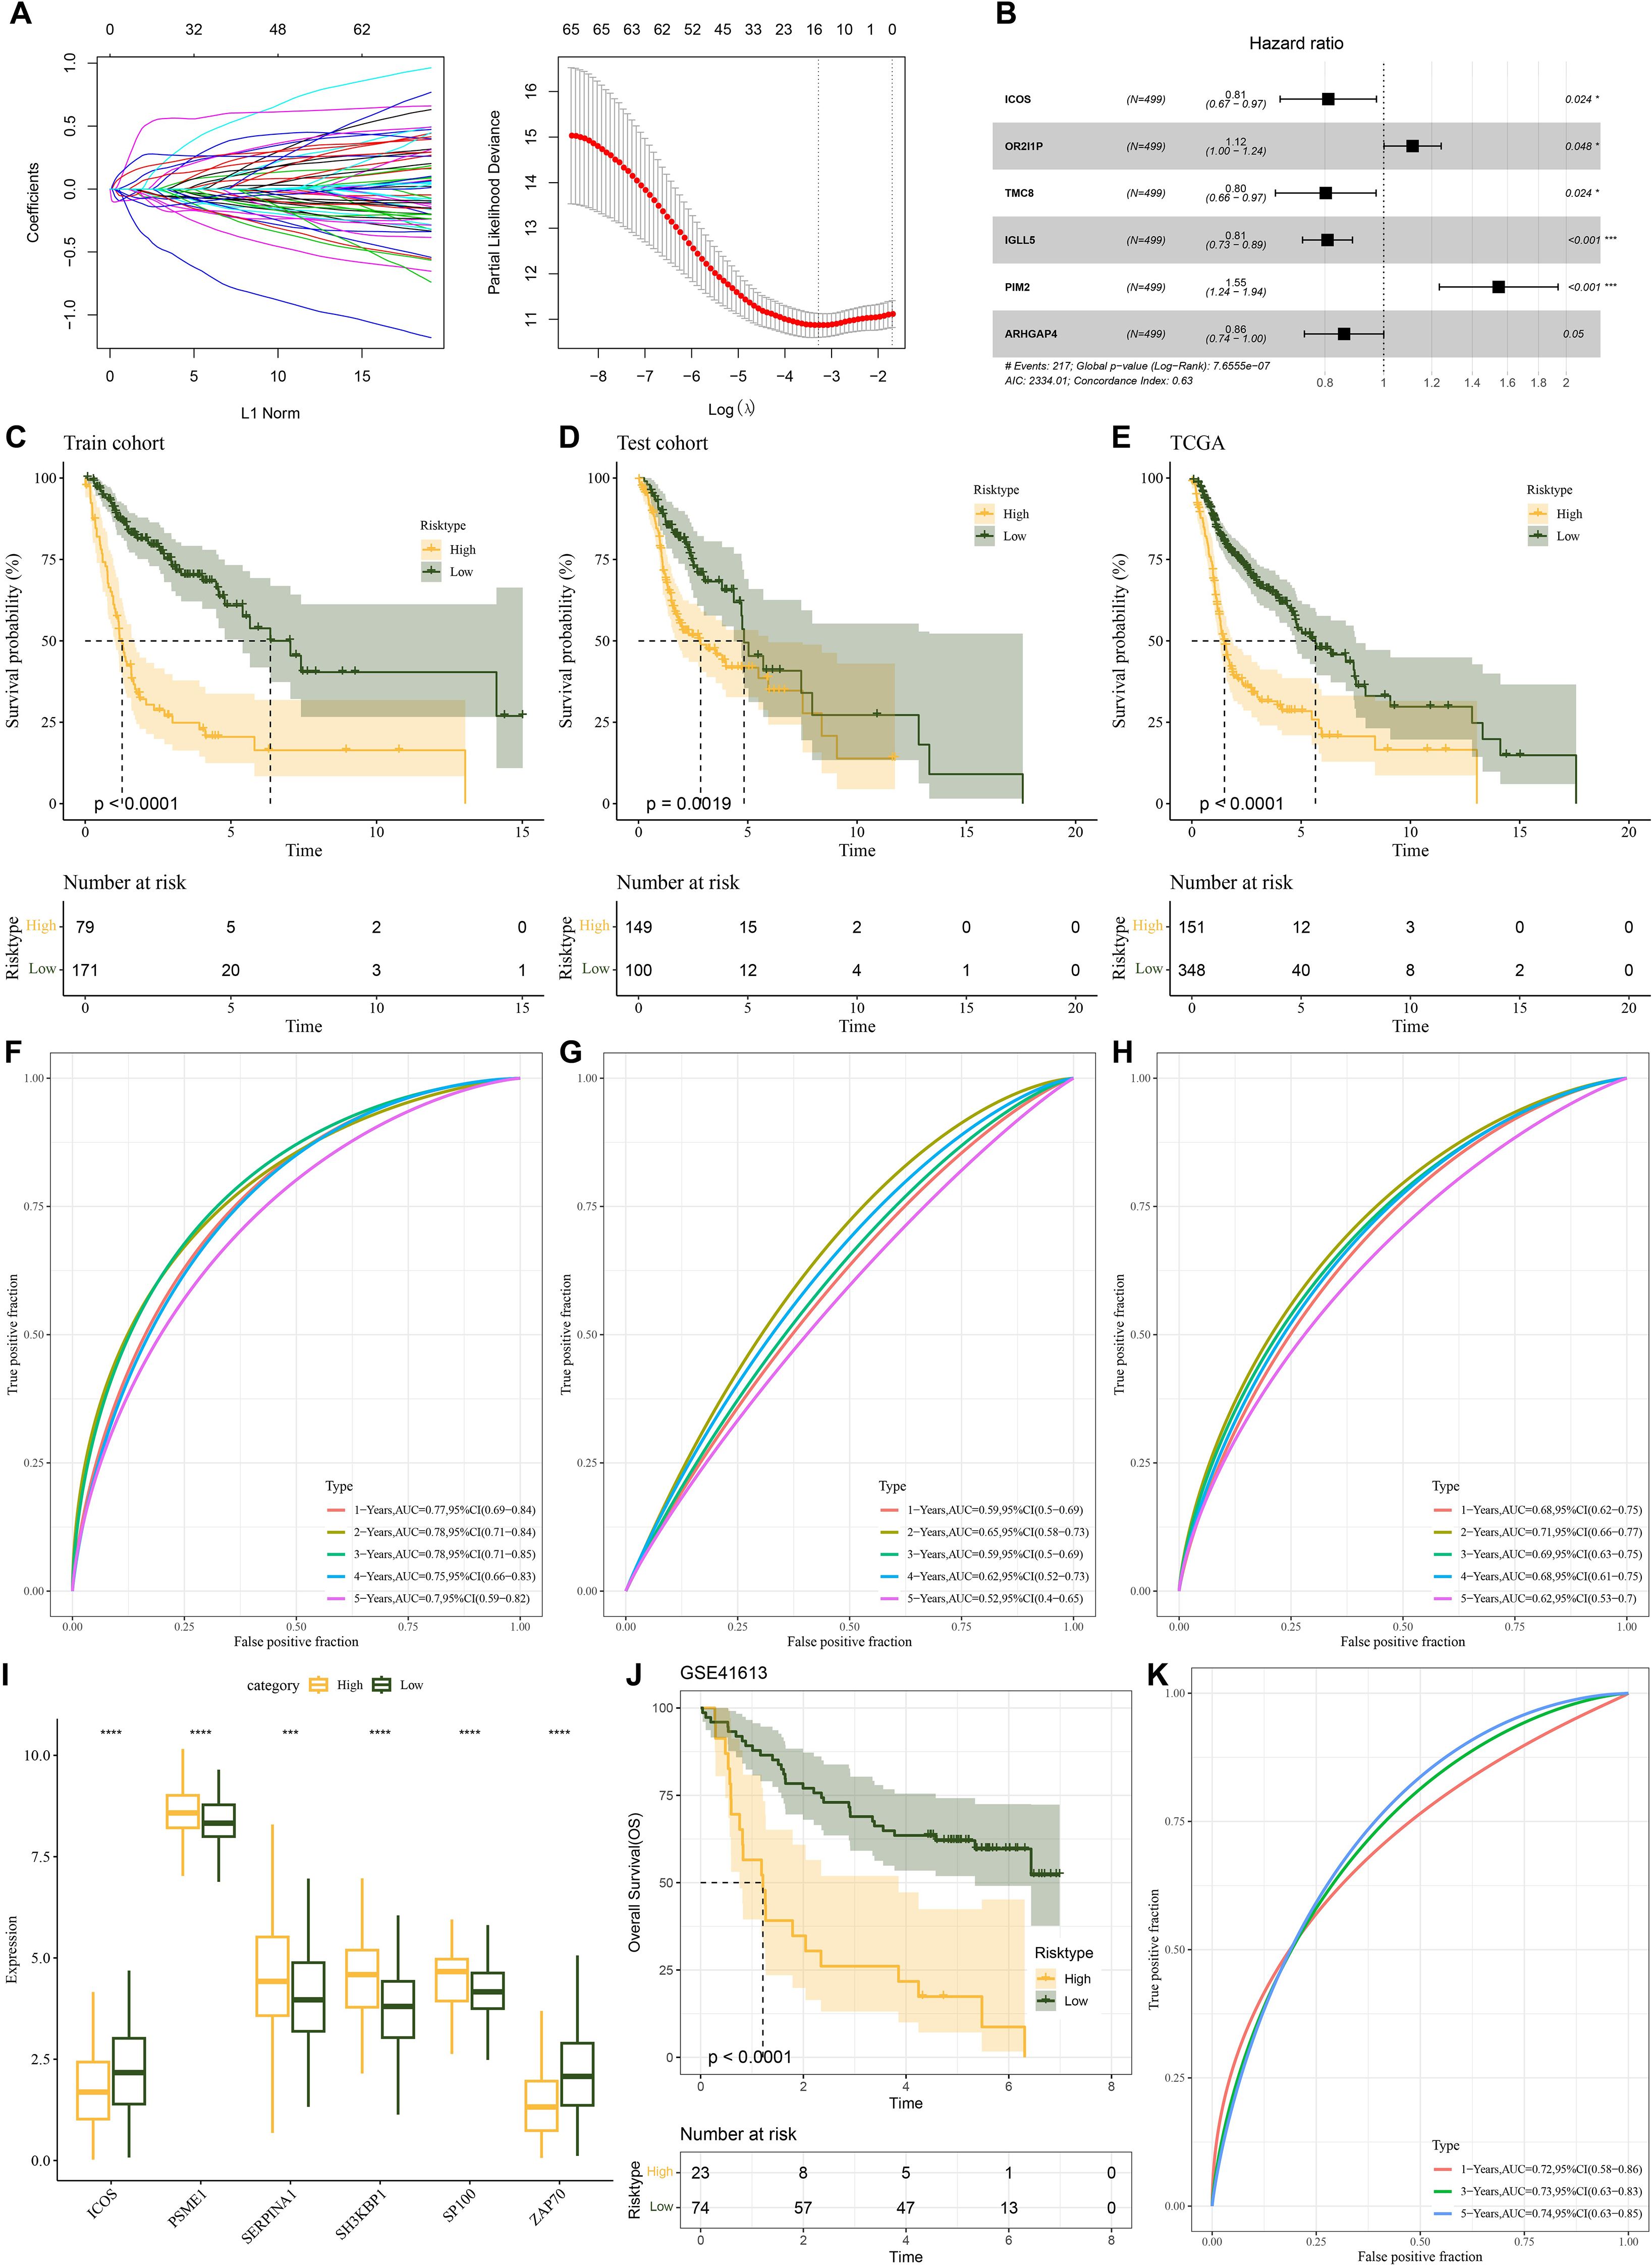
Figure 3. Establishment of a prognosis model for HNSCC patients and validation. (A) A number of LASSO Cox shrinkage genes. (B) Multifactorial random forest plot. (C) KM survival curves was plotted for the TCGA training data cohort. (D) KM survival curves was plotted for the TCGA validation cohort. (E) KM survival curves was plotted for the TCGA cohort. (F) ROC curves for Riskscore in the TCGA training data cohort. (G) ROC curve for Riskscore in the TCGA validation data cohort. (H) ROC curve of Riskscore in TCGA cohort. (I) The expressions of the prognosis genes in the TCGA cohort. (J) KM survival curves of Riskscore in the GSE41613 cohort. (K) ROC curve of Riskscore in the GSE41613 cohort. ns, p > 0.05, not statistically significant; *p < 0.05; ***p < 0.001; ****p < 0.0001.
We utilized the GSE41613 dataset to assess the model robustness using comparable models and equivalence coefficients to those utilized in the training set to confirm the stability and dependability of our developed model using NMRG-related signature genes. The training set finding that the prognostic outcomes of high-risk HNSCC patients were more unfavorable (p<0.0001, Figure 3J) was supported by the validation data. For the 1-, 3- and 5-year periods, the GSE41613 validation set’s AUC values were 0.72, 0.73 and 0.74, respectively Figure 3K). For patients with HNSCC, it showed that the prognostic model had good prognostic prediction.
Mutation characterization in HNSCC high and low-risk groups
We further analyzed the gene mutations in the low- and high-risk groups. In the TCGA-HNSCC samples, we observed that in the high-risk group, 141 (94%) HNSCC patients out of 150 samples showed high-frequency mutations top 10 genes, of which the top 3 mutated genes were TP53 (73%), TTN (39%) and FAT1 (26%) (Figure 4A). In contrast, the top 10 mutated genes in HNSCC patients showed mutations in 315 out of 344 samples (91.57%) in the low-risk group, with TP53 as the gene with the most mutations of 65% in the samples, followed by TTN and FAT1 in 39% and 21% respectively (Figure 4B). Subsequently, we revealed the mutational co-occurrence or mutual exclusion patterns between the top 10 mutant gene pairs in different risk subgroups of HNSCC, respectively. Statistical results showed frequent co-occurrence between the TNN gene with MUC16 gene, CDKN2A gene with TP53 gene and FAT1 genes in the high-risk group (p < 0.05, Figure 4C). Significant co-occurrence was also shown in the low-risk group, especially between TTN and SYNE1, LRP1B, MUC16 and CSMD3 (p < 0.05, Figure 4D). This may imply that the co-occurring genes have a synergistic role in the associated pathological processes.
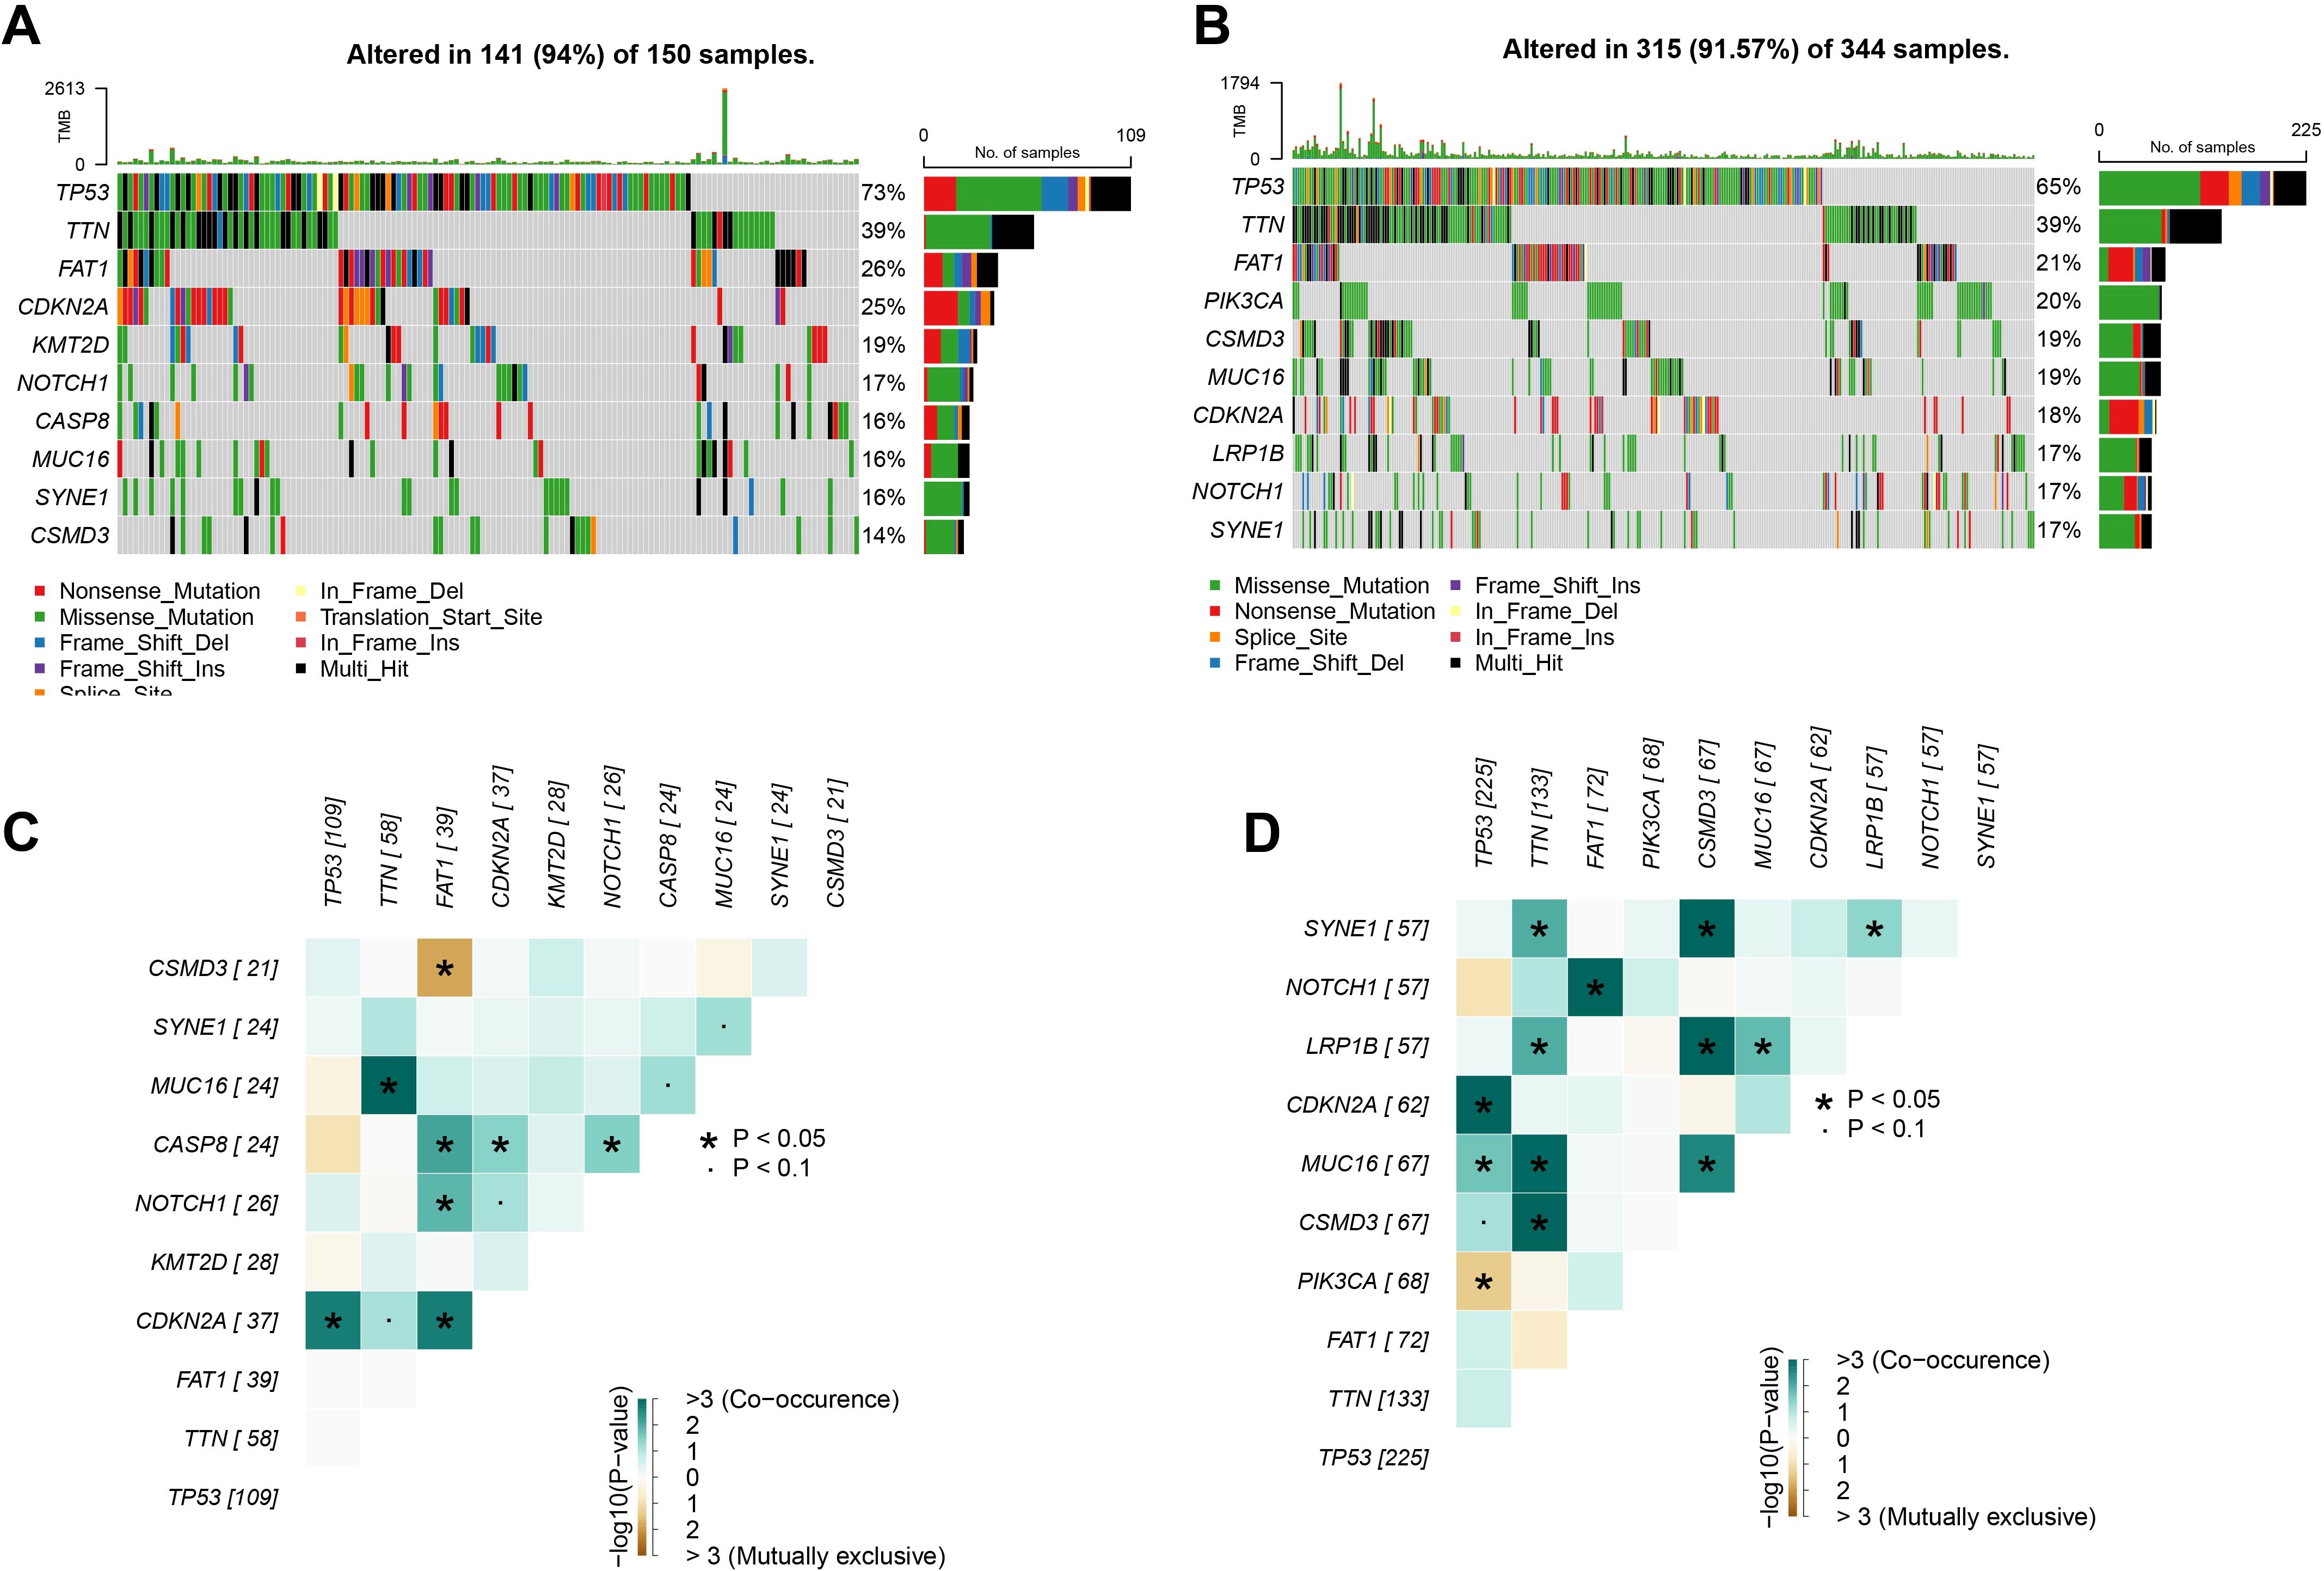
Figure 4. Landscape of gene mutations in HNSCC. (A) TCGA cohort high-risk group high frequency mutations top 10 genes. (B) TCGA cohort low-risk group high-frequency mutation top 10 genes. (C) Interactions of high-frequency mutation top 10 genes in the high-risk group of the TCGA cohort. (D) Interactions of high-frequency mutation top 10 genes in the low-risk group of the TCGA cohort. ns, p > 0.05, not statistically significant; *p < 0.05.
Immunological characterization of HNSCC high and low-risk groups
To analyze the association between the Riskscore and immune microenvironment of HNSCC, we calculated immune cell infiltration using different methods. We first used ESTIMATE algorithm to assess immune cell infiltration and found that the HNSCC high-risk group had lower immune infiltration (Figure 5A). Based on MCPcounter, the immune cell score was calculated for the TCGA dataset. The results showed that the myeloid dendritic cells, immune cell scores of T cells, B lineage, CD8 T cells, cytotoxic lymphocytes were all lower in the high-risk group (Figure 5B). Using the ssGSEA function of the R package “GSVA”, the scores of 28 types of immune cells in HNSCC were analyzed, and their correlations with Riskscore and signature genes were computed. The data showed that Riskscore was closely negatively linked to the scores of the majority of the immune cells in HNSCC, including MDSC, immature B cells, activated CD8 T cells, mast cells, activated CD4 T cells, activated B cells. On the other hand, the signature genes were positively linked to the scores of the majority of the immune cells in HNSCC, while Riskscore was closely negatively linked to the scores of most of the cells (Figure 5C).
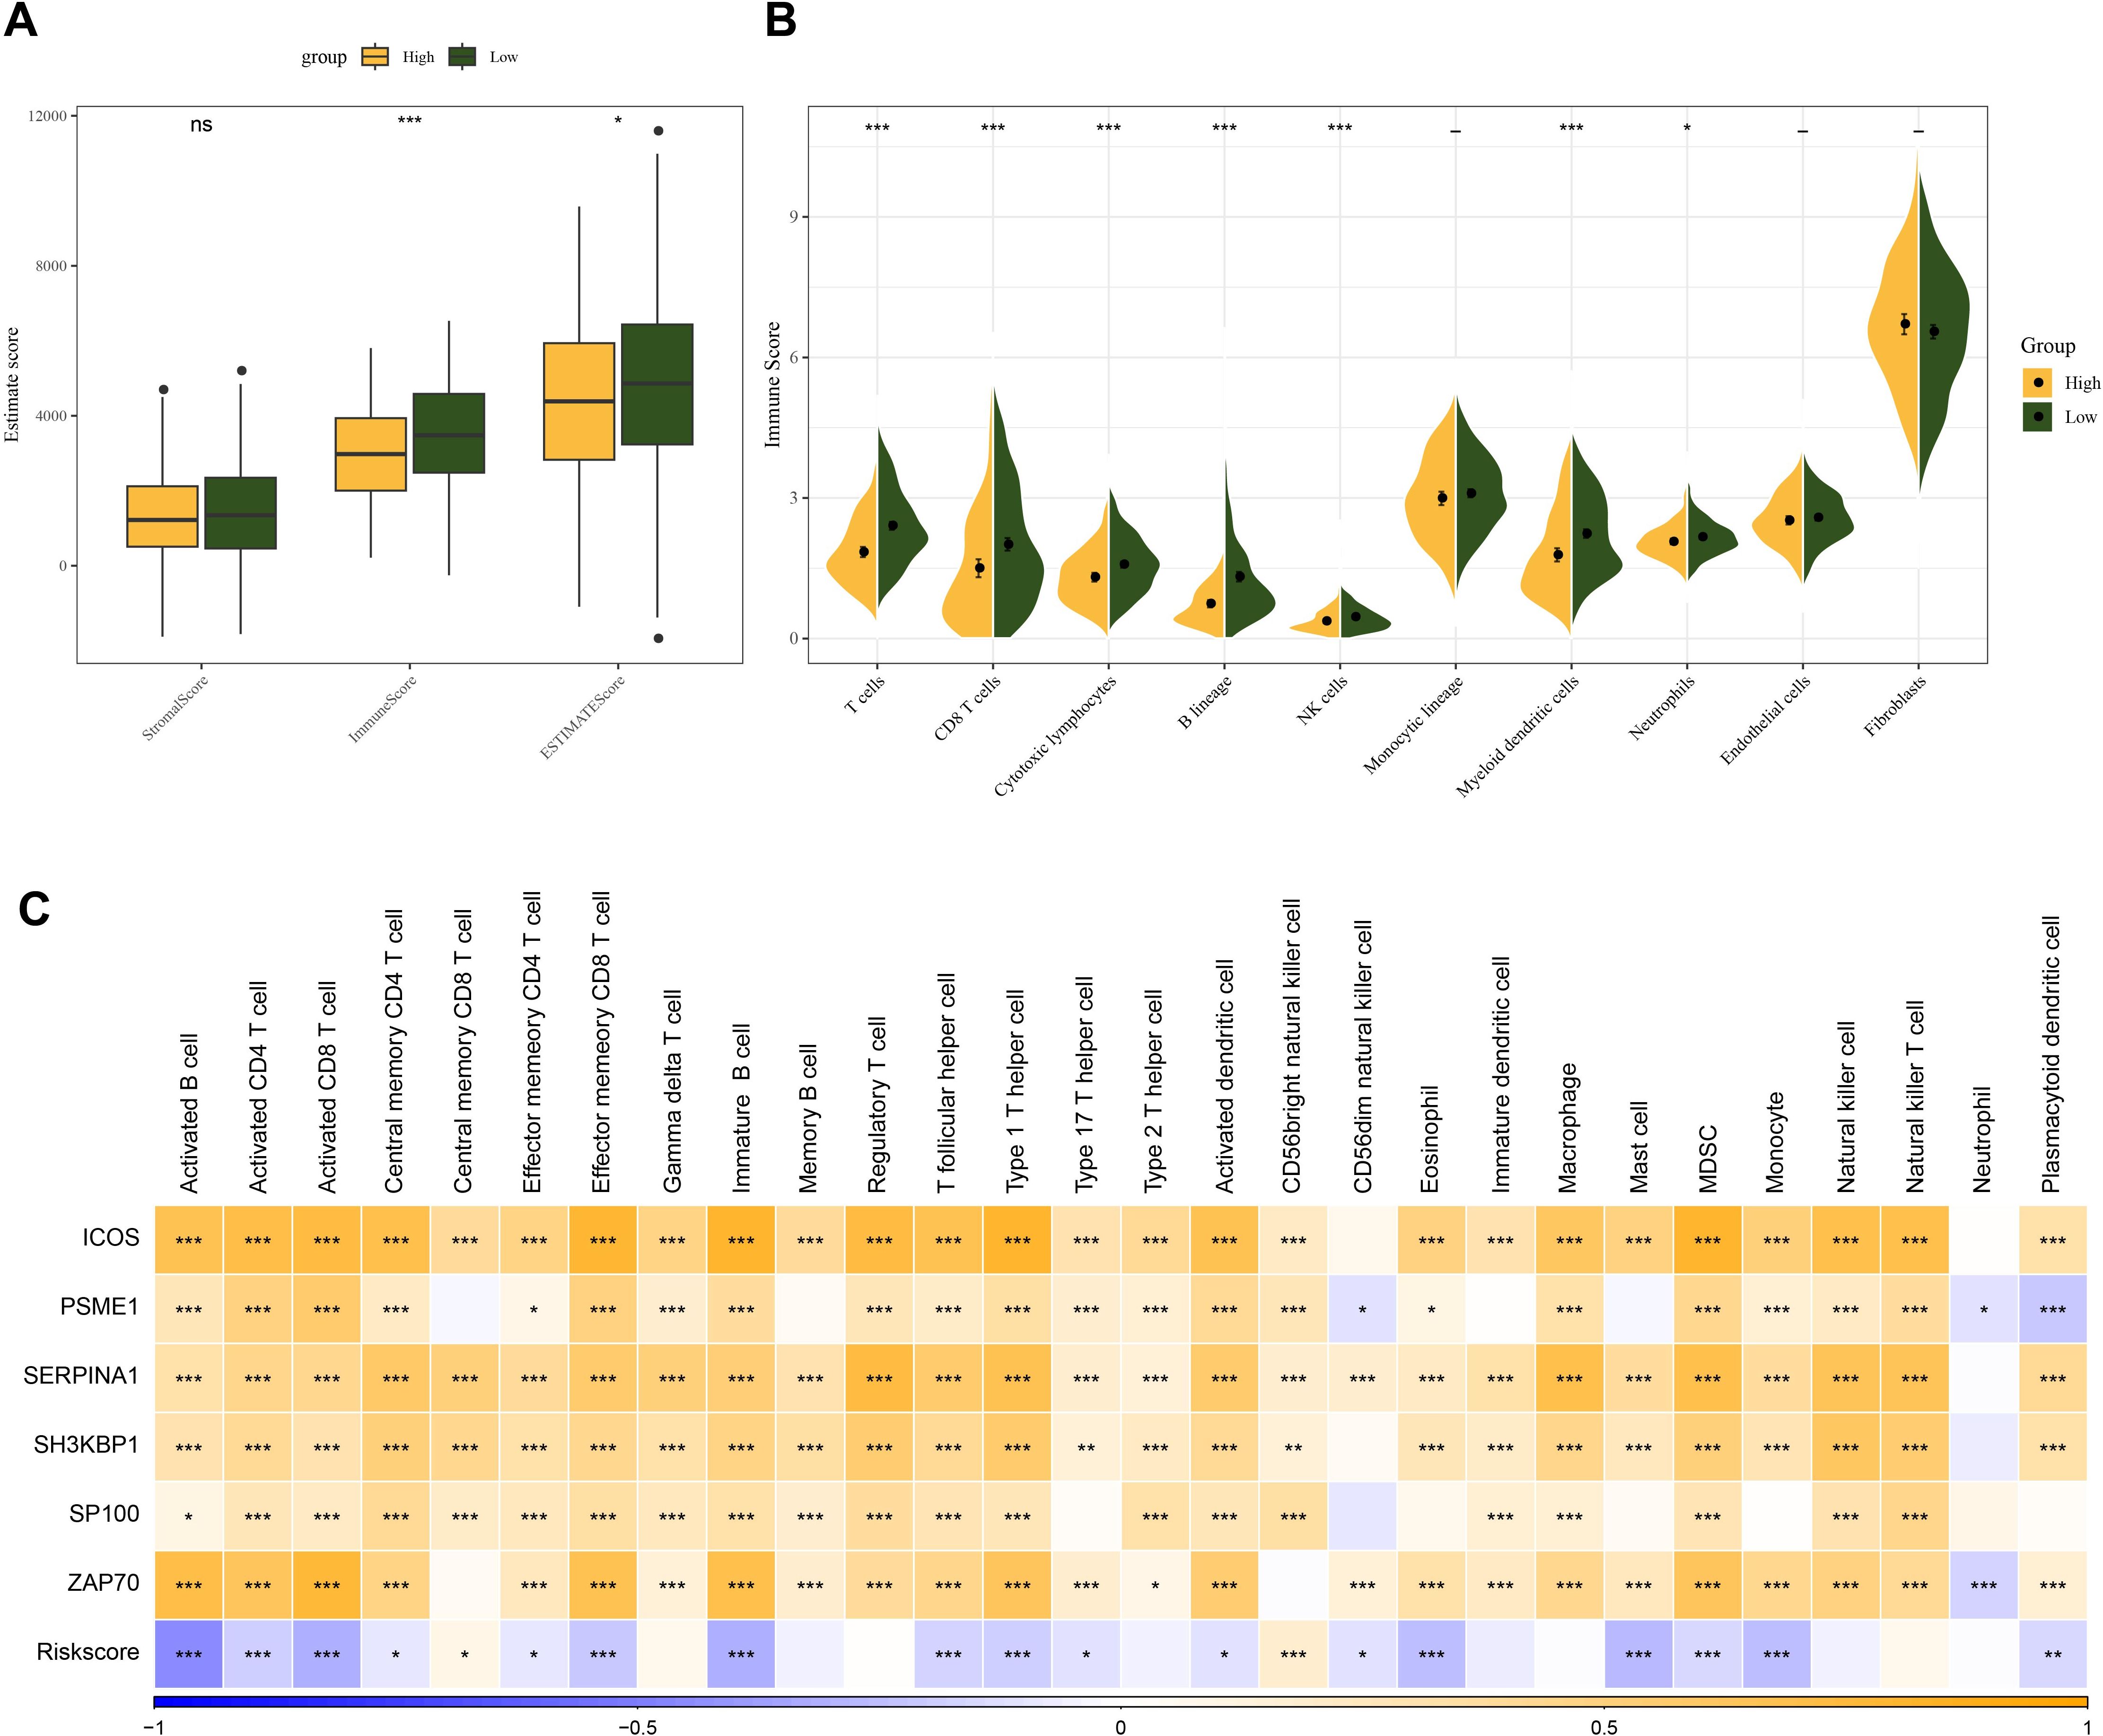
Figure 5. Relationship between Riskscore and HNSCC immune microenvironment. (A) ESTIMATE scores between high and low-risk groups in the TCGA cohort. (B) MCPcounter assessment of 10 immune cell scores in Riskscore groupings. (C) Correlation of immune infiltration scores assessed by ssGSEA with Riskscore and prognostic genes. ns, p > 0.05, not statistically significant; *p < 0.05; **p < 0.01; ***p < 0.001.
Differences in enriched pathways between high and low-risk HNSCC subgroups
To investigate the differences in biological pathways in different risk groups, we performed a KEGG pathway enrichment analysis of DEG between high- and low-risk groups of HNSCC patients. Based on the enrichment results, it was found that the high-risk group was significantly enriched in the pathways of the ribosome, proteasome, and spliceosome (Figure 6A). Low-risk group was notably enriched in metabolism-related pathways, including linoleic acid metabolism and arachidonic acid metabolism (Figure 6B).
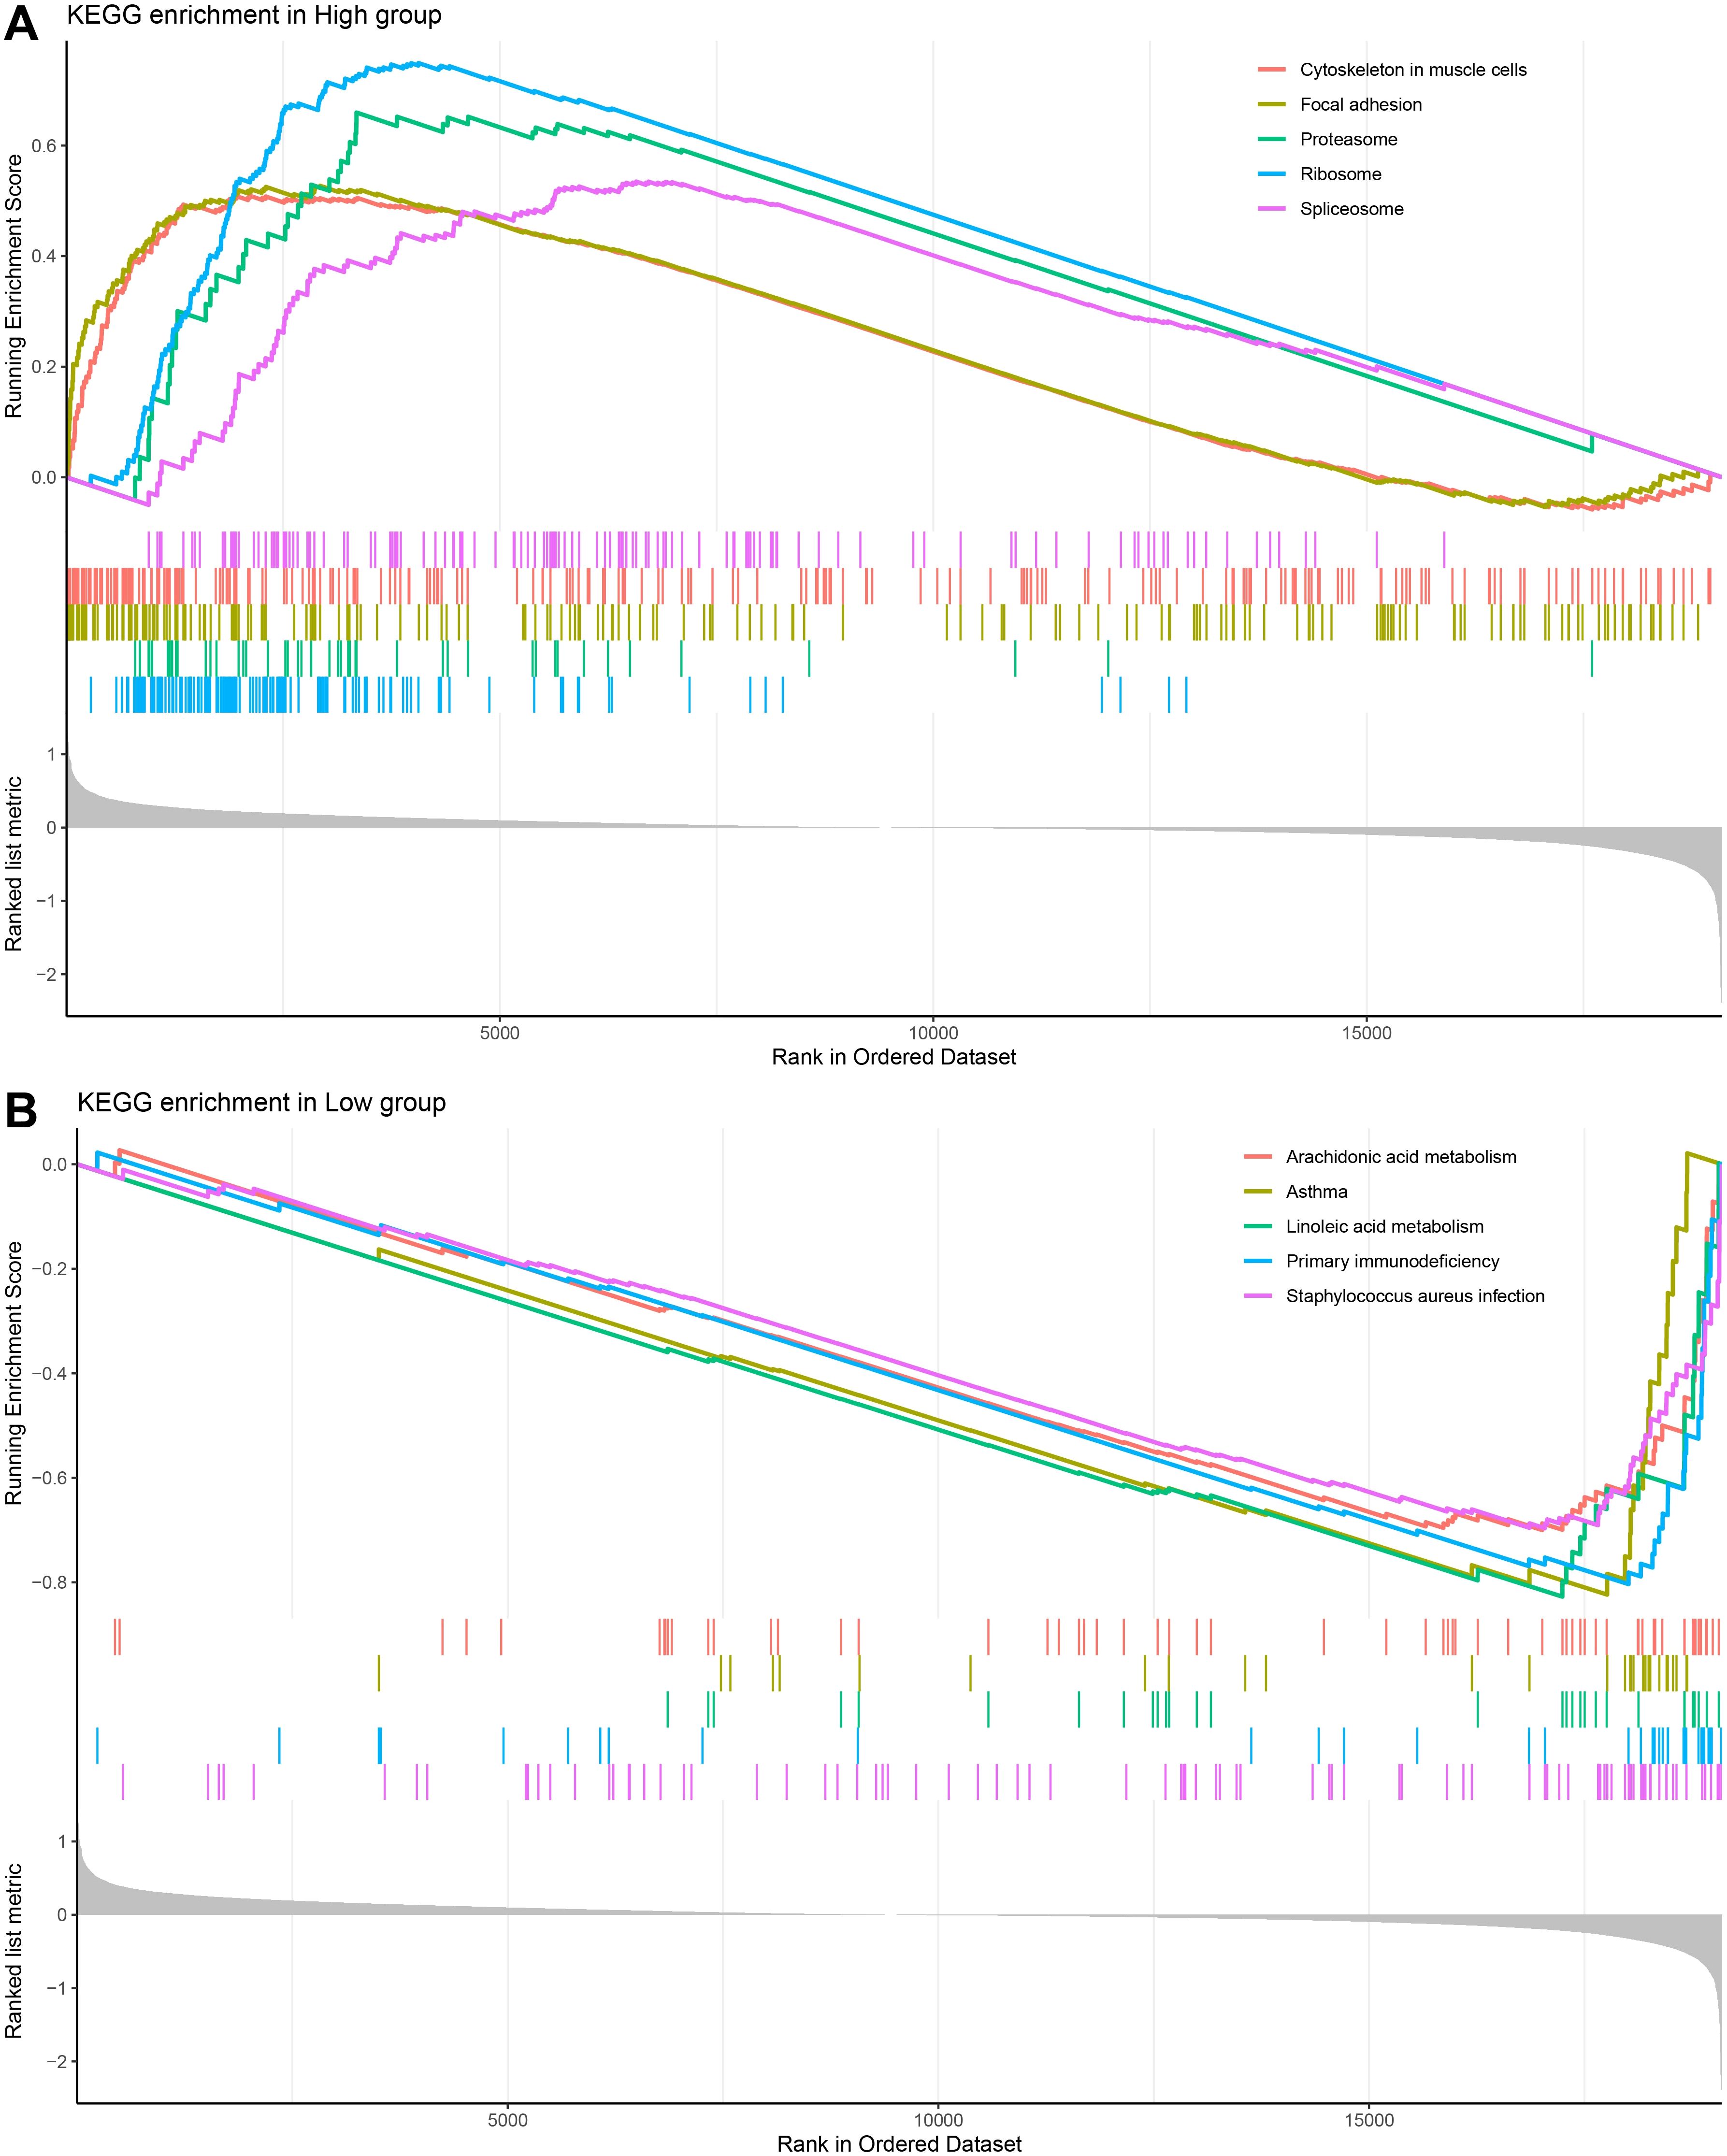
Figure 6. GSEA analysis on differentially expressed genes in different risk subgroups of HNSCC. (A, B) KEGG enrichment analysis of HNSCC high and low-risk groups.
Downregulation of PSME1 impairs migration and invasion of HNSCC cells
The mRNA expressions of 6 key genes in NOK and FaDu cells using qPCR. The corresponding results demonstrated that in comparison to NOK cells, the levels of ICOS, PSME1, SERPINA1, and SH3KBP1 genes were notably upregulated in FaDu cells, while the expressions of PSME1 and SERPINA1 genes were higher (Figure 7A). It has been reported that PSME1 has been shown to serve as a therapeutic target in a variety of tumors (39, 40). Therefore, we explored the role of PSME1 in HNSCC progression. Here, this study analyzed the effect of the PSME1 gene on FaDu cell invasion and metastasis by wound healing assay and transwell assay. The results showed that the reduction of PSME1 significantly inhibited the migration and metastasis of FaDu cells (Figures 7B, C).
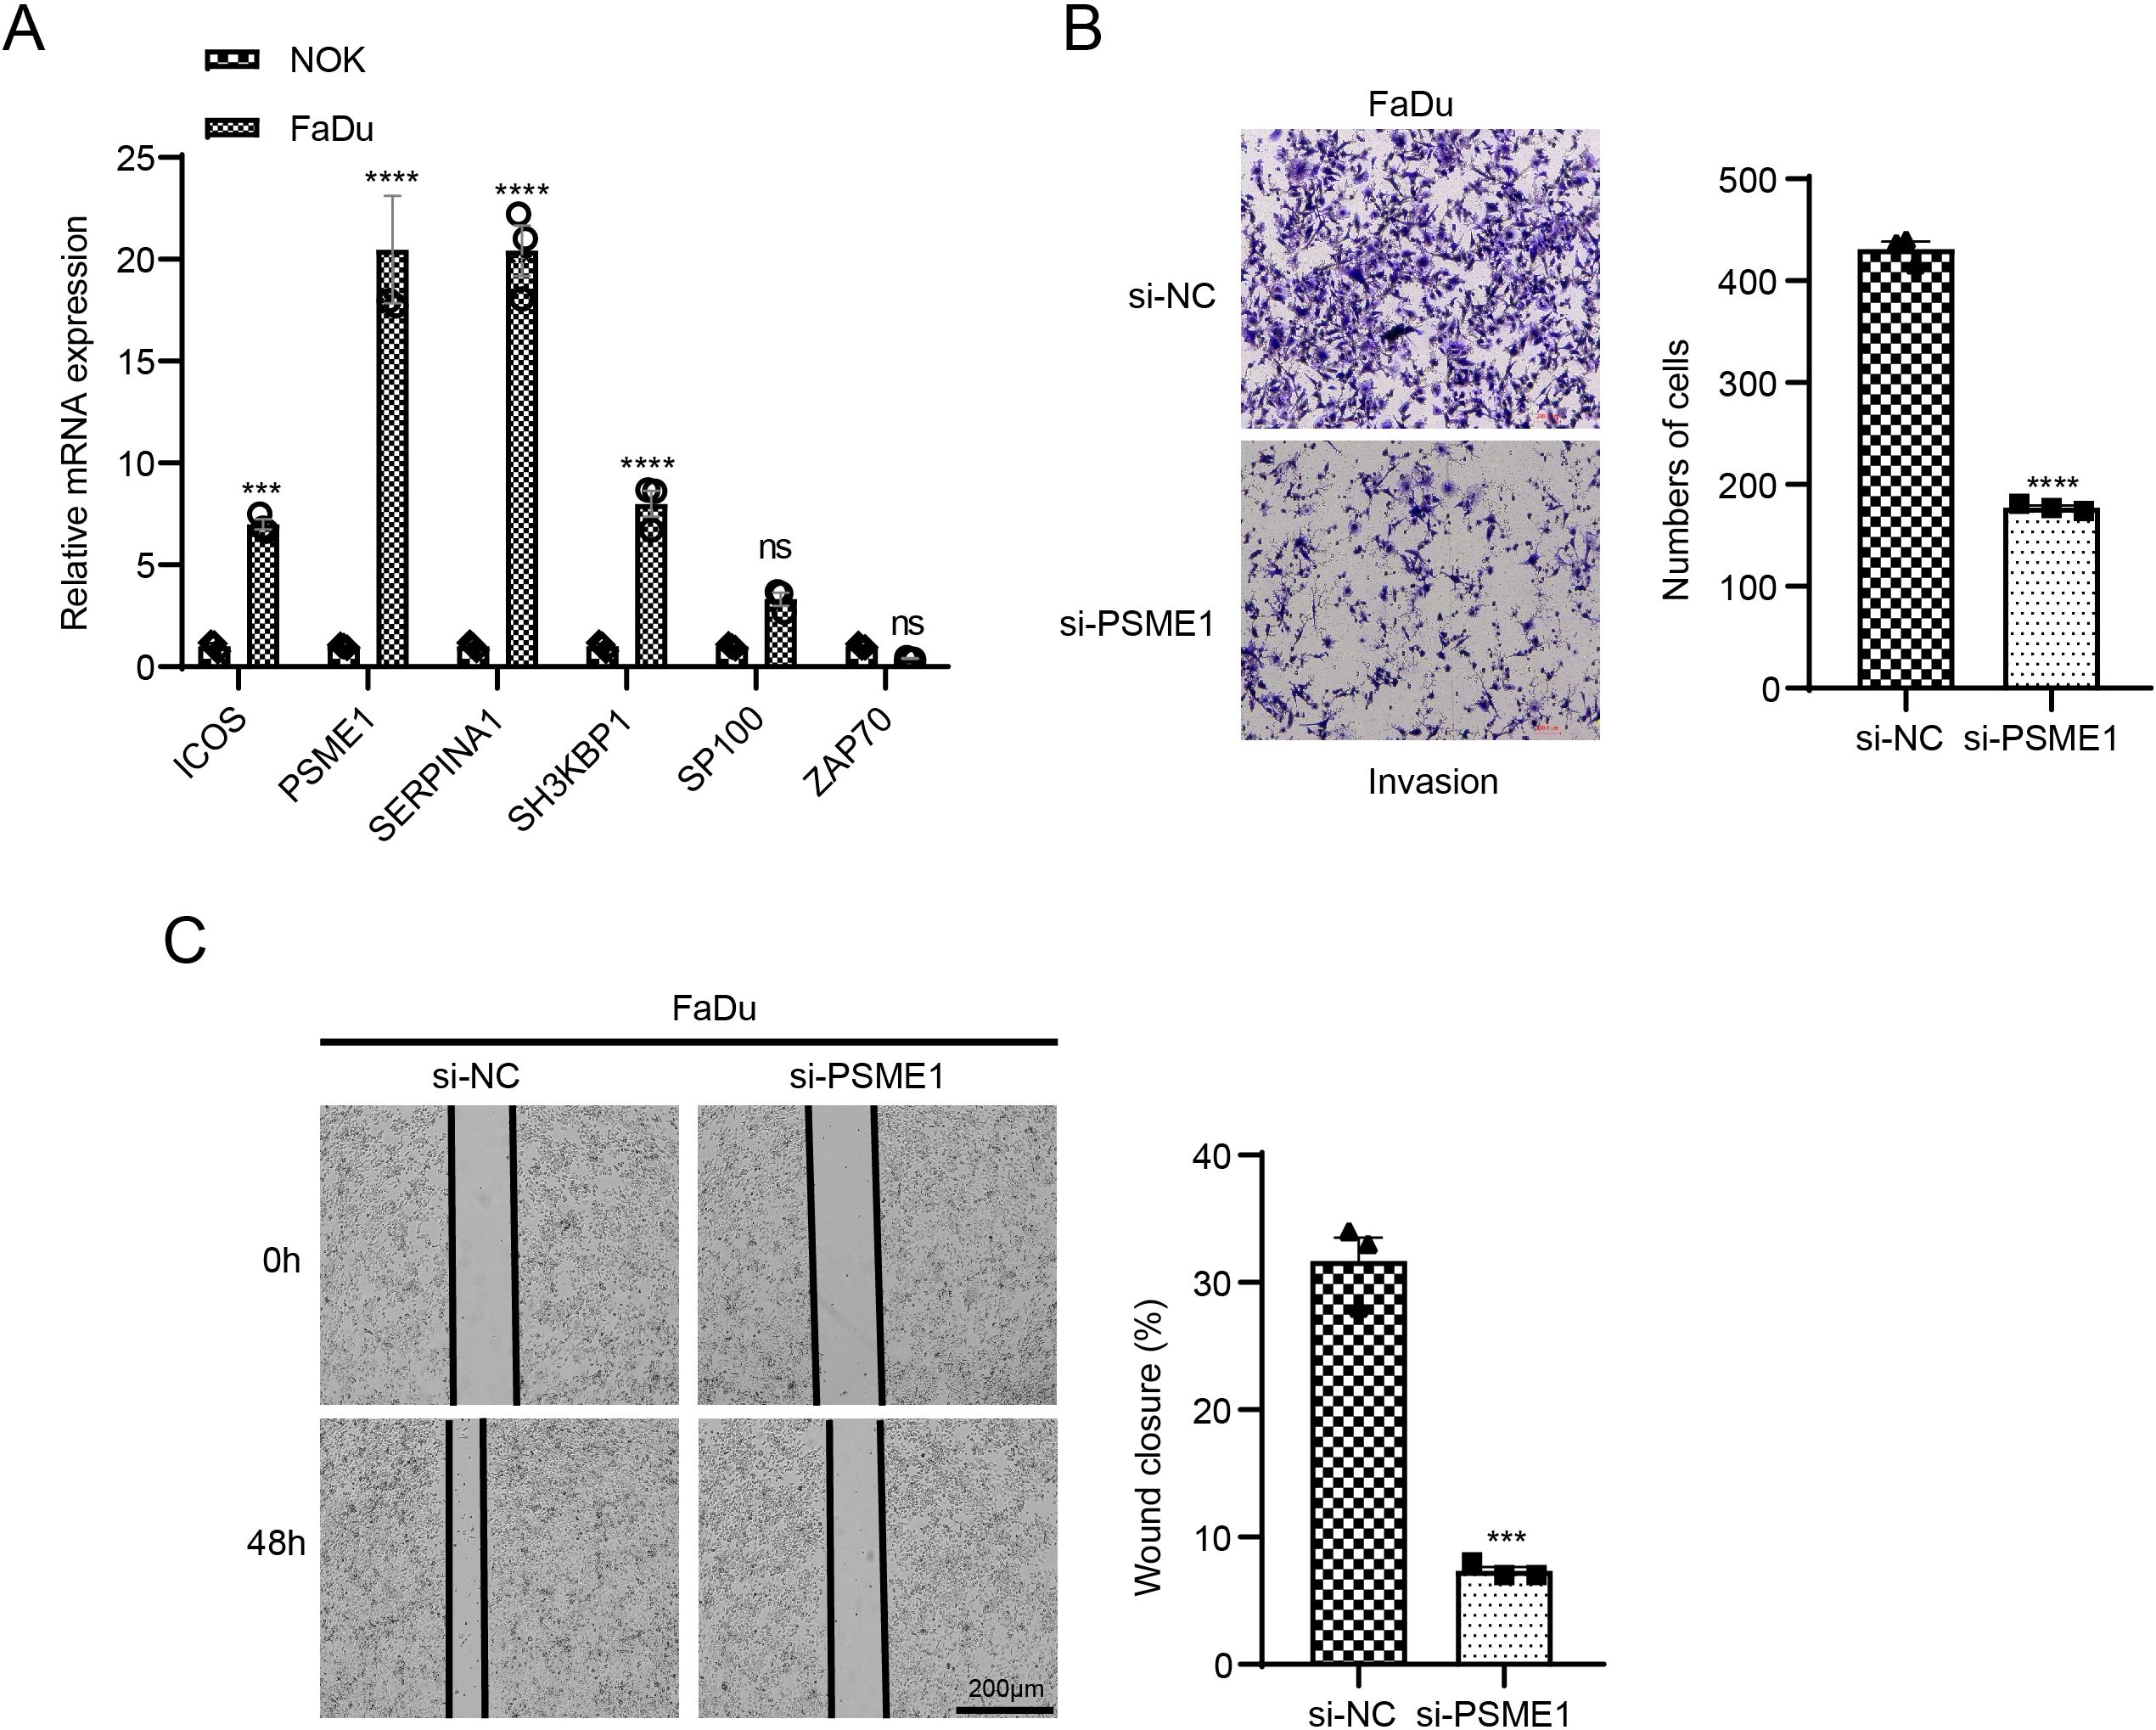
Figure 7. Exploring the biological role of PSME1 in HNSCC. (A) qPCR detection of gene expression levels of ICOS, PSME1, SERPINA1, SH3KBP1, SP100 and ZAP70 in NOK and FaDu cells. (B) Representative images of transwell assay of FaDu cells after PSME1 knockdown and statistical analysis of invasive cell counts. (C) Representative photographs and statistical analysis of wound healing assay in FaDu cells after PSME1 knockdown. Data are shown as SD ± mean, ns, p > 0.05, not statistically significant; ***p < 0.001; ****p < 0.0001.
Discussion
Recent studies have shown that disturbances in NAD+ metabolism are associated with cell division, proliferation and apoptosis, all of which can accelerate tumor growth and spread (41). As a result, it is being investigated as a potential tumor treatment. For instance, following examination, scientists discovered that NMRGs accurately evaluated the treatment response and prognostic outcomes for liver cancer patients (42). Furthermore, individuals with stomach cancer who had low levels of NMRG expression often had longer survival times, while those with high levels of NMRG expression had a worse prognosis (43, 44). Therefore, NRMGs also have important research and application value in HNSCC. Here, the present research screened six (ICOS, PSME1, SERPINA1, SH3KBP1, SP100 and ZAP70) signature genes independently associated with HNSCC prognosis through integrative analysis. These characterized genes showed good predictability in prognostic assessment in both the training cohort and the validation cohort. They may be mainly involved in defense-related processes such as secretory factor receptor activity and immunity.
These 6 important prognostic genes are strongly linked to carcinogenesis, progression, and treatment, per earlier research in the literature. In particular, tumors expressing high levels of ICOS show increased immune cell infiltration, and ICOS is a positive prognostic factor in the B7 immune checkpoint co-stimulatory factor family in HNSCC and oral squamous cell carcinoma (45). Advanced-stage cancers had decreased levels of ICOS expression, and tumors with high ratios of PD-L1/ICOS, PD-L2/ICOS, or CD276/ICOS expression have a worse prognosis and a worse prognosis for patients with positive lymph nodes (46). Genes including PSME1 were found to be positively related to T-cell infiltration and PD-1 expression, in HNSCC, which may influence anti-PD1 treatment efficacy by modulating immune cell infiltration, especially T-cell depletion (39). Potential salivary diagnostic indicators for oral squamous carcinoma include higher salivary levels of SERPINA1 in individuals with oral squamous cell carcinoma, which correspond with advanced tumor stage (47). Gliomas have high levels of SH3KBP1, and these levels have been linked to glioma patients’ lower survival rates. Glioma cell motility, proliferation, and stem cell self-renewal ability are all markedly reduced when SH3KBP1 is silenced, both in vitro and in vivo when xenograft tumors are growing (48). Poor clinicopathological characteristics and a poor patient prognosis are directly linked to SP100 family members with a high expression in pancreatic cancer tissues. Mechanistically, the expressions of SP100 family members, which are activated in several carcinogenic pathways and strongly co-expressed with M6A methylation regulators, are significantly linked with TP53 mutations (49). It was discovered that HNSCC patients in the low-risk group were more sensitive to immunotherapy in the risk model developed by Liu et al. based on genes like ICOS and ZAP70 (50). ZAP70 expression was also down-regulated in HNSCC, and its involvement in the predictive risk model of HNSCC patients in the high-risk group revealed a comparatively lower amount of immune cell infiltration and a shorter survival time (51). According to these findings, signature genes may be linked to tumor immune infiltration and treatment, as well as having distinct functions in malignancies. However, based on the analyses that are currently available, they are mostly linked to immune infiltration, invasion and metastasis, cell proliferation, and treatment response, all of which may be useful for predicting prognosis in HNSCC.
TP53, TTN, and FAT1 mutation rates were high in both high and low-risk categories of HNSCC patients, according to a gene mutation study. The KRAS and tumor protein 53 (TP53) genes have been widely exploited as prognostic and predictive gene targets in lung adenocarcinoma because they frequently exhibit notable alterations (52, 53). When cisplatin is used to treat tumors with concurrent KRAS and TP53 mutations, the clinical results are not good (54). Lung cancer is one of the many tumor forms that frequently have mutations in TTN, the longest-known gene producing the TITIN protein (55). A higher tumor mutational burden and objective reactions to immune checkpoint blockade are closely linked to mutated TTN, which is commonly seen in solid tumors (56). In human malignancies, one of the most frequently mutated genes is FAT1, which codes for procalcitonin. Loss of FAT1 function induces a mixed EMT state in human and animal squamous cell carcinomas, which enhances carcinogenesis, progression, invasiveness, stemness, and metastasis (57). The high incidence of somatic TP53 mutations in HNSCC has been linked to tumor progression and decreased survival by preventing cytotoxic CD8+ T cell infiltration and encouraging the intra-tumor recruitment of regulatory T cells and M2 macrophages (58). The TP53, FAT1 and TTN genes are the most significantly mutated genes in HNSCC, which is in line with our findings. These genes also have high mutation rates in various risk classes of HNSCC patients (59, 60). In conclusion, immune infiltration may be linked to tumor growth mediated by TP53, TTN and FAT1 mutations.
The high-risk group of HNSCC has a markedly enhanced ribosome, proteasome, and spliceosome pathway, according to pathway analysis. Pathways like the metabolism of linoleic acid and arachidonic acid were considerably more abundant in the low-risk group. The expression of proteins linked to ribosome biosynthesis was inversely connected with antitumor drug sensitivity and tumor-infiltrating immune cells in HNSCC, and their knockdown prevented cell invasion, migration, and proliferation (61). Protease inhibitors cause the development of proteins with pro- and anti-apoptotic effects because the proteasome controls the expression levels of several proteins with various roles. Signaling proteins and pathways that support cell survival and intrinsic resistance to proteasome inhibitors and other anticancer treatments are typically abnormally activated in cancer cells (62–64). Protease and histone deacetylase co-targeting prevent HNSCC cells from developing acquired treatment resistance (65). HNSCC cell lines exhibit a substantial enrichment of splicing-associated proteins, and splice kinase inhibition dramatically lowers the ability of HNSCC cell lines to invade and form colonies (66). Inhibition of arachidonic acid metabolism results in decreased proliferation and VEGF production in HNSCC cells, whereas its metabolism enhances cancer cell viability (67). Patients with oral cancer have much higher levels of salivary linoleic acid and arachidonic acid, which activate TRPV1 and/or TRPA1 on sensory neurons and contribute to oral cancer pain (68). This implies that tumor immunomodulation, invasion, and metastasis are intimately linked to the variations in pathways between low- and high-risk groups of HNSCC.
CD8+ T cells in the tumor microenvironment are well-recognized antitumor immune cells that govern the anticancer response to cytokines and are one of the predictors for indicating immunotherapy success rate for patients (69, 70). Anti-PD-1/PD-L1 therapy by anti-PD-1 antibody or anti-PD-L1 antibody is efficacious by reactivating tumor-infiltrating CD8+ T cells in a subgroup of cancer patients. Anti-PD-L1 plus anti-CTLA4 early response in HNSCC is characterized by CD4+ T cell activation and recruitment from tumor-draining lymph nodes (71). Anti-PD-1/PD-L1 therapy has been reported to benefit from an increase in tumor-infiltrating cytotoxic T cells (72). Specialized antigen-presenting cells called dendritic cells take samples of the surrounding environment and send co-stimulatory and antigenic signals to adaptive immune system cells (73). In contrast, mast cells are innate immune cells found in human tissues that control tumor cell growth and angiogenesis to modify the inflammatory response and TME homeostasis in patients (74). According to reports, cancer immunotherapy can help stimulate tumor-specific cytotoxic T cells inside the lymphoid organs, increase the activity of cytotoxic T lymphocytes within the tumor, and create potent and durable anti-tumor immunity. To maximize the quantity and caliber of the cytotoxic T lymphocyte response, some dendritic cells will assist in the signaling process from CD4+ T cells to CD8+ T cells during initiation (75). Analysis of the immune microenvironment based on the predictive model of this study showed that the abundance of CD8 T cells, mast cells, T cells, B lineage, cytotoxic lymphocytes, and myeloid dendritic cells infiltration was markedly upregulated in the low-risk group. The upregulation of the level of infiltration of these immune cells in low-risk patients predicted a higher level of immunity in the tumor microenvironment, which is an advantage of immunotherapy.
NAD+ levels can be modulated through dietary intake of NAD+ precursors, such as nicotinamide (NAM), by inhibiting enzymes that consume NAD+, and by regulating the activity of enzymes involved in NAD+ biosynthesis (76). Clinical trials demonstrate that the oral administration of NAM exhibits chemopreventive properties in the development and recurrence of skin squamous cell carcinoma among both high-risk immunocompetent individuals and those with compromised immune systems (77, 78). Furthermore, NAM has been shown to enhance the effectiveness of radiotherapy for HNSCC and laryngeal squamous cell carcinoma (79, 80). Current trials are investigating the efficacy of NAM when used in conjunction with targeted therapies in patients with advanced non-small cell lung cancer (81). Further a prognostic NAD+ metabolism-related gene signature has been developed to predict the response to immune checkpoint inhibitor in glioma (82).
However, there are still certain limitations in this study. First, this study relies heavily on publicly available databases for its analysis, and although representative, the sample size is relatively limited and sample heterogeneity exists. Therefore, we will incorporate multi-center, large sample size clinical cohorts in future studies, combined with prospective follow-up data, to improve the robustness and generalization ability of the model. In addition, although a prognostic model based on NMRGs was constructed and the cellular function of PSME1 was experimentally validated, there is a lack of mechanistic studies on the functions of other characterized genes. In the future, the functional roles of the characterized genes in HNSCC can be verified by in vivo experiments (including knockout/overexpression models, signaling pathway analysis, etc.) and their regulatory mechanisms can be revealed. Finally, immune infiltration analysis is mainly based on algorithmic estimation at the transcriptome level. Follow-up studies may combine tumor tissue samples for immunostaining, mass spectrometry flow cytometry, and other techniques to further confirm the immune cell infiltration status and its true correlation with characteristic genes.
Future research may explore several avenues. Firstly, it is essential to conduct thorough investigations into the mechanisms of the six identified genes. Understanding how these genes influence tumor development through both in vitro and in vivo experiments will elucidate their specific roles in HNSCC. Secondly, given the relationship between gene expression and immune cell infiltration, it is important to examine the dynamic interactions involved in disease progression within the tumor microenvironment. Longitudinal studies that monitor changes in gene expression related to immunity could uncover new therapeutic targets. Lastly, integrating multi-omics data can enhance our understanding of the heterogeneity of HNSCC and assist in identifying more precise biomarkers.
From a clinical perspective, our findings hold significant implications. The developed risk model can categorize patients effectively, enabling personalized treatment approaches: high-risk patients may benefit from aggressive treatment options, while low-risk patients can avoid unnecessary side effects. Additionally, genes associated with immune cell infiltration have the potential to predict responses to immunotherapy, assisting patients in selecting appropriate treatment options. Moreover, developing and testing pathway-specific drugs that target pathways prevalent in various risk groups could offer new avenues for treatment in clinical trials.
Conclusion
This study used machine learning methods and identified six feature genes independently linked to HNSCC prognosis and established a prognosis model. The robustness of the model was confirmed, and it can stably assess the prognosis and immune infiltration of HNSCC patients, contributing to the personalized treatment of the cancer. This study could offer a reference for further investigation into the potential biomarkers for diagnosis and prognosis prediction in HNSCC patients.
Data availability statement
The original contributions presented in the study are included in the article/supplementary material. Further inquiries can be directed to the corresponding author.
Ethics statement
No animal studies are presented in the manuscript. Ethical approval was not required for the studies on humans because only commercially available cell lines were used.
Author contributions
ZG: Conceptualization, Data curation, Investigation, Writing – original draft, Writing – review & editing. XG: Data curation, Investigation, Writing – original draft, Writing – review & editing. LZ: Conceptualization, Data curation, Investigation, Writing – original draft, Writing – review & editing.
Funding
The author(s) declare that no financial support was received for the research and/or publication of this article.
Conflict of interest
The authors declare that the research was conducted in the absence of any commercial or financial relationships that could be construed as a potential conflict of interest.
Generative AI statement
The author(s) declare that no Generative AI was used in the creation of this manuscript.
Publisher’s note
All claims expressed in this article are solely those of the authors and do not necessarily represent those of their affiliated organizations, or those of the publisher, the editors and the reviewers. Any product that may be evaluated in this article, or claim that may be made by its manufacturer, is not guaranteed or endorsed by the publisher.
Abbreviations
HNSCC, Head and neck squamous cell carcinoma; NAD+, Nicotinamide adenine dinucleotide; NMRGs, NAD+ metabolism-related genes; TCGA, The cancer genome atlas; GEO, Gene expression omnibus; DEGs, Differentially expressed genes; WGCNA, Weighted gene co-expression network analysis; GO, Gene ontology; KEGG, Kyoto encyclopedia of genes and genomes; BP, Biological process; MF, Molecular function; CC, Cellular component; AUC, Area under ROC curve; DCA, Decision curve analysis; LASSO, Least absolute shrinkage and selection operator; OS, Overall survival; ROC, Receiver operating characteristic analysis; GSVA, Gene set variant analysis; ssGSEA, Single-sample gene set enrichment analysis.
References
1. Khan H, Sharifi S, Abdolahinia ED, Ahmadian S, Bohlouli S, Gharehbagh FJ, et al. Effect of curcumin on the head and neck squamous cell carcinoma cell line HN5. Curr Mol Pharmacol. (2023) 16:374–80. doi: 10.2174/1874467215666220414143441
2. Zhang N, Liu J, Dong Q, Liu C, Liang X, Tang P, et al. proteomic analysis of the molecular mechanisms of chlorpromazine inhibiting migration of oral squamous cell carcinoma. Curr Proteomics. (2024) 21:2–13. doi: 10.2174/0115701646291510240212091951
3. Ferlay J, Shin HR, Bray F, Forman D, Mathers C, and Parkin DM. Estimates of worldwide burden of cancer in 2008: GLOBOCAN 2008. Int J Cancer. (2010) 127:2893–917. doi: 10.1002/ijc.25516
4. Johnson DE, Burtness B, Leemans CR, Lui VWY, Bauman JE, Grandis JR, et al. Head and neck squamous cell carcinoma. Nat Rev Dis Primers. (2020) 6:92. doi: 10.1038/s41572-020-00224-3
6. Fang X, Tong W, Wu S, Zhu Z, and Zhu J. The role of intratumoral microorganisms in the progression and immunotherapeutic efficacy of head and neck cancer. Oncologie. (2024) 26:349–60. doi: 10.1515/oncologie-2023-0511
7. Peitzsch C, Nathansen J, Schniewind SI, Schwarz F, and Dubrovska A. Cancer stem cells in head and neck squamous cell carcinoma: identification, characterization and clinical implications. Cancers (Basel). (2019) 11:616. doi: 10.3390/cancers11050616
8. Chi AC, Day TA, and Neville BW. Oral cavity and oropharyngeal squamous cell carcinoma–an update. CA Cancer J Clin. (2015) 65:401–21. doi: 10.3322/caac.21293
9. Argiris A, Karamouzis MV, Raben D, and Ferris RL. Head and neck cancer. Lancet. (2008) 371:1695–709. doi: 10.1016/S0140-6736(08)60728-X
10. Hanahan D and Weinberg RA. Hallmarks of cancer: the next generation. Cell. (2011) 144:646–74. doi: 10.1016/j.cell.2011.02.013
11. Wang Q, Cai L, Tang S, Pan D, Wang Z, Chen Q, et al. Phospholipid metabolism reprogramming of cancer stem cells and its impacts on stemness. Biocell. (2025) 49:579–605. doi: 10.32604/biocell.2025.060045
12. Patra KC and Hay N. The pentose phosphate pathway and cancer. Trends Biochem Sci. (2014) 39:347–54. doi: 10.1016/j.tibs.2014.06.005
13. Kupis W, Palyga J, Tomal E, and Niewiadomska E. The role of sirtuins in cellular homeostasis. J Physiol Biochem. (2016) 72:371–80. doi: 10.1007/s13105-016-0492-6
14. Pramono AA, Rather GM, Herman H, Lestari K, and Bertino JR. NAD- and NADPH-contributing enzymes as therapeutic targets in cancer: an overview. Biomolecules. (2020) 10:358. doi: 10.3390/biom10030358
15. Navas LE and Carnero A. NAD(+) metabolism, stemness, the immune response, and cancer. Signal Transduct Target Ther. (2021) 6:2. doi: 10.1038/s41392-020-00354-w
16. Moreira JD, Hamraz M, Abolhassani M, Bigan E, Peres S, Pauleve L, et al. The redox status of cancer cells supports mechanisms behind the warburg effect. Metabolites. (2016) 6. doi: 10.3390/metabo6040033
17. Yang M, Wang B, Hou W, Zeng H, He W, Zhang XK, et al. NAD(+) metabolism enzyme NNMT in cancer-associated fibroblasts drives tumor progression and resistance to immunotherapy by modulating macrophages in urothelial bladder cancer. J Immunother Cancer. (2024) 12:33. doi: 10.1136/jitc-2024-009281
18. Subramanian A, Tamayo P, Mootha VK, Mukherjee S, Ebert BL, Gillette MA, et al. Gene set enrichment analysis: a knowledge-based approach for interpreting genome-wide expression profiles. Proc Natl Acad Sci U.S.A. (2005) 102:15545–50. doi: 10.1073/pnas.0506580102
19. Langfelder P and Horvath S. WGCNA: an R package for weighted correlation network analysis. BMC Bioinf. (2008) 9:559. doi: 10.1186/1471-2105-9-559
20. Fang F, Tai R, Yang F, Dong R, and Zhang Y. Bioinformatic methods uncover 5 diagnostic biomarkers associated with drug resistance and metastasis for gastrointestinal stromal tumor. Curr Pharm Anal. (2025) 21:67–76. doi: 10.1016/j.cpan.2025.01.003
21. Saunders MA, Liang H, and Li WH. Human polymorphism at microRNAs and microRNA target sites. Proc Natl Acad Sci U.S.A. (2007) 104:3300–5. doi: 10.1073/pnas.0611347104
22. Yan S, Han Z, Wang T, Wang A, Liu F, Yu S, et al. Exploring the immune-related molecular mechanisms underlying the comorbidity of temporal lobe epilepsy and major depressive disorder through integrated data set analysis. Curr Mol Pharmacol. (2025) 17. doi: 10.2174/0118761429380394250217093030
23. Ritchie ME, Phipson B, Wu D, Hu Y, Law CW, Shi W, et al. limma powers differential expression analyses for RNA-sequencing and microarray studies. Nucleic Acids Res. (2015) 43:e47. doi: 10.1093/nar/gkv007
24. Yu G, Wang LG, Han Y, and He QY. clusterProfiler: an R package for comparing biological themes among gene clusters. OMICS. (2012) 16:284–7. doi: 10.1089/omi.2011.0118
25. Xia S, Tao H, Su S, Chen X, Ma L, Li J, et al. DNA methylation variation is identified in monozygotic twins discordant for congenital heart diseases. Congenit Heart Dis. (2024) 19:247–56. doi: 10.32604/chd.2024.052583
26. Lirette ST and Aban I. Quantifying predictive accuracy in survival models. J Nucl Cardiol. (2017) 24:1998–2003. doi: 10.1007/s12350-015-0296-z
27. Friedman J, Hastie T, and Tibshirani R. Regularization paths for generalized linear models via coordinate descent. J Stat Softw. (2010) 33:1–22. doi: 10.18637/jss.v033.i01
28. Ozhan A, Tombaz M, and Konu O. SmulTCan: A Shiny application for multivariable survival analysis of TCGA data with gene sets. Comput Biol Med. (2021) 137:104793. doi: 10.1016/j.compbiomed.2021.104793
29. Blanche P, Dartigues JF, and Jacqmin-Gadda H. Estimating and comparing time-dependent areas under receiver operating characteristic curves for censored event times with competing risks. Stat Med. (2013) 32:5381–97. doi: 10.1002/sim.5958
30. Wang Q, Wang X, Liang Q, Wang S, Xiwen L, Pan F, et al. Distinct prognostic value of mRNA expression of guanylate-binding protein genes in skin cutaneous melanoma. Oncol Lett. (2018) 15:7914–22. doi: 10.3892/ol.2018.8306
31. Beroukhim R, Mermel CH, Porter D, Wei G, Raychaudhuri S, Donovan J, et al. The landscape of somatic copy-number alteration across human cancers. Nature. (2010) 463:899–905. doi: 10.1038/nature08822
32. Yoshihara K, Shahmoradgoli M, Martinez E, Vegesna R, Kim H, Torres-Garcia W, et al. Inferring tumour purity and stromal and immune cell admixture from expression data. Nat Commun. (2013) 4:2612. doi: 10.1038/ncomms3612
33. Becht E, Giraldo NA, Lacroix L, Buttard B, Elarouci N, Petitprez F, et al. Estimating the population abundance of tissue-infiltrating immune and stromal cell populations using gene expression. Genome Biol. (2016) 17:218. doi: 10.1186/s13059-016-1070-5
34. Charoentong P, Finotello F, Angelova M, Mayer C, Efremova M, Rieder D, et al. Pan-cancer immunogenomic analyses reveal genotype-immunophenotype relationships and predictors of response to checkpoint blockade. Cell Rep. (2017) 18:248–62. doi: 10.1016/j.celrep.2016.12.019
35. Zhang L, Yang H, Liu J, Wang K, Cai X, Xiao W, et al. Metabolomics-based approach to analyze the therapeutic targets and metabolites of a synovitis ointment for knee osteoarthritis. Curr Pharm Anal. (2023) 19:222–34. doi: 10.2174/1573412919666221223152915
36. Wang J, Zhang Y, Sun L, and Liu Y. IMMT promotes hepatocellular carcinoma formation via PI3K/AKT/mTOR pathway. Oncologie. (2023) 25:691–703. doi: 10.1515/oncologie-2023-0289
37. Palanisamy TB and Arumugam M. Transcriptomic analysis reveals potential biomarkers for early-onset pre-eclampsia using integrative bioinformatics and LASSO based approach. Comput Biol Med. (2025) 192:110203. doi: 10.1016/j.compbiomed.2025.110203
38. Ceriello A, Lucisano G, Prattichizzo F, La Grotta R, Franzén S, Gudbjörnsdottir S, et al. Risk factor variability and cardiovascular risk among patients with diabetes: a nationwide observational study. Eur J Prev Cardiol. (2023) 30:719–27. doi: 10.1093/eurjpc/zwad072
39. Tan X, Li G, Deng H, Xiao G, Wang Y, Zhang C, et al. Obesity enhances the response to neoadjuvant anti-PD1 therapy in oral tongue squamous cell carcinoma. Cancer Med. (2024) 13:e7346. doi: 10.1002/cam4.7346
40. Sanchez-Martin D, Martinez-Torrecuadrada J, Teesalu T, Sugahara KN, Alvarez-Cienfuegos A, Ximenez-Embun P, et al. Proteasome activator complex PA28 identified as an accessible target in prostate cancer by in vivo selection of human antibodies. Proc Natl Acad Sci U.S.A. (2013) 110:13791–6. doi: 10.1073/pnas.1300013110
41. Chiarugi A, Dolle C, Felici R, and Ziegler M. The NAD metabolome–a key determinant of cancer cell biology. Nat Rev Cancer. (2012) 12:741–52. doi: 10.1038/nrc3340
42. Chen X, Wu W, Wang Y, Zhang B, Zhou H, Xiang J, et al. Development of prognostic indicator based on NAD+ metabolism related genes in glioma. Front Surg. (2023) 10:1071259. doi: 10.3389/fsurg.2023.1071259
43. Wen H, Mi Y, Li F, Xue X, Sun X, Zheng P, et al. Identifying the signature of NAD+ metabolism-related genes for immunotherapy of gastric cancer. Heliyon. (2024) 10:e38823. doi: 10.1016/j.heliyon.2024.e38823
44. Foote HP, Wu H, Balevic SJ, Thompson EJ, Hill KD, Graham EM, et al. Using Pharmacokinetic Modeling and Electronic Health Record Data to Predict Clinical and Safety Outcomes after Methylprednisolone Exposure during Cardiopulmonary Bypass in Neonates. Congenit Heart Dis. (2023) 18:295–313. doi: 10.32604/chd.2023.026262
45. Chang SR, Chou CH, Tu HF, Liu CJ, Chang KW, and Lin SC. The expression of immune co-stimulators as a prognostic predictor of head and neck squamous cell carcinomas and oral squamous cell carcinomas. J Dent Sci. (2024) 19:1380–8. doi: 10.1016/j.jds.2024.05.004
46. Chang SR, Chou CH, Liu CJ, Lin YC, Tu HF, Chang KW, et al. The concordant disruption of B7/CD28 immune regulators predicts the prognosis of oral carcinomas. Int J Mol Sci. (2023), 24(6). doi: 10.3390/ijms24065931
47. Chu HW, Chang KP, Hsu CW, Chang IY, Liu HP, Chen YT, et al. Identification of salivary biomarkers for oral cancer detection with untargeted and targeted quantitative proteomics approaches. Mol Cell Proteomics. (2019) 18:1796–806. doi: 10.1074/mcp.RA119.001530
48. Song H, Wang Y, Shi C, Lu J, Yuan T, and Wang X. SH3KBP1 promotes glioblastoma tumorigenesis by activating EGFR signaling. Front Oncol. (2020) 10:583984. doi: 10.3389/fonc.2020.583984
49. Duan Y, Du Y, Mu Y, Gu Z, and Wang C. Expression, prognostic value and mechanism of SP100 family in pancreatic adenocarcinoma. Aging (Albany NY). (2023) 15:5569–91. doi: 10.18632/aging.204811
50. Liu Y, Yuan Y, Chen T, Xiao H, Zhang X, and Zhang F. Identification of aneuploidy-related gene signature to predict survival in head and neck squamous cell carcinomas. Aging (Albany NY). (2023) 15:13100–17. doi: 10.18632/aging.205221
51. Du P, Chai Y, Zong S, Yue J, and Xiao H. Identification of a prognostic model based on fatty acid metabolism-related genes of head and neck squamous cell carcinoma. Front Genet. (2022) 13:888764. doi: 10.3389/fgene.2022.888764
52. Olivier M and Taniere P. Somatic mutations in cancer prognosis and prediction: lessons from TP53 and EGFR genes. Curr Opin Oncol. (2011) 23:88–92. doi: 10.1097/CCO.0b013e3283412dfa
53. Mascaux C, Iannino N, Martin B, Paesmans M, Berghmans T, Dusart M, et al. The role of RAS oncogene in survival of patients with lung cancer: a systematic review of the literature with meta-analysis. Br J Cancer. (2005) 92:131–9. doi: 10.1038/sj.bjc.6602258
54. Shepherd FA, Lacas B, Le Teuff G, Hainaut P, Janne PA, Pignon JP, et al. Pooled analysis of the prognostic and predictive effects of TP53 comutation status combined with KRAS or EGFR mutation in early-stage resected non-small-cell lung cancer in four trials of adjuvant chemotherapy. J Clin Oncol. (2017) 35:2018–27. doi: 10.1200/JCO.2016.71.2893
55. Kim N, Hong Y, Kwon D, and Yoon S. Somatic mutaome profile in human cancer tissues. Genomics Inform. (2013) 11:239–44. doi: 10.5808/GI.2013.11.4.239
56. Jia Q, Wang J, He N, He J, and Zhu B. Titin mutation associated with responsiveness to checkpoint blockades in solid tumors. JCI Insight. (2019) 4:e127901. doi: 10.1172/jci.insight.127901
57. Pastushenko I, Mauri F, Song Y, de Cock F, Meeusen B, Swedlund B, et al. Fat1 deletion promotes hybrid EMT state, tumour stemness and metastasis. Nature. (2021) 589:448–55. doi: 10.1038/s41586-020-03046-1
58. Shi Y, Ren X, Cao S, Chen X, Yuan B, Brasil da Costa FH, et al. TP53 gain-of-function mutation modulates the immunosuppressive microenvironment in non-HPV-associated oral squamous cell carcinoma. J Immunother Cancer. (2023) 11:e006666. doi: 10.1158/1538-7445.AM2023-619
59. Wu ZH, Wu B, Li C, Zhang YJ, and Zhou T. Pyroptosis-related signature and tumor microenvironment infiltration characterization in head and neck squamous cell carcinoma. Front Cell Dev Biol. (2022) 10:702224. doi: 10.3389/fcell.2022.702224
60. Ju G, Yao Z, Zhao Y, Zhao X, and Liu F. Data mining on identifying diagnosis and prognosis biomarkers in head and neck squamous carcinoma. Sci Rep. (2023) 13:10020. doi: 10.1038/s41598-023-37216-8
61. He Y, Xiang J, Li Y, Huang W, Gu F, Wang Y, et al. PES1 is a biomarker of head and neck squamous cell carcinoma and is associated with the tumor microenvironment. Cancer Med. (2023) 12:12622–38. doi: 10.1002/cam4.5948
62. Li C, Li R, Grandis JR, and Johnson DE. Bortezomib induces apoptosis via Bim and Bik up-regulation and synergizes with cisplatin in the killing of head and neck squamous cell carcinoma cells. Mol Cancer Ther. (2008) 7:1647–55. doi: 10.1158/1535-7163.MCT-07-2444
63. Zang Y, Thomas SM, Chan ET, Kirk CJ, Freilino ML, DeLancey HM, et al. Carfilzomib and ONX 0912 inhibit cell survival and tumor growth of head and neck cancer and their activities are enhanced by suppression of Mcl-1 or autophagy. Clin Cancer Res. (2012) 18:5639–49. doi: 10.1158/1078-0432.CCR-12-1213
64. Fribley AM, Evenchik B, Zeng Q, Park BK, Guan JY, Zhang H, et al. Proteasome inhibitor PS-341 induces apoptosis in cisplatin-resistant squamous cell carcinoma cells by induction of Noxa. J Biol Chem. (2006) 281:31440–7. doi: 10.1074/jbc.M604356200
65. Zang Y, Kirk CJ, and Johnson DE. Carfilzomib and oprozomib synergize with histone deacetylase inhibitors in head and neck squamous cell carcinoma models of acquired resistance to proteasome inhibitors. Cancer Biol Ther. (2014) 15:1142–52. doi: 10.4161/cbt.29452
66. Radhakrishnan A, Nanjappa V, Raja R, Sathe G, Chavan S, Nirujogi RS, et al. Dysregulation of splicing proteins in head and neck squamous cell carcinoma. Cancer Biol Ther. (2016) 17:219–29. doi: 10.1080/15384047.2016.1139234
67. Park SW, Heo DS, and Sung MW. The shunting of arachidonic acid metabolism to 5-lipoxygenase and cytochrome p450 epoxygenase antagonizes the anti-cancer effect of cyclooxygenase-2 inhibition in head and neck cancer cells. Cell Oncol (Dordr). (2012) 35:1–8. doi: 10.1007/s13402-011-0051-7
68. Ruparel S, Bendele M, Wallace A, and Green D. Released lipids regulate transient receptor potential channel (TRP)-dependent oral cancer pain. Mol Pain. (2015) 11:30. doi: 10.1186/s12990-015-0016-3
69. Raskov H, Orhan A, Christensen JP, and Gogenur I. Cytotoxic CD8(+) T cells in cancer and cancer immunotherapy. Br J Cancer. (2021) 124:359–67. doi: 10.1038/s41416-020-01048-4
70. Jayadev S and Yusuff I. Robust U-HPLC method development of desonide and its application to in vitro release testing (IVRT) of topical cream products. Curr Pharm Anal. (2024) 20:327–44. doi: 10.2174/0115734129298659240606103013
71. Franken A, Bila M, Mechels A, Kint S, Van Dessel J, Pomella V, et al. CD4(+) T cell activation distinguishes response to anti-PD-L1+anti-CTLA4 therapy from anti-PD-L1 monotherapy. Immunity. (2024) 57:541–558 e7. doi: 10.1016/j.immuni.2024.02.007
72. Wang X, Zha H, Wu W, Yuan T, Xie S, Jin Z, et al. CD200(+) cytotoxic T lymphocytes in the tumor microenvironment are crucial for efficacious anti-PD-1/PD-L1 therapy. Sci Transl Med. (2023) 15:eabn5029. doi: 10.1126/scitranslmed.abn5029
73. Shortman K and Naik SH. Steady-state and inflammatory dendritic-cell development. Nat Rev Immunol. (2007) 7:19–30. doi: 10.1038/nri1996
74. Aponte-Lopez A and Munoz-Cruz S. Mast cells in the tumor microenvironment. Adv Exp Med Biol. (2020) 1273:159–73. doi: 10.1007/978-3-030-49270-0_9
75. Borst J, Ahrends T, Babala N, Melief CJM, and Kastenmuller W. CD4(+) T cell help in cancer immunology and immunotherapy. Nat Rev Immunol. (2018) 18:635–47. doi: 10.1038/s41577-018-0044-0
76. Xie N, Zhang L, Gao W, Huang C, Huber PE, Zhou X, et al. NAD(+) metabolism: pathophysiologic mechanisms and therapeutic potential. Signal Transduct Target Ther. (2020) 5:227. doi: 10.1038/s41392-020-00311-7
77. Chen AC, Martin AJ, Choy B, Fernández-Peñas P, Dalziell RA, McKenzie CA, et al. A phase 3 randomized trial of nicotinamide for skin-cancer chemoprevention. N Engl J Med. (2015) 373:1618–26. doi: 10.1056/NEJMoa1506197
78. Drago F, Ciccarese G, Cogorno L, Calvi C, Marsano LA, Parodi A, et al. Prevention of non-melanoma skin cancers with nicotinamide in transplant recipients: a case-control study. Eur J Dermatol. (2017) 27:382–5. doi: 10.1684/ejd.2017.3025
79. Janssens GO, Rademakers SE, Terhaard CH, Doornaert PA, Bijl HP, van den Ende P, et al. Accelerated radiotherapy with carbogen and nicotinamide for laryngeal cancer: results of a phase III randomized trial. J Clin Oncol. (2012) 30:1777–83. doi: 10.1200/JCO.2011.35.9315
80. Janssens GO, Terhaard CH, Doornaert PA, Bijl HP, van den Ende P, Chin A, et al. Acute toxicity profile and compliance to accelerated radiotherapy plus carbogen and nicotinamide for clinical stage T2-4 laryngeal cancer: results of a phase III randomized trial. Int J Radiat Oncol Biol Phys. (2012) 82:532–8. doi: 10.1016/j.ijrobp.2010.11.045
81. Nikas IP, Paschou SA, and Ryu HS. The role of nicotinamide in cancer chemoprevention and therapy. Biomolecules. (2020) 10:477. doi: 10.3390/biom10030477
Keywords: WGCNA analysis, prognostic modeling, head and neck squamous cell carcinoma, gene mutation, immune infiltration
Citation: Guan Z, Gu X and Zheng L (2025) Bioinformatics-based analysis of nicotinamide adenine dinucleotide metabolism-related genes to predict immune status and prognosis for head and neck squamous cell carcinoma patients. Front. Immunol. 16:1609175. doi: 10.3389/fimmu.2025.1609175
Received: 10 April 2025; Accepted: 10 June 2025;
Published: 30 June 2025.
Edited by:
Lin Zhang, Monash University, AustraliaCopyright © 2025 Guan, Gu and Zheng. This is an open-access article distributed under the terms of the Creative Commons Attribution License (CC BY). The use, distribution or reproduction in other forums is permitted, provided the original author(s) and the copyright owner(s) are credited and that the original publication in this journal is cited, in accordance with accepted academic practice. No use, distribution or reproduction is permitted which does not comply with these terms.
*Correspondence: Lian Zheng, emhlbmdsaWFuMDcyNkAxNjMuY29t