- 1Department of Cardiology, Nanjing Jiangbei Hospital, Nanjing, Jiangsu, China
- 2Zhangjiang Center for Translational Medicine, Shanghai Biotecan Pharmaceuticals Co., Ltd., Shanghai, China
- 3Teaching Research Department, Changji Branch of the First Affiliated Hospital of Xinjiang Medical University, Changji, Xinjiang, China
Objective: Gut dysbiosis and the distribution of low-density lipoprotein cholesterol (LDL-C) subfractions have been implicated in cardiovascular risk among patients with ST-segment elevation myocardial infarction (STEMI). However, the prognostic significance of LDL-C subfractions in relation to gut microbiota composition remains largely unexplored. This study aimed to assess differences in gut microbiota profiles and LDL-C subfraction distribution between patients with STEMI with and without major adverse cardiovascular events (MACEs) and to elucidate their potential interplay.
Methods: We enrolled 32 male population without coronary heart disease and 66 male patients with STEMI. Fecal samples were analyzed via 16S rDNA gene sequencing to assess gut microbiota diversity and composition. Plasma LDL-C subfractions were quantified using the Quantimetrix Lipoprint LDL System.
Results: Among these 66 STEMI patients, 18 experienced MACEs during a median follow-up of 13 months (MACEs group), while 18 age-matched event-free patients were selected as controls (Non-MACEs group). Significant differences in gut microbiota composition, but not diversity, were observed between the two groups, with the Non-MACEs group exhibiting a greater number of marker genera. Although no significant differences were found in LDL-C subfractions between groups, multiple significant negative correlations were identified between gut microbiota and LDL-C subfractions in the MACEs group, including between Coprococcus and LDLC-4 (ρ=-0.5488, P<0.05), between Coprococcus and LDLC-5 (ρ=-0.6418, P<0.01), between Coprococcus and LDLC-6 (ρ=-0.4988, P<0.05), between UCG-002 and LDLC-4 (ρ=-0.4948, P<0.05), and between Christensenellaceae_R-7_group and LDLC-4 (ρ=-0.5032, P<0.05). Furthermore, gut microbiota markers demonstrated superior predictive performance for MACEs compared to LDL-C subfractions, with UCG-002, Christensenellaceae_R-7_group, and NK4A214_group achieving AUC values >0.75.
Conclusion: Gut microbiota, particularly UCG-002, Christensenellaceae_R-7_group, and NK4A214_group, exhibit greater prognostic potential for MACEs than LDL-C subfractions. These findings highlight the role of gut microbiota in post-STEMI risk stratification, underscoring its potential as a target for future cardiovascular interventions.
1 Introduction
ST-segment elevation myocardial infarction (STEMI) remains a major cause of morbidity and mortality worldwide, necessitating a better understanding of its pathophysiological mechanisms and prognostic markers (1, 2). Despite advancements in acute management, including timely reperfusion therapy and pharmacological interventions, a substantial proportion of STEMI patients develop major adverse cardiovascular events (MACEs), such as recurrent myocardial infarction, heart failure, and cardiovascular death (3–5). Identifying novel prognostic factors is essential for improving risk stratification and tailoring secondary prevention strategies. Recent studies have highlighted the gut microbiota and lipid metabolism as critical contributors to cardiovascular disease progression (6–9), yet their prognostic significance in STEMI remains underexplored.
The gut microbiota plays a pivotal role in cardiovascular health, influencing systemic inflammation, lipid metabolism, and immune responses (10, 11). Emerging evidence suggests that dysbiosis, an imbalance in gut microbial composition, is linked to the development and progression of atherosclerosis and acute coronary syndromes (ACS) (12–15). Specifically, gut-derived metabolites, such as trimethylamine N-oxide (TMAO), have been implicated in endothelial dysfunction, platelet hyperreactivity, and pro-inflammatory signaling, all of which contribute to atherothrombosis (16, 17). Additionally, alterations in gut microbial diversity have been associated with systemic metabolic disturbances, including dyslipidemia and insulin resistance (18–21), further predisposing individuals to adverse cardiovascular outcomes. However, whether gut microbiota composition differs between patients with STEMI with and without MACEs and its potential prognostic value remains unclear.
Lipid metabolism, particularly LDL-C and its particles, is a well-established determinant of atherosclerotic cardiovascular disease (ASCVD) (22, 23). While total LDL-C levels serve as a primary target for lipid-lowering therapies, growing evidence suggests that LDL-C subfractions, such as small, dense LDL particles, exhibit enhanced atherogenic potential (22, 24, 25). Small, dense LDL is more susceptible to oxidation, has a prolonged plasma half-life, and demonstrates a greater propensity for arterial wall penetration, thereby accelerating atherosclerosis progression (26, 27). Moreover, recent studies indicate that gut microbiota may modulate lipid metabolism by influencing bile acid metabolism and cholesterol homeostasis (28–30). This bidirectional interaction suggests a potential link between gut dysbiosis, LDL-C subfractions distribution, and cardiovascular risk in STEMI patients. Nonetheless, the prognostic implications of LDL-C subfractions in relation to gut microbiota composition remain largely unexplored in this patient population. Given the emerging interplay between gut microbiota, lipid metabolism, and cardiovascular disease, we hypothesize that alterations in gut microbial composition and the distribution of LDL-C subfractions may serve as prognostic markers in patients with STEMI. This study aimed to investigate the differences in gut microbiota profiles and the distribution of LDL-C subfractions between patients with STEMI with and without MACEs, and elucidated the interplay between gut microbiota and LDL-C subfractions in these two groups, which might provide novel insights into the pathophysiology of STEMI and help identify potential therapeutic targets for modulating microbial and lipidomic profiles to improve cardiovascular outcomes.
2 Materials and methods
2.1 Study design and subjects
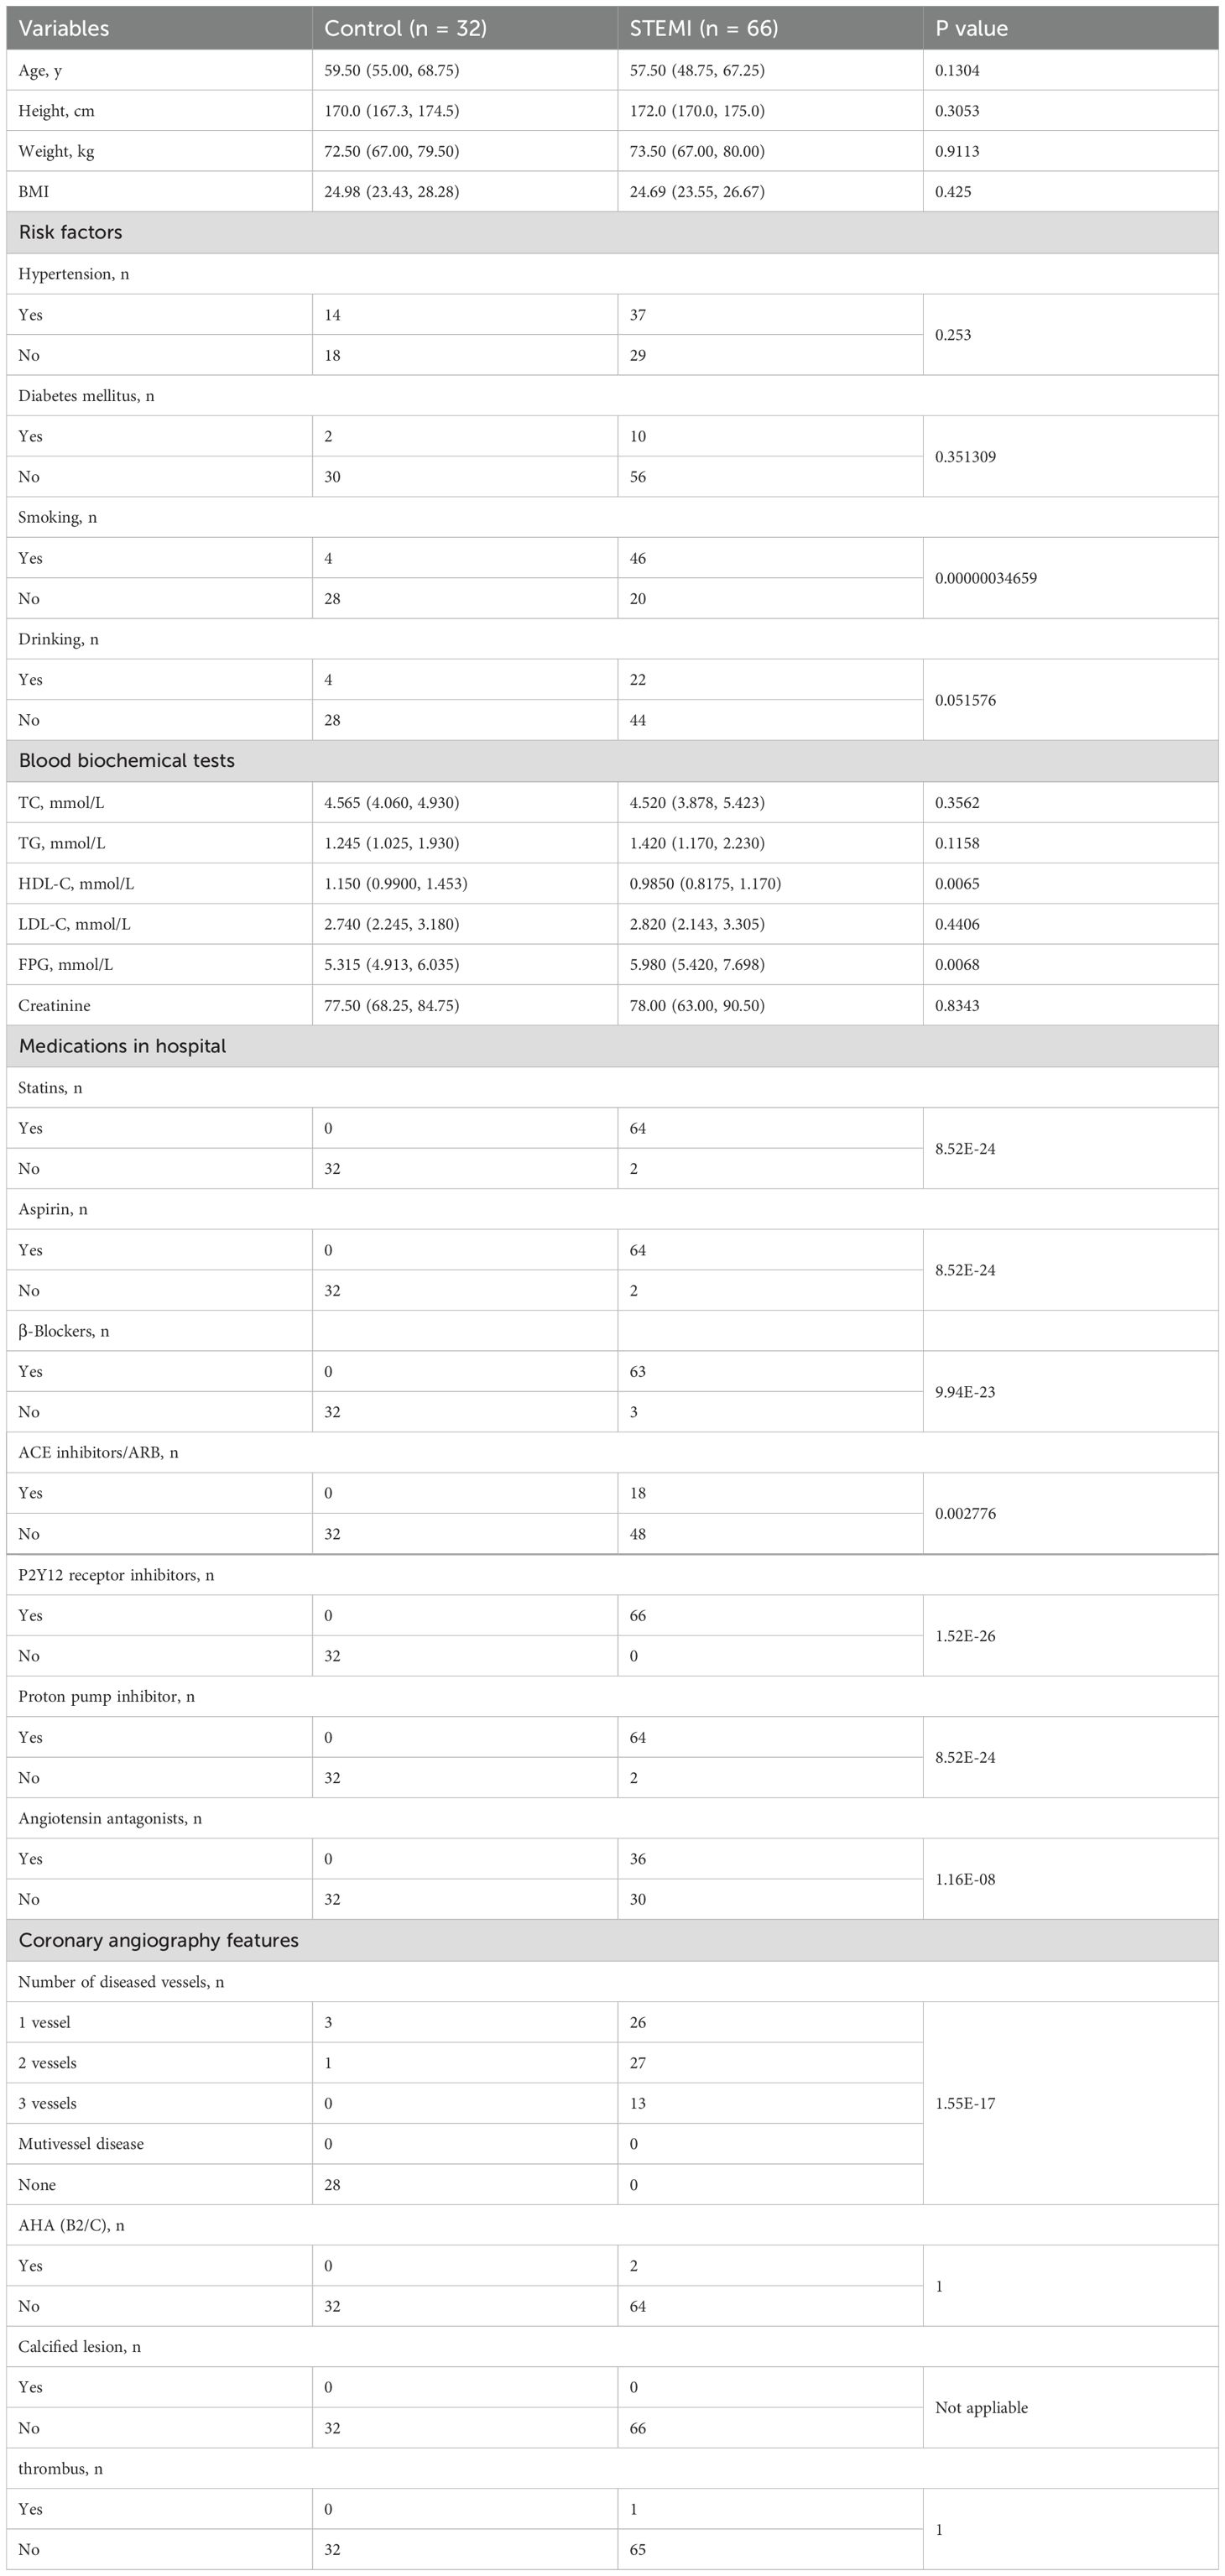
This case-control study comprised 32 male individuals without coronary heart disease (referred to as the Control group) and 66 male patients diagnosed with STEMI (referred to as the STEMI group) (Figure 1). A range of individual characteristics, including age, height, weight, risk factors, blood biochemical parameters, medications administered during hospitalization, and coronary angiography findings, were collected. The body mass index (BMI) was calculated by dividing weight (in kilograms) by the square of height (in meters). Inclusion criteria for the STEMI group included: (i) cardiac troponin (cTn) I/T levels exceeding the upper normal reference value, or creatine kinase isoenzymes exceeding the normal reference limit; (ii) ST-segment elevation observed in two or more contiguous leads on the electrocardiogram (ECG); (iii) and one or more of the following: persistent ischemic chest pain, abnormal wall motion on the ECG, and abnormal coronary angiography findings. Exclusion criteria for participants were: (i) other identifiable causes of coronary thrombosis (e.g., coronary vasospasm or systemic thromboembolism); (ii) evident active infection during hospitalization; (iii) prior history of organic digestive system or gastrointestinal surgery; (iv) history of kidney or respiratory diseases; (v) infection within one month before the study or use of probiotics, prebiotics, postbiotics, antacids, antibiotics, or related preparations. Control subjects were recruited voluntarily from individuals undergoing routine health check-ups at the same institution, all of whom had normal results. The study was approved by the Ethics Committee of Nanjing Jiangbei Hospital (#2022031). All participants provided written informed consent in accordance with the principles outlined in the Declaration of Helsinki. Additionally, this study is purely observational, and no clinical trial registration was conducted.
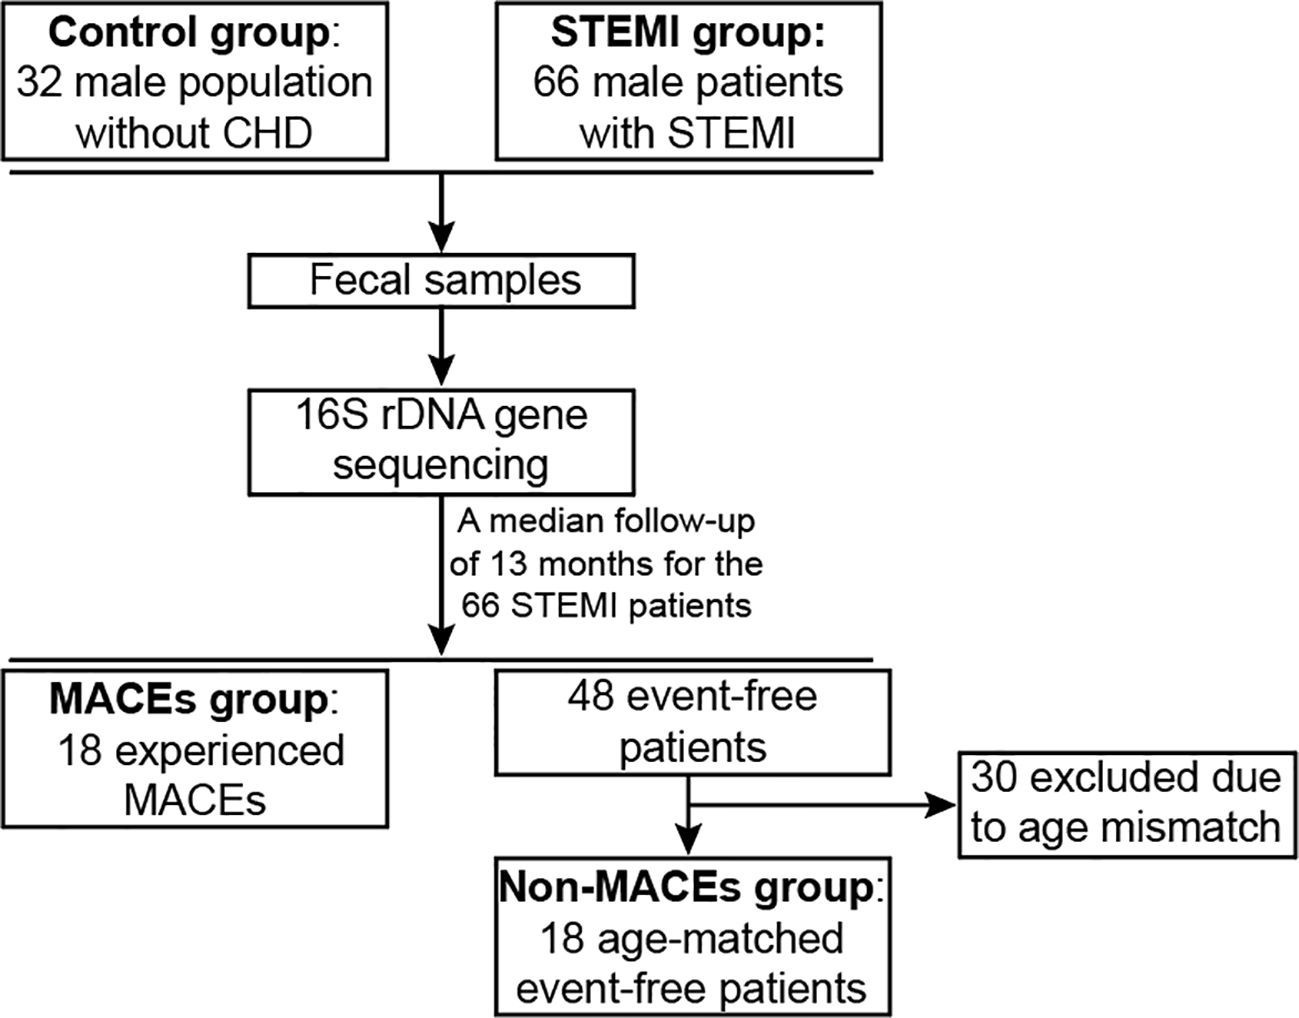
Figure 1. Flowchart of the study design. Thirty-two male population without CHD (Control group) and 66 male patients with STEMI (STEMI group) were enrolled in this study. Fecal samples were acquired from every individual and analyzed via 16S rDNA gene sequencing to assess gut microbiota diversity and composition. Among the 66 STEMI patients, 18 experienced MACEs during a median follow-up of 13 months (MACEs group), while 18 age-matched event-free patients were selected as controls (Non-MACEs group). CHD, coronary heart disease; STEMI, ST-segment elevation myocardial infarction; MACEs, major adverse cardiovascular events.
2.2 Collection of fecal samples
Fecal samples, approximately the size of two soybean grains, were collected from each participant, either by themselves or by their family members, within 3 minutes of defecation while in the hospital. After collection, the samples were placed in fecal samplers (Biotecan, Shanghai, China), sealed, labeled, and transported to Biotecan Laboratories within 2 days, ensuring the temperature remained below 18°C. Upon arrival, the samples were promptly stored at -80°C.
2.3 16S rDNA gene sequencing, data processing, and bioinformatics analysis
A total of 98 fecal samples (32 from the control group and 66 from the STEMI group) were collected in fecal samplers and stored at -80°C until they were processed for high-throughput sequencing. Genomic DNA was extracted from the fecal samples using the QIAamp PowerFecal Pro DNA Kit (QIAGEN, Germany). The concentration and integrity of the extracted DNA were evaluated using a NanoDrop ND-1000 spectrophotometer (Thermo Fisher Scientific, Waltham, MA, USA) and agarose gel electrophoresis, respectively. The V3-V4 hypervariable region of the bacterial 16S rRNA gene was amplified by PCR using the primer pair 341F (5′-CCTACGGGNGGCWGCAG-3′) and 805R (5′-GACTACHVGGGTATCTAATCC-3′). Sample-specific paired-end 6-bp barcodes were integrated into TruSeq adapters for multiplexed sequencing. The PCR reaction mixture included 25 μL of Phusion High-Fidelity PCR Master Mix (New England Biolabs, MA, USA), 3 μL of each 10 μM forward and reverse primer, 10 μL of template DNA, 3 μL of DMSO, and 6 μL of nuclease-free water. The thermal cycling protocol comprised an initial denaturation at 98 °C for 30 seconds, followed by 25 cycles of 98 °C for 15 seconds, 58 °C for 15 seconds, and 72 °C for 15 seconds, with a final extension at 72 °C for 1 minute. PCR products were purified using Agencourt AMPure XP Beads (Beckman Coulter, Indianapolis, IN) and quantified with the PicoGreen dsDNA Assay Kit (Invitrogen, Carlsbad, CA, USA). Following individual quantification, the amplicons were pooled in equal amounts for paired-end sequencing (2 × 250 bp) on the Illumina NovaSeq 6000 platform, conducted by Shanghai Biotecan Pharmaceuticals Co., Ltd. (Shanghai, China).
To analyze the sequencing data, the Quantitative Insights Into Microbial Ecology 2 (QIIME 2, v2017.6.0) pipeline and predefined criteria were employed (31, 32). Paired-end reads were assembled using Vsearch V2.4.4 (33). Operational taxonomic units (OTUs) were defined based on 16S rDNA gene sequences, applying a 97% similarity threshold and referencing the Greengenes database via Vsearch V2.4.4. OTUs representing less than 0.001% of the total sequences were excluded from the analysis. The final OTU table was generated by averaging, rounding, and rarefying, using 100 evenly resampled OTU subsets at 90% of the minimum sequencing depth. Abundance curves were plotted at the OTU level, and sequencing depth was evaluated and confirmed through rarefaction analysis. Alpha diversity was assessed using the Chao1, Simpson, and Shannon indices within the QIIME 2 platform. Statistical comparisons were conducted using the Pairwise Wilcox test. Beta diversity was evaluated using Weighted UniFrac principal component analysis (PCoA). To compare the intestinal bacterial composition and structure between the control and STEMI groups, Permutational Multivariate Analysis of Variance (PERMANOVA) was applied. The comparability between groups was assessed using One-way Analysis of Similarities (ANOSIM). Linear Discriminant Analysis Effect Size (LEfSe) was used to identify taxa with significantly different abundances between the groups, based on default parameters (logarithmic LDA score ≥ 2) (34, 35). The phylogenetic tree was visualized using GraPhlAn (http://huttenhower.sph.harvard.edu/GraPhlAn). To predict gut microbial functions, the Phylogenetic Investigation of Communities by Reconstruction of Unobserved States (PICRUSt, PICRUSt2 v2.3.0-b) was employed (36, 37), with the Univariate Test used to assess significant differences.
2.4 Sample collection and laboratory indices detection
Blood samples were obtained from all participants after an overnight fast, prior to undergoing coronary angiography and receiving any concomitant medications. The samples were then analyzed in the Department of Clinical Laboratory for routine biomarkers, including total cholesterol (TC), triglycerides (TG), high-density lipoprotein cholesterol (HDL-C), low-density lipoprotein cholesterol (LDL-C), serum creatinine, and other relevant indices. Plasma was immediately separated and subjected to centrifugation at 800×g for 10 minutes at 4°C. The LDL-C subfractions were classified and quantified using the Quantimetrix Lipoprint LDL System (Quantimetrix Corporation, Redondo Beach, CA, USA), following the manufacturer’s protocol (38). Briefly, plasma mixed with liquid loading gel was applied to the top of pre-cast 3% polyacrylamide gel tubes. After 30 minutes of photopolymerization at room temperature, the samples were electrophoresed for 1 hour, and densitometric analysis was performed at 610 nm.
2.5 Clinical endpoints
The primary endpoint of the follow-up was the occurrence of the first MACEs, which encompassed cardiovascular death, non-fatal ischemic stroke, recurrent myocardial infarction, the need for emergency or repeated revascularization, and rehospitalization due to heart failure, as previously defined (39–41).
2.6 Statistical analyses
Data analysis was performed using SPSS version 23.0 (IBM, Chicago, IL, USA) and GraphPad Prism version 7.0 (GraphPad, San Diego, CA, USA). Categorical variables were compared between groups using the chi-square test or Fisher’s exact test. For continuous variables, the Shapiro-Wilk test was applied to assess the normality of the data distribution. Comparisons between groups were made using a two-tailed Student’s t-test for normally distributed data and a Mann-Whitney U-test for non-normally distributed data. The exact number of patients and the values of continuous variables for each group are provided in the figure legends. Venn diagrams, heatmaps, and Spearman’s rank correlation were generated using R software (v3.6.3). A p-value < 0.05 was considered statistically significant in all analyses.
3 Results
3.1 Characteristics of study participants
The baseline characteristics of the Control and STEMI groups were presented in Table 1. When compared to the Control group, the STEMI group exhibited significantly elevated fasting plasma glucose (FPG) levels (P=0.0068) and significantly reduced high-density lipoprotein cholesterol (HDL-C) levels (P=0.0065). Moreover, the prevalence of smoking was notably higher in the STEMI group than in the Control group (P<0.0001).
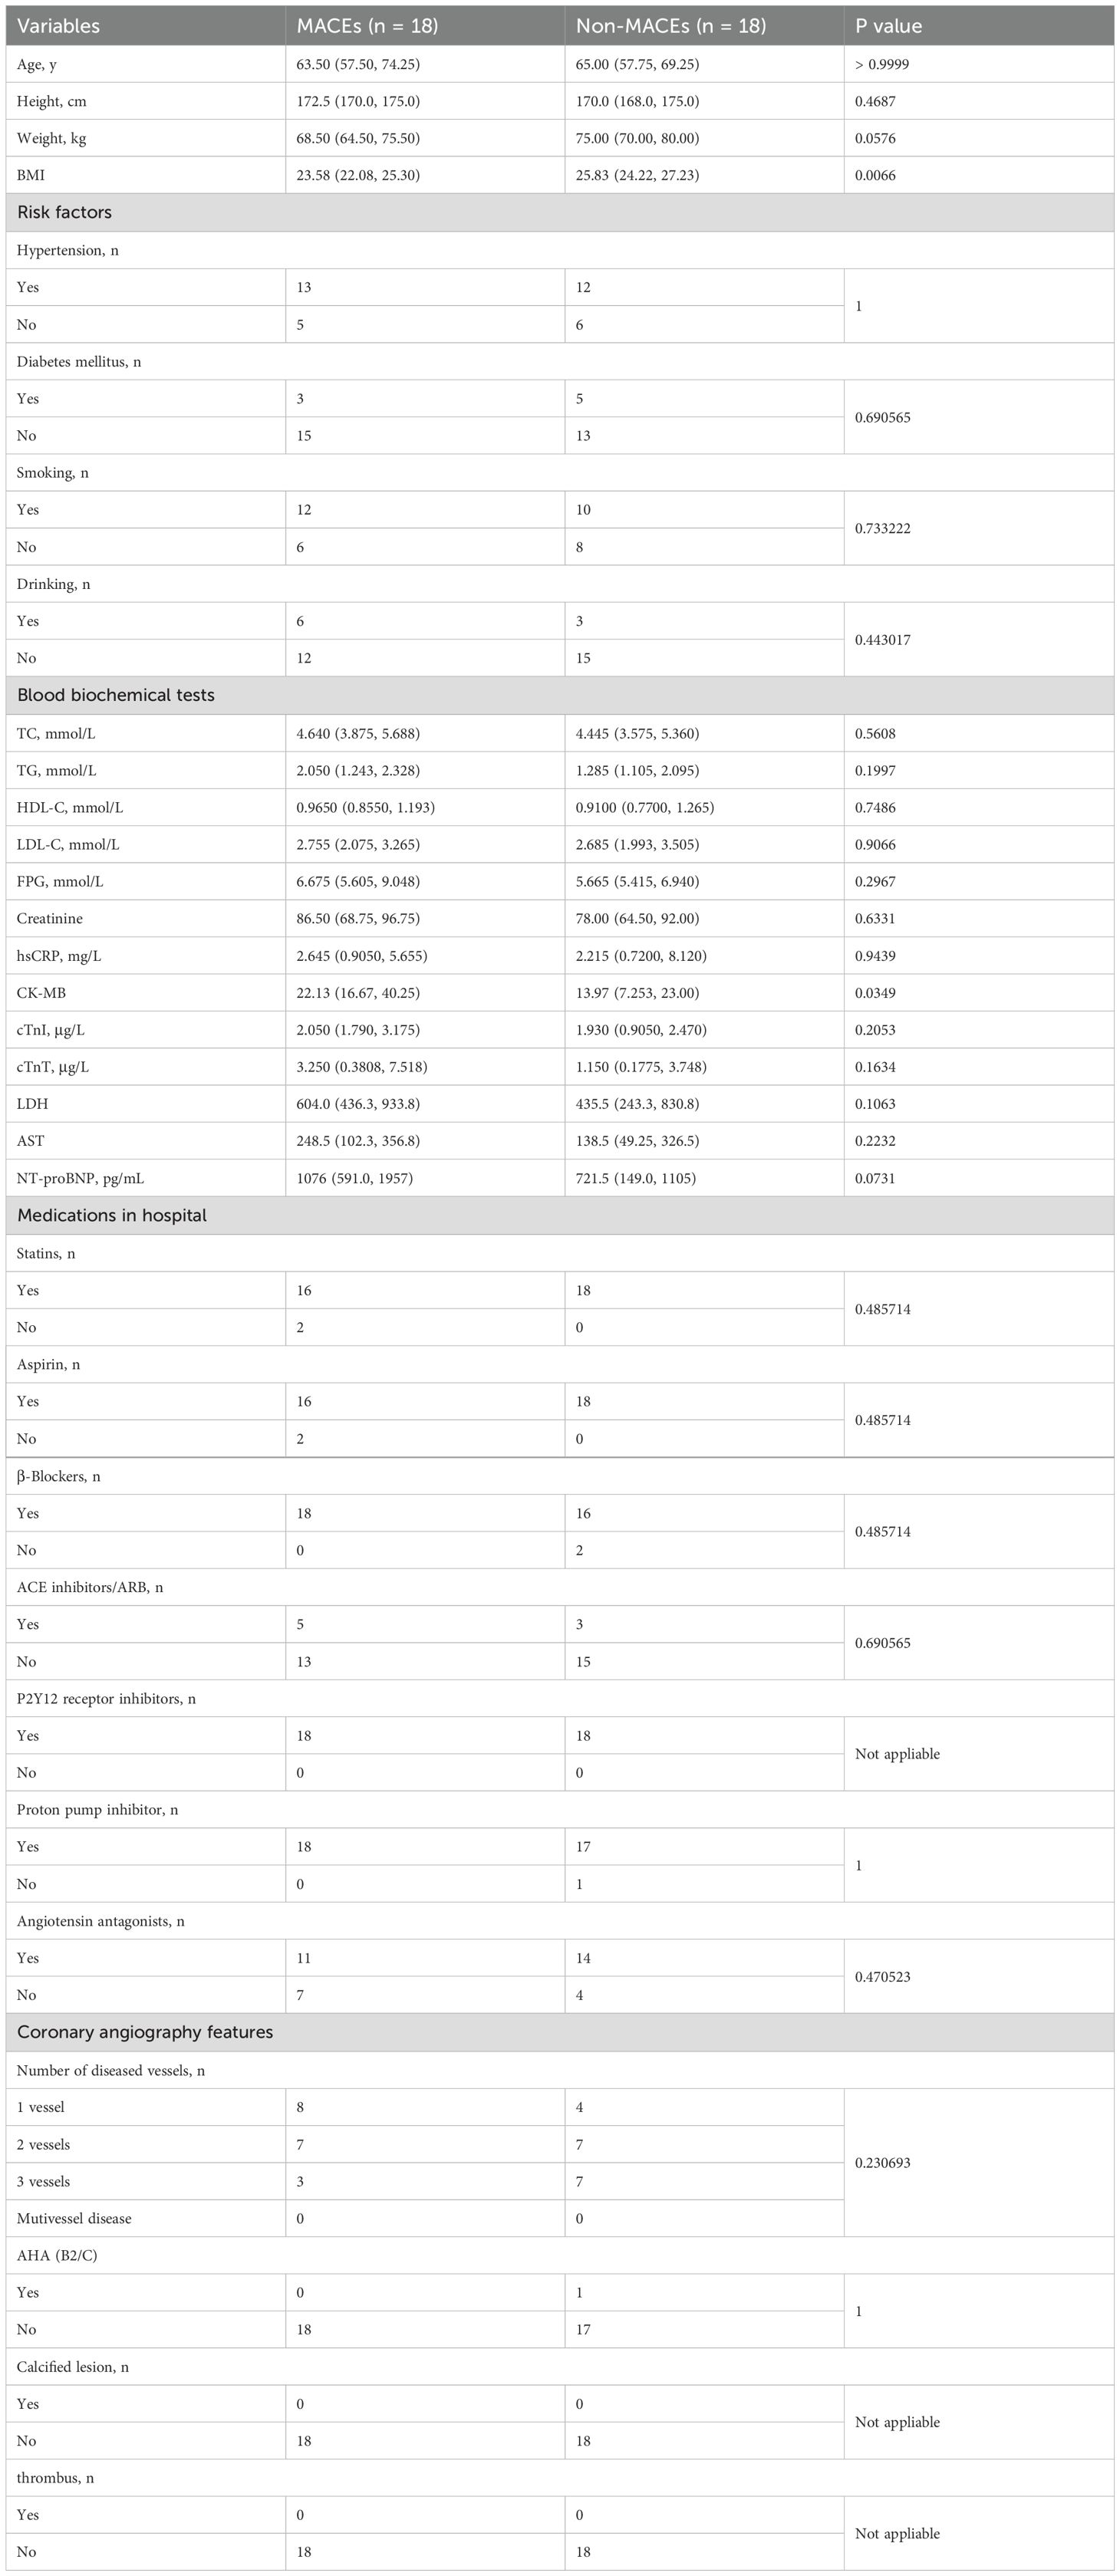
Over a median follow-up period of 13 months (range: 12–22 months), a total of 18 patients experienced MACEs, comprising 0 cardiovascular deaths, 3 non-fatal ischemic strokes, 1 recurrent myocardial infarction, 3 cases requiring either emergency or elective repeat revascularization, 11 hospital readmissions due to heart failure, and 8 readmissions for unstable angina (Figure 1). When comparing patients with STEMI who developed MACEs (MACEs group) with those who remained event-free (Non-MACEs group), the MACEs group exhibited significantly lower BMI (P=0.0066) and a markedly higher CK-MB level (P=0.0349) (Table 2). Additionally, NT-proBNP levels were noticeably higher in the MACEs group than in the Non-MACEs group (P=0.0731).
3.2 Differences in diversity, composition, and metabolic pathways of gut microbiota between the control group and the STEMI group
In the Venn diagram, a total of 15,040 OTUs were shared between the control and STEMI groups, with the STEMI group harboring a greater number of unique OTUs (27,194) compared to the control group (4,294) (Figure 2A). The alpha diversity of the stool microbiome, reflecting the number of species within each sample, varied significantly between the two groups (P = 0.0019 for the Shannon index, P = 0.0769 for the Simpson index, and P = 0.4464 for the Chao1 index) (Figures 2B-D). Regarding β-diversity, intergroup differences were more distinct than intragroup variations (R = 0.034, P = 0.202) (Figure 2E). Principal component analysis (PCoA) based on Bray-Curtis distance further revealed significant differences in gut microbiota composition between the control and STEMI groups (P = 0.034 for PC1 vs. PC2, P = 0.034 for PC1 vs. PC3, and P = 0.017 for PC2 vs. PC3) (Figures 2F-H).
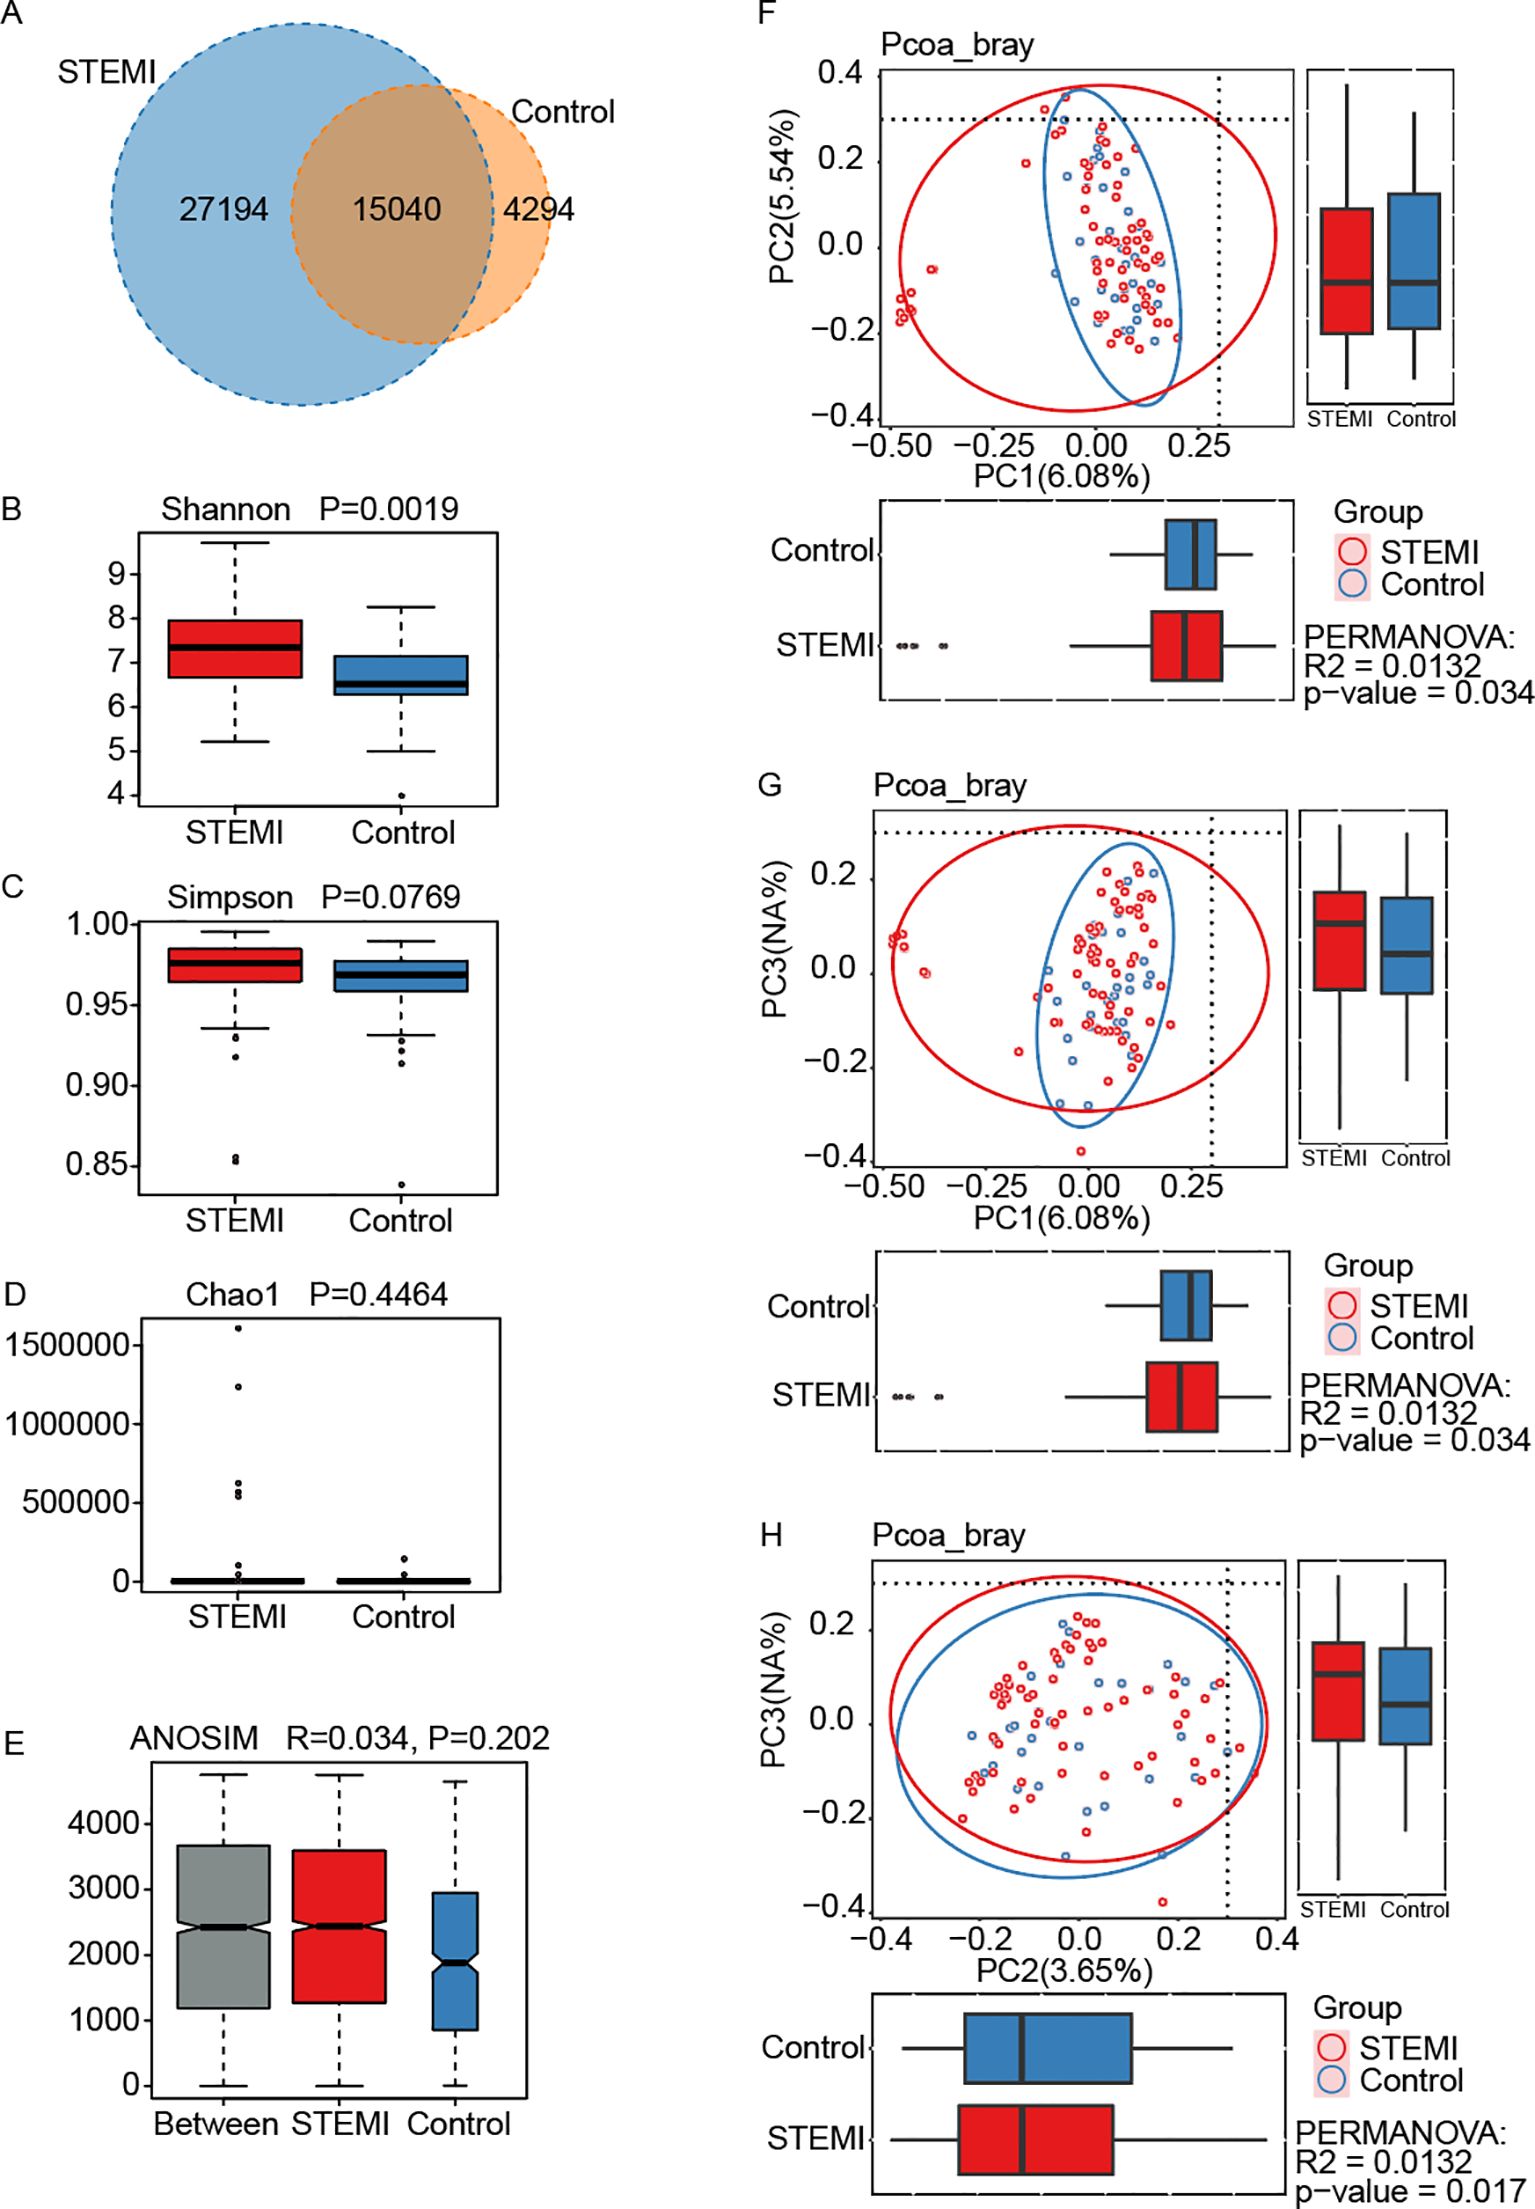
Figure 2. Gut microbiota diversity was assessed in a male population without coronary heart disease (Control, n=32) and in male patients diagnosed with ST-segment elevation myocardial infarction (STEMI, n=66). (A) A total of 15,040 OTUs were common to both groups, while 27,194 OTUs were unique to the STEMI group and 4,294 OTUs were specific to the control group. Alpha diversity, reflecting microbial richness and evenness, was evaluated using the Shannon (B), Simpson (C), and Chao1 (D) indices, with comparisons between groups performed via the Wilcoxon Rank Sum Test. The resulting P-values were 0.0019 for Shannon, 0.0769 for Simpson, and 0.4464 for Chao1. (E) Analysis of Similarity (ANOSIM) demonstrated that intergroup differences exceeded intragroup variations, indicating that the grouping was meaningful. (F-H) Beta diversity between the control and STEMI groups was assessed using Principal Component Analysis based on Bray-Curtis distance, revealing significant differences between PC1 and PC2 (p=0.034) (F), PC1 and PC3 (p=0.034) (G), as well as PC2 and PC3 (p=0.017) (H).
Given the limitations of 16S rDNA amplicon pyrosequencing, our analysis primarily focused on genus-level microbial composition. Figure 3A and Supplementary Figure 1 illustrated the distribution of gut microbiota at this taxonomic level. Both groups exhibited a predominance of Bacteroides, Prevotella, Faecalibacterium, Megamonas, Phascolarctobacterium, Bifidobacterium, Roseburia, Agathobacter, Escherichia−Shigella, and Streptococcus. However, Bacteroides, Phascolarctobacterium, Bifidobacterium, and Streptococcus were more enriched in the STEMI group, whereas Prevotella, Faecalibacterium, Megamonas, Roseburia, Agathobacter, and Escherichia−Shigella were relatively more abundant in the control group. The Wilcoxon rank sum test (LEfSe) (P < 0.05, LDA > 2) identified key genera distinguishing the two groups, with the STEMI group exhibiting a greater number of biomarker bacteria than the control group (Figures 3B, C). Specifically, Bifidobacterium, Streptococcus, Collinsella, Alistipes, Megasphaera, Odoribacter, and Lactobacillus were characteristic genera of the STEMI group, whereas Romboutsia and Agathobacter were indicative of the control group (Figure 3C). Additionally, statistical significance was confirmed for five differentially abundant genera, with P values of 0.0499, 0.012, 0.0043, 0.0035, and 0.0007 for Bifidobacterium, Megasphaera, Alistipes, Collinsella, and Streptococcus, respectively (Figure 3D).
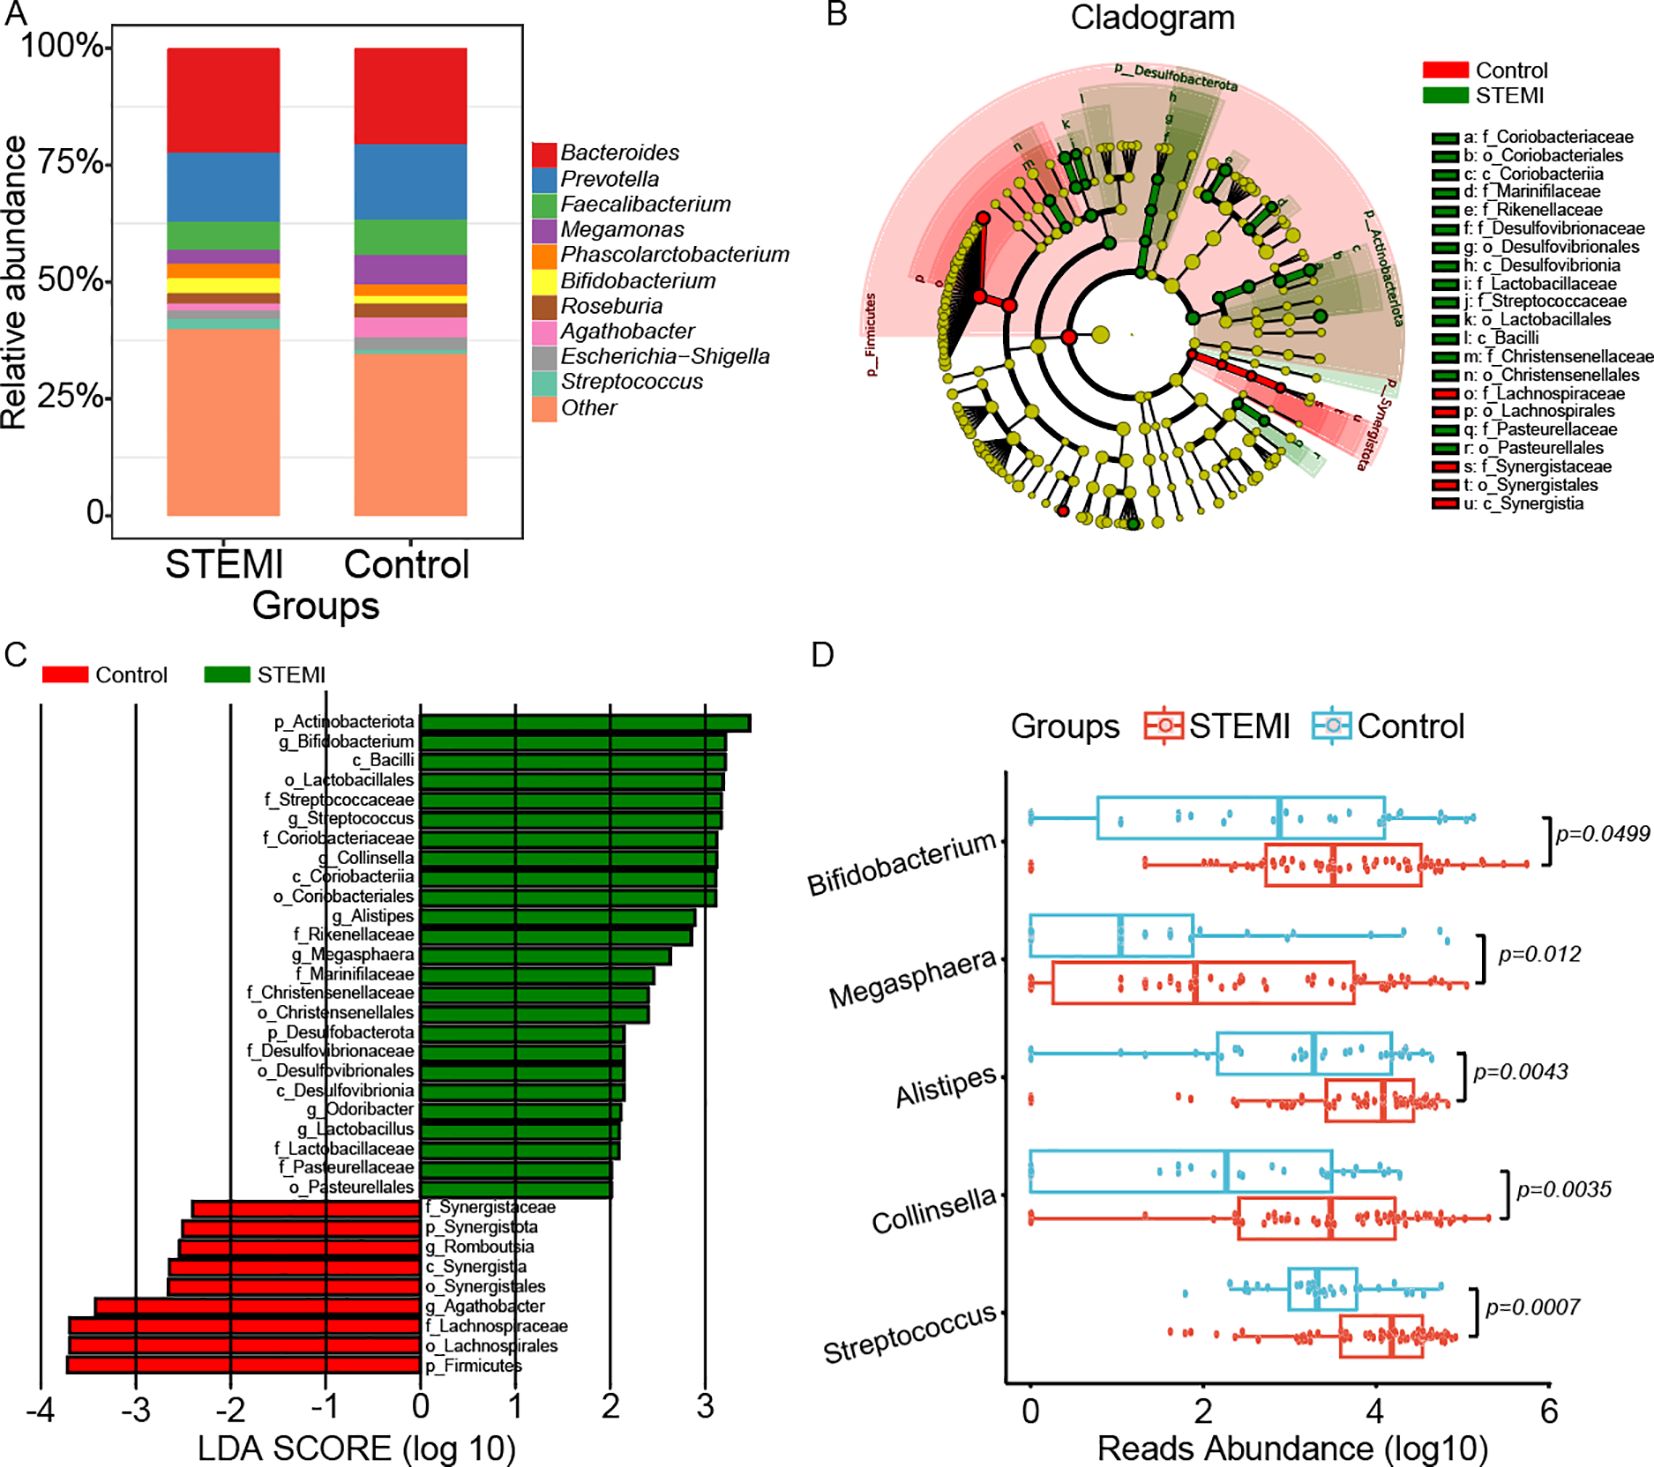
Figure 3. Comparison of gut microbiota composition and key marker genera between the control and STEMI groups. (A) Relative abundance histograms depict the distribution of bacterial genera in both groups. The ten most prevalent shared genera, represented by distinct colors, include Bacteroides, Prevotella, Faecalibacterium, Megamonas, d_Bacteria; p_Firmicutes; c_Clostridia; o_Lachnospirales; f_Lachnospiraceae; g_unidentified, Phascolarctobacterium, Bifidobacterium, Roseburia, Agathobacter, and Escherichia-Shigella, while less abundant genera were collectively classified as “other.” (B) A phylogenetic tree was constructed to visualize the hierarchical taxonomic relationships from the phylum to species level for both groups. (C) The Wilcoxon rank sum test combined with Linear Discriminant Analysis Effect Size (LEfSe) (P<0.05, LDA>2) identified distinguishing marker genera between the two groups. Romboutsia and Agathobacter were characteristic of the control group, whereas Bifidobacterium, Streptococcus, Collinsella, Alistipes, Megasphaera, Odoribacter, and Lactobacillus were significantly enriched in the STEMI group. (D) Univariate analysis revealed significant differences in the relative abundance of several genera between the two groups, including Bifidobacterium (p=0.0499), Megasphaera (p=0.012), Alistipes (p=0.0043), Collinsella (p=0.0035), and Streptococcus (p=0.0007).
To further explore functional differences between the two groups, we performed Picrust2 analysis, which predicted variations in KEGG, METACYC, CAZY, and GMM modules. The top 10 most significantly altered pathways were presented in Supplementary Figures 2A-D. Notably, several KEGG pathways associated with metabolic regulation were disrupted in the STEMI group, including the insulin signaling pathway (P = 0.0006), thiamine metabolism (P = 0.0017), terpenoid backbone biosynthesis (P = 0.0039), and porphyrin and chlorophyll metabolism (P = 0.0056) (Supplementary Figure 2A). Specifically, all these metabolic pathways were computational and should be interpreted as hypothesis-generating rather than confirmatory.
3.3 Differences in diversity, composition, and metabolic pathways of gut microbiota between the Non-MACEs group and the MACEs group
In the Venn diagram, 10,163 OTUs were shared between the Non-MACEs and MACEs groups, with the MACEs group possessing a greater number of unique OTUs (10,015) in comparison to the Non-MACEs group (9,850) (Figure 4A). The alpha diversity of the gut microbiome, reflecting the species richness within each sample, showed no statistically significant differences between the two groups (P = 0.0549 for the Shannon index, P = 0.1182 for the Simpson index, and P = 0.7193 for the Chao1 index) (Figures 4B-D). In terms of β-diversity, intergroup differences were more pronounced than intragroup variations (R = 0.139, P = 0.004) (Figure 4E). However, Principal Component Analysis (PCoA) based on Bray-Curtis distance did not reveal significant compositional differences in gut microbiota between the Non-MACEs and MACEs groups (P = 0.312 for PC1 vs. PC2, P = 0.300 for PC1 vs. PC3, and P = 0.312 for PC2 vs. PC3) (Figures 4F-H).
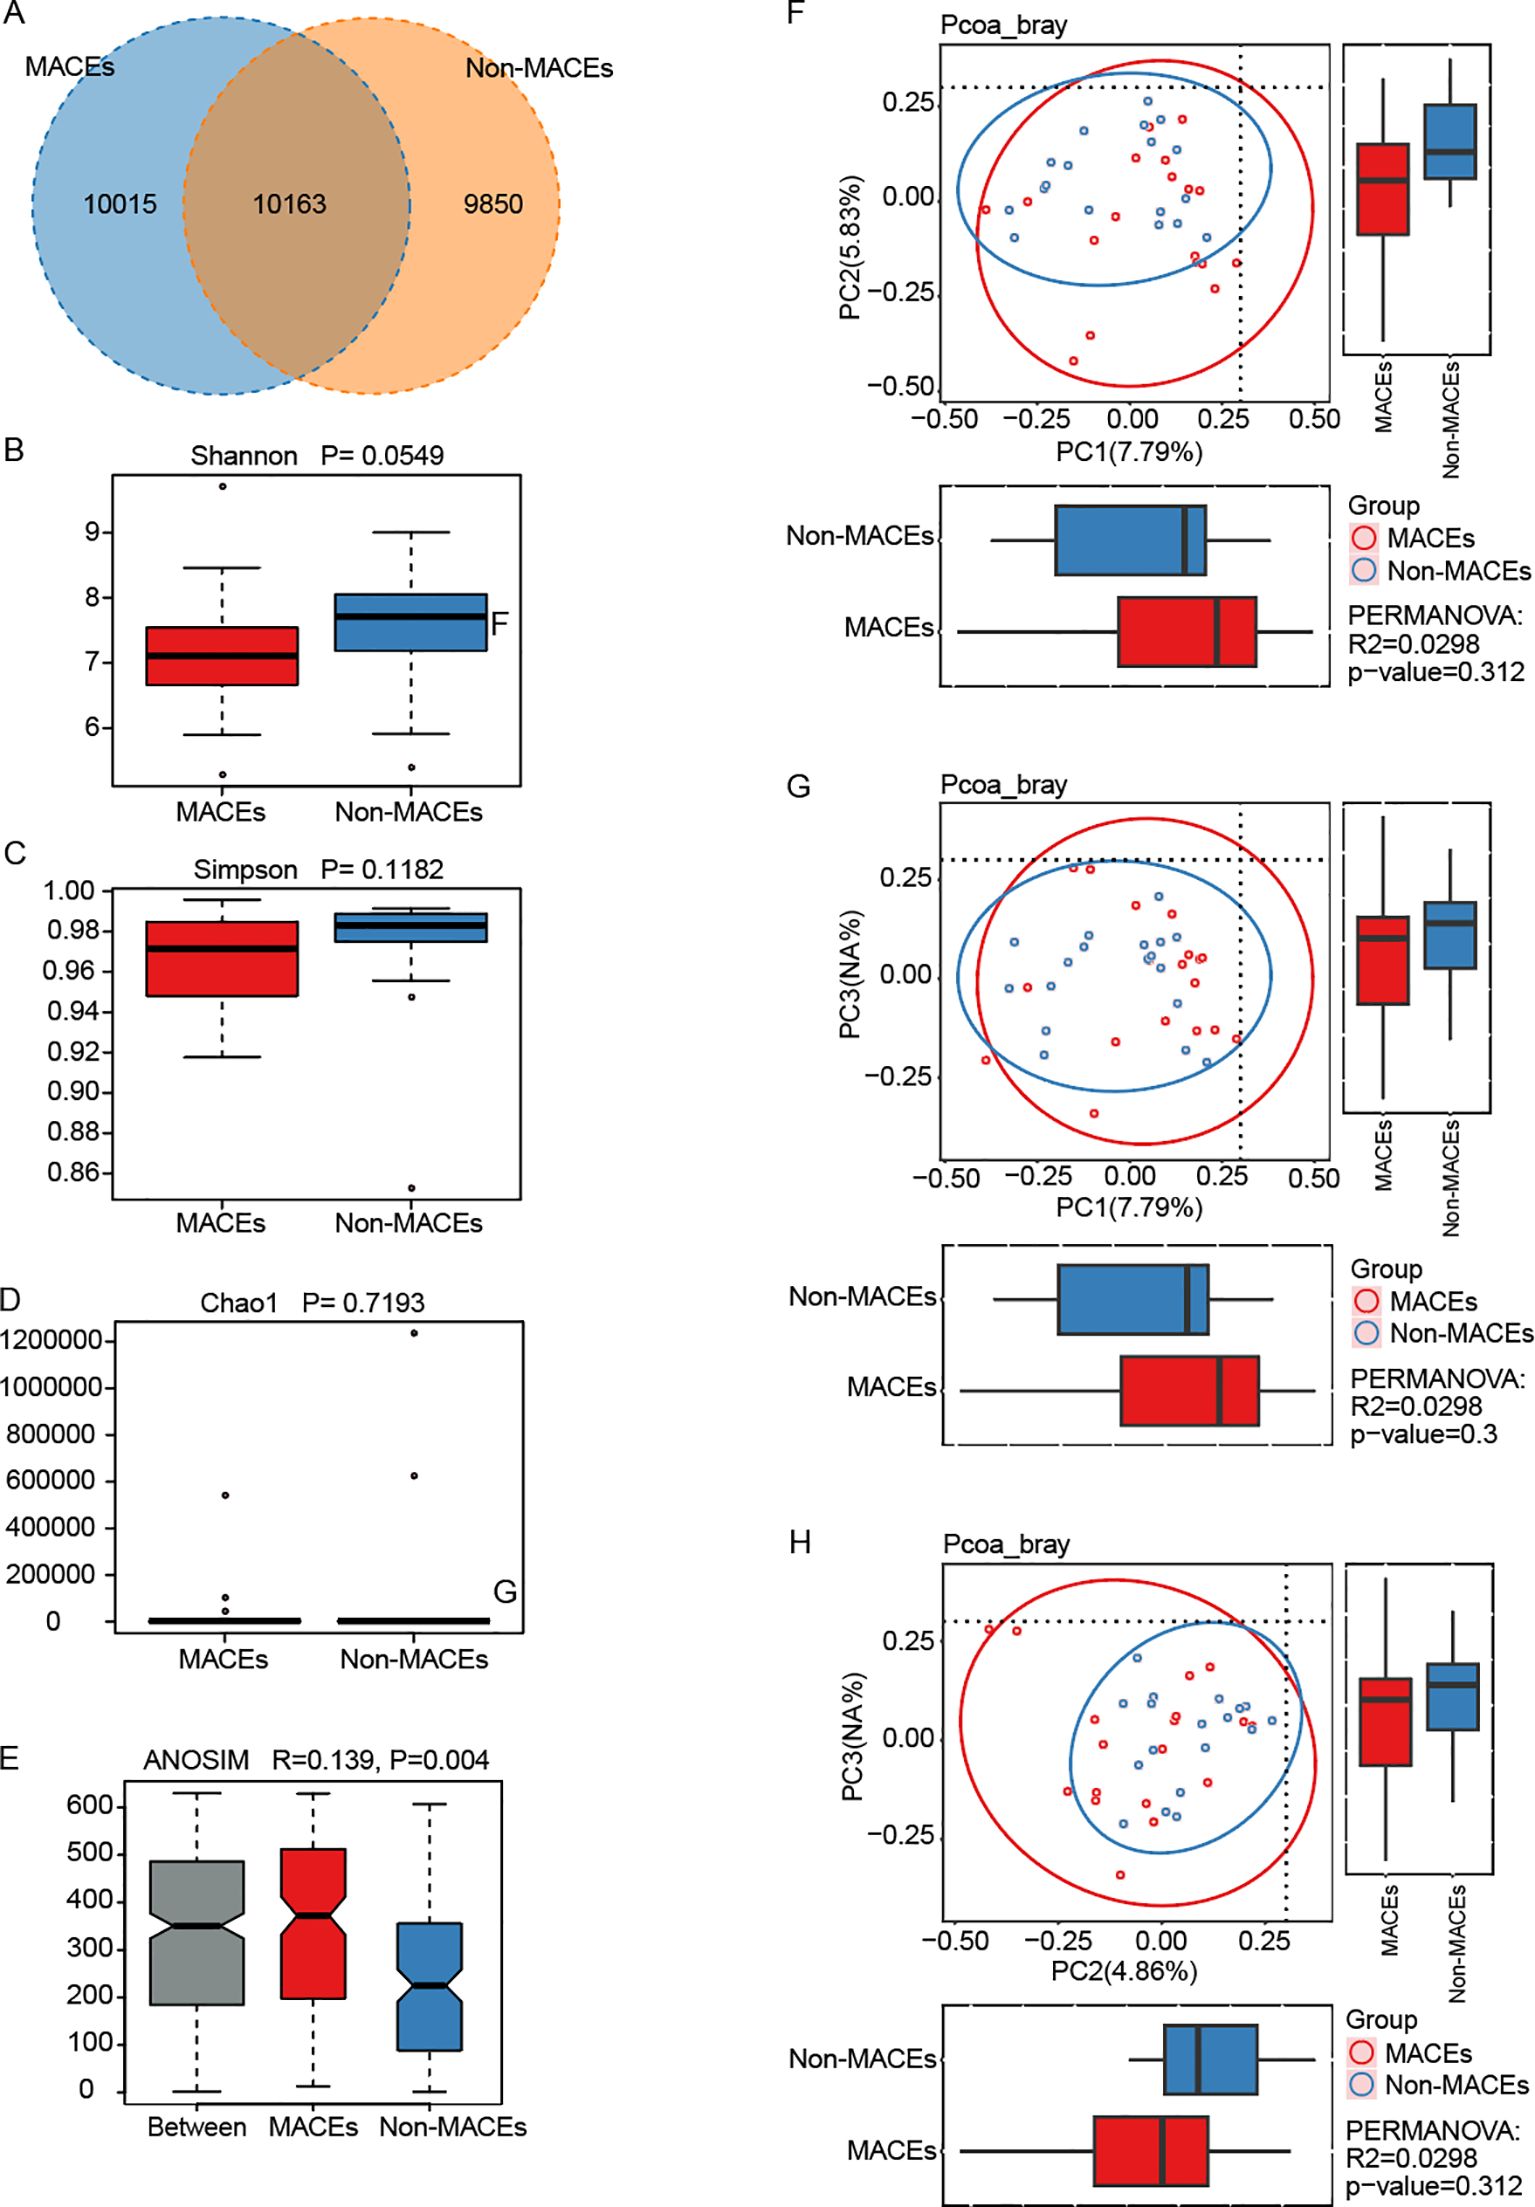
Figure 4. Gut microbiota diversity in patients with STEMI with and without major adverse cardiovascular events (MACEs). The study compared patients who experienced MACEs (n=18) with age-matched STEMI patients who did not (Non-MACEs, n=18). (A) A total of 10,163 operational taxonomic units (OTUs) were shared between the two groups, with 10,015 OTUs uniquely identified in the MACEs group and 9,850 in the Non-MACEs group. (B-D) Alpha diversity, reflecting microbial richness and evenness, was assessed using the Shannon, Simpson, and Chao1 indices, calculated via the Wilcoxon Rank Sum Test. The corresponding P-values were 0.0549 for Shannon, 0.1182 for Simpson, and 0.7193 for Chao1. (E) Analysis of Similarity (ANOSIM) confirmed that intergroup differences exceeded intragroup variations, supporting the validity of the group classification. (F-H) Beta diversity was evaluated through Principal Component Analysis (PCA) based on Bray-Curtis distance. However, no statistically significant differences were observed in comparisons between PC1 and PC2 (p=0.312) (F), PC1 and PC3 (p=0.300) (G), or PC2 and PC3 (p=0.312) (H).
Due to the inherent limitations of 16S rDNA amplicon pyrosequencing, our analysis predominantly focused on microbial composition at the genus level. Figure 5A and Supplementary Figure 3 illustrated the taxonomic distribution of gut microbiota at this resolution. Both the Non-MACEs and MACEs groups were characterized by the presence of Bacteroides, Prevotella, Faecalibacterium, Bifidobacterium, Megamonas, Streptococcus, Collinsella, Roseburia, Phascolarctobacterium, and [Eubacterium]_coprostanoligenes_group. However, Bacteroides, Megamonas, Collinsella, and Phascolarctobacterium were more prevalent in the MACEs group, whereas Prevotella, Faecalibacterium, Bifidobacterium, Streptococcus, Roseburia, and [Eubacterium]_coprostanoligenes_group were found in higher abundance in the Non-MACEs group. The Wilcoxon rank sum test (LEfSe) (P < 0.05, LDA > 2) identified distinct marker genera differentiating the two groups, with the Non-MACEs group exhibiting a greater number of characteristic bacterial taxa compared to the MACEs group (Figures 5B, C). Specifically, Coprococcus, Christensenellaceae_R_7_group, UCG_002, Eubacterium_coprostanoligenes_group, UCG_005, Dorea, Family_XIII_UCG_001, Ruminococcus_gauvreauii_group, NK4A214_group, Family_XIII_AD3011_group, Marvinbryantia, Fusicatenibacter, Senegalimassilia, Negativibacillus, Olsenella, UCG_010, and CAG_56 were signature genera for the Non-MACEs group, while Hungatella, Lachnoclostridium, Ruminococcus_gnavus_group, and Bacteroides were representative of the MACEs group (Figure 5C). Moreover, statistical analysis confirmed significant differences in 10 genera, with P values of 0.0486, 0.0435, 0.0358, 0.0339, 0.0236, 0.0232, 0.0224, 0.0075, 0.005, and 0.002 for [Ruminococcus]_gnavus_group, Bacteroides, Christensenellaceae_R-7_group, Coprococcus, [Eubacterium]_coprostanoligenes_group, UCG-005, Lachnoclostridium, Dorea, NK4A214_group, and UCG-002, respectively (Figure 5D).
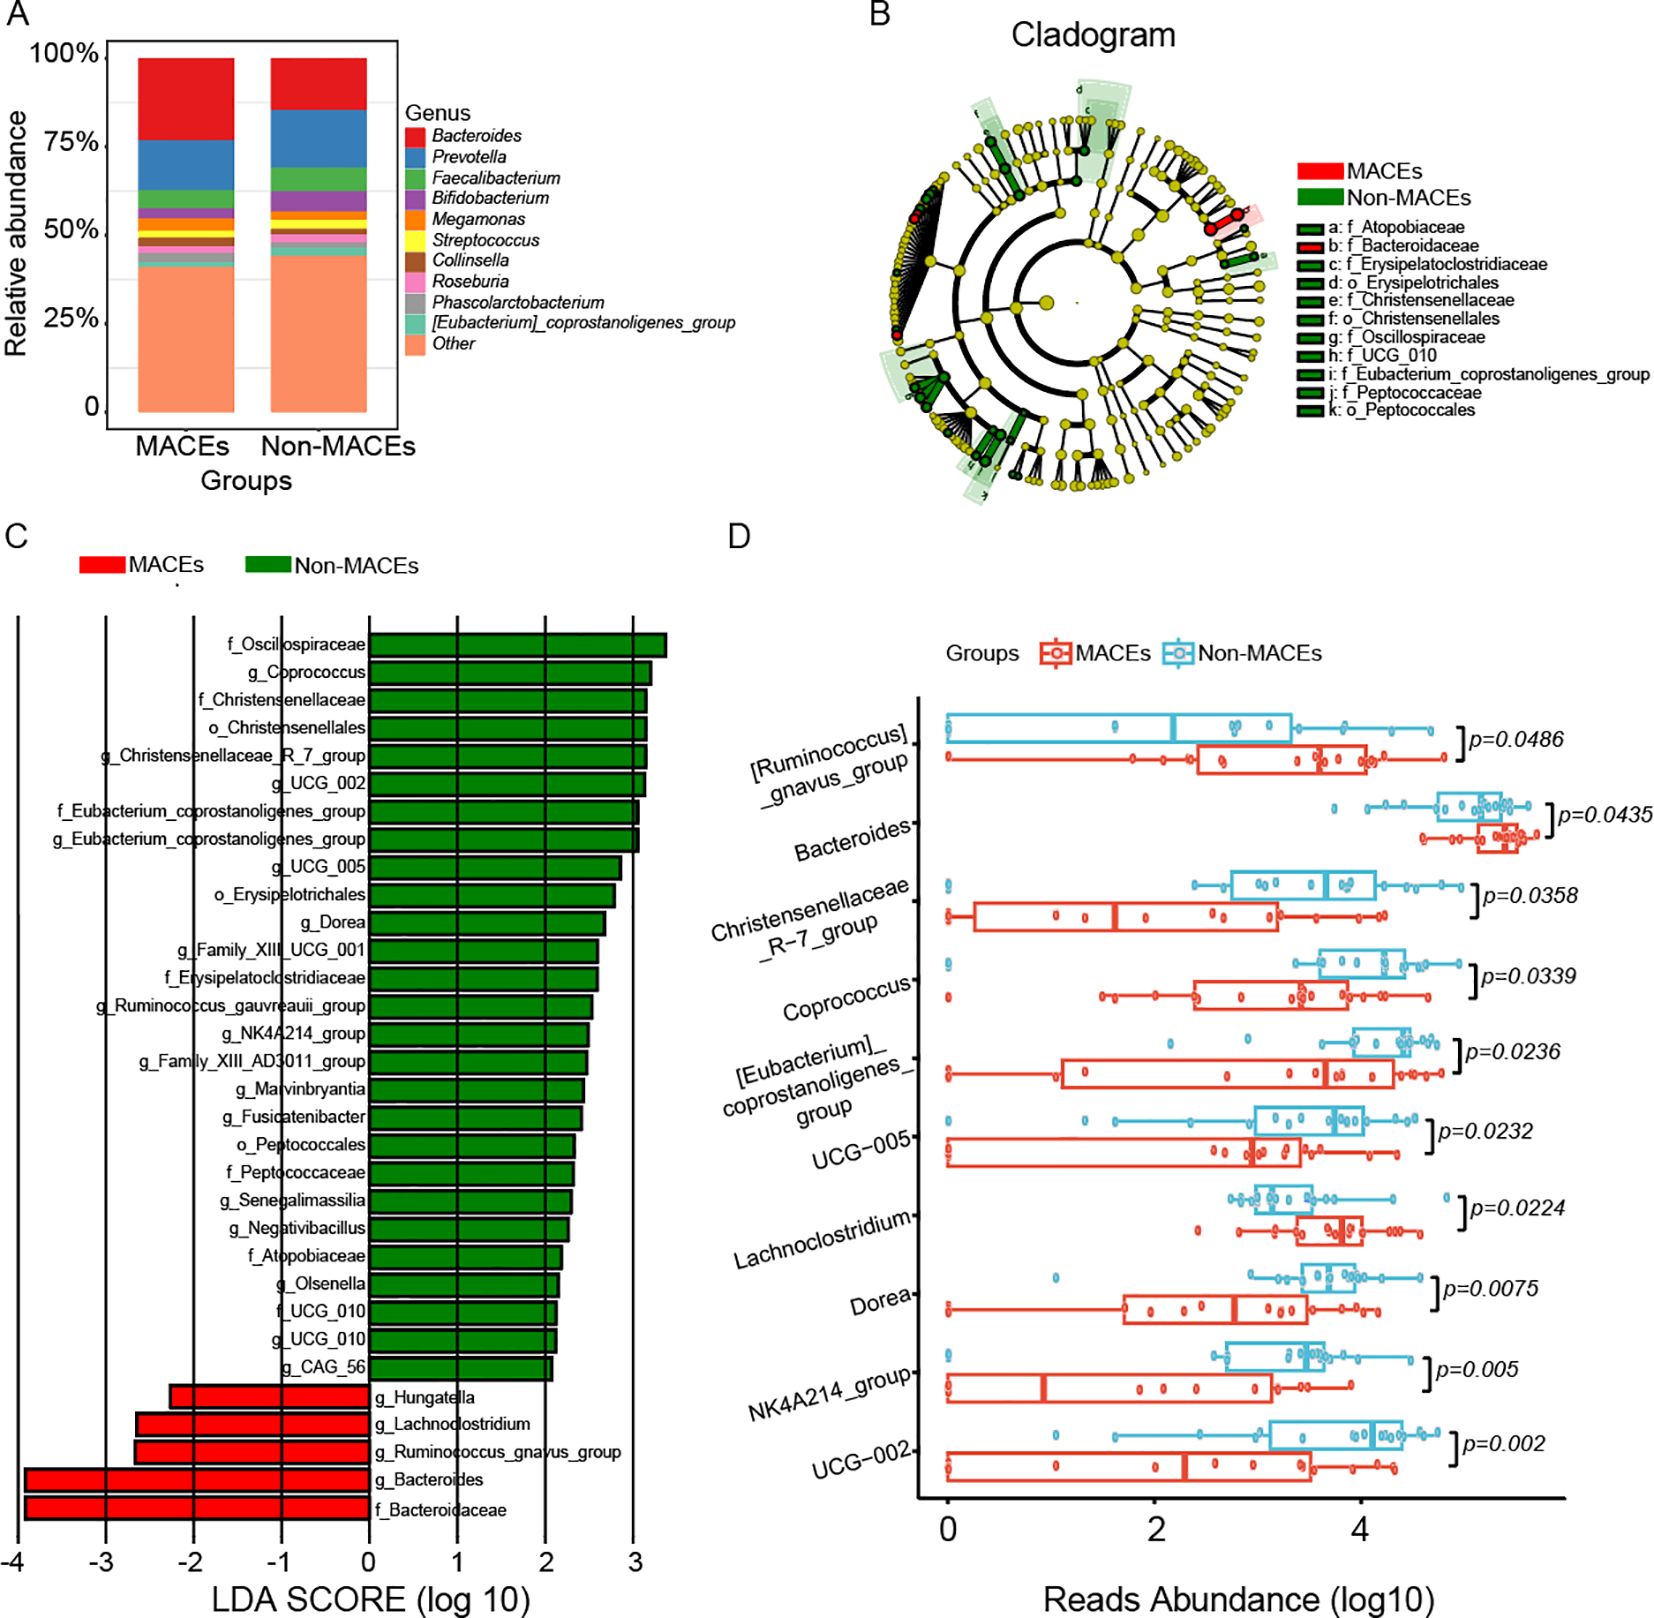
Figure 5. Composition and key marker genera of gut microbiota in the Non-MACEs and MACEs groups. (A) The relative abundance histograms illustrated the distribution of all detected genera across both groups. The 10 most prevalent shared genera, depicted in distinct colors, include Bacteroides, Prevotella, Faecalibacterium, Bifidobacterium, Megamonas, Streptococcus, Collinsella, Roseburia, Phascolarctobacterium, and [Eubacterium]_coprostanoligenes_group, whereas genera with lower relative abundance are categorized as ‘other.’ (B) The phylogenetic tree visualizes the hierarchical classification of marker taxa from the phylum to species level within the two groups. (C) The Wilcoxon rank sum test (LEfSe) (P<0.05, LDA>2) identified key marker genera distinguishing the Non-MACEs and MACEs groups. In the Non-MACEs group, significant marker genera included Coprococcus, Christensenellaceae_R_7_group, UCG_002, Eubacterium_coprostanoligenes_group, UCG_005, Dorea, Family_XIII_UCG_001, Ruminococcus_gauvreauii_group, NK4A214_group, Family_XIII_AD3011_group, Marvinbryantia, Fusicatenibacter, Senegalimassilia, Negativibacillus, Olsenella, UCG_010, and CAG_56. In contrast, Hungatella, Lachnoclostridium, Ruminococcus_gnavus_group, and Bacteroides were identified as markers for the MACEs group. (D) The Univariate Test revealed significant differences in several genera between the two groups, including [Ruminococcus]_gnavus_group (p=0.0486), Bacteroides (p=0.0435), Christensenellaceae_R-7_group (p=0.0358), Coprococcus (p=0.0339), [Eubacterium]_coprostanoligenes_group (p=0.0236), UCG-005 (p=0.0232), Lachnoclostridium (p=0.0224), Dorea (p=0.0075), NK4A214_group (p=0.005), and UCG-002 (p=0.002).
To further investigate functional discrepancies between the groups, Picrust2 analysis was conducted to predict variations in KEGG, CAZY, METACYC, and GMM functional modules, with 5, 5, 9, and 5 significantly different pathways identified, respectively, as presented in Supplementary Figure 4A-D. Notably, metabolic pathways such as chloroalkane and chloroalkene degradation (P = 0.0499), carotenoid biosynthesis (P = 0.0435), and steroid biosynthesis (P = 0.0046) were implicated in organic compound metabolism, while the mRNA surveillance pathway (P = 0.0142) was associated with signal transduction and regulatory processes (Supplementary Figure 4A). It is important to note that all of these metabolic pathways were inferred through computational analysis and should be regarded as exploratory hypotheses rather than definitive findings.
3.4 Blood lipid profile in the non-MACEs group and the MACEs group
Table 2 presented the blood lipid profiles of patients with STEMI, stratified by the presence or absence of MACEs. No statistically significant differences were observed in TC, TG, HDL-C, and LDL-C levels between the MACEs and Non-MACEs groups. Furthermore, none of the LDL-C subfractions exhibited significant variation between the two groups (Figure 6).
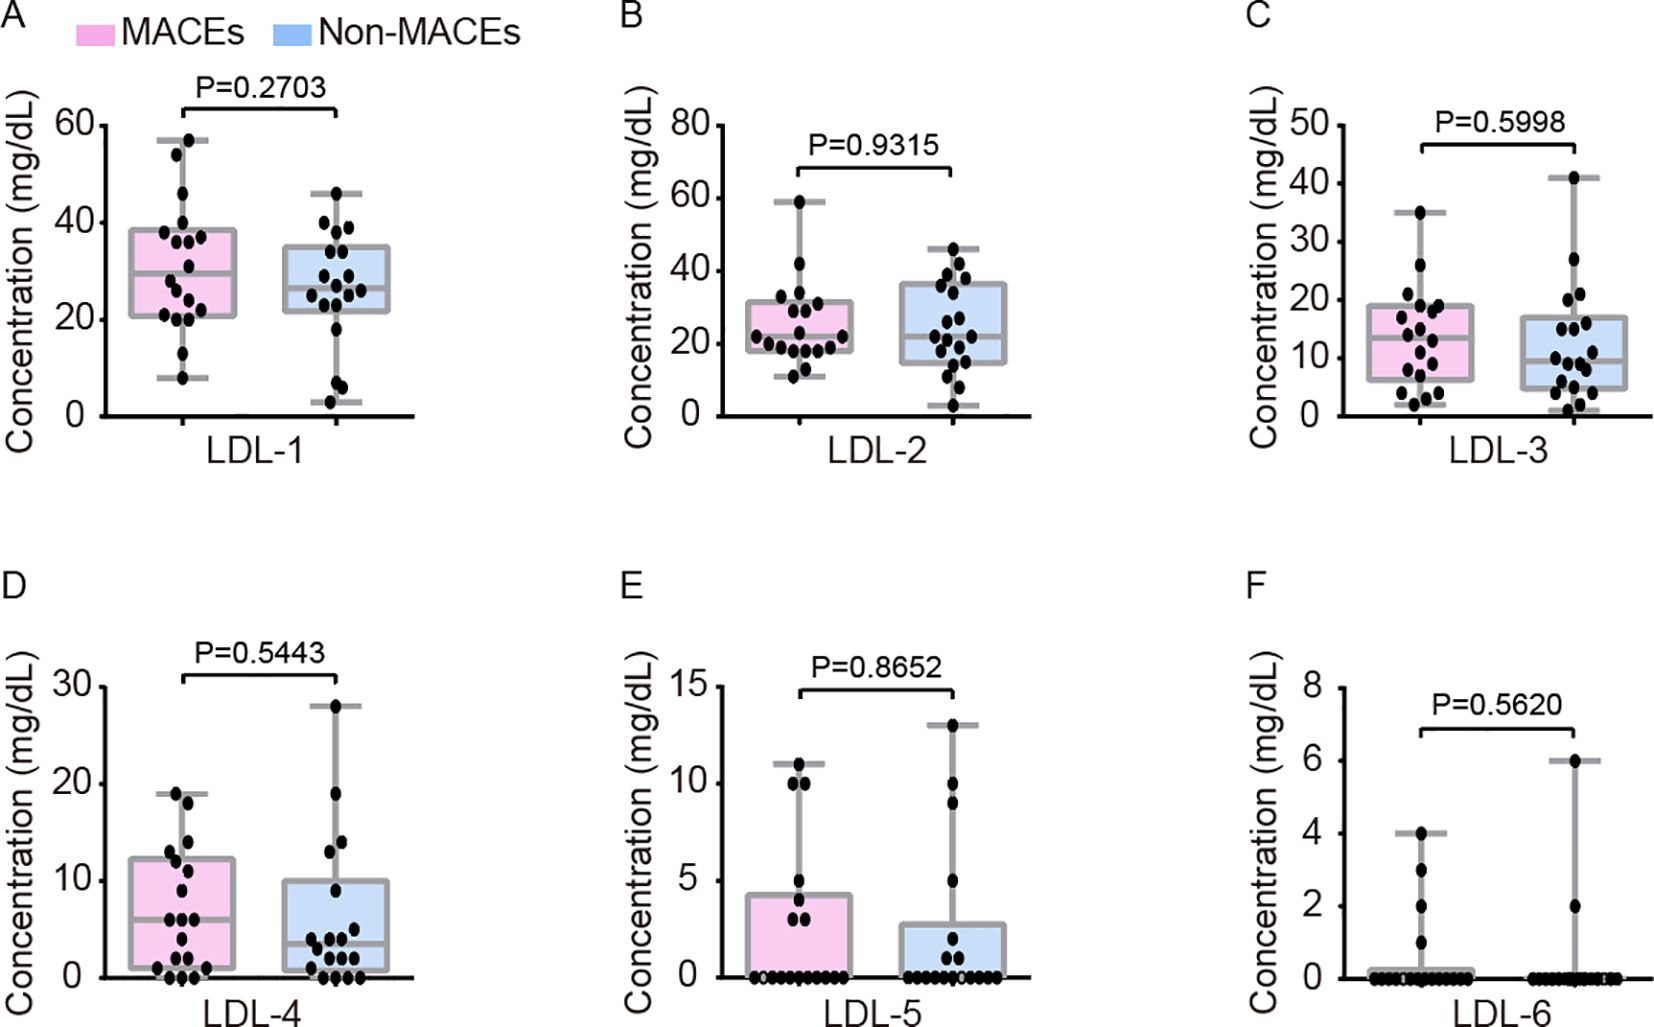
Figure 6. Comparative assessment of LDL-C subfraction levels between the Non-MACEs and MACEs groups, covering LDLC-1 (A), LDLC-2 (B), LDLC-3 (C), LDLC-4 (D), LDLC-5 (E), and LDLC-6 (F). The analysis revealed no statistically significant differences in LDL-C subfractions between the two groups. LDL-C, low-density lipoprotein cholesterol.
3.5 Correlations analysis among the top 10 marker genera and six LDL-C subfractions in patients with STEMI with MACEs
As illustrated in Figure 7, both significant positive and negative correlations were detected among the top 10 marker genera. Notable correlations included a negative association between Bacteroides and UCG-002 (ρ=-0.4816, P<0.05), as well as a positive correlation between Bacteroides and Lachnoclostridium (ρ=0.5294, P<0.05). Additionally, [Eubacterium]_coprostanoligenes_group demonstrated a positive correlation with Coprococcus (ρ=0.5384, P<0.05), UCG-002 (ρ=0.5921, P<0.01), Christensenellaceae_R-7_group (ρ=0.5776, P<0.05), and UCG-005 (ρ=0.5806, P<0.05), while exhibiting a negative association with Lachnoclostridium (ρ=-0.6463, P<0.01) and [Ruminococcus]_gnavus_group (ρ=-0.5280, P<0.05). Furthermore, Coprococcus displayed a positive correlation with UCG-002 (ρ=0.5794, P<0.05), whereas UCG-002 showed significant positive associations with Christensenellaceae_R-7_group (ρ=0.7595, P<0.001), UCG-005 (ρ=0.6173, P<0.01), Dorea (ρ=0.5012, P<0.01), and NK4A214_group (ρ=0.5554, P<0.05), but was negatively correlated with Lachnoclostridium (ρ=-0.9111, P<0.001) and [Ruminococcus]_gnavus_group (ρ=-0.5114, P<0.05). Similarly, Christensenellaceae_R-7_group exhibited a negative correlation with Lachnoclostridium (ρ=-0.6914, P<0.01) and a positive correlation with UCG-005 (ρ=0.5311, P<0.05). Additional significant associations included a positive correlation between Lachnoclostridium and [Ruminococcus]_gnavus_group (ρ=0.6388, P<0.01) and a negative correlation with UCG-005 (ρ=-0.6727, P<0.01), while [Ruminococcus]_gnavus_group also displayed a negative correlation with UCG-005 (ρ=-0.6296, P<0.01). Moreover, we further examined the relationship between gut microbiota and LDL-C subfractions. Interestingly, significant negative correlations were identified between Coprococcus and LDLC-4 (ρ=-0.5488, P<0.05), LDLC-5 (ρ=-0.6418, P<0.01), and LDLC-6 (ρ=-0.4988, P<0.05). Similarly, UCG-002 (ρ=-0.4948, P<0.05) and Christensenellaceae_R-7_group (ρ=-0.5032, P<0.05) were negatively associated with LDLC-4. Notably, no significant positive correlations were observed (Figure 7).
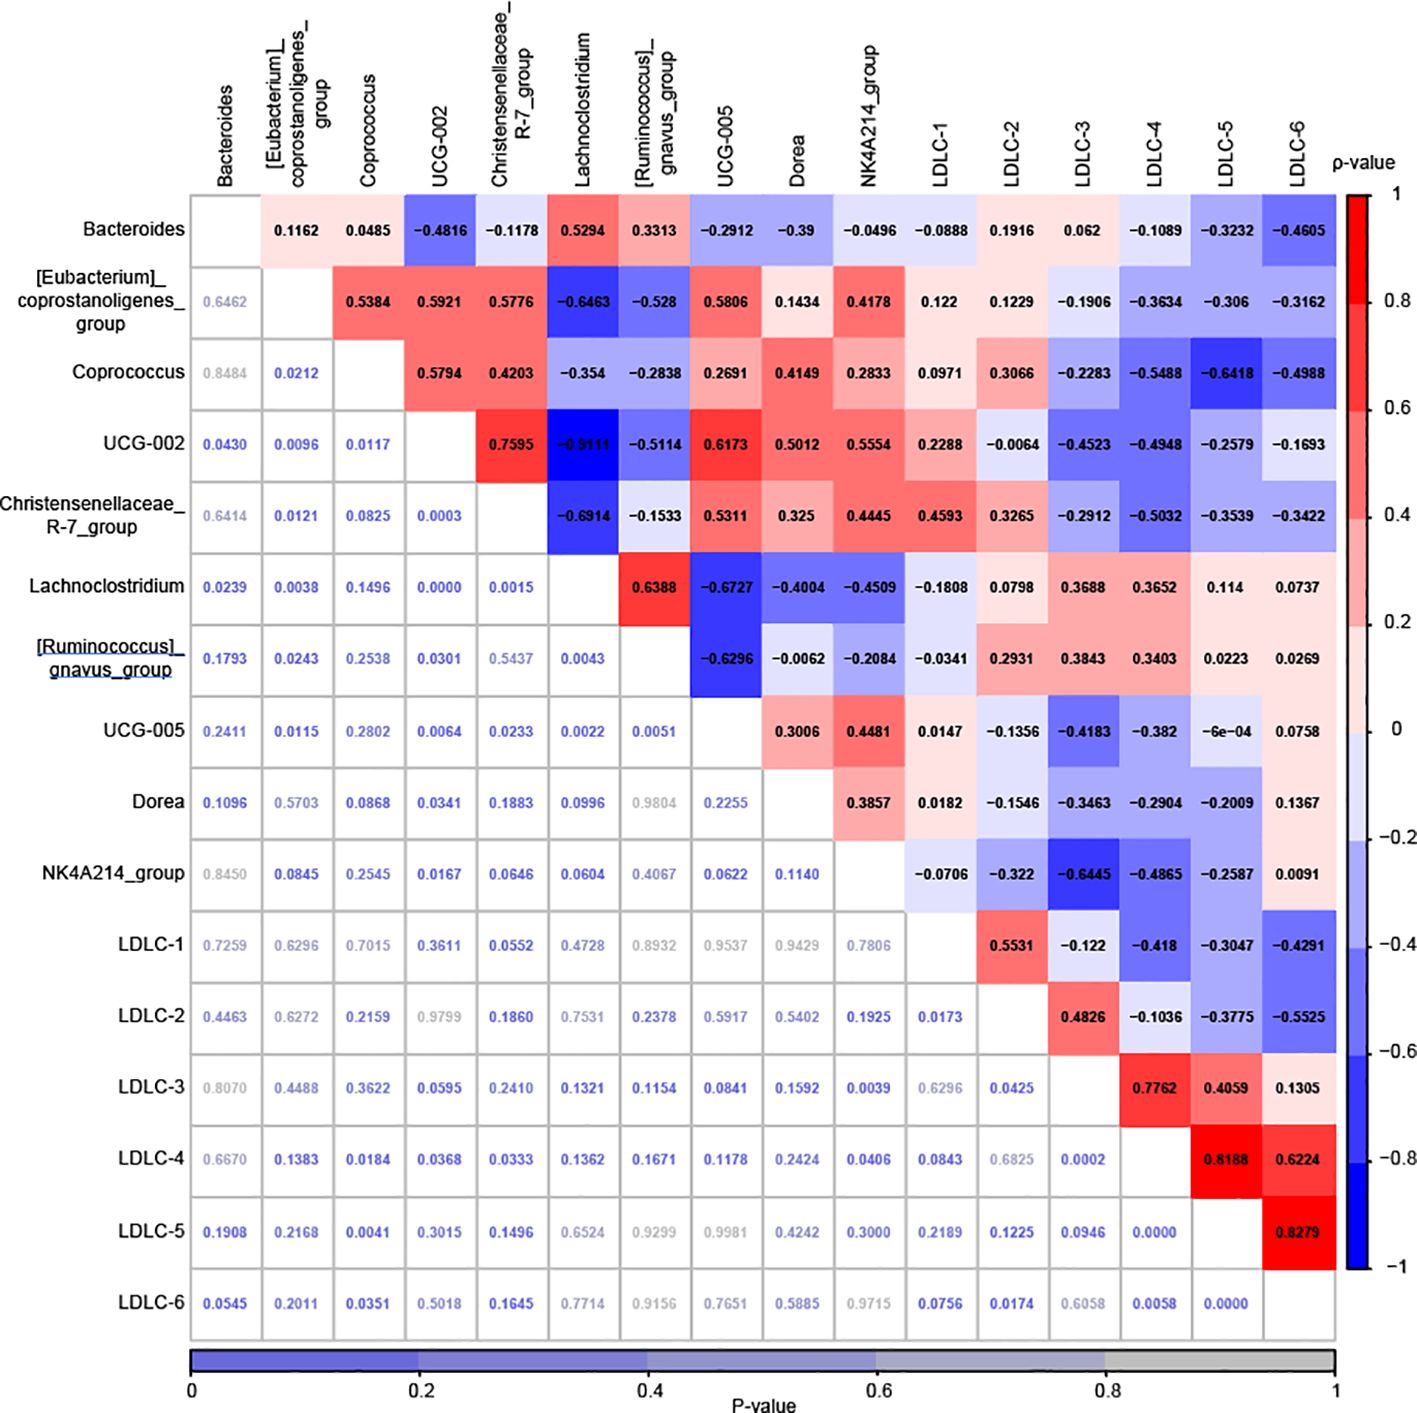
Figure 7. Correlation analysis was conducted to examine the relationship between the relative abundances of 10 marker genera and the plasma levels of six LDL-C subfractions in the MACEs group, using Spearman’s Rank Correlation. The correlation coefficients are displayed in various colors, with the corresponding scale shown on the right. The P-values, which are not highlighted, are listed at the bottom along with their scale.
3.6 Correlations analysis among the top 10 marker genera and six LDL-C subfractions in patients with STEMI without MACEs
As shown in Figure 8, both significantly positive and negative correlations were observed among the top 10 marker genera, including between Bacteroides and [Ruminococcus]_gnavus_group (ρ=0.6666, P<0.01), between [Eubacterium]_coprostanoligenes_group and UCG-002 (ρ=0.6987, P<0.01), between [Eubacterium]_coprostanoligenes_group and Christensenellaceae_R-7_group (ρ=0.5533, P<0.05), between [Eubacterium]_coprostanoligenes_group and UCG-005 (ρ=0.5253, P<0.05), between [Eubacterium]_coprostanoligenes_group and NK4A214_group (ρ=0.8014, P<0.001), between Coprococcus and [Ruminococcus]_gnavus_group (ρ=-0.6936, P<0.01), between UCG-002 and Christensenellaceae_R-7_group (ρ=0.8449, P<0.001), between UCG-002 and [Ruminococcus]_gnavus_group (ρ=-0.4965, P<0.05), between UCG-002 and UCG-005 (ρ=0.7977, P<0.001), between UCG-002 and NK4A214_group (ρ=0.7353, P<0.001), between Christensenellaceae_R-7_group and UCG-005 (ρ=0.940, P<0.001), between Christensenellaceae_R-7_group and NK4A214_group (ρ=0.5668, P<0.05), between [Ruminococcus]_gnavus_group and NK4A214_group (ρ=-0.5146, P<0.05), and between UCG-005 and NK4A214_group (ρ=0.5512, P<0.05). However, we did not observe any significant correlations between gut microbiota and LDL-C subfractions, which was inconsistent with the MACEs group (Figure 8).
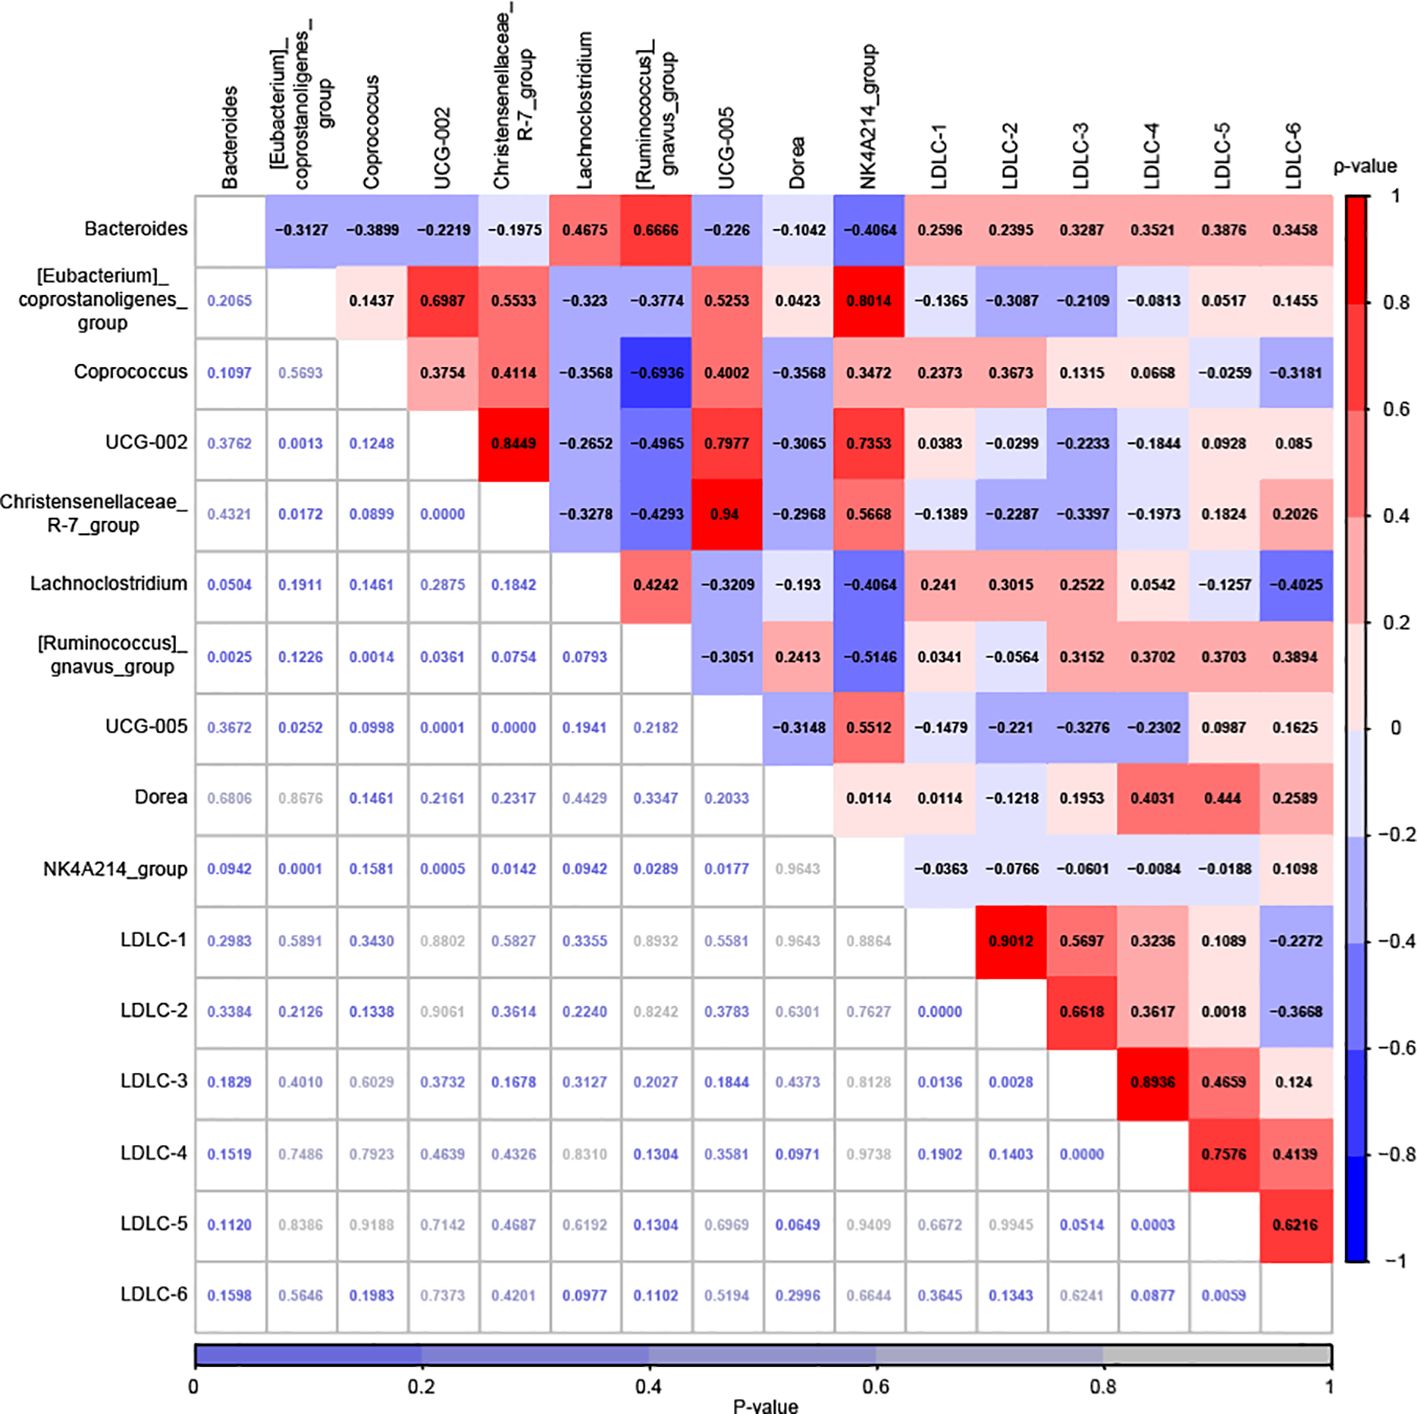
Figure 8. Correlation analysis among the relative abundances of 10 marker genera and the plasma levels of 6 LDL-C subfraction levels for the Non-MACEs groups, which was performed by Spearman’s Rank Correlation Analysis. The correlation coefficients are highlighted in various colors, with the corresponding scale shown on the right. The P-values, which are not highlighted, are listed at the bottom along with their scale.
3.7 Predictive value of the top 10 marker genera and six LDL-C subfractions
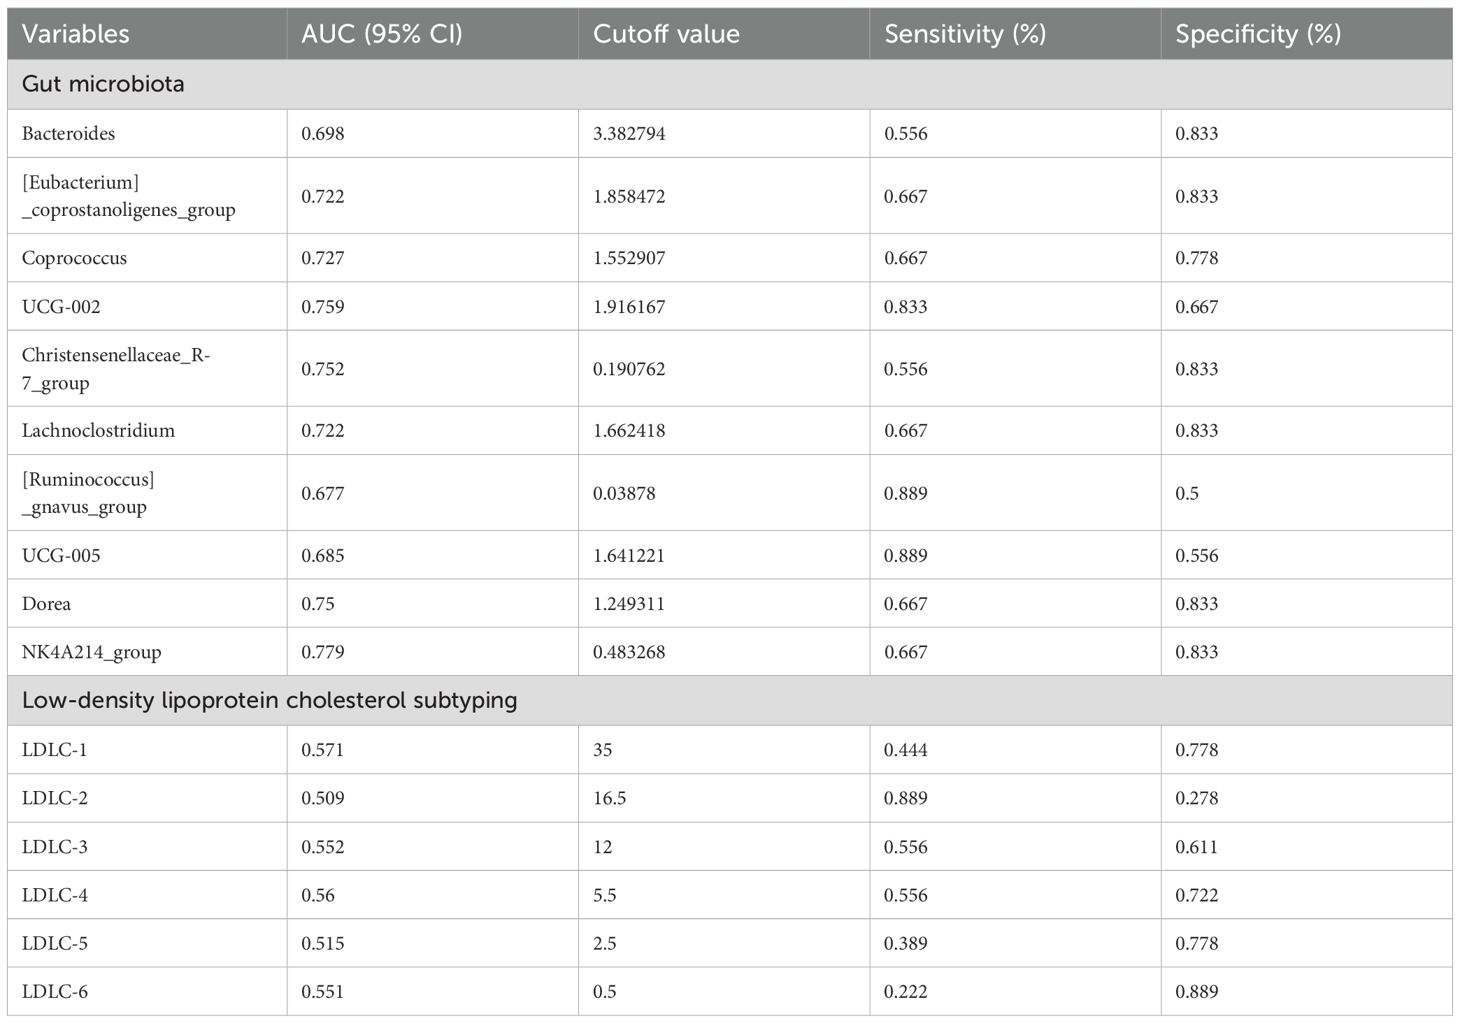
The ROC curve analysis demonstrated the predictive potential of various gut microbiota genera, with AUC values as follows: Bacteroides (AUC = 0.698, 95% CI: 0.524-0.871), [Eubacterium]_coprostanoligenes_group (AUC = 0.722, 95% CI: 0.548-0.897), Coprococcus (AUC = 0.727, 95% CI: 0.554-0.900), UCG-002 (AUC = 0.759, 95% CI: 0.595-0.924), Christensenellaceae_R-7_group (AUC = 0.752, 95% CI: 0.593-0.910), Lachnoclostridium (AUC = 0.722, 95% CI: 0.545-0.900), [Ruminococcus]_gnavus_group (AUC = 0.677, 95% CI: 0.498-0.857), UCG-005 (AUC = 0.685, 95% CI: 0.503-0.868), Dorea (AUC = 0.750, 95% CI: 0.581-0.919), and NK4A214_group (AUC = 0.779, 95% CI: 0.625-0.934) (Table 3). Among these key marker genera, UCG-002, Christensenellaceae_R-7_group, and NK4A214_group exhibited relatively superior predictive performance, with AUC values exceeding 0.75. Additionally, the predictive capacities of six LDL-C subfractions were evaluated: LDLC-1 (AUC = 0.571, 95% CI: 0.380–0.762), LDLC-2 (AUC = 0.509, 95% CI: 0.315–0.704), LDLC-3 (AUC = 0.552, 95% CI: 0.361–0.744), LDLC-4 (AUC = 0.560, 95% CI: 0.368–0.753), LDLC-5 (AUC = 0.515, 95% CI: 0.324–0.707), and LDLC-6 (AUC = 0.551, 95% CI: 0.360–0.741) (Table 3). Notably, in comparison to gut microbiota markers, LDL-C subfractions exhibited lower predictive powers for MACEs.
4 Discussion
This study investigated the differences in gut microbiota profiles and the distribution of LDL-C subfractions between the Non-MACEs group and the MACEs group, and elucidated the interplay between gut microbiota and LDL-C subfractions in these two groups. The primary findings were as follows: (1) there were significant differences in gut microbiota composition but not gut microbiota diversity between the Non-MACEs group and the MACEs group, with the Non-MACEs group featuring a greater number of marker bacteria compared to the MACEs group; (2) there were no significant differences in TC, TG, HDL-C, LDL-C, LDLC-1, LDLC-2, LDLC-3, LDLC-4, LDLC-5, and LDLC-6 between the Non-MACEs group and the MACEs group; (3) multiple significantly negative correlations were identified between gut microbiota and LDL-C subfractions in the MACEs group, while none of significant correlations were observed in the Non-MACEs group; (4) the predictive performances of the top 10 marker genera were much better than the six LDL-C subfractions, and the AUC values of UCG-002, Christensenellaceae_R-7_group, and NK4A214_group were greater than 0.75. These findings suggested a potential role of gut microbiota in post-STEMI prognosis, emphasizing its relevance in cardiovascular risk stratification.
Statistical analyses revealed significant differences in the abundance of ten genera, with P values indicating distinct microbiota alterations between the Non-MACEs group and the MACEs group. Notably, [Ruminococcus]_gnavus_group and Bacteroides, both identified as MACEs-associated genera, demonstrated significant associations (P = 0.0486 and P = 0.0435, respectively), consistent with previous research linking these taxa to systemic inflammation and atherogenic progression (42–44). The microbial shifts observed in the MACEs group suggest potential pathogenic mechanisms contributing to adverse cardiovascular outcomes. Ruminococcus_gnavus_group had been linked to increased TMAO production, a metabolite derived from dietary choline and carnitine, which has been shown to enhance platelet activation, leading to thrombogenesis and heightened cardiovascular risk (45–48). Bacteroides, another key genus enriched in the MACEs group, plays a role in bile acid deconjugation, potentially exacerbating lipid dysregulation and systemic inflammation, thereby further predisposing patients to recurrent ischemic events (49–53). The observed microbial composition in the MACEs group suggests an enhanced inflammatory and pro-thrombotic state, reinforcing the hypothesis that gut microbiota may serve as a modifiable risk factor in post-STEMI prognosis. However, the proposed involvement of TMAO and bile acid pathways was inferred from the existing literature linking Ruminococcus_gnavus_group and Bacteroides. Future studies should focus on elucidating the mechanistic pathways linking these bacterial taxa to cardiovascular pathology by incorporating targeted metabolomics (e.g., LC-MS/MS analysis of TMAO and deoxycholic acid). Moreover, it was also interesting to explore the potential microbiome-targeted interventions, such as probiotics, dietary modifications, or pharmacological strategies aimed at reducing TMAO levels and systemic inflammation (54–56).
In patients with STEMI with MACEs, strong correlations were observed among several key genera. Notably, Bacteroides was negatively correlated with UCG-002, while positively correlated with Lachnoclostridium. Given that Bacteroides is involved in bile acid metabolism and short-chain fatty acid (SCFA) production (57–59), its negative association with UCG-002, a genus previously linked to anti-inflammatory effects (60), may suggest an altered inflammatory milieu favoring cardiovascular events. Meanwhile, Lachnoclostridium showed a negative correlation with [Eubacterium]_coprostanoligenes_group, UCG-002, and Christensenellaceae_R-7_group, but a positive association with [Ruminococcus]_gnavus_group. These findings aligned with prior studies that implicated Lachnoclostridium in increased intestinal permeability and pro-atherogenic lipid profiles, potentially exacerbating the risk of MACEs (61). In contrast, the non-MACEs group displayed a different pattern of microbial interactions. For example, [Eubacterium]_coprostanoligenes_group was positively correlated with UCG-002, Christensenellaceae_R-7_group, UCG-005, and NK4A214_group, indicating a cooperative role in maintaining gut homeostasis and potentially exerting cardioprotective effects through SCFA production and immune modulation (44). The robust positive association between Christensenellaceae_R-7_group and UCG-005 (ρ = 0.940, P < 0.001) suggested a tightly linked network contributing to intestinal barrier integrity and reduced systemic inflammation, factors that might protect against adverse cardiovascular outcomes (62, 63). Furthermore, Ruminococcaceae_UCG-005 and Christensenellaceae R-7 group have been positively associated with healthy gut profiles, such as enhanced SCFA production, reduced triglycerides, and lower fecal bile acid concentrations, in both adults and pediatric populations (64–66).
The interplay between gut microbiota and lipid metabolism was further explored through the correlation analysis between gut microbiota and LDL-C subfractions. In patients with STEMI with MACE, we observed significantly negative correlations between Coprococcus and LDLC-4 (ρ=-0.5488, P<0.05), between Coprococcus and LDLC-5 (ρ=-0.6418, P<0.01), between Coprococcus and LDLC-6 (ρ=-0.4988, P<0.05), between UCG-002 and LDLC-4 (ρ=-0.4948, P<0.05), and between Christensenellaceae_R-7_group and LDLC-4 (ρ=-0.5032, P<0.05). These findings suggested that certain gut microbial genera might play a protective role in modulating the distribution of LDL-C subfractions, particularly the more atherogenic small, dense LDL particles. Interestingly, Coprococcus, Christensenellaceae_R-7_group, and UCG-002 have been previously implicated in SCFA production, which has beneficial effects on lipid metabolism and endothelial function (67–70). Notably, SCFAs not only serve as substrates in lipid metabolism but also function as regulatory factors in the modulation of lipid metabolism. Li et al. demonstrated that butyric acid enhances fatty acid oxidation in brown adipose tissue, thereby alleviating diet-induced obesity and insulin resistance (71). Additionally, the migration and recruitment of immune cells to endothelial cells has also been influenced by SCFAs, a critical step in the pathogenesis of inflammatory diseases such as atherosclerosis (72). Several studies have shown that these effects are mediated through the regulation of adhesion molecule expression on immune and endothelial cells via activating FFA2 and FFA3 receptors (73–75). Collectively, these negative correlations observed in our study might reflect a potential role of these microbes in limiting the accumulation of highly atherogenic LDL-C subfractions through SCFA-mediated pathways. However, due to the limitation of research funds, the serum levels of SCFAs were lacking in this study, which significantly undermined the reliability of our hypothesis. Our findings should be validated in future studies incorporating multi-omics approaches (e.g., metabolomics and host transcriptomics) and experimental models to better identify the causal pathways linking gut microbiota to MACEs.
The findings of this study highlighted the potential of gut microbiota as a novel biomarker for cardiovascular risk stratification. The superior predictive performance of UCG-002, Christensenellaceae_R-7_group, and NK4A214_group compared to LDL-C subfractions suggested that microbial signatures might provide valuable complementary information beyond traditional lipid metrics. This was particularly relevant given the growing recognition of the gut-heart axis and its implications for cardiovascular disease prevention and management (6, 76, 77). However, several limitations of this study should be acknowledged. Firstly, the involvement of TMAO, bile acids, and SCFAs was hypothesis-generating, and they were inferred from the existing literature linking specific gut microbiota (e.g., Ruminococcus_gnavus_group, Bacteroides, and Christensenellaceae_R-7_group). We should incorporate targeted metabolomics (e.g., LC-MS/MS analysis) to validate these mechanistic hypotheses between patients with STEMI with and without MACEs. Secondly, an absence of mechanistic studies between gut microbiota and lipid metabolism in the context of cardiovascular risk. Furthermore, we should explore how these bacteria and their metabolites regulate LDL-C subfractions dynamics. Moreover, although steroid biosynthesis was predicted as a significantly different metabolic pathways between the MACEs group and the Non-MACEs group by the Picrust2 analysis, and exogenous steroids (e.g. anabolic or corticosteroids) were associated with higher cardiovascular event risk such as MI, heart failure, and arrhythmias (78, 79), multi-omics approaches (e.g., metagenomics, metabolomics, and host transcriptomics) and experimental models should also be incorporated to better dissect the causal pathways linking gut microbiota to lipid metabolism and systemic inflammation in patients with STEMI with MACEs. Thirdly, although we restricted the population to local residents and rice as a staple food, other potential confounding factors such as lifestyle and genetic predispositions were not fully accounted for, which may influence gut microbial composition and lipid metabolism. Fourthly, given that the study cohort consisted exclusively of local residents with rice as a staple food, our findings may reflect gut microbiota and lipid metabolism profiles specific to the high-carbohydrate pattern. Prior studies have shown that such diets can selectively promote the growth of SCFA-producing taxa. For instance, Coprococcus species, a SCFA-producing genus, has been observed to increase in plant-based dietary interventions and is linked to improved metabolic outcomes (80). However, these associations may differ in Western populations with higher fat and protein intake. Thus, while our results offer mechanistic insights into post-STEMI prognosis in a specific dietary setting, further multicenter studies across diverse nutritional backgrounds are warranted to verify their broader applicability. Lastly, the relatively small sample size necessitates further validation in larger cohorts with diverse populations.
In conclusion, our study suggests that gut microbiota, particularly UCG-002, Christensenellaceae_R-7_group, and NK4A214_group, exhibit superior predictive performance for MACEs compared to LDL-C subfractions. Our findings underscored the potential of gut microbial biomarkers in cardiovascular risk assessment and paved the way for future microbiota-targeted interventions in cardiovascular disease management.
Data availability statement
The raw reads of 16S rRNA sequencing are available NCBI at accession number PRJNA1230799. Other datasets generated during the current study are available from the corresponding authors upon reasonable request.
Ethics statement
The studies involving humans were approved by the Ethics Committee of Nanjing Jiangbei Hospital (#2022031). The studies were conducted in accordance with the local legislation and institutional requirements. The participants provided their written informed consent to participate in this study.
Author contributions
SX: Supervision, Investigation, Conceptualization, Funding acquisition, Project administration, Writing – original draft, Resources, Data curation, Validation. YL: Validation, Methodology, Visualization, Data curation, Writing – original draft, Resources, Investigation. MZW: Writing – review & editing, Formal Analysis, Visualization, Validation, Methodology, Investigation, Software, Resources. DL: Validation, Writing – review & editing, Investigation, Resources, Data curation, Methodology, Visualization. XBZ: Data curation, Visualization, Resources, Validation, Writing – review & editing, Methodology, Investigation. LL: Conceptualization, Methodology, Validation, Investigation, Writing – review & editing, Software, Visualization, Resources. MW: Investigation, Validation, Writing – review & editing, Resources, Methodology, Software, Visualization, Conceptualization. SJ: Investigation, Conceptualization, Writing – review & editing, Software, Methodology, Resources, Visualization, Validation. JL: Writing – review & editing, Supervision, Methodology, Investigation, Funding acquisition, Project administration, Formal Analysis. XMZ: Project administration, Conceptualization, Validation, Visualization, Methodology, Writing – review & editing, Resources, Investigation. HJ: Supervision, Investigation, Methodology, Writing – review & editing, Conceptualization, Resources, Validation, Formal Analysis, Project administration, Writing – original draft.
Funding
The author(s) declare financial support was received for the research and/or publication of this article. This work was supported by grant from the “Tianshan Talents” Training Program under the “2 + 5” Key Talent Plan of Xinjiang Uygur Autonomous Region (2023TSYCJC0062), University-level Scientific Research Project of Wannan Medical College (WK2024JXYY074), Nanjing Jiangbei Hospital Hospital-level Research Project (JKK202107), and Tingzhou youth science and technology talent special project (2023QN16). The funding did not participate in the design of the study and collection, analysis, and interpretation of data and in writing the manuscript.
Conflict of interest
The authors declare that the research was conducted in the absence of any commercial or financial relationships that could be construed as a potential conflict of interest.
Generative AI statement
The author(s) declare that no Generative AI was used in the creation of this manuscript.
Publisher’s note
All claims expressed in this article are solely those of the authors and do not necessarily represent those of their affiliated organizations, or those of the publisher, the editors and the reviewers. Any product that may be evaluated in this article, or claim that may be made by its manufacturer, is not guaranteed or endorsed by the publisher.
Supplementary material
The Supplementary Material for this article can be found online at: https://www.frontiersin.org/articles/10.3389/fimmu.2025.1610001/full#supplementary-material
References
1. Elendu C, Amaechi DC, Elendu TC, Omeludike EK, Alakwe-Ojimba CE, Obidigbo B, et al. Comprehensive review of st-segment elevation myocardial infarction: understanding pathophysiology, diagnostic strategies, and current treatment approaches. Med (Baltimore). (2023) 102:e35687. doi: 10.1097/MD.0000000000035687
2. Statescu C, Anghel L, Tudurachi BS, Leonte A, Benchea LC, and Sascau RA. From classic to modern prognostic biomarkers in patients with acute myocardial infarction. Int J Mol Sci. (2022) 23:9168. doi: 10.3390/ijms23169168
3. Gouda P, Savu A, Bainey KR, Kaul P, and Welsh RC. Long-term risk of death and recurrent cardiovascular events following acute coronary syndromes. PloS One. (2021) 16:e0254008. doi: 10.1371/journal.pone.0254008
4. Juan-Salvadores P, de la Torre Fonseca LM, Calderon-Cruz B, Veiga C, Pintos-Rodriguez S, Fernandez Barbeira S, et al. Ischaemia-reperfusion time differences in st-elevation myocardial infarction in very young patients: A cohort study. Open Heart. (2025) 12:e002957. doi: 10.1136/openhrt-2024-002957
5. Akhtar KH, Khan MS, Baron SJ, Zieroth S, Estep J, Burkhoff D, et al. The spectrum of post-myocardial infarction care: from acute ischemia to heart failure. Prog Cardiovasc Dis. (2024) 82:15–25. doi: 10.1016/j.pcad.2024.01.017
6. Shariff S, Kwan Su Huey A, Parag Soni N, Yahia A, Hammoud D, Nazir A, et al. Unlocking the gut-heart axis: exploring the role of gut microbiota in cardiovascular health and disease. Ann Med Surg (Lond). (2024) 86:2752–8. doi: 10.1097/MS9.0000000000001744
7. Al Samarraie A, Pichette M, and Rousseau G. Role of the gut microbiome in the development of atherosclerotic cardiovascular disease. Int J Mol Sci. (2023) 24:5420. doi: 10.3390/ijms24065420
8. Hu W, Feng H, Liu Y, Xu X, Zhou P, Sun Z, et al. Recent advances in immunotherapy targeting cetp proteins for atherosclerosis prevention. Hum Vaccin Immunother. (2025) 21:2462466. doi: 10.1080/21645515.2025.2462466
9. Chandran M, Rameshkumar KB, Jaleel A, and Ayyappan JP. Embelin elevates endoplasmic reticulum calcium levels and blocks the sterol regulatory element-binding protein 2 mediated proprotein convertase subtilisin/kexin type 9 expression and improves the low-density lipoprotein receptor mediated lipid clearance on hepatocytes. Chem Biol Drug Des. (2025) 105:e70055. doi: 10.1111/cbdd.70055
10. Masenga SK, Hamooya B, Hangoma J, Hayumbu V, Ertuglu LA, Ishimwe J, et al. Recent advances in modulation of cardiovascular diseases by the gut microbiota. J Hum Hypertens. (2022) 36:952–9. doi: 10.1038/s41371-022-00698-6
11. Brown EM, Clardy J, and Xavier RJ. Gut microbiome lipid metabolism and its impact on host physiology. Cell Host Microbe. (2023) 31:173–86. doi: 10.1016/j.chom.2023.01.009
12. Witkowski M, Weeks TL, and Hazen SL. Gut microbiota and cardiovascular disease. Circ Res. (2020) 127:553–70. doi: 10.1161/CIRCRESAHA.120.316242
13. Han Y, Gong Z, Sun G, Xu J, Qi C, Sun W, et al. Dysbiosis of gut microbiota in patients with acute myocardial infarction. Front Microbiol. (2021) 12:680101. doi: 10.3389/fmicb.2021.680101
14. Muttiah B and Hanafiah A. Gut microbiota and cardiovascular diseases: unraveling the role of dysbiosis and microbial metabolites. Int J Mol Sci. (2025) 26:4264. doi: 10.3390/ijms26094264
15. Novakovic M, Rout A, Kingsley T, Kirchoff R, Singh A, Verma V, et al. Role of gut microbiota in cardiovascular diseases. World J Cardiol. (2020) 12:110–22. doi: 10.4330/wjc.v12.i4.110
16. Berger M, Kleber ME, Delgado GE, Marz W, Andreas M, Hellstern P, et al. Trimethylamine N-oxide and adenosine diphosphate-induced platelet reactivity are independent risk factors for cardiovascular and all-cause mortality. Circ Res. (2020) 126:660–2. doi: 10.1161/CIRCRESAHA.119.316214
17. Chou RH, Chen CY, Chen IC, Huang HL, Lu YW, Kuo CS, et al. Trimethylamine N-oxide, circulating endothelial progenitor cells, and endothelial function in patients with stable angina. Sci Rep. (2019) 9:4249. doi: 10.1038/s41598-019-40638-y
18. Guo G, Wu Y, Liu Y, Wang Z, Xu G, Wang X, et al. Exploring the causal effects of the gut microbiome on serum lipid levels: A two-sample mendelian randomization analysis. Front Microbiol. (2023) 14:1113334. doi: 10.3389/fmicb.2023.1113334
19. Wang H, Ma C, Li Y, Zhang L, A L, Yang C, et al. Probio-X relieves symptoms of hyperlipidemia by regulating patients’ Gut microbiome, blood lipid metabolism, and lifestyle habits. Microbiol Spectr. (2023) 11:e0444022. doi: 10.1128/spectrum.04440-22
20. Aljuraiban GS, Alfhili MA, Aldhwayan MM, Aljazairy EA, and Al-Musharaf S. Metagenomic shotgun sequencing reveals specific human gut microbiota associated with insulin resistance and body fat distribution in saudi women. Biomolecules. (2023) 13:640. doi: 10.3390/biom13040640
21. Hu YH, Meyer K, Lulla A, Lewis CE, Carnethon MR, Schreiner PJ, et al. Gut microbiome and stages of diabetes in middle-aged adults: cardia microbiome study. Nutr Metab (Lond). (2023) 20:3. doi: 10.1186/s12986-022-00721-0
22. Qiao YN, Zou YL, and Guo SD. Low-density lipoprotein particles in atherosclerosis. Front Physiol. (2022) 13:931931. doi: 10.3389/fphys.2022.931931
23. Wolska A and Remaley AT. Measuring ldl-cholesterol: what is the best way to do it? Curr Opin Cardiol. (2020) 35:405–11. doi: 10.1097/HCO.0000000000000740
24. Higashioka M, Sakata S, Honda T, Hata J, Yoshida D, Hirakawa Y, et al. Small dense low-density lipoprotein cholesterol and the risk of coronary heart disease in a Japanese community. J Atheroscler Thromb. (2020) 27:669–82. doi: 10.5551/jat.51961
25. Higashioka M, Sakata S, Honda T, Hata J, Shibata M, Yoshida D, et al. The association of small dense low-density lipoprotein cholesterol and coronary heart disease in subjects at high cardiovascular risk. J Atheroscler Thromb. (2021) 28:79–89. doi: 10.5551/jat.55350
26. Jin X, Yang S, Lu J, and Wu M. Small, dense low-density lipoprotein-cholesterol and atherosclerosis: relationship and therapeutic strategies. Front Cardiovasc Med. (2021) 8:804214. doi: 10.3389/fcvm.2021.804214
27. Talebi S, Bagherniya M, Atkin SL, Askari G, Orafai HM, and Sahebkar A. The beneficial effects of nutraceuticals and natural products on small dense ldl levels, ldl particle number and ldl particle size: A clinical review. Lipids Health Dis. (2020) 19:66. doi: 10.1186/s12944-020-01250-6
28. Ma C, Xu C, Zheng M, Zhang S, Liu Q, Lyu J, et al. Utilizing lactic acid bacteria to improve hyperlipidemia: A comprehensive analysis from gut microbiota to metabolic pathways. Foods. (2024) 13:4058. doi: 10.3390/foods13244058
29. Guan B, Tong J, Hao H, Yang Z, Chen K, Xu H, et al. Bile acid coordinates microbiota homeostasis and systemic immunometabolism in cardiometabolic diseases. Acta Pharm Sin B. (2022) 12:2129–49. doi: 10.1016/j.apsb.2021.12.011
30. Le Roy T, Lecuyer E, Chassaing B, Rhimi M, Lhomme M, Boudebbouze S, et al. The intestinal microbiota regulates host cholesterol homeostasis. BMC Biol. (2019) 17:94. doi: 10.1186/s12915-019-0715-8
31. Caporaso JG, Kuczynski J, Stombaugh J, Bittinger K, Bushman FD, Costello EK, et al. Qiime allows analysis of high-throughput community sequencing data. Nat Methods. (2010) 7:335–6. doi: 10.1038/nmeth.f.303
32. Gill SR, Pop M, Deboy RT, Eckburg PB, Turnbaugh PJ, Samuel BS, et al. Metagenomic analysis of the human distal gut microbiome. Science. (2006) 312:1355–9. doi: 10.1126/science.1124234
33. Rognes T, Flouri T, Nichols B, Quince C, and Mahe F. Vsearch: A versatile open source tool for metagenomics. PeerJ. (2016) 4:e2584. doi: 10.7717/peerj.2584
34. Segata N, Izard J, Waldron L, Gevers D, Miropolsky L, Garrett WS, et al. Metagenomic biomarker discovery and explanation. Genome Biol. (2011) 12:R60. doi: 10.1186/gb-2011-12-6-r60
35. Nearing JT, Douglas GM, Hayes MG, MacDonald J, Desai DK, Allward N, et al. Microbiome differential abundance methods produce different results across 38 datasets. Nat Commun. (2022) 13:342. doi: 10.1038/s41467-022-28034-z
36. Langille MG, Zaneveld J, Caporaso JG, McDonald D, Knights D, Reyes JA, et al. Predictive functional profiling of microbial communities using 16s rrna marker gene sequences. Nat Biotechnol. (2013) 31:814–21. doi: 10.1038/nbt.2676
37. Douglas GM, Maffei VJ, Zaneveld JR, Yurgel SN, Brown JR, Taylor CM, et al. Picrust2 for prediction of metagenome functions. Nat Biotechnol. (2020) 38:685–8. doi: 10.1038/s41587-020-0548-6
38. Hoefner DM, Hodel SD, O’Brien JF, Branum EL, Sun D, Meissner I, et al. Development of a rapid, quantitative method for ldl subfractionation with use of the quantimetrix lipoprint ldl system. Clin Chem. (2001) 47:266–74. doi: 10.1093/clinchem/47.2.266
39. Zhou X, Liu XL, Ji WJ, Liu JX, Guo ZZ, Ren D, et al. The kinetics of circulating monocyte subsets and monocyte-platelet aggregates in the acute phase of st-elevation myocardial infarction: associations with 2-year cardiovascular events. Med (Baltimore). (2016) 95:e3466. doi: 10.1097/MD.0000000000003466
40. Hicks KA, Tcheng JE, Bozkurt B, Chaitman BR, Cutlip DE, Farb A, et al. 2014 acc/aha key data elements and definitions for cardiovascular endpoint events in clinical trials: A report of the american college of cardiology/american heart association task force on clinical data standards (Writing committee to develop cardiovascular endpoints data standards). Circulation. (2015) 132:302–61. doi: 10.1161/CIR.0000000000000156
41. Shantsila E, Ghattas A, Griffiths HR, and Lip GYH. Mon2 predicts poor outcome in st-elevation myocardial infarction. J Intern Med. (2019) 285:301–16. doi: 10.1111/joim.12847
42. Nooij S, Plomp N, Sanders I, Schout L, van der Meulen AE, Terveer EM, et al. Metagenomic Global Survey and in-Depth Genomic Analyses of Ruminococcus Gnavus Reveal Differences across Host Lifestyle and Health Status. Nat Commun. (2025) 16:1182. doi: 10.1038/s41467-025-56449-x
43. Chandrasekaran P, Krausz M, Han Y, Mitsuiki N, Gabrysch A, Noltner C, et al. The intestinal microbiome and metabolome discern disease severity in cytotoxic T-lymphocyte-associated protein 4 deficiency. Microbiome. (2025) 13:51. doi: 10.1186/s40168-025-02028-7
44. Matacchione G, Piacenza F, Pimpini L, Rosati Y, and Marcozzi S. The role of the gut microbiota in the onset and progression of heart failure: insights into epigenetic mechanisms and aging. Clin Epigenet. (2024) 16:175. doi: 10.1186/s13148-024-01786-9
45. Cienkowski K, Cienkowska A, Kupczynska K, and Bielecka-Dabrowa A. The role of gut microbiota and its metabolites in patients with heart failure. Biomedicines. (2024) 12:894. doi: 10.3390/biomedicines12040894
46. Ahmad AF, Dwivedi G, O’Gara F, Caparros-Martin J, and Ward NC. The gut microbiome and cardiovascular disease: current knowledge and clinical potential. Am J Physiol Heart Circ Physiol. (2019) 317:H923–H38. doi: 10.1152/ajpheart.00376.2019
47. Chen X, Zhang H, Ren S, Ding Y, Remex NS, Bhuiyan MS, et al. Gut microbiota and microbiota-derived metabolites in cardiovascular diseases. Chin Med J (Engl). (2023) 136:2269–84. doi: 10.1097/CM9.0000000000002206
48. Desai D, Desai A, Jamil A, Csendes D, Gutlapalli SD, Prakash K, et al. Re-defining the gut heart axis: A systematic review of the literature on the role of gut microbial dysbiosis in patients with heart failure. Cureus. (2023) 15:e34902. doi: 10.7759/cureus.34902
49. Campbell DE, Ly LK, Ridlon JM, Hsiao A, Whitaker RJ, and Degnan PH. Infection with bacteroides phage bv01 alters the host transcriptome and bile acid metabolism in a common human gut microbe. Cell Rep. (2020) 32:108142. doi: 10.1016/j.celrep.2020.108142
50. Zhou S, Xue J, Shan J, Hong Y, Zhu W, Nie Z, et al. Gut-flora-dependent metabolite trimethylamine-N-oxide promotes atherosclerosis-associated inflammation responses by indirect ros stimulation and signaling involving ampk and sirt1. Nutrients. (2022) 14:3338. doi: 10.3390/nu14163338
51. Lu Q, Chen J, Jiang L, Geng T, Tian S, Liao Y, et al. Gut microbiota-derived secondary bile acids, bile acids receptor polymorphisms, and risk of cardiovascular disease in individuals with newly diagnosed type 2 diabetes: A cohort study. Am J Clin Nutr. (2024) 119:324–32. doi: 10.1016/j.ajcnut.2023.08.023
52. Xu H, Fang F, Wu K, Song J, Li Y, Lu X, et al. Gut microbiota-bile acid crosstalk regulates murine lipid metabolism via the intestinal fxr-fgf19 axis in diet-induced humanized dyslipidemia. Microbiome. (2023) 11:262. doi: 10.1186/s40168-023-01709-5
53. Liu H, Tian R, Wang H, Feng S, Li H, Xiao Y, et al. Gut microbiota from coronary artery disease patients contributes to vascular dysfunction in mice by regulating bile acid metabolism and immune activation. J Transl Med. (2020) 18:382. doi: 10.1186/s12967-020-02539-x
54. Chen S, Jiang PP, Yu D, Liao GC, Wu SL, Fang AP, et al. Effects of probiotic supplementation on serum trimethylamine-N-oxide level and gut microbiota composition in young males: A double-blinded randomized controlled trial. Eur J Nutr. (2021) 60:747–58. doi: 10.1007/s00394-020-02278-1
55. Diao Z, Molludi J, Latef Fateh H, and Moradi S. Comparison of the low-calorie dash diet and a low-calorie diet on serum tmao concentrations and gut microbiota composition of adults with overweight/obesity: A randomized control trial. Int J Food Sci Nutr. (2024) 75:207–20. doi: 10.1080/09637486.2023.2294685
56. Karmazyn M and Gan XT. Probiotics as potential treatments to reduce myocardial remodelling and heart failure via the gut-heart axis: state-of-the-art review. Mol Cell Biochem. (2023) 478:2539–51. doi: 10.1007/s11010-023-04683-6
57. Tang B, Tang L, Li S, Liu S, He J, Li P, et al. Gut microbiota alters host bile acid metabolism to contribute to intrahepatic cholestasis of pregnancy. Nat Commun. (2023) 14:1305. doi: 10.1038/s41467-023-36981-4
58. Su X, Gao Y, and Yang R. Gut microbiota derived bile acid metabolites maintain the homeostasis of gut and systemic immunity. Front Immunol. (2023) 14:1127743. doi: 10.3389/fimmu.2023.1127743
59. Lu J, Jin X, Yang S, Li Y, Wang X, and Wu M. Immune mechanism of gut microbiota and its metabolites in the occurrence and development of cardiovascular diseases. Front Microbiol. (2022) 13:1034537. doi: 10.3389/fmicb.2022.1034537
60. Chen M, Zhao Y, Li S, Chang Z, Liu H, Zhang D, et al. Maternal Malic acid may ameliorate oxidative stress and inflammation in sows through modulating gut microbiota and host metabolic profiles during late pregnancy. Antioxid (Basel). (2024) 13:253. doi: 10.3390/antiox13020253
61. Li P, Wang Y, Li P, Chen X, Liu Y, Zha L, et al. Maternal vitamin D deficiency aggravates the dysbiosis of gut microbiota by affecting intestinal barrier function and inflammation in obese male offspring mice. Nutrition. (2023) 105:111837. doi: 10.1016/j.nut.2022.111837
62. Bloemendaal M, Szopinska-Tokov J, Belzer C, Boverhoff D, Papalini S, Michels F, et al. Probiotics-induced changes in gut microbial composition and its effects on cognitive performance after stress: exploratory analyses. Transl Psychiatry. (2021) 11:300. doi: 10.1038/s41398-021-01404-9
63. Chen M, Xie W, Zhou S, Ma N, Wang Y, Huang J, et al. A high-concentrate diet induces colonic inflammation and barrier damage in hu sheep. J Dairy Sci. (2023) 106:9644–62. doi: 10.3168/jds.2023-23359
64. Mohr AE, Sweazea KL, Bowes DA, Jasbi P, Whisner CM, Sears DD, et al. Gut microbiome remodeling and metabolomic profile improves in response to protein pacing with intermittent fasting versus continuous caloric restriction. Nat Commun. (2024) 15:4155. doi: 10.1038/s41467-024-48355-5
65. Alcazar M, Escribano J, Ferre N, Closa-Monasterolo R, Selma-Royo M, Feliu A, et al. Gut microbiota is associated with metabolic health in children with obesity. Clin Nutr. (2022) 41:1680–8. doi: 10.1016/j.clnu.2022.06.007
66. Galie S, Papandreou C, Arcelin P, Garcia D, Palau-Galindo A, Gutierrez-Tordera L, et al. Examining the interaction of the gut microbiome with host metabolism and cardiometabolic health in metabolic syndrome. Nutrients. (2021) 13:4318. doi: 10.3390/nu13124318
67. Dicks LMT. How important are fatty acids in human health and can they be used in treating diseases? Gut Microbes. (2024) 16:2420765. doi: 10.1080/19490976.2024.2420765
68. Zhang Y, Mu C, Liu S, and Zhu W. Dietary citrus pectin drives more ileal microbial protein metabolism and stronger fecal carbohydrate fermentation over fructo-oligosaccharide in growing pigs. Anim Nutr. (2022) 11:252–63. doi: 10.1016/j.aninu.2022.08.005
69. Sun W, Du D, Fu T, Han Y, Li P, and Ju H. Alterations of the gut microbiota in patients with severe chronic heart failure. Front Microbiol. (2021) 12:813289. doi: 10.3389/fmicb.2021.813289
70. He J, Zhang P, Shen L, Niu L, Tan Y, Chen L, et al. Short-chain fatty acids and their association with signalling pathways in inflammation, glucose and lipid metabolism. Int J Mol Sci. (2020) 21:6356. doi: 10.3390/ijms21176356
71. Li Z, Yi CX, Katiraei S, Kooijman S, Zhou E, Chung CK, et al. Butyrate reduces appetite and activates brown adipose tissue via the gut-brain neural circuit. Gut. (2018) 67:1269–79. doi: 10.1136/gutjnl-2017-314050
72. Lu Y, Zhang Y, Zhao X, Shang C, Xiang M, Li L, et al. Microbiota-derived short-chain fatty acids: implications for cardiovascular and metabolic disease. Front Cardiovasc Med. (2022) 9:900381. doi: 10.3389/fcvm.2022.900381
73. Sun M, Wu W, Liu Z, and Cong Y. Microbiota metabolite short chain fatty acids, gpcr, and inflammatory bowel diseases. J Gastroenterol. (2017) 52:1–8. doi: 10.1007/s00535-016-1242-9
74. Aguilar EC, Leonel AJ, Teixeira LG, Silva AR, Silva JF, Pelaez JM, et al. Butyrate impairs atherogenesis by reducing plaque inflammation and vulnerability and decreasing nfkappab activation. Nutr Metab Cardiovasc Dis. (2014) 24:606–13. doi: 10.1016/j.numecd.2014.01.002
75. den Besten G, van Eunen K, Groen AK, Venema K, Reijngoud DJ, and Bakker BM. The role of short-chain fatty acids in the interplay between diet, gut microbiota, and host energy metabolism. J Lipid Res. (2013) 54:2325–40. doi: 10.1194/jlr.R036012
76. Zhang Z, Lv T, Wang X, Wu M, Zhang R, Yang X, et al. Role of the microbiota-gut-heart axis between bile acids and cardiovascular disease. BioMed Pharmacother. (2024) 174:116567. doi: 10.1016/j.biopha.2024.116567
77. Sagmeister A, Matter CM, Stahli BE, and Scharl M. The gut-heart axis: effects of intestinal microbiome modulation on cardiovascular disease-ready for therapeutic interventions? Int J Mol Sci. (2024) 25:13529. doi: 10.3390/ijms252413529
78. Windfeld-Mathiasen J, Heerfordt IM, Dalhoff KP, Andersen JT, Andersen MA, Johansson KS, et al. Cardiovascular disease in anabolic androgenic steroid users. Circulation. (2025) 151:828–34. doi: 10.1161/CIRCULATIONAHA.124.071117
79. Varas-Lorenzo C, Rodriguez LA, Maguire A, Castellsague J, and Perez-Gutthann S. Use of oral corticosteroids and the risk of acute myocardial infarction. Atherosclerosis. (2007) 192:376–83. doi: 10.1016/j.atherosclerosis.2006.05.019
Keywords: ST-segment elevation myocardial infarction, gut microbiota, LDL-C subfractions, interaction, risk factors
Citation: Xia S, Liu Y, Wang M, Liu D, Zhang X, Lin L, Wen M, Ji S, Li J, Zhang X and Jiang H (2025) Prognostic value of gut microbiota and low-density lipoprotein cholesterol subfractions in patients with ST-segment elevation myocardial infarction. Front. Immunol. 16:1610001. doi: 10.3389/fimmu.2025.1610001
Received: 11 April 2025; Accepted: 22 July 2025;
Published: 13 August 2025.
Edited by:
Jiajia Song, Southwest University, ChinaReviewed by:
Daniela De Biase, Sapienza University of Rome, ItalyShiqi Wang, Sichuan University, China
Copyright © 2025 Xia, Liu, Wang, Liu, Zhang, Lin, Wen, Ji, Li, Zhang and Jiang. This is an open-access article distributed under the terms of the Creative Commons Attribution License (CC BY). The use, distribution or reproduction in other forums is permitted, provided the original author(s) and the copyright owner(s) are credited and that the original publication in this journal is cited, in accordance with accepted academic practice. No use, distribution or reproduction is permitted which does not comply with these terms.
*Correspondence: Huihui Jiang, aGhqaWFuZzE2QGZ1ZGFuLmVkdS5jbg==; Xiangming Zhang, NTA2MzAzNDE1QHFxLmNvbQ==; Jiaying Li, NjQxNTU3MjY2QHFxLmNvbQ==
†These authors have contributed equally to this work
 Siliang Xia1†
 Ling Lin
 Shushen Ji
 Huihui Jiang