 Jingwen Hao1,2Yukun Jie1,2Zhibin Lu1,2Tiantian Ye1Jilun Meng1Cui Liu1
 Junjun Yan1Yutong Zheng1
 Zaijie Dong2*
 Zhimin Gu1*
- 1Xianghu Laboratory, Hangzhou, China
- 2Wuxi Fisheries College, Nanjing Agricultural University, Wuxi, China
Selective breeding for DIV1-resistant Macrobrachium rosenbergii is an effective strategy to mitigate aquaculture losses; however, the underlying resistance mechanisms remain poorly understood. In this study, approximately 2,300 prawns from 46 families were subjected to a DIV1 challenge test. Based on survival rate, viral load, histopathological observations, and viral gene detection in the transcriptome, one resistant family (R27-1) and one susceptible family (S2-2) were identified. Hepatopancreas transcriptomic (RNA-Seq) and gut microbiome analyses were conducted on samples at 0, 24, and 48 hours post-infection (hpi) from both families. A total of 144, 68, and 1,170 differentially expressed genes (DEGs) were identified at the respective timepoints. Three DEGs—including one corresponding to an uncharacterized lncRNA, an esterase E4-like protein, and a CUB-serine protease—were consistently differentially expressed at all timepoints. Transcriptomic data suggest that Melanogenesis, energy metabolism, and Steroid hormone biosynthesis pathways are associated with DIV1 resistance. Notable DEGs included hemocyanin, cytochrome P450, alkaline phosphatase-like, Friend leukemia integration 1 transcription factor-like, cytochrome P450 9e2-like, interferon regulatory factor 4-like, dual specificity protein phosphatase 10-like, trypsin II-P29-like, and cytochrome c oxidase subunit III. In addition, the potential probiotic Enterococcus casseliflavus (relative abundance: 0.51% vs 0.03%) was more abundant in the resistant family, whereas Lactococcus garvieae (RA: 20.18% vs 70%) was enriched in the susceptible one. These findings highlight the combined contribution of host transcriptomic responses and gut microbial communities to DIV1 resistance. To the best of our knowledge, this is the first study to integrate transcriptomic and microbiomic analyses for investigating DIV1 resistance in M. rosenbergii. These findings provide novel insights into the host–pathogen interaction and offer valuable targets for selective breeding of DIV1-resistant M. rosenbergii in aquaculture.
1 Introduction
Macrobrachium rosenbergii (giant freshwater prawn) is a highly valuable aquaculture species, primarily cultivated in Asia, with China accounting for over 50% of global production in 2020 (1). In 2023, China’s production reached 196,374 tonnes, representing a 10.42% increase compared to the previous year (2). However, the rapid expansion of shrimp aquaculture has been accompanied by significant challenges, particularly disease outbreaks. Among these, Decapod Iridescent Virus 1 (DIV1) has become a major threat, causing high mortality rates and considerable economic losses in farmed populations (3). Thus, effective prevention and control strategies are urgently needed to sustain industry development. Selective breeding for disease-resistant broodstock offers a sustainable solution for disease control. With the advancement of molecular biology, genomic technologies now provide powerful tools to enhance and accelerate the breeding process (4). Identifying the key genes linked to disease resistance is the initial step in implementing marker-assisted selection (MAS) (5). Several genes related to disease resistance have been identified in aquatic animals. For example, a significant quantitative trait locus (QTL) associated with resistance to infectious pancreatic necrosis (IPN) in Atlantic salmon (Salmo salar) has been identified and is now being used in marker-assisted breeding to develop IPN-resistant fish (6, 7). In shrimp, polymorphisms in genes like TRAF6 and LvALF have been associated with resistance to white spot syndrome virus (WSSV) (8–12).
Transcriptome sequencing combined with quantitative real-time PCR (qRT-PCR) in phenotypically distinct populations is an effective strategy for identifying genes linked to specific traits. For example, in Litopenaeus vannamei, transcriptomic comparisons revealed that genes like myosin, myosin heavy chain, and chitinase, involved in muscle growth and chitin metabolism, are upregulated in fast-growing families (13, 14). Similarly, in Meretrix petechialis, families with varying resistance to Vibrio parahaemolyticus showed differential expression of candidate genes such as Big-Def, CTL9, and Bax (15). Moreover, in L. vannamei affected by acute hepatopancreatic necrosis disease (AHPND), RNA-Seq identified 32 resistance-related DEGs, with 19 validated in progeny (16). Subsequent comparative analysis revealed 5,013 DEGs between L. vannamei resistant and susceptible families during V. parahaemolyticus infection, including 1,124 shared at 0 and 6 hpi, enriched in endocytosis, protein synthesis, and inflammation pathways, particularly mTORC1 signaling (17). In addition, differential expression of immune and metabolic genes such as ChyA, SP, CRSTP, and PPAE2 between susceptible (P1) and tolerant (P2) L. vannamei populations further illuminated the molecular basis of AHPND tolerance and provided potential resistance markers (18). Consistently, in Scophthalmus maximus, resistant families showed more controlled inflammation and higher immune gene expression during early Aeromonas salmonicida infection, with many DEGs overlapping resistance QTLs (19). These findings collectively underscore the value of family-based transcriptomic comparisons in elucidating the molecular mechanisms underlying disease resistance in aquaculture species. However, despite these advances, the molecular basis of DIV1 resistance in M. rosenbergii remains largely unexplored, underscoring the need for in-depth investigation in this species.
In addition to host genetics, the intestinal microbiome has emerged as a critical factor in modulating disease resistance in aquatic animals. Commensal microorganisms on mucosal surfaces are crucial for defending the host against pathogen infections, and pathogen-induced changes in the intestinal microbiota have been widely documented across aquatic species (20–25). In crustaceans, the composition and function of gut microbial communities are tightly linked to immune responses and overall health. Dysbiosis following infection can influence disease outcomes. For example, WSSV infection in shrimp causes notable shifts in microbiota structure, and microbial indicators have been associated with disease severity (26, 27). Similar changes have been observed in M. rosenbergii following DIV1 infection (28). Changes in the gut microbiome were strongly linked to the severity of WSSV infection, and specific indicator taxa could serve as markers for assessing the health status of crustaceans (27). Studies also suggests that selectively bred Flavobacterium psychrophilum-resistant Oncorhynchus mykiss may harbor a more resilient gut microbiome compared to susceptible strains (25). The intestinal microbiome may regulate host immune homeostasis and inflammation, thereby improving resistance of Cynoglossus semilaevis to vibriosis through the microbe-intestine-immunity axis (23). These findings underscore the importance of the microbiome in disease resistance, highlighting the need to explore the relationship between the microbiome and DIV1 resistance in M. rosenbergii. By performing a comparative analysis of microbiome profiles across families with varying resistance levels, this study aims to better understand how microbial communities influence disease outcomes in shrimp aquaculture.
Although selective breeding offers a promising approach to improve DIV1 resistance, the underlying molecular and microbial mechanisms remain largely unknown. The hepatopancreas, a central organ for immune and metabolic regulation (29–31), is the primary target of DIV1 infection (32–34). In this study, we performed a comparative analysis of hepatopancreas transcriptomes and gut microbiome profiles in M. rosenbergii families with distinct DIV1 susceptibility, both before and after infection. By identifying DEGs and microbial taxa associated with DIV1 resistance, this work will deepen our understanding of the genetic and microbial factors underlying host tolerance, and provide a theoretical basis for marker-assisted selection in disease-resistant shrimp breeding.
2 Materials and methods
2.1 Pathogen
The DIV1 strain (GenBank accession number PQ724921) used in this study was isolated from naturally infected L. vannamei in Zhuhai, Guangdong Province, China. Tissue from DIV1-infected shrimp was homogenized in phosphate-buffered saline (PBS) at a 1:10 ratio using a high-throughput tissue homogenizer (SCIENTZ-48, NINGBO SCIENTZ BIOTECHNOLOGY CO., LTD, China). The resulting homogenate was subjected to two rounds of centrifugation: first at 3,000 rpm for 20 minutes at 4°C to remove large debris, followed by a second spin at 8,000 rpm for 25 minutes at 4°C to further clarify the sample. The supernatant was then passed through a 0.22 µm filter and stored at –80°C. qRT-PCR was performed to quantify DIV1 load, with primers listed in Supplementary Table S1.
2.2 Selection of susceptible and resistant families against DIV1
The M. rosenbergii families were obtained and maintained separately in Zhejiang Lanke Breeding Biotechnology CO., LTD. Before the formal experiment, five prawns were randomly selected from each family for pathogen screening, including tests for DIV1, infectious precocity virus (IPV), WSSV, infectious hypodermal and hematopoietic necrosis virus (IHHNV), Vibrio parahaemolyticus (VpAHPND), and Enterocytozoon hepatopenaei (EHP), with the primers listed in Supplementary Table S1. The results indicated that all pathogen tests were negative. A challenge test was conducted to evaluate the susceptibility to DIV1 among M. rosenbergii families. A total of 46 families were selected for the assessment, with individuals averaging 1.82 g in body weight. After a 7-day acclimatization period, approximately 50 healthy prawns from each family were randomly selected, and each prawn was injected with 50 μL of DIV1 solution (virus concentration: 1.95 × 10⁷ copies/mL). The selection of the viral concentration was based on the results of a preliminary experiment, with the estimated median lethal dose (LD50) at 72 hpi and 96 hpi being 2.6 × 10⁶ copies/g of muscle tissue and 2.44 × 10⁵ copies/g of muscle tissue, respectively. Based on these findings, a virus concentration of 1.95 × 10⁷ copies/mL (5.36 × 10⁵ copies/g of muscle tissue) was selected for the formal challenge experiment, as it was capable of inducing moderate mortality and effectively distinguishing the resistance levels among different families. Throughout the experiment, water temperature was maintained at approximately 25 °C with continuous aeration. One-third of the water was replaced daily, and commercial feed was provided twice daily (morning and evening). Shrimp from each family were monitored every two hours and any dead individuals or uneaten feed were promptly removed. The exact time of death for each prawn was recorded, and cumulative mortality data were collected over a 14-day period. Based on survival rates and family numbers, one susceptible family (S2–2) and one resistant family (R27–1) were selected for further analysis.
2.3 Experimental design and sample collection
To minimize the influence of external environmental variables on subsequent observations, approximately 200 individuals from each of the two selected families were randomly selected, fluorescently labeled, and co-cultured in a single outdoor pond. After 73 days, 30 individuals from each family (approximately 15 cm in length and 50 g in weight) were randomly selected and acclimated in the laboratory for 7 days. To investigate the molecular immune mechanisms underlying the differences between DIV1-resistant and -susceptible families, a viral challenge experiment was conducted. As mentioned in section 2.2, the LD50-72 hpi was estimated to be 2.6 × 10⁶ copies/g of muscle tissue. Based on this finding, and taking into account the body weight of prawns used in this study, a corresponding infection dose was selected for the formal challenge. Accordingly, each prawn was intramuscularly injected at the third abdominal segment with 100 µL of DIV1 solution containing 9.3 × 10⁸ copies/mL, a concentration lower than the LD50 at 72 hpi. During the experiment, the water temperature was maintained at 25 °C with continuous aeration. Prawns were fed twice daily, and uneaten feed was removed promptly.
Tissue samples were collected at 0 h, 24 hpi, and 48 hpi. The selection of these time points was based on preliminary observations and insights from relevant literature. Specifically, 0 h was chosen to explore the global transcriptome and gut microbiota composition differences between the susceptible family S2–2 and the resistant family R27–1 under baseline conditions (19, 23). Based on the challenge experiment described in section 2.2, we observed that the highest population-level mortality occurred between 72 and 96 hpi. Since our primary focus was on host responses to DIV1 infection in the early stages, 24 hpi and 48 hpi were selected as key time points for comparative analyses. At each time point, hepatopancreas tissues were collected for transcriptome analysis (with 3 biological replicates per group). Intestinal tissues and contents were collected for microbial diversity profiling (n = 5 per group), and muscle tissues were collected for viral load quantification (n = 4 per group). Additionally, hepatopancreas tissues were collected at 48 hpi for histopathological examination using hematoxylin and eosin (H&E) staining, with PBS-injected shrimp serving as the negative control. The 48 hpi time point was selected for pathological analysis due to significantly increased viral replication (as indicated by viral load quantification), providing a critical window for assessing tissue damage and immune-pathological changes between the two families. For histological analysis, hepatopancreas tissues were fixed in 4% paraformaldehyde (Biosharp, China) and stored at 4°C. All remaining samples were rapidly frozen in liquid nitrogen and stored at –80 °C for subsequent analyses.
2.4 Histopathological observations
Histopathological section preparation and examination were conducted in accordance with standard pathological procedures. Briefly, hepatopancreas tissues fixed in 4% paraformaldehyde were sequentially dehydrated in graded ethanol solutions (70%, 80%, 95%, and 100%), followed by clearing in xylene. The cleared tissues were infiltrated with paraffin at 56–58 °C for 12 hours, transferred to fresh paraffin for an additional 12 hours, and then embedded. Paraffin-embedded tissues were sectioned into 3–5 μm slices using a microtome. Sections were mounted onto glass slides and dried at 60 °C for 30 minutes. After deparaffinization and rehydration, the sections were stained with hematoxylin and eosin (H&E), followed by dehydration, clearing, and mounting. The stained sections were observed under an optical microscope (Nikon Eclipse Ci-L, Japan) at different magnifications, and representative images were captured at 200× and 400×.
2.5 DIV1 load detection
To accurately quantify DIV1viral loads, a standard curve was established following the method described by Qiu et al. (35). DNA from the DIV1-ZH strain was extracted using the Genomic DNA/RNA extraction kit for aquatic animal pathogens (FAST) (DHelix, Guangzhou, China), and the concentration was adjusted to approximately 60 ng/µL. Quantitative analysis was performed using the primers and TaqMan probe listed in Supplementary Table S1 with the Applied Biosystems™ QuantStudio™ 3 real-time PCR system (Thermo Fisher Scientific, USA). The reaction mixture consisted of 10 µL AceQ® Universal U+ Probe Master Mix V2 (Vazyme Biotech Co., Ltd, Nanjing, China), 0.2 µL TaqMan Probe (10 µM), 0.4 µL DIV1-qF (10 µM), 0.4 µL DIV1-qR (10 µM), 8 µL ddH2O, and 1 µL template DNA. The thermal cycling conditions included denaturation at 37°C for 2 min, followed by 95°C for 5 min, and 40 cycles of 95°C for 10 s and 60°C for 30 s. DIV1 load was determined based on the standard curve, DNA concentration, and the obtained cycle threshold (Ct) values. Results were presented as the mean ± standard deviation (SD). Statistical differences in DIV1 loads between the susceptible and resistant families were analyzed using Student’s t-test, with significance levels indicated as p < 0.05 (*), p < 0.01 (**), and p < 0.001 (***).
2.6 RNA extraction, library construction, transcriptome sequencing, and read mapping
Total RNA was extracted from the hepatopancreas tissue using TRIzol® Reagent (Qiagen, Germany) according to the manufacturer’s instructions. RNA quality was assessed using the 5300 Bioanalyzer (Agilent, USA) and quantified with the NanoDrop 2000 (Thermo Fisher Scientific, CA, USA). RNA was isolated, purified, and converted to cDNA according to the protocols provided by the respective reagent kits. RNA-seq libraries were prepared using 1 μg of total RNA per sample with the Illumina® Stranded mRNA Prep, Ligation Kit (San Diego, CA). Briefly, messenger RNA (mRNA) was enriched using the polyA selection method with oligo (dT) beads and fragmented with fragmentation buffer. First-strand cDNA synthesis was followed by end repair, phosphorylation, and adapter ligation, as per the library preparation protocol. cDNA fragments ranging from 300 to 400 bp were size-selected using magnetic beads and amplified by PCR for 15 cycles. After quantification with Qubit 4.0 (Thermo Fisher Scientific, USA), the libraries were sequenced on the NovaSeq X Plus platform (PE150) using the NovaSeq Reagent Kit (Illumina, USA). Raw paired-end reads were trimmed and quality checked using fastp (36). Clean reads were subsequently mapped to the M. rosenbergii reference genome (GCF_040412425.1, https://www.ncbi.nlm.nih.gov/datasets/genome/GCF_040412425.1/) with HISAT2 (37) in orientation mode. The mapped reads were assembled using StringTie (38).
2.7 Differential expression analysis and functional enrichment
DEGs between the susceptible (S2-2) and resistant (R27-1) families were identified by quantifying transcript expression in transcripts per million reads (TPM), with gene abundance estimated by RSEM (39). Differential expression analysis was performed using DESeq2 (40), and genes with |log2FC| ≥ 1 and false discovery rate (FDR) < 0.05 were considered significantly differentially expressed. To further explore the biological significance of these DEGs, KEGG pathway enrichment analysis was performed, with significantly enriched pathways identified based on Bonferroni-corrected p-values < 0.05.
2.8 Sample DNA extraction, PCR amplification, and sequencing library construction
Total microbial genomic DNA was extracted from samples using the E.Z.N.A.® Soil DNA Kit (Omega Bio-tek, Norcross, GA, USA) following the manufacturer’s instructions. The quality of the extracted DNA was assessed by 2% agarose gel electrophoresis, and its concentration and purity were measured using a NanoDrop2000 (Thermo Scientific, USA). The V3–V4 hypervariable regions of the 16S rRNA gene were amplified using the barcoded primers 338F (5’-ACTCCTACGGGAGGCAGCAG-3’) and 806R (5’-GGACTACHVGGGTWTCTAAT-3’) (41). Each 20 μL PCR reaction contained 10 μL of 2× Pro Taq buffer, 0.8 μL of each primer (5 μM), 10 ng of template DNA, and nuclease-free water to volume. The thermal cycling conditions were as follows: initial denaturation at 95°C for 3 min, followed by 29 cycles of 95°C for 30 s, 53°C for 30 s, and 72°C for 45 s, with a final extension at 72°C for 10 min. Amplification was performed using an ABI GeneAmp® 9700 thermal cycler (Applied Biosystems, USA). PCR products were verified using 2% agarose gel electrophoresis and purified using a DNA gel cleanup kit (Yuhua, China). Purified amplicons were quantified using a Qubit 4.0 fluorometer (Thermo Fisher Scientific, USA). Sequencing libraries were constructed using the NEXTFLEX® Rapid DNA-Seq Kit (PerkinElmer, USA) following the manufacturer’s protocol, which includes (1): adapter ligation (2), removal of self-ligated adapters using magnetic beads (3), PCR enrichment of the library, and (4) final purification using magnetic beads.
2.9 High-throughput sequencing data analysis
Raw paired-end sequencing reads were quality-filtered using fastp (v0.19.6) (36) (https://github.com/OpenGene/fastp), and merged using FLASH (v1.2.11) (42) (http://www.cbcb.umd.edu/software/flash) following these steps (1): Bases with a quality score < 20 at the ends of the reads were trimmed. A 50 bp sliding window was applied, and bases were trimmed from the end if the average quality score within the window dropped below 20. Reads shorter than 50 bp in length after trimming or containing ambiguous bases (N) were discarded (2); Paired-end reads were merged based on an overlap of ≥10 bp (3); The maximum mismatch rate allowed in the overlap region was 0.2, and sequences not meeting this criterion were discarded (4); Reads were assigned to samples based on barcode and primer sequences at both ends: zero mismatches were allowed for barcodes and up to two mismatches for primers. The processed sequences were clustered into Operational Taxonomic Units (OTUs) using UPARSE v7.1 (43) (http://drive5.com/uparse/) with a 97% similarity threshold. Chimeric sequences, as well as chloroplast and mitochondrial sequences, were removed. To minimize the impact of sequencing depth on downstream alpha and beta diversity analyses, all samples were rarefied to 50,406 sequences. Taxonomic classification of OTUs was performed using the RDP Classifier (v2.11) (44) (http://rdp.cme.msu.edu/) against the Silva 16S rRNA database (v138) with a confidence threshold of 70%. The Shannon diversity index was calculated using mothur (45) (http://www.mothur.org/wiki/Calculators), and inter-group alpha diversity differences were assessed using the Wilcoxon rank-sum test. Principal coordinates analysis (PCoA) based on Bray-Curtis dissimilarity was conducted to assess microbial community structure. PERMANOVA was used to test for significant differences in beta diversity among groups. LEfSe (Linear Discriminant Analysis Effect Size) [(LDA > 2, p < 0.05)] was applied to identify differentially abundant bacterial taxa across groups at multiple taxonomic levels.
3 Results
3.1 Assessing DIV1 susceptible and resistant families of Macrobrachium rosenbergii
Figure 1A presents the cumulative mortality rates of the 46 tested families at day 14 post-DIV1 injection. Families 78-2 (30% mortality) and 69-2 (91% mortality) were excluded from further experiments due to limited sample sizes. Instead, family 27-1 (43% mortality) and family 2-2 (89% mortality), which exhibited the second-lowest and second-highest mortality rates, respectively, were selected to represent the resistant (R27-1) and susceptible (S2-2) families for subsequent analyses. Figure 1B shows the survival curves of families 27-1, 2-2, and all experimental families following DIV1 infection, revealing a statistically significant difference in mortality between families 27–1 and 2-2 (Log-rank test, p < 0.0001). TaqMan probes and primers targeting the ATPase gene of DIV1 were used to quantify the viral loads in shrimp muscles. DIV1 was undetectable in the muscles of both uninfected R27–1 and S2–2 lines. At 24 hpi, the viral copy number in S2–2 was approximately 2.4-fold higher than that in R27-1. By 48 hpi, viral loads in S2–2 were significantly elevated (Student’s t-test, p < 0.05), reaching levels ~15.7-fold higher than those in R27-1 (Figure 1C).
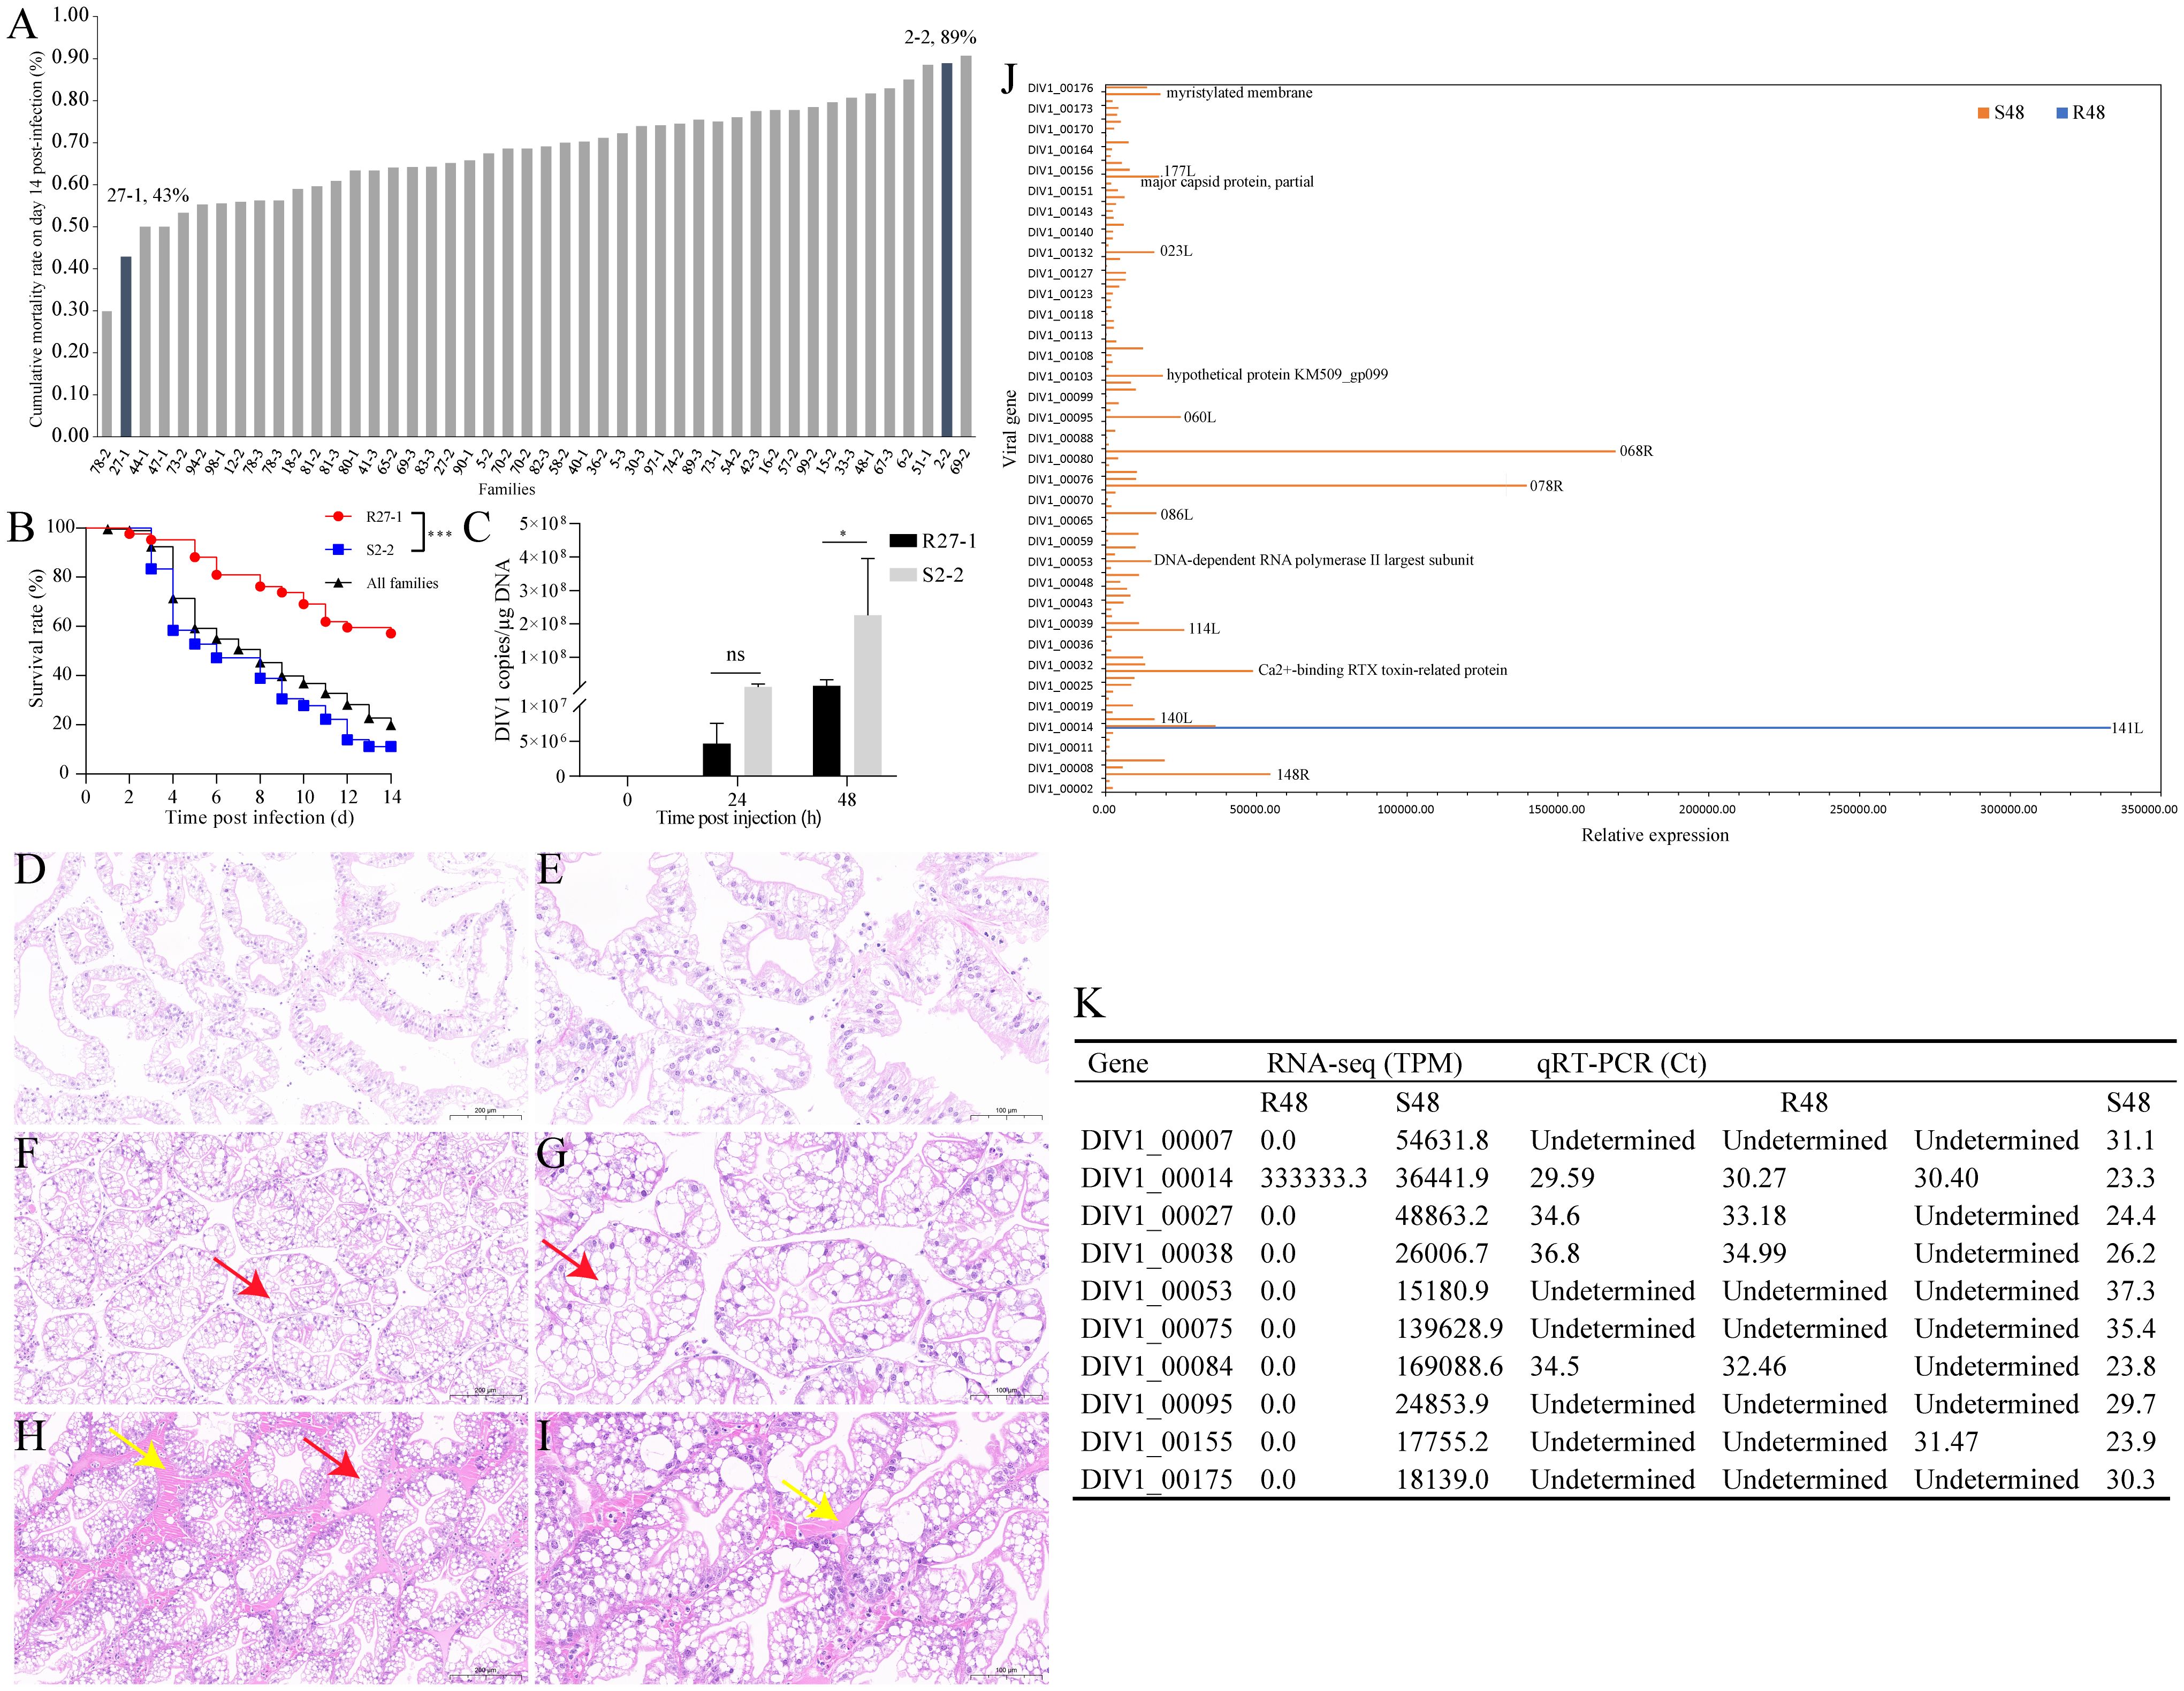
Figure 1. Assessing DIV1 susceptible and resistant families of M. rosenbergii. (A) Cumulative mortality rates on day 14 post injection of the tested 46 families. (B) Survival rate of families R27-1, S2-2, and all experimental families following DIV1 infection. Significant difference between families R27–1 and S2–2 is indicated with *** (Log-Rank test, p < 0.0001). (C) DIV1 copy numbers in the hepatopancreas from DIV1-infected shrimp of R27–1 and S2–2 families. Data are represented as mean ± S.D. (n = 4). Significant differences between the two families at 24 hpi and 48 hpi are indicated with * (Student’s t-test, p < 0.05). ns means no significant difference. (D–I) Histopathological examination of H&E-stained hepatopancreas samples from the control group (D, E), the resistant family group (F, G), and the susceptible family group (H, I) of M. rosenbergii. The red arrows indicated cytoplasmic vacuoles, while the yellow arrows indicated eosinophilic material. Scale bars: 200 μm (D, F, H) and 100 μm (E, G, I). (J) The viral gene sequences detected in the transcriptome data of families R27–1 and S2–2 at 48 hours post-DIV1 infection. (K) qRT-PCR validation of 10 key differentially expressed viral transcripts.
3.2 Histopathological observations
As shown in Figures 1D–I, the hepatopancreas of the control group exhibited an intact structure with loosely arranged tubules and normal morphology. In comparison to the control group, the hepatopancreatic tubules of the resistant R27–1 family were more compactly arranged, with mild atrophy of the tubule lumen and evident cytoplasmic vacuolization (red arrow). In contrast, the hepatopancreas of the susceptible S2–2 family showed a markedly denser arrangement of tubules, with severe atrophy of the tubule lumen, extensive cytoplasmic vacuolization, and prominent deposition of eosinophilic material in the stroma (yellow arrow). These histopathological differences observed at 48 hours post-DIV1 infection supported the variations in viral loads between the two families, further substantiating the significant differences in their susceptibility to DIV1.
3.3 Viral genes detected in transcriptomic data
Previously, we performed whole-genome sequencing of DIV1, resulting in a complete genome assembly and preliminary gene annotation. The assembled genome is 166,964 bp in length, with a GC content of 34.56%, and contains 176 predicted open reading frames (ORFs). To evaluate viral transcriptional activity during infection, we aligned quality-controlled RNA-seq data to the DIV1 genome (GenBank accession number: PQ724921). No viral transcripts were detected in either the resistant or susceptible family groups at 0 and 24 hpi. In contrast, at 48 hpi, only one viral transcript (DIV1_00014) was detected in the resistant group, whereas transcripts corresponding to 103 DIV1-encoded genes were identified in the susceptible group (Figure 1J, Supplementary Table S2). Although the functions of most viral genes remain uncharacterized, several annotated genes were identified among the detected transcripts, including DNA-dependent RNA polymerase II largest subunit, Ca2+-binding RTX toxin-related protein, major capsid protein, partial, and myristylated membrane. To confirm the accuracy of the RNA-seq data, we performed qRT-PCR validation on 10 key differentially expressed viral transcripts, which showed expression trends consistent with the transcriptomic results, further supporting the reliability of our analysis (Figure 1K). Primers were shown in Supplementary Table S1.
3.4 Transcriptome sequencing data
A total of 18 samples were subjected to transcriptome sequencing. Each sequencing library generated between 42,051,634 and 52,033,436 raw reads. Following quality control, 41,699,334 to 51,644,420 clean reads were retained, with each sample yielding over 6.24 Gb of clean data. The proportion of bases with a quality score ≥Q30 exceeded 96% across all samples, indicating high sequencing accuracy (Supplementary Table S3), indicating high sequencing quality. Clean reads were subsequently aligned to the M. rosenbergii reference genome, with mapping rates ranging from 92.86% to 95.38% (Supplementary Table S4). The genomic distribution of mapped reads was analyzed across different genomic features, including coding sequences (CDSs), introns, intergenic regions, and 5’ and 3’ untranslated regions (UTRs). Among all samples, the highest proportion of mapped reads localized to CDS regions (56.93%–70.89%), followed by 3’ UTRs (14.24%–28.10%), 5’ UTRs (8.29%–10.55%), introns (3.51%–5.72%), and intergenic regions (1.35%–3.31%) (Supplementary Table S5). Additionally, chromosomal distribution of the mapped reads revealed the highest read densities on chromosomes NC_089753.1, NC_089747.1, and NC_089741.1 (Supplementary Figure 1).
3.5 Overall transcriptome comparison between the R27–1 and S2–2 families in the absence and presence of infection
Correlation and PCA analyses were performed based on the gene expression matrix to evaluate global transcriptomic differences between the R27–1 and S2–2 families. Correlation analysis assessed the consistency of gene expression among samples, while PCA evaluated overall clustering patterns. As shown in the correlation heatmaps (Figures 2A–C) and PCA plots (Figures 2D–F), there were no significant differences in gene expression profiles between the R27–1 and S2–2 families at 0 h and 24 hpi. In contrast, at 48 hpi, a marked transcriptomic divergence between the two families was observed, with distinct clustering of samples based on family type. Notably, the resistant S2–2 family exhibited a tighter clustering pattern than the susceptible R27–1 family, indicating a more consistent transcriptional response to DIV1 infection. Differential expression analysis identified 144 (71 upregulated and 73 downregulated), 68 (20 upregulated and 48 downregulated), and 1170 (471 upregulated and 699 downregulated) DEGs in the S2–2 family relative to the R27–1 family at 0 h, 24 hpi, and 48 hpi, respectively (Figures 2G–I). The complete lists of DEGs across time points are provided in Supplementary File S1. A Venn diagram analysis revealed three DEGs shared across all comparisons (S0 vs R0, S24 vs R24, and S48 vs R48), including an uncharacterized long non-coding RNA (lncRNA), an esterase E4-like protein, and a CUB-serine protease (Figure 2J). Clustering heatmap analysis further showed that the relative expression of LOC136854184 (CUB-serine protease) was consistently higher in the resistant S2–2 family compared to the susceptible R27–1 family at all time points (Figures 2K, L).
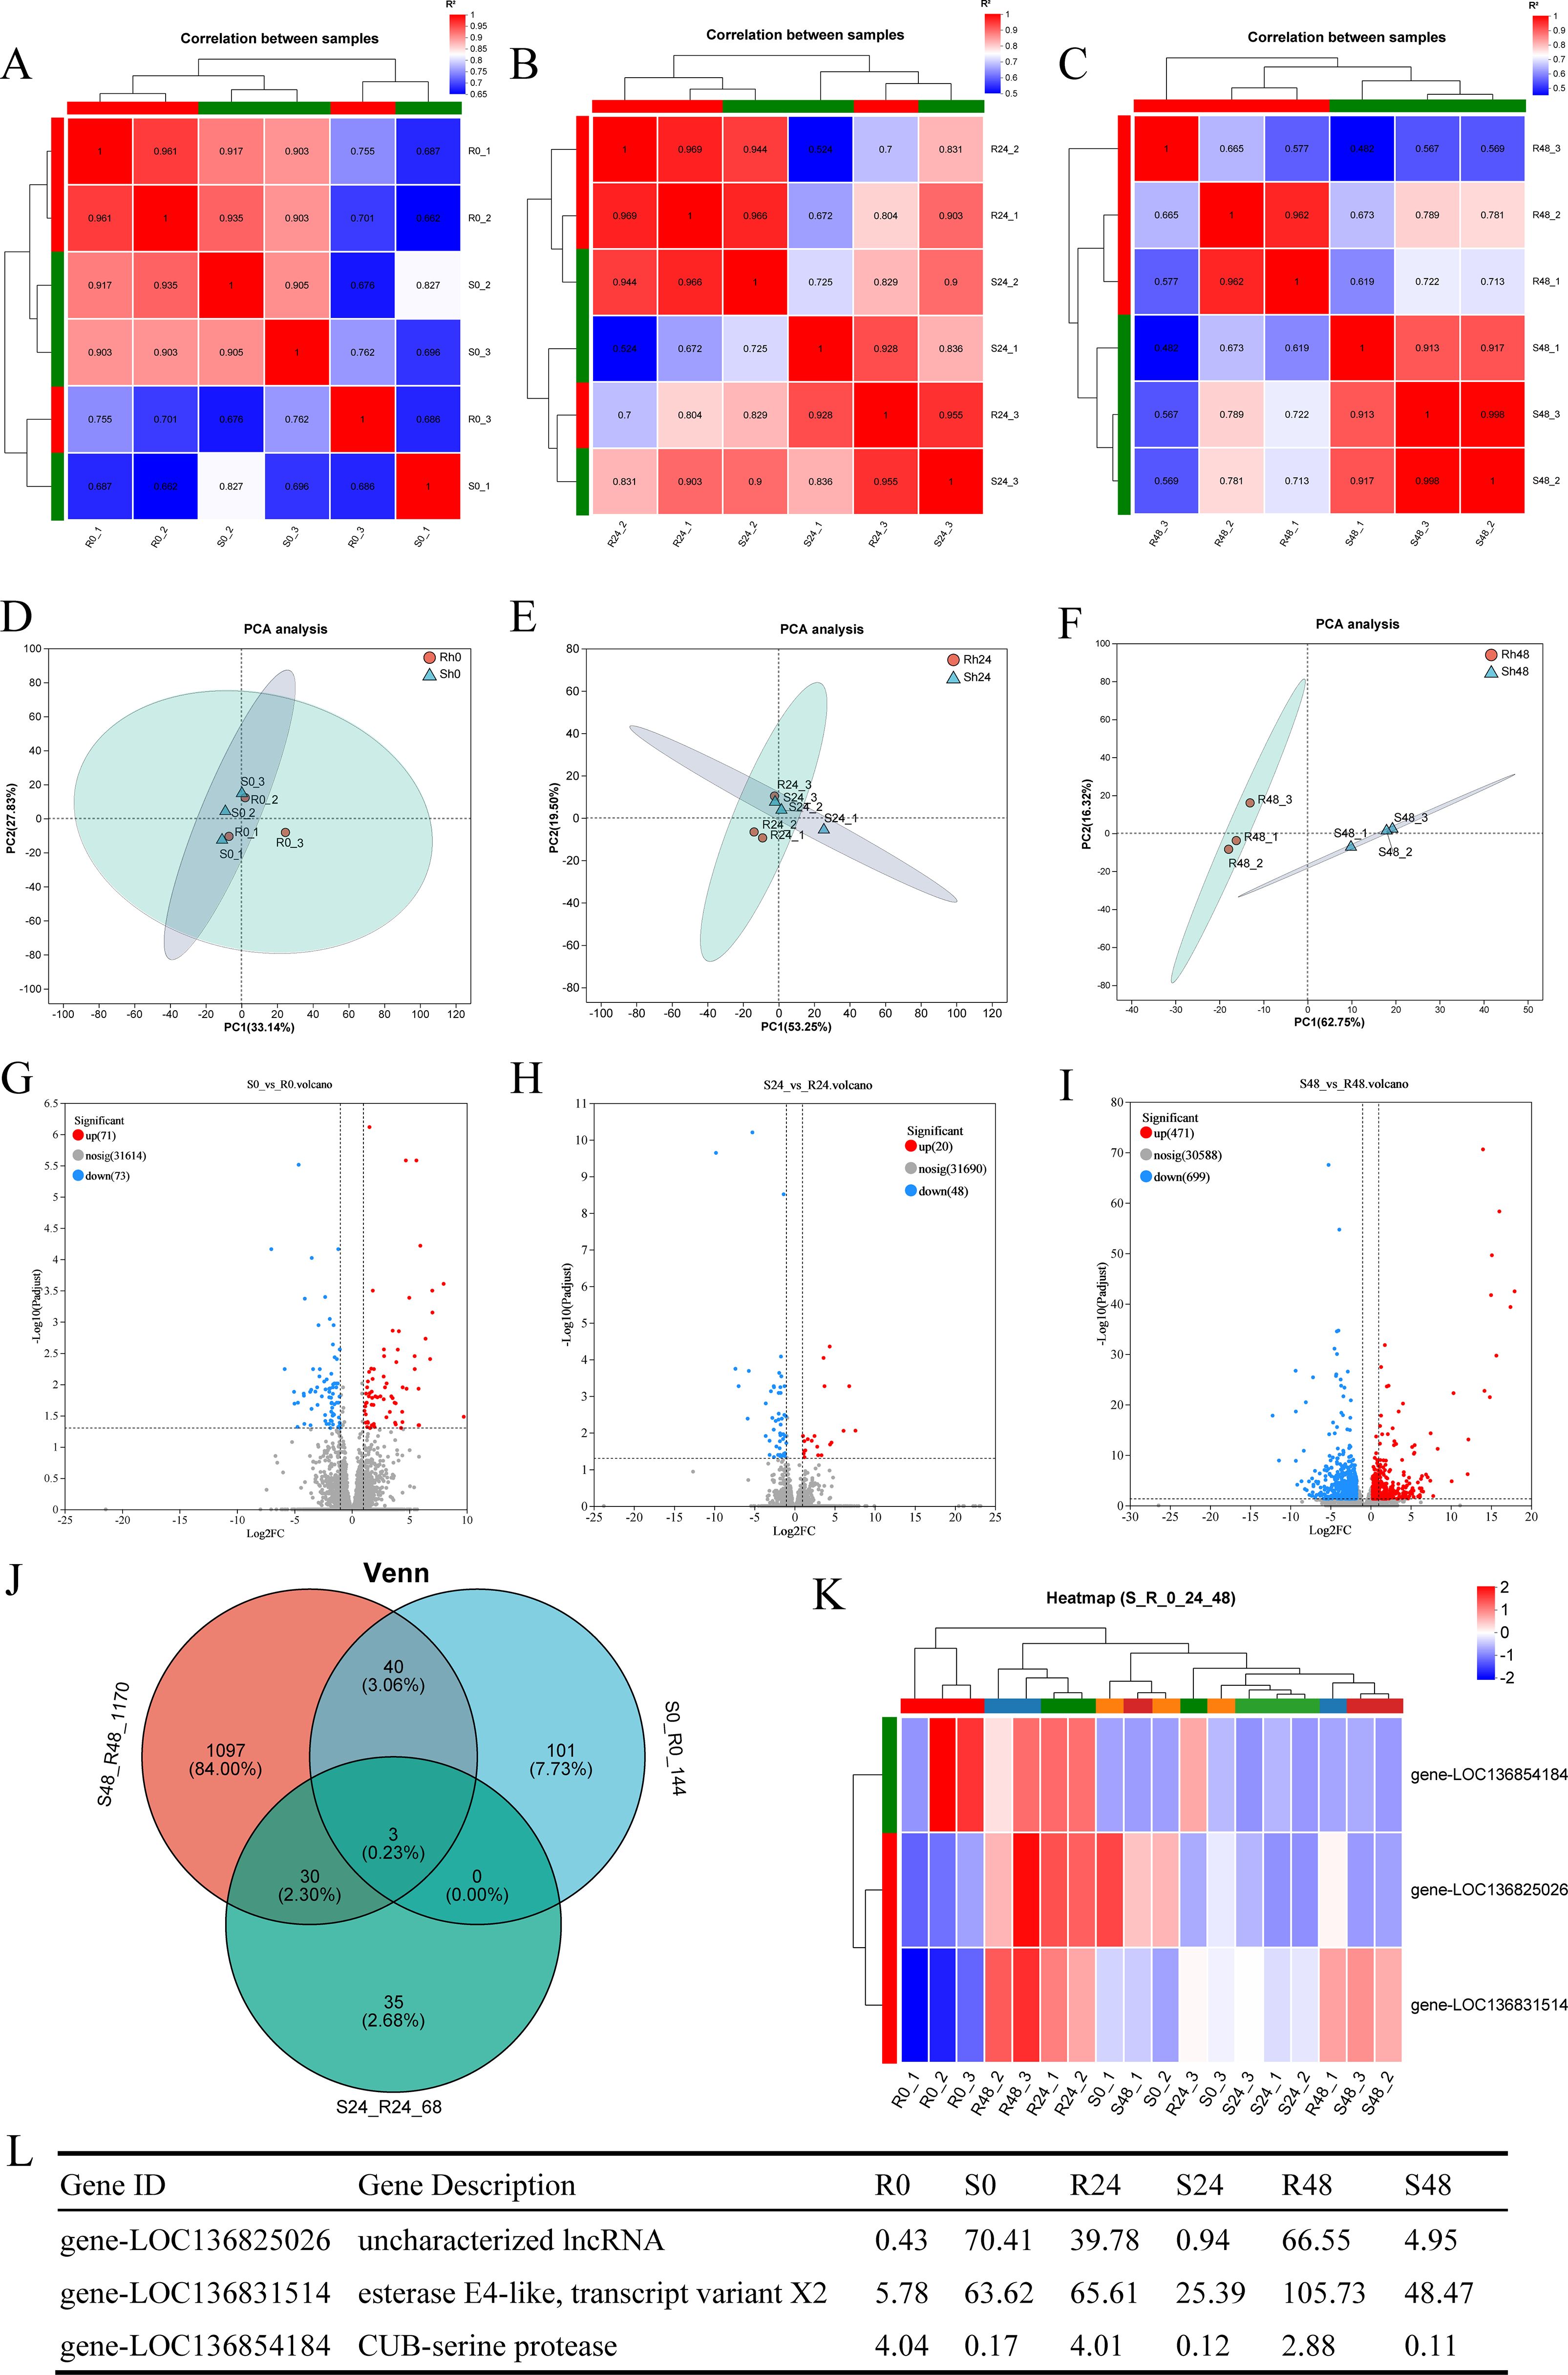
Figure 2. (A–C) Correlation heatmap of gene expression among samples from families R27–1 and S2–2 at 0 h, 24 hpi, and 48 hpi. (D–F) Principal Component Analysis (PCA) of gene expression among samples from families R27–1 and S2–2 at 0 h, 24 hpi, and 48 hpi. (G–I) Volcano plot of differential gene expression comparing S0 vs R0, S24 vs R24, and S48 vs R48. “Up” denotes genes significantly upregulated in the susceptible family S2–2 compared to R27-1, while “Down” indicates genes significantly upregulated in the resistant family R27-1. (J) Venn diagram analysis across all three comparison groups: S0 vs R0, S24 vs R24, and S48 vs R48. (K) Clustering analysis of the relative expression levels of the 3 shared DEGs across all comparisons. The colors in the graph represent the expression levels of the gene in each sample after normalization, with red indicating higher expression and blue indicating lower expression in that sample. (L) Gene expression levels of the 3 shared DEGs in different groups.
3.6 Clustering and KEGG enrichment analyses of the DEGs between the R27–1 and S2–2 families
Hierarchical clustering was performed on the DEGs at each time point to explore expression differences between the R27–1 and S2–2 families. Gene clustering used the Average method, and sample clustering used the Complete method, with Euclidean distance for both. As shown in Figures 3A–C, the 144 DEGs at 0 h, 68 DEGs at 24 hpi, and 1,170 DEGs at 48 hpi were divided into two major clusters, clearly separating the resistant and susceptible families based on their transcriptomic profiles. To further elucidate functional differences, KEGG pathway enrichment analysis was conducted on the DEGs from the S0 vs R0 comparison. Specifically, 71 DEGs highly expressed in the susceptible family and 73 DEGs highly expressed in the resistant family were analyzed (Figure 3D). In the susceptible S2–2 family, the enriched pathways included Melanogenesis (10 genes), Tyrosine metabolism (10 genes), NF-kappa B signaling pathway (2 genes), Pyruvate metabolism (2 genes), and Glycolysis/Gluconeogenesis (2 genes). In contrast, DEGs upregulated in the resistant R27–1 family were significantly enriched in immune and endocrine-related pathways, such as Kaposi sarcoma-associated herpesvirus infection (3 genes), Th17 cell differentiation (2 genes), TNF signaling pathway (2 genes), Prolactin signaling pathway (2 genes), Acute myeloid leukemia (2 genes), JAK-STAT signaling pathway (2 genes), and Steroid hormone biosynthesis (2 genes) (Figure 3E). A detailed summary of DEGs enriched in these pathways is provided in Table 1.
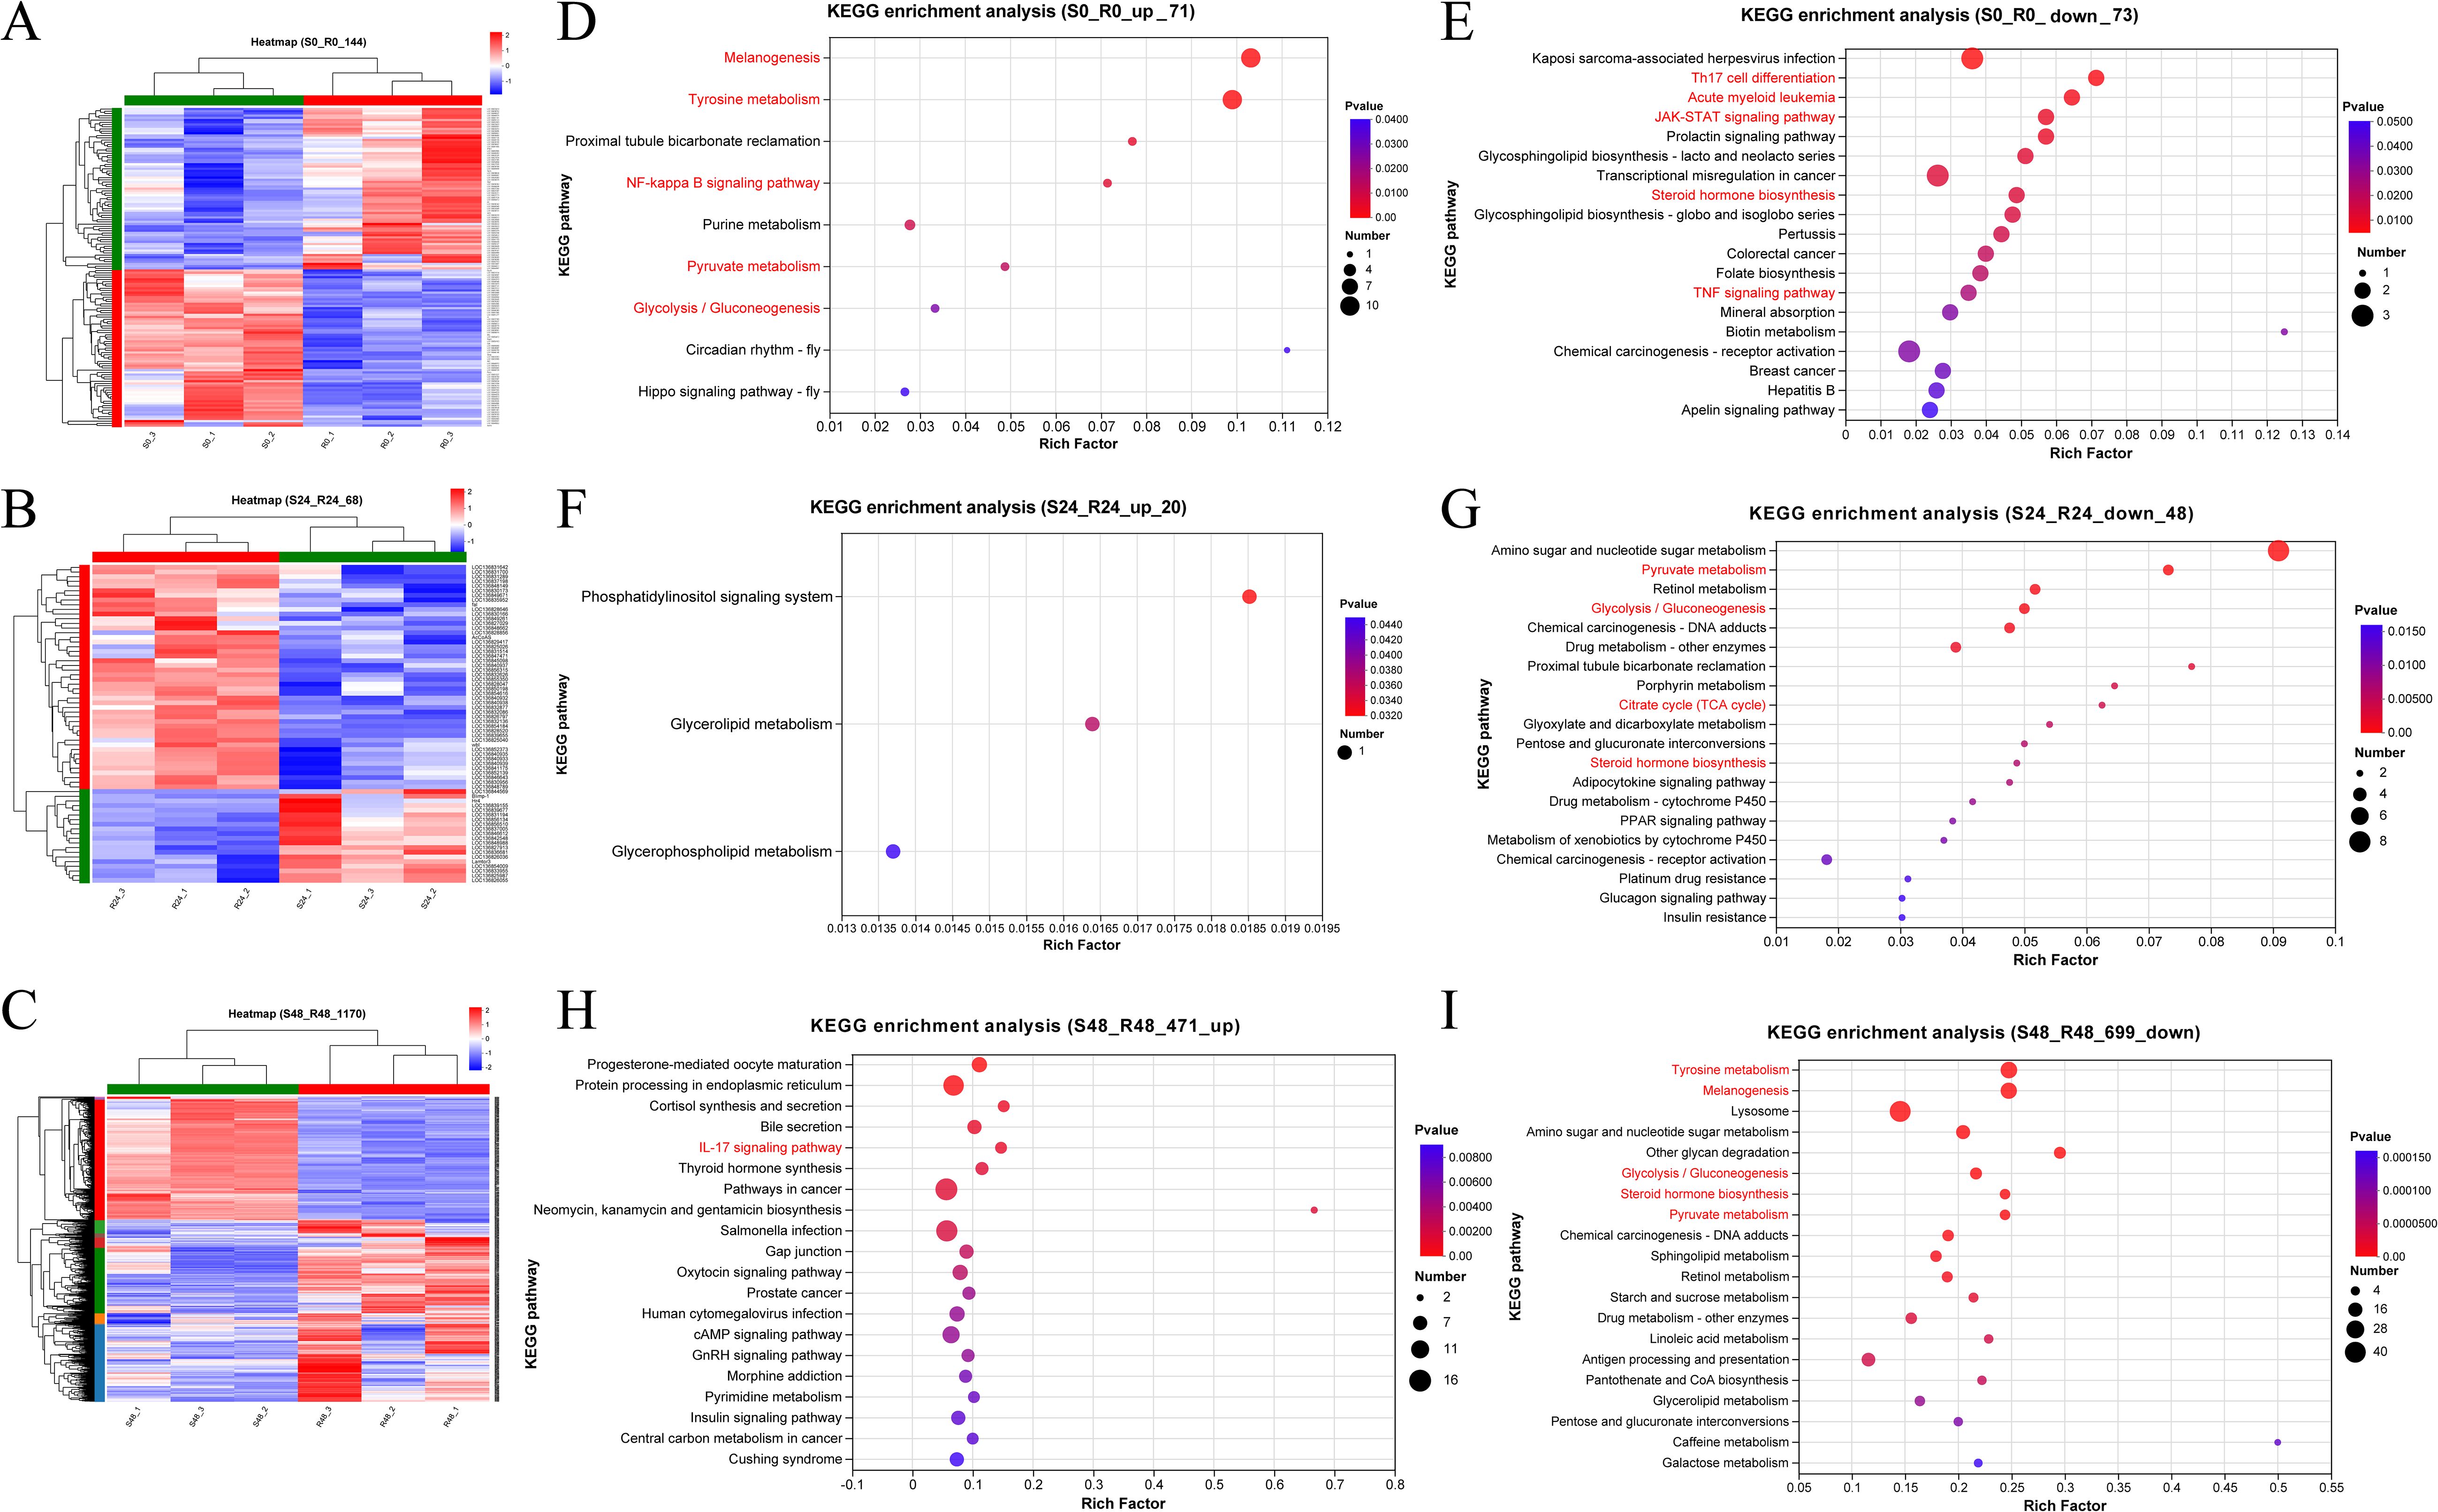
Figure 3. Hierarchical clustering analysis of the relative expression levels of 144 DEGs at 0 h (A), 68 DEGs at 24 hpi (B), and 1170 DEGs at 48 hpi (C) from the comparison between S2–2 and R27-1. The gene clustering was performed using the Average linkage method, and the sample clustering used the Complete linkage method, with Euclidean distance as the distance measure for both gene and sample clustering. KEGG functional enrichment analysis was performed on 71 significantly up-regulated DEGs (D) and 73 significantly down-regulated DEGs (E) at 0 hours; 20 up-regulated DEGs (F) and 48 down-regulated DEGs (G) at 24 hpi; and 471 up-regulated DEGs (H) and 699 down-regulated DEGs (I) at 48 hpi, based on the comparison between S2–2 and R27-1. The pathways marked in red represent important or of interest metabolic and immune-related pathways.
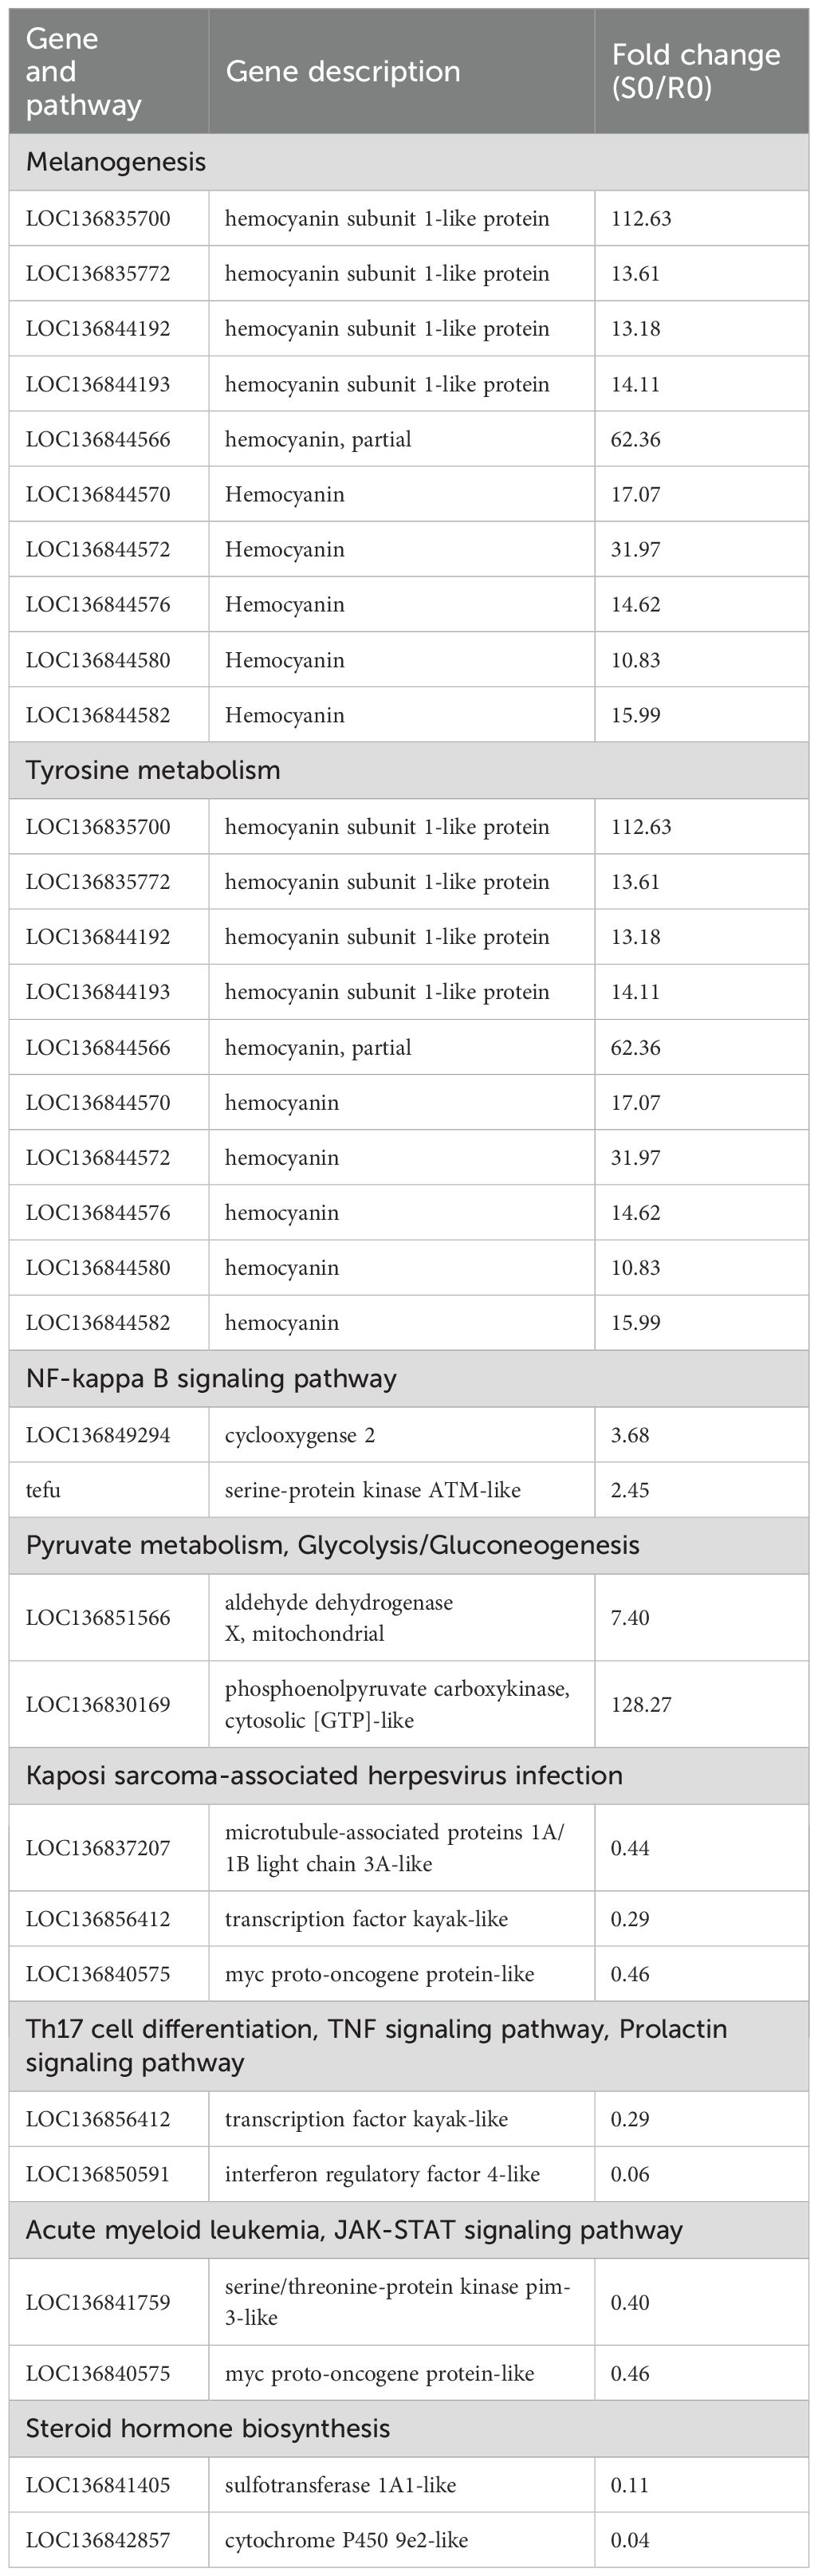
Table 1. The DEGs significantly enriched in several pathways under the naïve condition.
At 24 hpi, KEGG enrichment analysis revealed that the 20 DEGs highly expressed in the susceptible family were primarily enriched in the Phosphatidylinositol signaling system (1 gene) (Figure 3F). In contrast, the 48 DEGs upregulated in the resistant family were enriched in Amino sugar and nucleotide sugar metabolism (8 genes), Pyruvate metabolism (3 genes), and Glycolysis/Gluconeogenesis (3 genes) (Figure 3G). For the S48 vs R48 comparison at 48 hpi, the 471 DEGs highly expressed in the susceptible family were significantly enriched in pathways related to reproduction, protein processing, and hormone response, including Progesterone-mediated oocyte maturation (8 genes), Protein processing in the endoplasmic reticulum (14 genes), and Cortisol synthesis and secretion (5 genes) (Figure 3H). Meanwhile, the 699 DEGs highly expressed in the resistant family were predominantly enriched in Tyrosine metabolism (25 genes), Melanogenesis (24 genes), Lysosome (40 genes), and Amino sugar and nucleotide sugar metabolism (18 genes) (Figure 3I). A comprehensive summary of DEGs enriched in these pathways is presented in Table 2.
Table 2. The DEGs in the top 4 significantly enriched pathways of the 699 DEGs at 48 hpi.
3.7 Comparison of the transcriptome profiles between the R27–1 and S2–2 families
KEGG enrichment analysis revealed that transcriptomic differences between the resistant and susceptible families were primarily associated with immune regulation and metabolic pathways (Figure 3). In line with these findings, Table 3 presents the top 20 DEGs that were significantly up- or down-regulated in the S2–2 family compared to the R27–1 family under both uninfected and DIV1-infected conditions, providing a representative overview of the overall transcriptomic variation. Under un-infected conditions, genes encoding alkaline phosphatase-like, Friend leukemia integration 1 transcription factor-like, cytochrome P450 9e2-like, interferon regulatory factor 4-like, dual specificity protein phosphatase 10-like, trypsin II-P29-like, cytochrome c oxidase subunit III, histone H1-delta-like, sodium/calcium exchanger Calx-like, and short coiled-coil protein homolog were highly expressed in the resistant R27–1 family. In contrast, higher expression levels were observed in the susceptible S2–2 family for transcripts including an uncharacterized lncRNA, phosphoenolpyruvate carboxykinase (cytosolic [GTP]-like), hemocyanin subunit 1-like, hemocyanin B chain-like, myosin heavy chain (muscle-like), clotting factor G beta subunit-like, vrille, and mitochondrial D-beta-hydroxybutyrate dehydrogenase-like.
Table 3. Top 20 up- and down-regulated DEGs in hepatopancreas samples between the resistant and susceptible families under naïve and infected conditions.
The differential expression of the Melanogenesis pathway between the two families prompted further analysis. Interestingly, in the uninfected state, the resistant family R27–1 exhibited lower expression of several genes within this pathway compared to the susceptible family S2-2 (Figure 4A). However, by 48 hours post-DIV1 infection, the expression levels of these genes were higher in the resistant family (Figure 4B), including genes encoding hemocyanin subunits, frizzled-2-like isoform X1, and norpA. In addition, in the uninfected state, two DEGs—aldehyde dehydrogenase X and phosphoenolpyruvate carboxykinase—were highly expressed in the susceptible family and enriched in the Glycolysis/Gluconeogenesis pathway. At 24 hpi and 48 hpi, 3 (Figure 4C) and 12 DEGs (Figure 4D), respectively, were highly expressed in the resistant family and similarly enriched in this pathway.
Figure 4. Heatmap of the relative expression levels of DEGs at 0 h (A) and 48 hpi (B) mapped to the Melanogenesis pathway. Heatmap of the relative expression levels of DEGs at 24 hpi (C) and 48 hpi (D) mapped to the Glycolysis/Gluconeogenesis. (E) Heatmap of the relative expression levels of DEGs mapped to Steroid hormone biosynthesis at 48 hpi across all samples.
Another notable pathway was Steroid hormone biosynthesis, which was significantly enriched in the DEGs highly expressed in the resistant family across both uninfected and infected states (Figures 3E, G, I). This pathway is intimately linked to lipid metabolism and is essential for the synthesis of steroid hormones that regulate a wide array of physiological processes. The DEGs involved in this pathway include: 3 beta-hydroxysteroid dehydrogenase/Delta 5–>4-isomerase-like, Cytochrome P450 9e2-like, Cytochrome P450 2L1-like, UDP-glycosyltransferase UGT5-like, UDP-glycosyltransferase UGT5-like, Sulfotransferase 1C4-like, UDP-glycosyltransferase UGT5-like, Cytochrome P450 9e2-like, Cytochrome P450 3A31-like, UDP-glycosyltransferase UGT5-like (Figure 4E).
3.8 Differences in intestinal microbial community composition between R27–1 and S2–2 families
Shannon diversity indices and Wilcoxon rank-sum tests were used to evaluate gut microbiota diversity between the resistant and susceptible families. At 0 h, no significant difference was observed between the two groups (S0: 1.22; R0: 1.33; Figure 5A). However, at 24 hpi, the Shannon index of the susceptible group (S24: 2.27) was significantly higher than that of the resistant group (R24: 1.14), and also notably increased compared to S0. In contrast, the diversity of the resistant family remained relatively stable from R0 to R24 (Figure 5B). At 48 hpi, the resistant family exhibited significantly higher diversity (R48: 2.18) than the susceptible group (S48: 0.76; Figure 5C). These results were further supported by the Chao and Simpson indices, as shown in Supplementary Figure 2. Principal coordinate analysis (PCoA) further revealed marked differences in community composition between the two families, with PC1 and PC2 explaining 80.02%, 79.14%, and 70.28% of the variation at 0, 24, and 48 hpi, respectively (Figures 5D–F).
Figure 5. Shannon index-based microbial diversity for S0 vs R0 (A), S24 vs R24 (B), and S48 vs R48 (C). Wilcoxon test was used to detect the variation between families R27–1 and S2-2. “*”: p < 0.05. (D–F) Principal Coordinates Analysis (PCoA) at the OTU level was performed to compare the gut microbiome composition between the susceptible and resistant families at three time points: S0 vs. R0, S24 vs. R24, and S48 vs. R48. (G–I) Venn plot at the OTU level for S0 vs R0, S24 vs R24, and S48 vs R48. (J–L) Bar plot of community composition showing the relative abundance of dominant taxa at the genus level across all samples and the proportion of different taxa at 0 h, 24 hpi, and 48 hpi. (M–O) Lefse multilevel species differential analysis. The bar plot displays the LDA scores of differential species in resistant and susceptible families at 0 h (M), 24 hpi (N), and 48 hpi (O), visually showing the impact of marker taxa on the differential effects. The LDA bar plot statistically identifies microbial taxa with significant effects, with higher LDA scores indicating a greater influence of species abundance on the differential effects.
The intestinal microbial communities of the resistant and susceptible families showed distinct differences at the OTU level. At 0 h, a total of 244 OTUs (44.28% of all identified OTUs) were shared between the two families, with 99 OTUs (17.97%) unique to the R27–1 family and 208 OTUs (37.75%) unique to the S2–2 family (Figure 5G). At 24 hpi, 191 OTUs (34.73%) were shared, with 21 OTUs (3.82%) specific to the resistant family and 338 OTUs (61.45%) specific to the susceptible family (Figure 5H). By 48 hpi, 238 OTUs (38.76%) were shared, whereas 347 OTUs (56.51%) were unique to the resistant family and only 29 OTUs (4.72%) to the susceptible family (Figure 5I).
Regarding the relative abundance (RA) of specific taxa at the genus level, Citrobacter (RA: 39.55% in the resistant group vs. 8.38% in the susceptible group), Candidatus Hepatoplasma (RA: 25.51% vs. 4.15%), unclassified f:Mycoplasmataceae (RA: 6.62% vs. 0.66%), Kluyvera (RA: 2.20% vs. 0.23%), and Enterococcus (RA: 0.51% vs. 0.03%) were more abundant in the resistant family. In contrast, Lactococcus (RA: 22.63% vs. 70.88%), Leucobacter (RA: 0.003% vs. 1.86%), Roseateles (RA: 0.15% vs. 1.63%), Sphingomonas (RA: 0.13% vs. 1.58%), and Pseudomonas (RA: 0.10% vs. 0.91%) were more abundant in the susceptible family at 0 hours (Figure 5J). At 24 hpi, Lactococcus (RA: 57.01% vs. 35.01%), Citrobacter (RA: 19.98% vs. 12.31%), Candidatus Hepatoplasma (RA: 14.04% vs. 16.53%), and Aeromonas (RA: 4.08% vs. 0.04%) were more abundant in the resistant family. In contrast, Chitinibacter (RA: 0.57% vs. 5.70%), unclassified f:Mycoplasmataceae (RA: 0.88% vs. 5.11%), Acinetobacter (RA: 0.71% vs. 2.53%), Gemmobacter (RA: 0.29% vs. 2.77%), and Leifsonia (RA: 0.01% vs. 2.53%) were more abundant in the susceptible family (Figure 5K). At 48 hpi, unclassified f:Mycoplasmataceae (RA: 17.87% vs. 0.84%), Culicoidibacter (RA: 3.28% vs. 0.00%), Enterococcus (RA: 2.61% vs. 0.64%), Candidatus Hepatoplasma (RA: 3.06% vs. 0.09%), Gemmobacter (RA: 3.05% vs. 0.05%), Acinetobacter (RA: 1.47% vs. 0.23%), and Agromyces (RA: 1.54% vs. 0.02%) were more abundant in the resistant family. On the other hand, Lactococcus (RA: 45.42% vs. 66.52%) and Citrobacter (RA: 4.02% vs. 29.36%) were more abundant in the susceptible family (Figure 5L). The relative abundance data of differential microorganisms at different sampling points are provided in Supplementary File S2. LEfSe multi-level differential analysis was performed to assess species-level differences across taxonomic hierarchies. The taxa contributing most significantly to these differences were identified using linear discriminant analysis (LDA), which revealed that s:Lactococcus garvieae, g:Lactococcus, f:Streptococcaceae, and o:Lactobacillales in S0; f:Enterococcaceae, g:Enterococcus, and s:Enterococcus casseliflavus:g:Enterococcus in R0 (Figure 5M); p:Actinomycetota, c:Alphaproteobacteria, c:Actinobacteria, and o:Burkholderiales in S24; o:Lactobacillales, s:Lactococcus garvieae, g:Lactococcus, and f:Streptococcaceae in R24 (Figure 5N); f:Enterobacteriaceae and g:Citrobacter in S48; and f:Mycoplasmataceae and o:Mycoplasmatales in R48 had the greatest impact on the observed differences (Figure 5O). These results suggest that these taxa may play a crucial role in distinguishing the resistance to DIV1 in M. rosenbergii.
3.9 Associations between host DEGs and intestinal microbes
To investigate the relationships between host gene expression, the intestinal microbiome, and their potential roles in DIV1 resistance, we explored the associations between 29 DEGs (|log2(FoldChange)| > 1.00, adjusted p < 0.05) and the top 50 most abundant species in the absence of infection. We found resistant and susceptible family specific host-microbiome associations (|Spearman rank correlation| ≥ 0.5). In the Figure 6A, “*” denotes p < 0.05; “**” denotes p < 0.01; and “***” denotes p < 0.001. Interestingly, most microbes associated with the up- and down-expressed DEGs in the resistant family were also different (Figure 6A). That is, 19 microbes (Lactococcus_garvieae, uncultured_bacterium_g:Flavobacterium, unclassified_g:Pseudomonas, uncultured_Aquabacterium_sp._g:Aquabacterium, Bacillus_anthracis_g:Bacillus, uncultured_bacterium_g:Aurantimicrobium, Ensifer_adhaerens_g:Ensifer, unclassified_f:Rhizobiaceae, metagenome_g:Devosia, unclassified_g:Deinococcus, unclassified_g:Leifsonia, uncultured_Leucobacter_sp., unclassified_g:Acinetobacter, uncultured_bacterium_g:Legionella, uncultured_bacterium_g:Hyphomicrobium, Delftia_tsuruhatensis, unclassified_f:Comamonadaceae, unclassified_g:Roseateles, Pseudomonas_azotoformans_g:Pseudomonas) had negative associations with most up-expressed genes, but were positively associated with the down-expressed genes in the resistant family (Figure 6A). On the contrary, four microbes (Klebsiella_quasipneumoniae_g:Enterobacter, unclassified_g:Citrobacter, Kluyvera_georgiana_g:Kluyvera, and Enterococcus_casseliflavus) were positively associated with the up-expressed genes, but were negatively associated with the down-expressed genes in the resistant family (Figure 6A). These results suggest that these intestinal microbes might interact with the DEGs to modulate DIV1 resistance.
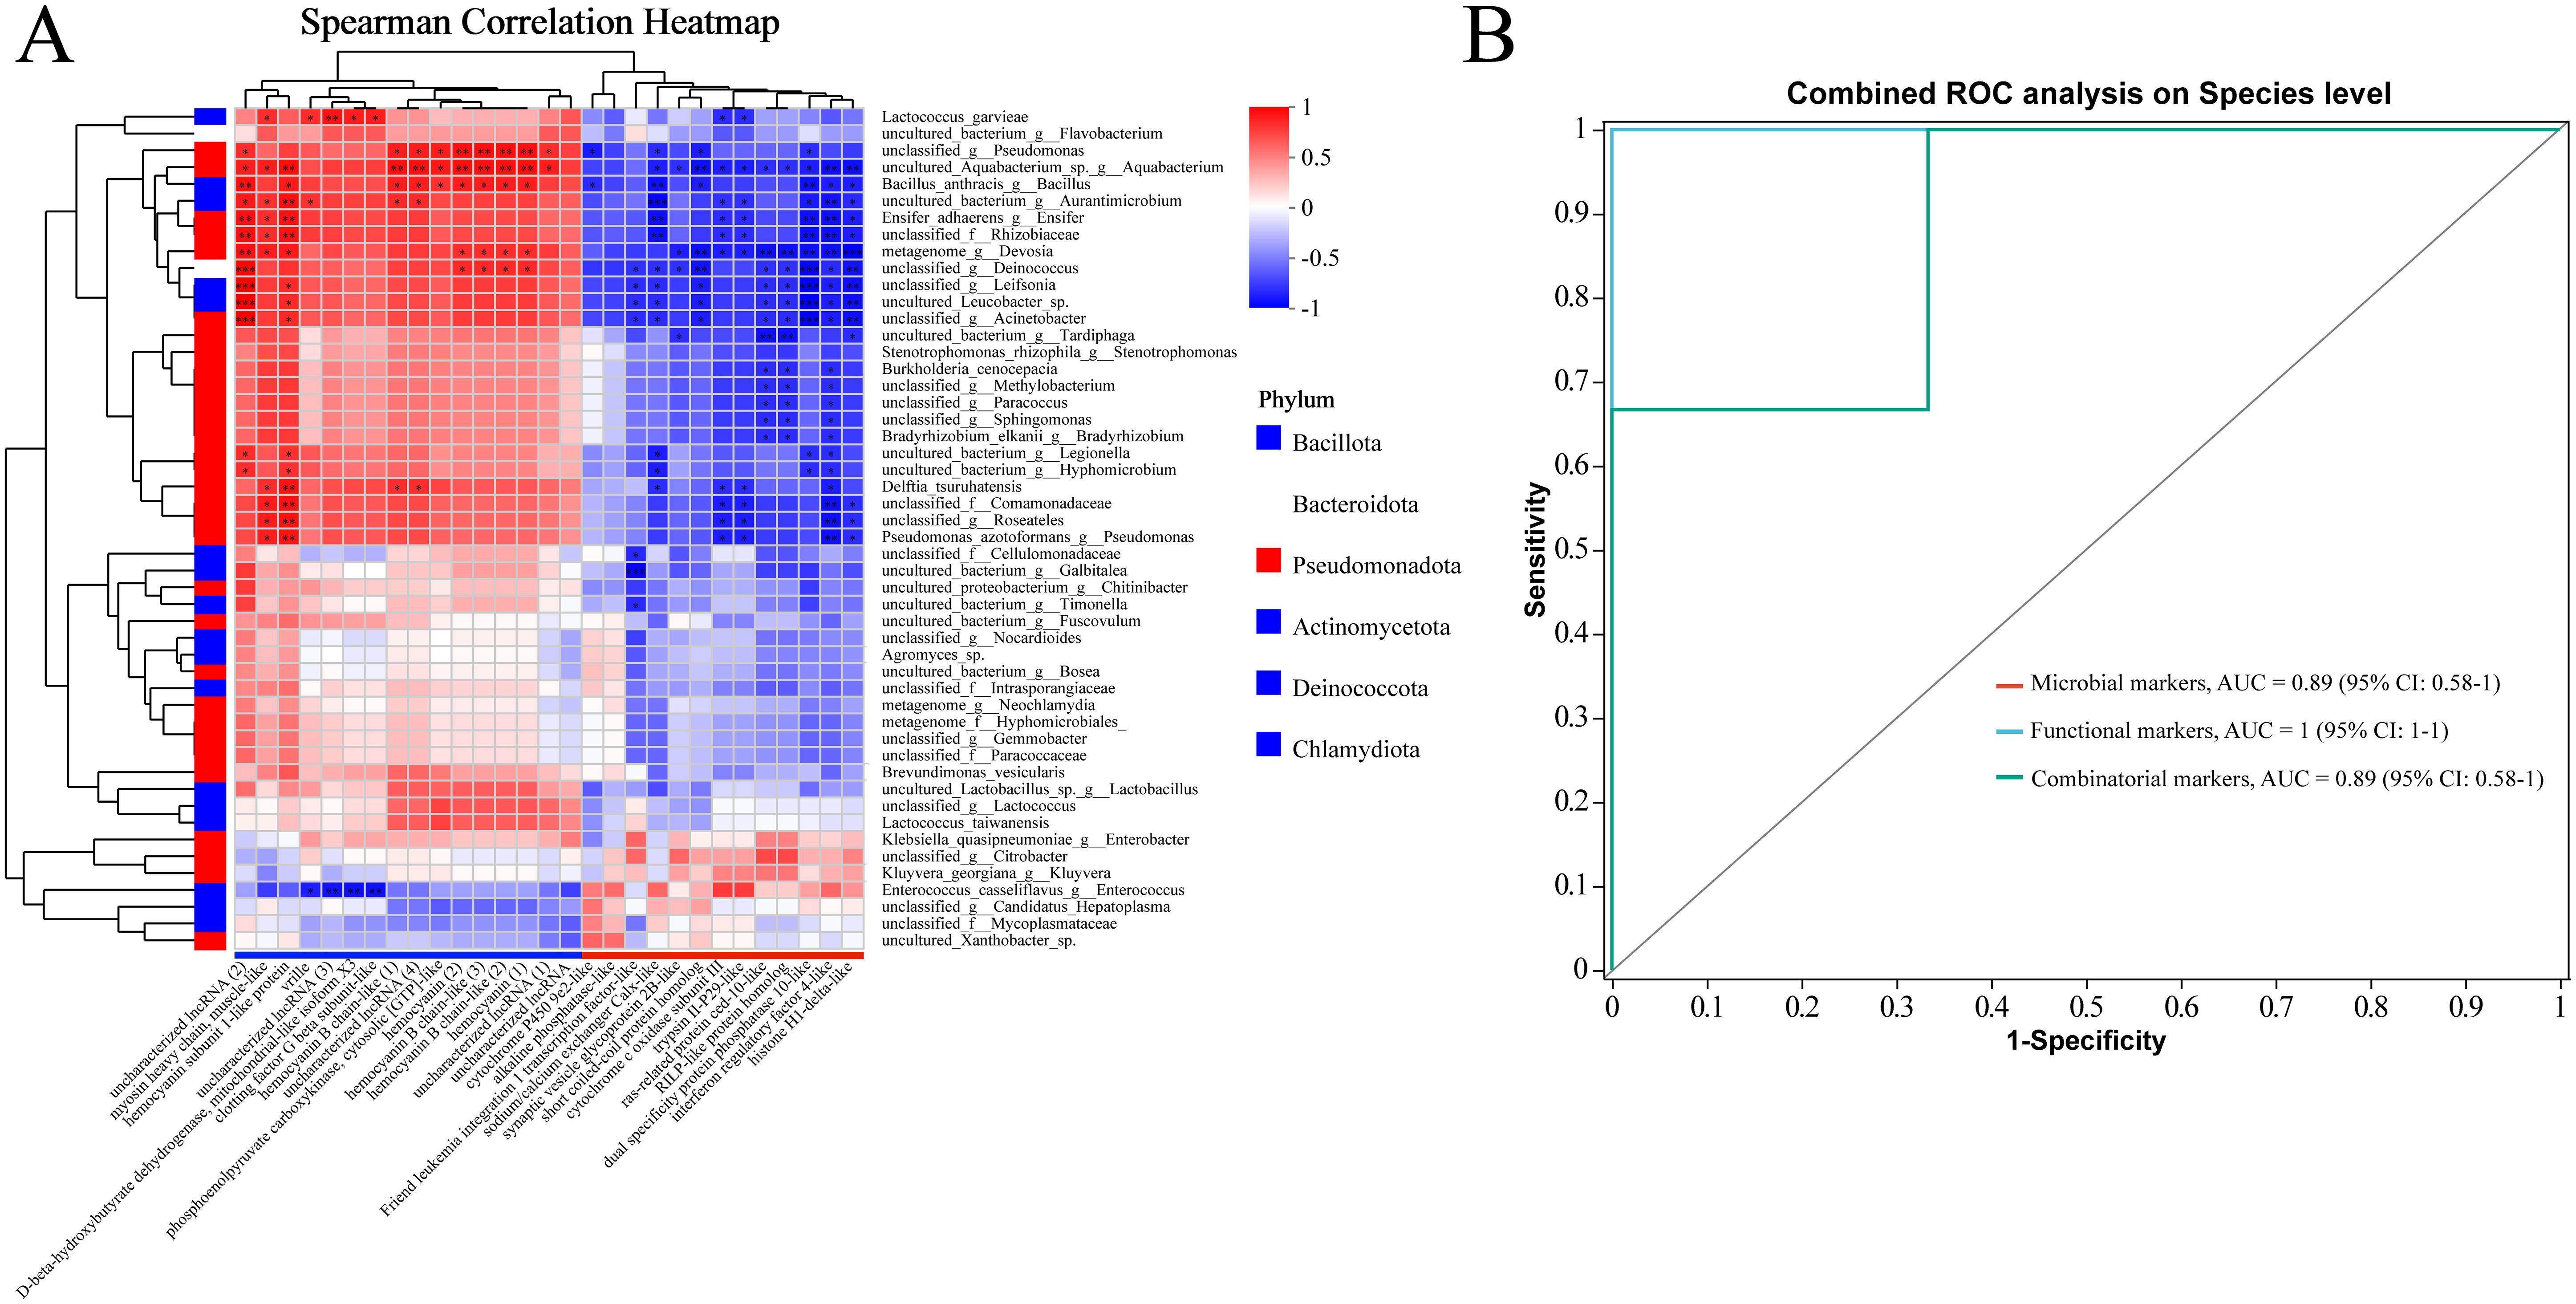
Figure 6. (A) The host DEGs (including 13 upregulated and 16 downregulated genes in the resistant family) exhibit family-specific associations with the intestinal microbiome of M. rosenbergii. A correlation analysis was performed between 29 DEGs (|log2(FoldChange)| > 1.00, adjusted p < 0.05) and the top 50 most abundant species. The results are presented in terms of R and p values, with R values represented by a color gradient. p values less than 0.05, 0.01, and 0.001 are indicated by *, **, and ***, respectively. In the heatmap, red and blue cells represent positive and negative correlations, respectively. (B) Various markers for discriminating the resistant family from the susceptible family in M. rosenbergii. Comparison of area under receiver operating characteristic curves (AUC), microbial markers (red curve), functional markers (blue curve), and combined markers (green curve).
3.10 Integrated intestinal microbial and host functional markers for distinguishing resistant from susceptible families
Combinatorial markers distinguished the resistant from the susceptible family. This study assessed the role of intestinal microbes and host functional genes in this differentiation. We found that four microbial markers: Bacillus anthracis, Lactococcus garvieae, uncultured_Aquabacterium, and Enterococcus casseliflavus could accurately discriminate the resistant family from the susceptible family (area under curve (AUC): 89%, confidence interval (CI): 0.58–1; red curve; Figure 6B). As for functional markers, three host genes associated with uncharacterized lncRNA, an esterase E4-like protein, and a CUB-serine protease (Figure 2K) exhibited strong performance (AUC: 100%, CI: 1–1; blue curve; Figure 6B). These results suggested the host intestinal gene functional profiles have larger differences between the susceptible and resistant families, compared to the microbial community. We then combined these microbial and functional markers, and their combination provided 89% prediction power in discriminating the resistant family from the susceptible family (AUC: 89%, CI: 0.58–1; green curve; Figure 6B).
4 Discussion
Selective breeding of disease-resistant shrimp is an effective, practical, and sustainable method for disease control. In this study, we conducted systematic family selection for resistance traits to DIV1 in M. rosenbergii.
Based on the differences in survival rate, we identified the susceptible family S2–2 and resistant family R27-1, and then compared the viral load and histopathological changes between these two families. At 24 and 48 hpi, higher DIV1 loads were detected in the hepatopancreas of the susceptible family, suggesting that viral invasion occurs more readily in this group compared to the resistant family. Histopathological analysis also revealed more severe tissue damage in hepatopancreas samples from the susceptible family compared to the resistant family. Furthermore, the discrepancies in viral gene sequences identified from the hepatopancreas transcriptomic data of the resistant and susceptible families provide additional evidence of their differential susceptibility to DIV1. Specifically, at 48 hpi, a substantial number of viral gene sequences were detected in the susceptible family (S2-2), suggesting rapid viral replication and proliferation. In contrast, only the viral sequence 141L was detected in the resistant family (R27-1), indicating that these families possess effective immune responses or antiviral mechanisms that suppress viral replication. Several genes associated with early viral replication—including 068R, 078R, 148R, 141L, DNA-dependent RNA polymerase II largest subunit, and Ca²+-binding RTX toxin-related protein—were highly expressed in the susceptible family, highlighting their potential roles in the early phase of infection. DNA-dependent RNA polymerase II is a key enzyme in viral transcription, essential for RNA synthesis, replication, and protein production. RTX toxins, which are involved in cellular invasion and toxicity, likely facilitate viral infection and spread by modulating calcium signaling pathways in host cells (46–48). The high expression of these genes may contribute to rapid replication in the susceptible family, whose host cells may be more vulnerable to invasion and lack sufficient antiviral responses. In contrast, the resistant family displayed lower expression levels of viral genes, possibly due to more robust innate immune responses that rapidly detect and eliminate the virus, thus restricting viral spread, reducing replication, and minimizing viral load. In summary, the susceptible family S2–2 and the resistant family R27–1 serve as valuable models for studying DIV1 resistance in M. rosenbergii. To further explore the underlying mechanisms, we conducted RNA sequencing to compare the hepatopancreas transcriptomes and microbiome sequencing to analyze gut microbial composition in both families. To our knowledge, this is the first study to integrate gene expression profiles, gut microbiome, and DIV1 resistance phenotypes in M. rosenbergii.
In the hepatopancreas, the Melanogenesis and Tyrosine metabolism pathways exhibit significant differential regulation both in the uninfected and infected states. Notably, under naïve conditions, the resistant family showed lower expression levels of several key genes involved in these pathways, whereas the expression pattern reversed in infected shrimp at 48 hpi. Melanogenesis plays a crucial role in the innate immune response of arthropods and other invertebrates. During this process, toxic quinone compounds and other reactive intermediates are produced, contributing to melanin formation that physically encapsulates and neutralizes invading pathogens (49). Melanocytes are key mediators of this defense, initiating responses to microbial infections. Innate immune stimulation, particularly through the activation of Toll-like receptors (TLRs), enhances melanogenesis and promotes melanin transport, thereby strengthening the elimination of pathogens (50). In this study, the enrichment of melanogenesis pathways observed in the resistant lineage at 48 hpi likely reflects an enhanced capacity for melanin synthesis and distribution, reinforcing both physical and chemical defenses against external pathogens. Therefore, upregulation of Melanogenesis may not only contribute to the heightened immune response observed in the resistant lineage but also represent a critical biological basis for its superior resistance phenotype. Further analysis revealed several highly differentially expressed genes (DEGs) in the Melanogenesis and Tyrosine metabolism pathways closely associated with hemocyanin (HMC). HMC, a large copper-containing respiratory protein in mollusks and arthropods, was long considered solely an oxygen carrier until the late 1990s, when its phenoloxidase (PO) activity was confirmed, revealing its role in innate immunity (51–53). In shrimp, humoral immunity, including the prophenoloxidase (proPO) system, coagulation cascades, and antimicrobial peptides (AMPs), plays a vital role in pathogen defense (54, 55). Key immune molecules include lysozyme, lectins, PO, AMPs, and PmAV (56, 57). Importantly, HMC acquires monophenol and o-diphenol oxidase activities via proteolysis, promoting melanin production and antimicrobial responses (51, 58). It also modulates PO activity and enhances pathogen-induced immune reactions. HMC levels, PO activity, and bacteriolysis peak at 24 hpi following Staphylococcus aureus or Vibrio harveyi infection (59). Hemocyanin subunits have been shown to inhibit viral replication, block herpesvirus entry, and delay WSSV infection (60, 61). Furthermore, its C-terminal peptides exhibit strong agglutination against pathogens such as Escherichia coli, V. parahaemolyticus, Vibrio vulnificus, and S. aureus (62, 63). Together, these findings support the central role of HMC in crustacean immunity. In this study, higher basal HMC expression in the susceptible lineage may reflect elevated metabolic or immune demands under normal conditions, whereas the more pronounced induction observed in the resistant family following DIV1 infection suggests a crucial role for HMC in antiviral defense in M. rosenbergii.
Glycolysis and Gluconeogenesis are key metabolic pathways involved in glucose regulation. In an uninfected state, DEGs encoding aldehyde dehydrogenase X (LOC136851566) and phosphoenolpyruvate carboxykinase, cytosolic [GTP]-like (LOC136830169) were highly expressed in S2–2 family compared to R27–1 family. However, at 24 hpi (Figure 4C) and 48 hpi (Figure 4D), a total of 3 and 12 DEGs, respectively, were significantly upregulated in the resistant family and were markedly enriched in this pathway. This suggests that, in the absence of infection, the S2–2 family may have a higher basal energy demand. Upon DIV1 infection, however, the resistant R27–1 family shows significantly increased expression of glucose metabolism-related genes, likely to meet elevated energy requirements and support immune responses during viral infection. Interestingly, this regulatory pattern is consistent with that observed in the Melanogenesis pathway and may be related to DIV1 resistance. Studies have demonstrated that the activation of steroid hormone signaling plays a crucial role in immune responses and survival following pathogen challenge in Drosophila (64). Similarly, a comparative study on resistance and susceptibility in Cynoglossus semilaevis to Vibrio revealed that DEGs highly expressed in the resistant family were significantly enriched in steroid and bile acid metabolism pathways (23). Our findings align with these results. In the uninfected state, genes involved in the Steroid hormone biosynthesis pathway, including cytochrome P450 3A31-like and UDP-glycosyltransferase UGT5-like, were highly expressed in the resistant family. Moreover, at 48 hpi, DEGs associated with this pathway, such as 3 beta-hydroxysteroid dehydrogenase/Delta 5–>4-isomerase-like, cytochrome P450 9e2-like, cytochrome P450 2L1-like, UDP-glycosyltransferase UGT5-like, sulfotransferase 1C4-like, and cytochrome P450 3A31-like, were also highly expressed in the resistant family (p < 0.05, Figure 4E). Cytochrome P450 (CYP) enzymes are membrane-associated hemoproteins essential for detoxifying xenobiotics, cellular metabolism, and homeostasis (65). Genetic variations and epigenetic modifications in CYP genes could contribute to differences in disease susceptibility and drug response among individuals and across ethnic groups (65). These genes may serve as potential molecular markers for distinguishing DIV1 resistance, and further validation is needed in future stugies.
In this study, several immune-related genes exhibited significantly higher expression levels in the resistant family compared to the susceptible family, suggesting that they may play key roles in DIV1 resistance. Among them, alkaline phosphatase (AP) showed the most prominent differential expression, indicating a potentially central role in the antiviral immune response. AP functions in anti-inflammatory and detoxification through dephosphorylation, helping to mitigate inflammatory responses and neutralize endotoxins such as lipopolysaccharides (LPS), thereby contributing to tissue homeostasis and protecting organ function under stress conditions such as viral infection (66). For instance, previous studies have demonstrated that AP can hydrolyze ATP into adenosine, which exerts anti-inflammatory and tissue-protective effects, particularly in the kidney and intestinal tract (66). Notably, intestinal alkaline phosphatase (IAP) plays an essential role in maintaining gut homeostasis by detoxifying LPS, enhancing barrier function, and inducing autophagy to clear damaged organelles (67). Additionally, immune regulatory factors such as Friend leukemia integration 1 transcription factor-like (FLI1-like), interferon regulatory factor 4-like (IRF4-like), dual specificity protein phosphatase 10-like (DUSP10-like), and Trypsin II-P29-like also displayed significant expression differences between the two families, highlighting their potential involvement in the immune defense against DIV1. Among these, DUSP10 is a dual-specificity phosphatase that negatively regulates the p38 MAPK and JNK signaling pathways via dephosphorylation, thereby suppressing excessive inflammatory responses and participating in both innate and adaptive immune regulation (68). It is considered a promising anti-inflammatory target. In contrast, Trypsin II-P29-like may contribute to the activation of protease cascades and promote inflammatory responses (69), suggesting that moderate activation of inflammatory pathways may serve as an early immune defense strategy in the resistant family. Supporting this, trypsin expression has also been reported to be higher in AHPND-tolerant L. vannamei compared to susceptible individuals (18). FLI1-like, a member of the Ets family of transcription factors, is involved in regulating genes crucial for cell proliferation, differentiation, and apoptosis, and may play a role in hematopoiesis and host defense (70). IRF4 is a key transcriptional regulator that plays a pivotal role in modulating interferon (IFN)-mediated signaling cascades. It has been implicated in multiple immunological processes, including antiviral responses, T helper (Th) cell lineage commitment, and B cell maturation, primarily through the transcriptional regulation of IFNs and various lymphokines involved in immune cell differentiation and function (71). Taken together, these DEGs not only reveal potential molecular mechanisms underlying the resistant family’s response to DIV1 infection, but also provide a theoretical foundation and candidate targets for further functional validation, marker-assisted selection, and disease-resistant breeding.
Commensal microorganisms and their eukaryotic hosts have evolved together over time, forming a complex and mutually advantageous relationship (72). Although there was no significant difference in the Shannon index of the gut microbiota between the resistant and susceptible lines uninfected with DIV1, the index was higher in the resistant line, which is consistent with previous studies showing that the mid-gut bacterial community of the uninfected susceptible rainbow trout exhibited significantly greater diversity than that of the resistant line (72). In addition, based on both the diversity index and community composition results, the resistant family exhibited a greater capacity to maintain microbiome stability than the susceptible family. L. garvieae is a potential pathogen responsible for considerable economic losses in both marine and freshwater aquaculture systems (73). In the cultivation of tilapia and grey mullet, L. garvieae infections are associated with morbidity rates of 70% to 100% (74, 75). In our study, although L. garvieae was the dominant bacterial taxon in both families, consistent with previous reports, its relative abundance in the susceptible family’s gut tissue (mean RA: 70%) was significantly higher than in the resistant family (mean RA: 20.18%). The genus Enterococcus comprises Gram-positive, facultative anaerobic bacteria commonly found in the digestive systems of humans, insects, and other animals (76). These bacteria are widely distributed and contribute to the gut microbiota of various hosts. Certain Enterococcus species are currently employed as probiotic strains alongside Lactobacillus and Bifidobacterium species (77). Both experimental and theoretical research have demonstrated that Enterococcus strains can be beneficial in managing conditions such as diarrhea, irritable bowel syndrome, and immune modulation when used as probiotics (78). In our study, the relative abundance of Enterococcus casseliflavus in the resistant lineage (mean RA: 0.51%) is significantly higher than that in the susceptible lineage (mean RA: 0.03%). This strain has been reported to exhibit probiotic potential and is capable of inducing the expression of IFN-λ genes and interferon-stimulated genes (ISGs) associated with antiviral functions (79). In conclusion, we hypothesize that the reduction in L. garvieae’s relative abundance, along with the concomitant increase in Enterococcus casseliflavus, may contribute to resistance against DIV1. It is important to note that while our study observed distinct differences in gut microbial composition between the resistant and susceptible families—specifically, a higher abundance of pathogenic bacteria in the susceptible group and potential probiotics in the resistant group—we did not perform experiments to disentangle the independent contribution of microbiota from viral effects on host mortality. Therefore, we cannot exclude the possibility that differences in microbial composition may have influenced the observed mortality rates, independently or synergistically with DIV1 infection. Future studies incorporating microbiota transplantation or gnotobiotic models could help clarify the causal role of gut microbiota in disease resistance.
The correlation analysis indicates that 19 microbial species show a negative correlation with most upregulated genes in the resistant family and a positive correlation with downregulated genes, suggesting that these microbes may play a key role in the resistance mechanism by regulating immune responses or metabolic pathways. In contrast, four microbial species (e.g., Enterococcus casseliflavus) show an opposite pattern, possibly promoting resistance by enhancing immune responses or metabolic processes. These microbes may interact with host-specific genes to regulate the host’s immune system or metabolic pathways, thereby improving the host’s resistance to DIV1. Furthermore, this study found that both microbial and host functional gene markers can effectively distinguish between resistant and susceptible families. Microbial markers provide a theoretical foundation for microbial intervention, indicating that adjusting the composition of the gut microbiota may help improve host immune function and reduce the risk of DIV1 infection. Host genes, such as CUB-serine protease and other functional genes, demonstrated excellent predictive ability in distinguishing resistant families, with an AUC value of 100%. These genes are likely critical to the host’s immune response to DIV1 and could serve as selection markers in aquaculture breeding to enhance resistance. Although the results demonstrate significant potential for application, several key issues require further investigation. Firstly, the specific functions of microbes and host genes in DIV1 resistance must be explored in depth, and their mechanisms experimentally validated. Future research should focus on understanding how microbes regulate host gene expression to enhance immune responses or metabolic processes. Additionally, using germ-free models or microbial transplantation techniques will aid in further elucidating the specific roles of these microbes in resistance. Longitudinal studies will help assess the stability and performance of these microbial and host gene markers under varying environmental conditions. This will provide more reliable evidence for their practical application in aquaculture breeding, thereby promoting resistance enhancement.
In summary, we characterized one resistant and one susceptible family of M. rosenbergii based on significant differences in their survival following the DIV1 challenge. This difference was further corroborated by disparities in muscle viral load, histopathological changes, and the number of viral genes identified in the host transcriptome. Functional annotation and enrichment analyses revealed that immune responses and energy metabolism are key contributors to DIV1 resistance. Under uninfected conditions, the gene expression profile of the resistant family indicated a stronger immune response and better metabolic adaptation. The elevated expression of these genes suggests that the resistant family may be pre-adapted to respond to potential infections. Additionally, we observed a higher abundance of the potential probiotic Enterococcus casseliflavus in the resistant family, while L. garvieae was more abundant in the susceptible family. Based on the findings from this study, we propose that further investigation into these genes, strains, and their regulatory networks will enhance our understanding of the underlying resistance mechanisms and yield valuable markers for resistance breeding in M. rosenbergii.
Data availability statement
The datasets presented in this study have been deposited in the Sequence Read Archive (SRA) at the National Center for Biotechnology Information (NCBI). The transcriptome data can be accessed using the accession number PRJNA1256795 (https://www.ncbi.nlm.nih.gov/bioproject/PRJNA1256795), while the microbiome sequencing data are available under the accession number PRJNA1256775 (https://www.ncbi.nlm.nih.gov/bioproject/PRJNA1256775).
Ethics statement
The animal study was approved by Animal Experiment Ethics Committee of the Zhejiang Academy of Agricultural Sciences. The study was approved under license number SYXK (Zhe) 2020-0022. The study was conducted in accordance with the local legislation and institutional requirements.
Author contributions
JH: Writing – review & editing, Data curation, Formal analysis, Investigation, Methodology, Software, Validation, Writing – original draft. YJ: Investigation, Writing – original draft. ZL: Writing – original draft, Methodology. TY: Writing – original draft, Data curation. JM: Writing – original draft, Methodology. CL: Writing – original draft, Project administration. JY: Project administration, Writing – original draft. YZ: Project administration, Writing – original draft. ZD: Writing – original draft, Methodology. ZG: Funding acquisition, Project administration, Writing – review & editing.
Funding
The author(s) declare that financial support was received for the research and/or publication of this article. This work was supported by “Pioneer” and “Leading Goose” R&D Program of Zhejiang (2024SSYS0101) and Xianghu lab project (2023C2S02002).
Conflict of interest
The authors declare that the research was conducted in the absence of any commercial or financial relationships that could be construed as a potential conflict of interest.
Generative AI statement
The author(s) declare that no Generative AI was used in the creation of this manuscript.
Publisher’s note
All claims expressed in this article are solely those of the authors and do not necessarily represent those of their affiliated organizations, or those of the publisher, the editors and the reviewers. Any product that may be evaluated in this article, or claim that may be made by its manufacturer, is not guaranteed or endorsed by the publisher.
Supplementary material
The Supplementary Material for this article can be found online at: https://www.frontiersin.org/articles/10.3389/fimmu.2025.1611481/full#supplementary-material
References
1. Pillai BR, Ponzoni RW, Das Mahapatra K, and Panda D. Genetic improvement of giant freshwater prawn Macrobrachium rosenbergii: A review of global status. Rev Aquac. (2022) 14:1285–99. doi: 10.1111/raq.12650
2. Liu XZ, Cui LF, Wang XT, Yuan XC, Sun HW, and Chen JR. China Fishery Statistical Yearbook. No. 18, Maizidian West Street, Chaoyang District, Beijing, China: China Agriculture Press (2024). p24.
3. Qian QQ, Lin YF, Chen Z, Zhu YJ, Xu JW, Gao XJ, et al. Pathogenesis and complete genome sequence of Decapod iridescent virus 1 (DIV1) associated with mass mortality in Macrobrachium rosenbergii. Aquaculture. (2023) 566:739220. doi: 10.1016/j.aquaculture.2022.739220
4. Zhang XJ, Yuan JB, Sun YM, Li SH, Gao Y, Yu Y, et al. Penaeid shrimp genome provides insights into benthic adaptation and frequent molting. Nat Commun. (2019) 10:356. doi: 10.1038/s41467-018-08197-4
5. Arora S, Steuernagel B, Gaurav K, Chandramohan S, Long YM, Matny O, et al. Resistance gene cloning from a wild crop relative by sequence capture and association genetics. Nat Biotechnol. (2019) 37:139–43. doi: 10.1038/s41587-018-0007-9
6. Woldemariam NT, Agafonov O, Sindre H, Høyheim B, Houston RD, Robledo D, et al. miRNAs predicted to regulate host anti-viral gene pathways in IPNV-challenged Atlantic Salmon fry are affected by viral load, and associated with the major IPN resistance QTL genotypes in late infection. Front Immunol. (2020) 11:2113. doi: 10.3389/fimmu.2020.02113
7. Houston RD, Haley CS, Hamilton A, Guy DR, Tinch AE, Taggart JB, et al. Major quantitative trait loci affect resistance to infectious pancreatic necrosis in Atlantic salmon (Salmo salar). Genetics. (2008) 178:1109–15. doi: 10.1534/genetics.107.082974
8. Wang PH, Wan DH, Gu ZH, Deng XX, Weng SP, Yu XQ, et al. Litopenaeus vannamei tumor necrosis factor receptor-associated factor 6 (TRAF6) responds to Vibrio alginolyticus and white spot syndrome virus (WSSV) infection and activates antimicrobial peptide genes. Dev Comp Immunol. (2011) 35:105–14. doi: 10.1016/j.dci.2010.08.013
9. Liu JW, Yu Y, Li FH, Zhang XJ, and Xiang JH. A new anti-lipopolysaccharide factor (ALF) gene with its SNP polymorphisms related to WSSV-resistance of Litopenaeus vannamei. Fish Shellfish Immunol. (2014) 39:24–33. doi: 10.1016/j.fsi.2014.04.009
10. Liu JW, Yu Y, Li FH, Zhang XJ, and Xiang JH. A new ALF from Litopenaeus vannamei and its SNPs related to WSSV resistance. Chin J Ocean Limnol. (2014) 32:1232–47. doi: 10.1016/j.fsi.2014.04.009
11. Yu Y, Liu JW, Li FH, Zhang XJ, Zhang CS, and Xiang JH. Gene set based association analyses for the WSSV resistance of Pacific white shrimp Litopenaeus vannamei. Sci Rep. (2017) 7:40549. doi: 10.1038/srep40549
12. Zhang Q, Yu Y, Wang QC, Liu F, Luo Z, Zhang CS, et al. Identification of single nucleotide polymorphisms related to the resistance against acute hepatopancreatic necrosis disease in the pacific white shrimp Litopenaeus vannamei by target sequencing approach. Front Genet. (2019) 10:700. doi: 10.3389/fgene.2019.00700
13. Santos CA, Andrade SCS, Teixeira AK, Farias F, Kurkjian K, Guerrelhas AC, et al. Litopenaeus vannamei transcriptome profile of populations evaluated for growth performance and exposed to white spot syndrome virus (WSSV). Front Genet. (2018) 9:120. doi: 10.3389/fgene.2018.00120
14. Santos CA, Andrade SCS, Teixeira AK, Farias F, Guerrelhas AC, Rocha JL, et al. Transcriptome differential expression analysis reveals the activated genes in Litopenaeus vannamei shrimp families of superior growth performance. Aquaculture. (2021) 531:735871. doi: 10.1016/j.aquaculture.2020.735871
15. Jiang FJ, Wang HX, Yue X, Zhang SJ, and Liu BZ. Integrating the Vibrio-resistance phenotype and gene expression data for discovery of markers used for resistance evaluation in the clam Meretrix petechialis. Aquaculture. (2018) 482:130–6. doi: 10.1016/j.aquaculture.2017.09.033
16. Zhang Q, Yu Y, Luo Z, Xiang JH, and Li FH. Comparison of gene expression between resistant and susceptible families against VPAHPND and identification of biomarkers used for resistance evaluation in Litopenaeus vannamei. Front Genet. (2021) 12:772442. doi: 10.3389/fgene.2021.772442
17. Liu Y, Yu Y, Li SH, Sun MZ, and Li FH. Comparative transcriptomic analysis of gill reveals genes belonging to mTORC1 signaling pathway associated with the resistance trait of shrimp to VPAHPND. Front Immunol. (2023) 14:1150628. doi: 10.3389/fimmu.2023.1150628
18. Mai HN, Caro LFA, Cruz-Flores R, White BN, and Dhar AK. Differentially expressed genes in hepatopancreas of acute hepatopancreatic necrosis disease tolerant and susceptible shrimp (Penaeus vannamei). Front Immunol. (2021) 12:634152. doi: 10.3389/fimmu.2021.634152
19. Pereiro P, Tur R, García M, Figueras A, and Novoa B. Unravelling turbot (Scophthalmus maximus) resistance to Aeromonas salmonicida: transcriptomic insights from two full-sibling families with divergent susceptibility. Front Immunol. (2024) 15:1522666. doi: 10.3389/fimmu.2024.1522666
20. Gaulke CA, Martins ML, Watral VG, Humphreys IR, Spagnoli ST, Kent ML, et al. A longitudinal assessment of host-microbe-parasite interactions resolves the zebrafish gut microbiome’s link to Pseudocapillaria tomentosa infection and pathology. Microbiome. (2019) 7:10. doi: 10.1186/s40168-019-0622-9
21. Bozzi D, Rasmussen JA, Carøe C, Sveier H, Nordøy K, Gilbert MTP, et al. Salmon gut microbiota correlates with disease infection status: potential for monitoring health in farmed animals. Anim Microbiome. (2021) 3:30. doi: 10.1186/s42523-021-00096-2
22. Huang HY, Zhou PJ, Chen P, Xia LQ, Hu SB, Yi GF, et al. Alteration of the gut microbiome and immune factors of grass carp infected with Aeromonas veronii and screening of an antagonistic bacterial strain (Streptomyces flavotricini). Microb Pathog. (2020) 143:104092. doi: 10.1016/j.micpath.2020.104092
23. Zhou Q, Zhu X, Li YZ, Yang PS, Wang SP, Ning K, et al. Intestinal microbiome-mediated resistance against vibriosis for Cynoglossus semilaevis. Microbiome. (2022) 10:153. doi: 10.1186/s40168-022-01346-4
24. Wu ZB, Zhang QQ, Zhang TL, Chen JW, Wang S, Hao JW, et al. Association of the microbiota dysbiosis in the hepatopancreas of farmed crayfish (Procambarus clarkii) with disease outbreaks. Aquaculture. (2021) 536:736492. doi: 10.1016/j.aquaculture.2021.736492
25. Brown RM, Wiens GD, and Salinas I. Analysis of the gut and gill microbiome of resistant and susceptible lines of rainbow trout (Oncorhynchus mykiss). Fish Shellfish Immunol. (2019) 86:497–506. doi: 10.1016/j.fsi.2018.11.079
26. Wang J, Huang YJ, Xu KH, Zhang XY, Sun HY, Fan LF, et al. White spot syndrome virus (WSSV) infection impacts intestinal microbiota composition and function in Litopenaeus vannamei. Fish Shellfish Immunol. (2019) 84:130–7. doi: 10.1016/j.fsi.2018.09.076
27. Ding ZF, Cao MJ, Zhu XS, Xu GH, and Wang RL. Changes in the gut microbiome of the Chinese mitten crab (Eriocheir sinensis) in response to White spot syndrome virus (WSSV) infection. J Fish Dis. (2017) 40:1561–71. doi: 10.1111/jfd.2017.40.issue-11
28. Zheng J, Jia Y, Li F, Chi M, Cheng S, Liu S, et al. Changes in the gene expression and gut microbiome to the infection of decapod iridescent virus 1 in Cherax quadricarinatus. Fish Shellfish Immunol. (2023) 132:108451. doi: 10.1016/j.fsi.2022.108451
29. Cao XT, Pan XY, Sun M, Liu Y, and Lan JF. Hepatopancreas-specific lectin participates in the antibacterial immune response by regulating the expression of antibacterial proteins. Front Immunol. (2021) 12:679767. doi: 10.3389/fimmu.2021.679767
30. Zhong SP, Mao Y, Wang J, Liu M, Zhang M, and Su YQ. Transcriptome analysis of Kuruma shrimp (Marsupenaeus japonicus) hepatopancreas in response to white spot syndrome virus (WSSV) under experimental infection. Fish Shellfish Immunol. (2017) 70:710–9. doi: 10.1016/j.fsi.2017.09.054
31. Ren XY, Liu P, and Li J. Comparative transcriptomic analysis of Marsupenaeus japonicus hepatopancreas in response to Vibrio parahaemolyticus and white spot syndrome virus. Fish Shellfish Immunol. (2019) 87:755–64. doi: 10.1016/j.fsi.2019.02.030
32. Keawthong C, Bunnoy A, Chuchird N, and Srisapoome P. Immune responses and histopathological analyses of giant river prawn (Macrobrachium rosenbergii, De Man 1879) challenged with a sub-lethal dose of decapod iridescent virus 1 (DIV1) and chemical control investigation. Fish Shellfish Immunol. (2023) 137:108792. doi: 10.1016/j.fsi.2023.108792
33. Qin LJ, Qian QQ, Chen AT, Zhang YJ, Tang X, Yin TC, et al. Isolation and the pathogenicity characterization of Decapod iridescent virus 1 (DIV1) from diseased Macrobrachium nipponense and its activation on host immune response. Fish Shellfish Immunol. (2024) 146:109403. doi: 10.1016/j.fsi.2024.109403
34. Gao XJ, Zhu YJ, Qian QQ, Chen AT, Qin LJ, Tang XZ, et al. The immune defense response and immune-related genes expression in Macrobrachium nipponense infected with decapod iridescent virus 1 (DIV1). Animals. (2024) 14:2864. doi: 10.3390/ani14192864
35. Qiu L, Chen MM, Wan XY, Zhang QL, Li C, Dong X, et al. Detection and quantification of shrimp hemocyte iridescent virus by TaqMan probe based real-time PCR. J Invertebr Pathol. (2018) 154:95–101. doi: 10.1016/j.jip.2018.04.005
36. Chen SF, Zhou YQ, Chen YR, and Gu J. Fastp: an ultra-fast all-in-one FASTQ preprocessor. Bioinformatics. (2018) 34:i884–90. doi: 10.1093/bioinformatics/bty560
37. Kim D, Langmead B, and Salzberg SL. HISAT: a fast spliced aligner with low memory requirements. Nat Methods. (2015) 12:357–60. doi: 10.1038/nmeth.3317
38. Pertea M, Pertea GM, Antonescu CM, Chang TC, Mendell JT, and Salzberg SL. StringTie enables improved reconstruction of a transcriptome from RNA-seq reads. Nat Biotechnol. (2015) 33:290–5. doi: 10.1038/nbt.3122
39. Li B and Dewey CN. RSEM: accurate transcript quantification from RNA-Seq data with or without a reference genome. BMC Bioinf. (2011) 12:323. doi: 10.1186/1471-2105-12-323
40. Love MI, Huber W, and Anders S. Moderated estimation of fold change and dispersion for RNA-seq data with DESeq2. Genome Biol. (2014) 15:550. doi: 10.1186/s13059-014-0550-8
41. Liu CS, Zhao DF, Ma WJ, Guo YD, Wang AJ, Wang QL, et al. Denitrifying sulfide removal process on high-salinity wastewaters in the presence of Halomonas sp. Appl Microbiol Biotechnol. (2016) 100:1421–6. doi: 10.1007/s00253-015-7039-6
42. Magoč T and Salzberg SL. FLASH: fast length adjustment of short reads to improve genome assemblies. Bioinformatics. (2011) 27:2957–63. doi: 10.1093/bioinformatics/btr507
43. Edgar RC. UPARSE: highly accurate OTU sequences from microbial amplicon reads. Nat Methods. (2013) 10:996–8. doi: 10.1038/nmeth.2604
44. Wang Q, Garrity GM, Tiedje JM, and Cole JR. Naive Bayesian classifier for rapid assignment of rRNA sequences into the new bacterial taxonomy. Appl Environ Microbiol. (2007) 73:5261–7. doi: 10.1128/AEM.00062-07
45. Schloss PD, Westcott SL, Ryabin T, Hall JR, Hartmann M, Hollister EB, et al. Introducing mothur: open-source, platform-independent, community-supported software for describing and comparing microbial communities. Appl Environ Microbiol. (2009) 75:7537–41. doi: 10.1128/AEM.01541-09
46. Linhartová I, Bumba L, Mašín J, Basler M, Osička R, Kamanová J, et al. RTX proteins: a highly diverse family secreted by a common mechanism. FEMS Microbiol Rev. (2010) 34:1076–112. doi: 10.1111/j.1574-6976.2010.00231.x
47. Correction to: RTX proteins: A highly diverse family secreted by a common mechanism. FEMS Microbiol Rev. (2023) 47:fuad024. doi: 10.1093/femsre/fuad024
48. Vance TDR, Olijve LLC, Campbell RL, Voets IK, Davies PL, and Guo S. Ca2+-stabilized adhesin helps an Antarctic bacterium reach out and bind ice. Biosci Rep. (2014) 34:e00121. doi: 10.1042/BSR20140083
49. Cerenius L, Lee BL, and Söderhäll K. The proPO-system: pros and cons for its role in invertebrate immunity. Trends Immunol. (2008) 29:263–71. doi: 10.1016/j.it.2008.02.009
50. Koike S and Yamasaki K. Melanogenesis connection with innate immunity and toll-like receptors. Int J Mol Sci. (2020) 21:9769. doi: 10.3390/ijms21249769
51. Aweya JJ, Zheng Z, Zheng X, Yao D, and Zhang Y. The expanding repertoire of immune-related molecules with antimicrobial activity in penaeid shrimps: a review. Rev Aquac. (2021) 13:1907–37. doi: 10.1111/raq.12551
52. Li JX, Zhao MM, Zhang X, Zheng ZH, Yao DF, Yang S, et al. The evolutionary adaptation of shrimp hemocyanin subtypes and the consequences on their structure and functions. Fish Shellfish Immunol. (2024) 145:109347. doi: 10.1016/j.fsi.2023.109347
53. Decker H and Rimke T. Tarantula hemocyanin shows phenoloxidase activity. J Biol Chem. (1998) 273:25889–92. doi: 10.1074/jbc.273.40.25889
54. Li F and Xiang J. Recent advances in researches on the innate immunity of shrimp in China. Dev Comp Immunol. (2013) 39:11–26. doi: 10.1016/j.dci.2012.03.016
55. Sukonthamarn P, Wongvises P, Sangklai N, Jaroenlak P, and Tassanakajon A. Prophenoloxidase-activating system plays a crucial role in innate immune responses to Enterocytozoon hepatopenaei infection in shrimp Litopenaeus vannamei. Fish Shellfish Immunol. (2024) 154:109925. doi: 10.1016/j.fsi.2024.109925
56. Söderhäll K and Cerenius L. Role of the prophenoloxidase-activating system in invertebrate immunity. Curr Opin Immunol. (1998) 10:23–8. doi: 10.1016/S0952-7915(98)80026-5
57. Luo T, Zhang XB, Shao ZZ, and Xu X. PmAV, a novel gene involved in virus resistance of shrimp Penaeus monodon. FEBS Lett. (2003) 551:53–7. doi: 10.1016/S0014-5793(03)00891-3
58. Cerenius L, Babu R, Söderhäll K, and Jiravanichpaisal P. In vitro effects on bacterial growth of phenoloxidase reaction products. J Invertebr Pathol. (2010) 103:21–3. doi: 10.1016/j.jip.2009.09.006
59. Pan LQ, Zhang X, Yang LB, and Pan SS. Effects of Vibro harveyi and Staphyloccocus aureus infection on hemocyanin synthesis and innate immune responses in white shrimp Litopenaeus vannamei. Fish Shellfish Immunol. (2019) 93:659–68. doi: 10.1016/j.fsi.2019.08.016
60. Talaei Zanjani N, Miranda-Saksena M, Valtchev P, Diefenbach RJ, Hueston L, Diefenbach E, et al. Abalone hemocyanin blocks the entry of herpes simplex virus 1 into cells: a potential new antiviral strategy. Antimicrob Agents Chemother. (2016) 60:1003–12. doi: 10.1128/AAC.01738-15
61. Zhan SX, Aweya JJ, Wang F, Yao DF, Zhong M, Chen JH, et al. Litopenaeus vannamei attenuates white spot syndrome virus replication by specific antiviral peptides generated from hemocyanin. Dev Comp Immunol. (2019) 91:50–61. doi: 10.1016/j.dci.2018.10.005
62. Zhao X, Guo L, Lu X, Lu H, Wang F, Zhong M, et al. Evidences of abundant hemocyanin variants in shrimp Litopenaeus vannamei. Mol Immunol. (2016) :77:103–12. doi: 10.1016/j.molimm.2016.07.017
63. Zhang ZH, Wang F, Chen CD, Zheng Z, Aweya JJ, and Zhang YL. Glycosylation of hemocyanin in Litopenaeus vannamei is an antibacterial response feature. Immunol Lett. (2017) 192:42–7. doi: 10.1016/j.imlet.2017.10.008
64. Regan JC, Brandão AS, Leitão AB, Mantas Dias AR, Sucena E, Jacinto A, et al. Steroid hormone signaling is essential to regulate innate immune cells and fight bacterial infection in Drosophila. PloS Pathog. (2013) 9:e1003720. doi: 10.1371/journal.ppat.1003720
65. Manikandan P and Nagini S. Cytochrome p450 structure, function and clinical significance: a review. Curr Drug Targets. (2018) 19:38–54. doi: 10.2174/1389450118666170125144557
66. Peters E, Heemskerk S, Masereeuw R, and Pickkers P. Alkaline phosphatase: a possible treatment for sepsis-associated acute kidney injury in critically ill patients. Am J Kidney Diseases. (2014) 63:1038–48. doi: 10.1053/j.ajkd.2013.11.027
67. Singh SB and Lin HC. Role of intestinal alkaline phosphatase in innate immunity. Biomolecules. (2021) 11:1784. doi: 10.3390/biom11121784
68. Jiménez-Martínez M, Stamatakis K, and Fresno M. The dual-specificity phosphatase 10 (Dusp10): its role in cancer, inflammation, and immunity. Int J Mol Sci. (2019) 20:1626. doi: 10.3390/ijms20071626
69. Kusampudi S, Meganathan V, Keshava S, and Boggaram V. Purification and characterization of a serine protease from organic dust and elucidation of its inductive effects on lung inflammatory mediators. Am J Physiol Lung Cell Mol Physiol. (2023) 325:L74–90. doi: 10.1152/ajplung.00309.2022
70. Sato S and Zhang XK. The Friend leukaemia virus integration 1 (Fli-1) transcription factor affects lupus nephritis development by regulating inflammatory cell infiltration into the kidney. Clin Exp Immunol. (2014) 177:102–9. doi: 10.1111/cei.12310
71. Zhai XY, Hong TQ, Zhang TT, Xing B, Wang JC, Wang XY, et al. Identification and antiviral effect of Cherry Valley duck IRF4. Poult Sci. (2021) 101:101560. doi: 10.1016/j.psj.2021.101560
72. Brown RM, Wiens GD, and Salinas I. Analysis of the gut and gill microbiome of resistant and susceptible lines of rainbow trout (Oncorhynchus mykiss). Fish Shellfish Immunol. (2019) 86:497–506. doi: 10.1016/j.fsi.2018.11.079
73. Vendrell D, Balcázar JL, Ruiz-Zarzuela I, de Blas I, Gironés O, and Múzquiz JL. Lactococcus garvieae in fish: a review. Comp Immunol Microbiol Infect Dis. (2006) 29:177–98. doi: 10.1016/j.cimid.2006.06.003
74. Evans JJ, Klesius PH, and Shoemaker CA. First isolation and characterization of Lactococcus garvieae from Brazilian Nile tilapia, Oreochromis niloticus (L.), and pintado, Pseudoplathystoma corruscans (Spix & Agassiz). J Fish Dis. (2009) 32:943–51. doi: 10.1111/j.1365-2761.2009.01075.x
75. Choi WM, Lam CL, Mo WY, Cheng Z, Mak NK, Bian ZX, et al. Effects of the modified Huanglian Jiedu decoction on the disease resistance in grey mullet (Mugil cephalus) to Lactococcus garvieae. Mar Pollut Bull. (2014) 85:816–23. doi: 10.1016/j.marpolbul.2014.04.043
76. Chajecka-Wierzchowska W, Zadernowska A, and Laniewska-Trokenheim L. Virulence factors, antimicrobial resistance and biofilm formation in Enterococcus spp. isolated from retail shrimps. LWT-Food Sci Technol. (2016) 69:117–22. doi: 10.1016/j.lwt.2016.01.034
77. Guo LD, Li TT, Tang YR, Yang LJ, and Huo GC. Probiotic properties of Enterococcus strains isolated from traditional naturally fermented cream in China. Microb Biotechnol. (2016) 9:737–45. doi: 10.1111/mbt2.2016.9.issue-6
78. Franz CMAP, Huch M, Abriouel H, Holzapfel W, and Gálvez A. Enterococci as probiotics and their implications in food safety. Int J Food Microbiol. (2011) 151:125–40. doi: 10.1016/j.ijfoodmicro.2011.08.014
Keywords: Decapod iridescent virus 1, Macrobrachium rosenbergii, transcriptome, gut microbiome, disease resistance
Citation: Hao J, Jie Y, Lu Z, Ye T, Meng J, Liu C, Yan J, Zheng Y, Dong Z and Gu Z (2025) Integrated transcriptomic and microbiomic analyses reveal mechanisms of Decapod iridescent virus 1 resistance in Macrobrachium rosenbergii. Front. Immunol. 16:1611481. doi: 10.3389/fimmu.2025.1611481
Received: 14 April 2025; Accepted: 06 May 2025;
Published: 26 May 2025.
Edited by:
Jiong Chen, Ningbo University, ChinaReviewed by:
Changhong Cheng, South China Sea Fisheries Research Institute (CAFS), ChinaYulin Bai, Chinese Academy of Fishery Sciences (CAFS), China
Minze Liao, Chinese Academy of Fishery Sciences (CAFS), China
Peng Chen, Nanjing Normal University, China
Copyright © 2025 Hao, Jie, Lu, Ye, Meng, Liu, Yan, Zheng, Dong and Gu. This is an open-access article distributed under the terms of the Creative Commons Attribution License (CC BY). The use, distribution or reproduction in other forums is permitted, provided the original author(s) and the copyright owner(s) are credited and that the original publication in this journal is cited, in accordance with accepted academic practice. No use, distribution or reproduction is permitted which does not comply with these terms.
*Correspondence: Zhimin Gu, Z3V6aGltaW4yMDA2QDE2My5jb20=; Zaijie Dong, ZG9uZ3pqQGZmcmMuY24=