 Gabirel Astarloa-Pando1
 Victor Sandá1Ainhoa Amarilla-Irusta1Ainara Lopez-Pardo1Itxaso San Juan1Ainhoa Iturbe-Larrondo1
 Raquel Pérez-Garay1,2Silvia Pérez-Fernández3Borja Santos-Zorrozúa3
 Bárbara Manzanares-Martín4Raquel Bernardo4,5Carmen González6Alasne Uranga6Mercedes Rey7Marta Alonso8Elena Amutio9
 Juan J. Mateos-Mazón9Juan C. García-Ruiz9Olatz Zenarruzabeitia1,10
 Laura Amo1,11*
 Francisco Borrego1,11*
- 1Immunopathology Group, Biobizkaia Health Research Institute, Barakaldo, Spain
- 2Clinical Analysis Service, Cruces University Hospital, Barakaldo, Spain
- 3Scientific Coordination Facility, Biobizkaia Health Research Institute, Barakaldo, Spain
- 4Clinical Management Unit of Immunology and Allergy, Reina Sofia Hospital, Córdoba, Spain
- 5Maimónides Biomedical Research Institute of Córdoba (IMIBIC), Córdoba, Spain
- 6Biogipuzkoa Health Research Institute, Hematology and Hemotherapy Service, Donostia University Hospital, Donostia-San Sebastián, Spain
- 7Biogipuzkoa Health Research Institute, Service of Immunology, Donostia University Hospital, Donostia-San Sebastián, Spain
- 8Regulation of the Immune System Group, Biobizkaia Health Research Institute, Immunology Service, Cruces University Hospital, Barakaldo, Spain
- 9Hematological Cancer Group, Biobizkaia Health Research Institute, Hematology and Hemotherapy Service, Cruces University Hospital, Barakaldo, Spain
- 10Department of Genetics, Physical Anthropology and Animal Physiology, Faculty of Science and Technology, University of the Basque Country, Leioa, Spain
- 11Ikerbasque, Basque Foundation for Science, Bilbao, Spain
Early immune reconstitution following autologous hematopoietic stem cell transplantation (autoHSCT) is associated with improved outcome in various cancers. Natural killer (NK) cells are the first lymphocyte subset to recover post-autoHSCT and play a crucial role in antitumor immunity. In this study, we have performed an in-depth characterization of NK cells in adult patients with different hematological malignancies. Our results revealed that, immediately after autoHSCT, NK cells transiently acquired a decidual-like phenotype, displayed a more immature and activated state, and exhibited an upregulation of inhibitory receptors and a downregulation of activating receptors. This decidual-like and activated phenotype was characterized by increased expression of CD56, CD9, CD49a, CD151, CD38 and HLA-DR. Additionally, we assessed plasma cytokine levels and identified associations between cytokine concentrations and NK cell phenotypic changes. In vitro experiments suggested that these phenotype alterations could modulate NK cell function. Finally, in patients with non-Hodgkin lymphoma (NHL), we observed a correlation between NK cell maturation status and progression-free survival. Collectively, our findings provide valuable insights into NK cell dynamics during immune reconstitution following autoHSCT and may inform of strategies for improving patients’ management.
Introduction
Natural killer (NK) cells play a central role in cancer defense due to their ability to directly kill target cells through multiple mechanisms (1–4). Human circulating NK cells have been classified into two major subsets with different functionalities based on CD56 and CD16 expression: CD56brightCD16low/− (CD56bright) and CD56dimCD16+ (CD56dim) NK cells. CD56bright NK cells produce large quantities of immunomodulatory cytokines and chemokines, with limited cytotoxicity unless they are activated by cytokines. In contrast, CD56dim NK cells are more cytotoxic but secrete lower amounts of cytokines (5–8). NK cells express activating and inhibitory receptors whose integrated signals determine their response (9). In this manner, inhibitory receptors such as killer immunoglobulin-like receptors (KIRs) and CD94/NKG2A recognize self-human leukocyte antigen class I (HLA-I) molecules, preventing NK cell activation. On the other hand, NK cells are activated upon recognition of stress-induced ligands on virus-infected or malignant cells, or via antibody-dependent cell-mediated cytotoxicity (ADCC) (4, 7, 10, 11).
Autologous hematopoietic stem cell transplantation (autoHSCT) is an effective and well-established treatment for various hematological malignancies, including multiple myeloma (MM), Hodgkin lymphoma (HL) and non-Hodgkin lymphoma (NHL) with its different subcategories (12–15). Early immune reconstitution following autoHSCT is associated with improved outcome across several cancer types (16–18). Specifically, day 15 absolute lymphocyte count (ALC-15) of ≥ 500 cells/µl after autoHSCT is a good prognostic indicator in MM and NHL patients (17). A high number of NK cells, the first lymphocyte subset to recover post-transplantation (19–21), is associated with better clinical outcome following autoHSCT (22–24).
Given the potent anti-tumor properties of NK cells and their rapid recovery post-autoHSCT, understanding their biology and reconstitution dynamics in this context is of significant importance. It has been described that following autoHSCT, particularly during early leukocyte recovery, there is a redistribution of NK cells subsets. In MM and lymphoma patients it has been described an increased frequency of immature CD56brightNKG2A+ NK cells with high levels of CD57 and KIRs early after transplant (25). Another study in MM has described a similar redistribution, characterized by increased NK cell proliferation and a rise in the frequency of both CD56bright NK cells as well as the most immature population within the CD56dim NK cell subset (CD57-NKG2A+) (26). Normally, NK cell function is recovered early after autoHSCT (25, 26), with transcriptomic analyses revealing significant changes in pathways related to the cell cycle, DNA replication, and the mevalonate pathway (27). Notably, in MM patients undergoing autoHSCT, an expansion of a CD9+ decidual-like NK cell subset has been observed, characterized by high granzyme B and perforin expression levels (27). It has been proposed that this CD9+ NK cell subset expansion could be the attributed to the combination of TGF-β and the high levels of IL-15 observed immediately after autoHSCT (28).
NK cell numbers and subset frequencies have been associated with survival outcome (21, 29). For instance, MM patients with lower frequencies of the highly differentiated NKG2A-CD57+ NK cell subset after autoHSCT showed better clinical outcome (26). Additionally, MM patients achieving long-term complete response after autoHSCT showed increased frequencies of NK cells expressing the inhibitory receptors KIR2DL1 and NKG2A compared with age-matched healthy donors (30). Notably, similar to allogeneic HSCT, a graft-versus-tumor effect mediated by NK cells may occur in autoHSCT, potentially influenced by KIR-HLA-I receptor-ligand mismatch and affinity interactions (31–35). KIR and HLA-I genotypes have also been shown to impact neuroblastoma patients undergoing autoHSCT and anti-GD2 therapy (32, 36).
Currently, few reliable biomarkers exist to predict prognosis in patients undergoing autoHSCT, and understanding immune reconstitution complexity is crucial for identifying them. Therefore, a detailed characterization of NK cells and their correlation with prognosis indicators is needed. In this study, we report significant post-autoHSCT changes in the expression of inhibitory and activating receptors, activation markers and decidual-like markers, as well as in plasma levels of key cytokines involved in NK cell functions. We also identified associations between specific cytokine levels and NK cell phenotypic changes. In vitro functional studies suggest that these phenotypic alterations may tune NK cell function. Finally, we observed a correlation between NK cell maturation levels and progression-free survival in NHL patients. Overall, these findings provide valuable insight into the NK cell pool reconstitution dynamics after autoHSCT and may contribute to the development of improved therapeutic strategies for cancer patients undergoing this treatment.
Materials and methods
Patients´ characteristics and study design
The clinical characteristics of the patients are shown in Table 1. Blood samples were collected at six distinct time points: prior to transplantation (S1), post-leucocyte recovery (defined as exceeding 1000 leukocytes/µl of blood, typically around day 12 following autoHSCT) (S2), 30 days post-autoHSCT (S3), 100 days post-autoHSCT (S4), 180 days post-autoHSCT (S5), and one year after autoHSCT (S6) (Supplementary Figure S1A). Sample collection was conducted through the Basque Biobank for Research (https://www.biobancovasco.bioef.eus), in accordance with the quality management, traceability, and biosecurity standards outlined in the Spanish Law 14/2007 on Biomedical Research and Royal Decree 1716/2011. The project was approved by the Basque Ethics Committee for Clinical Research (BIO14/TP/003, PI+CES+INC-BIOEF 2017-03). Written informed consent was obtained from all participants in accordance with the Declaration of Helsinki.
Table 1. Patients’ clinical characteristics.
Determination of NK cell count
The total number of NK cells was determined from whole blood samples. NK cells were identified as CD45+, CD3-, CD56+ and/or CD16+ by flow cytometry. The following clinical-grade fluorochrome-conjugated monoclonal antibodies (mAbs) were used: FITC anti-CD16 (CLB/FcGran1), PE anti-CD56 (MY31), PerCP-Cy5.5 anti-CD3 (SK7), and V450 anti-CD45 (2D1), all from BD Biosciences. The total NK cell count per μL of blood was calculated using the formula: (percentage of NK cells in the lymphocyte gate x absolute lymphocyte count)/100. The total lymphocyte count was obtained from the hemogram.
Plasma and peripheral blood mononuclear cells
Plasma and peripheral blood mononuclear cells (PBMCs) were isolated as previously described (28). Briefly, blood samples were collected in EDTA-containing tubes from adults diagnosed with various hematological malignancies who underwent autoHSCT. Plasma was obtained after centrifugation. PBMCs were enriched through density gradient centrifugation, cryopreserved in heat-inactivated fetal bovine serum (FBS) (GE Healthcare Hyclone) with 10% dimethylsulfoxide (DMSO) (Thermo Scientific), and stored in liquid nitrogen until use.
Cryopreserved PBMCs were thawed in a 37°C water bath and washed twice with RPMI 1640 medium supplemented with L-Glutamine (Lonza). Next, cells were incubated for 1 hour at 37 °C with 5% CO2 in R10 medium, which consists of RPMI 1640 with GlutaMAX, 10% FBS, and 1% Penicillin-Streptomycin (P-S), all from Thermo Fisher Scientific, and supplemented with 10U DNase (Roche). Subsequently, cells were washed one time, resuspended in NK cell medium (RPMI 1640 medium with GlutaMAX, 10% FBS, 1% P-S, 1% Sodium Pyruvate and 1% MEM Non-Essential Amino Acids Solution, all from Thermo Fisher Scientific), filtered through 70 µm cell strainers, and counted before being used in flow cytometry studies and/or in vitro degranulation assays.
Flow cytometry and data analysis
NK cells were characterized phenotypically (Supplementary Table S1, panels 1-3) and functionally (Supplementary Table S1, panel 4) by flow cytometry. After two washes with PBS, PBMCs were initially incubated in 1 mL of a 1/1000 dilution of the LIVE/DEAD Cell Stain Kit (Invitrogen) in PBS, on ice for 30 minutes in the dark. Next, cells were washed twice with PBS supplemented with 2.5% bovine serum albumin (BSA) (Sigma-Aldrich) prior to conducting the staining of surface receptors. To achieve this, cells were placed on ice for 30 minutes in the dark and incubated with the fluorochrome-conjugated mAbs listed in Supplementary Table S1. Following the staining, cells were washed once more with PBS supplemented with 2.5% BSA and then resuspended in 200 µL of PBS. Samples were acquired using a LSR Fortessa X-20 flow cytometer (BD Biosciences).
Flow cytometry data were analyzed with FlowJo v10.8.1 software. Both manual and automated analyses were conducted. The plug-ins utilized were: DownSample (1.1), UMAP, and FlowSOM (2.6). Briefly, for the automated analysis, events were initially down sampled from the target gate (NK cells) across all samples using the DownSample plug-in. For every donor, NK cells were down sampled to 100 cells. Subsequently, the down sampled populations were concatenated for the analysis. FlowSOM was executed with the specified parameters in every figure.
NK cell degranulation assay
For in vitro NK cell degranulation assays, the P815 mouse mastocytoma cell line was used as the target. Cells were cultured in NK cell medium supplemented with 5 µg/mL of plasmocin (InvivoGen) at 37 °C and 5% CO2 in a flask in an appropriate volume. Thawed PBMCs were cultured overnight and the next day they were used in the degranulation assay. Following a previously described protocol (37), PBMCs and P815 cells were co-cultured at an effector-to-target (E:T) ratio of 1:1 (500.000 PBMCs and equal number of P815 cells) per well in round-bottom 96-well plates, in a final volume of 200 µl. Samples from 7 patients at S1, S2 and S3, were used for these experiments. These co-cultures were incubated in the presence of agonist antibodies, previously titrated to determine the optimal concentration in healthy donors. Due to the limited cell numbers in sample S2 and results obtained on healthy donor samples, we selected the anti-LAIR-1 mAb for degranulation assays.
The positive control well contained 0.05 µg/mL of mouse anti-human CD16 (clone 3G8, BD Biosciences, ref. 555404), and 4 µg/mL of mouse IgG1, κ isotype control (clone MOPC-21, BioLegend, ref. 400101). The assay well contained 0.05 µg/mL of mouse anti-human CD16 and 4 µg/mL of mouse anti-human LAIR-1 inhibitory receptor (clone DX26, BD Biosciences, ref. 550810). To test the degranulation, 2 µL of PE-labeled anti-CD107a (clone REA792, Miltenyi Biotec, ref. 130-111-621) were added to each well. After a pulse centrifugation (200g), cells were incubated for 1 hour at 37 °C and 5% CO2. Next, 0.66 µL/mL of GolgiStop (BD Biosciences, ref. 554724) and 1 µL/mL of GolgiPlug (BD Biosciences, ref. 550583) were added to each well, followed by another pulse centrifugation and 5 hours of incubation. Finally, plates were stored in the dark at 4 °C overnight, until the next day for antibody staining (Supplementary Table S1, panel 4) and subsequent acquisition in a flow cytometer.
DNA extraction and KIR genotyping
DNA was extracted from PBMCs using the FlexiGen DNA kit (Qiagen) following the manufacturer’s instructions. The initial step involves adding lysis buffer to each sample according to the Qiagen “FlexiGene DNA procedure” flowchart. Briefly, cell nuclei and mitochondria were collected by centrifugation and then resuspended in a denaturation buffer containing QIAGEN Protease. After protein digestion, DNA was precipitated by adding isopropanol, retrieved through centrifugation, washed with 70% ethanol, and dried. DNA was then dissolved in hydration buffer and stored at –20°C for future use.
KIR typing was conducted using a PCR-SSP technique (sequence-specific primers) with the KIR Ready gene kit (Inno-train Diagnostik GmbH) (28). PCR products were amplified, separated on agarose gels, and the results were analyzed following the manufacturer’s guidelines. Depending on the content of KIR genes, the haplotype (A or B) was determined, and genotypes (AA or Bx, with “x” being either A or B) were categorized for every patient. The AA genotype is homozygous for the inhibitory haplotype A (composed of 3DL3, 2DL3, 2DP1, 2DL1, 3DP1, 2DL4, 3DL1, 2DS4 and 3DL2). Haplotype B or Bx genotype includes any combination of KIR other than those mentioned above.
Plasma determination of cytokines
Plasma cytokine levels were determined in samples that were stored at -80 °C. To measure IL-15 plasma levels, the human IL-15 Quantikine ELISA Kits (R&D Systems) was used following the manufacturer’s guidelines. The optical density was measured in a Varioskan Flash fluorimeter (Thermo Fisher Scientific), and the standard curve along with non-linear regression and log-log line modeling was conducted using GraphPad Prism v.9.3.1 software. To measure TGF-β plasma levels, the Luminex MILLIPLEX TGF-beta 1 Single Plex MAGNETIC Bead Kit (Merck) was used, according to the manufacturer’s guidelines. TGF-β levels were quantified using Luminex® 200™ (Merck) and evaluated with xPONENT® software. To determine GDF-15 plasma levels, Elecsys GDF-15 (Roche) was utilized, following the manufacturer’s guidelines. For quantification, the electrochemiluminescence was measured using a cobas e 801 analytical unit (Roche) immunoassay analyzer.
Statistical analysis and data representation
For the analysis of panel 1 the sample size was S1 n=44; S2 n=42; S3 n=40; S4 n=38; S5 n=33; S6 n=29. For the analysis of panel 2 the sample size was S1 n=33; S2 n=33; S3 n=32; S4 n=32; S5 n=25; S6 n=22. For the analysis of panel 3 the sample size was S1 n=15; S2 n=15; S3 n=12; S4 n=15; S5 n=10; S6 n=11. Non-parametric Wilcoxon matched-pairs signed-rank test was used to determine significant differences among groups. Correlograms were used to visualize correlations between different variables, with the Pearson correlation coefficient indicated by square size and heat scale. Kaplan-Meier analysis of progression-free survival was performed by dividing the NHL cohort into two groups based on the median value of the variable under analysis. Survival analyses were restricted to the NHL cohort due to statistical power considerations. The limited patient numbers in the Hodgkin Lymphoma and other cancers groups (n=8 each) were insufficient to detect true differences or associations with adequate statistical significance and robustness. The analyses were performed using R (version 4.3.1), a language and environment for statistical computing (R Foundation for Statistical Computing using ggplot2, tidyr and readxl packages). GraphPad Prism v.9.3.1 was also used for graphical representation.
Results
Immature and activated NK cells with a decidual-like phenotype expand following autoHSCT
NK cell phenotypic changes occur during immune system reconstitution after autoHSCT (21, 25, 26, 28, 29). In this study, we have analyzed NK cell reconstitution in a cohort of adult patients with hematological malignancies undergoing autoHSCT. Fifty-seven patients were recruited in the Hematology Services of the Cruces University Hospital and the Donostia University Hospital. Peripheral blood samples were collected at multiple time points: before autoHSCT (S1), after reaching leucocyte recovery (>1000 leukocytes/µl, typically around day 12 post-autoHSCT, S2) and 30 days (S3), 100 days (S4), 180 days (S5) and a year (S6) after autoHSCT (Supplementary Figure S1A). The clinical characteristics of patients are described in Table 1. Following autoHSCT, the absolute number of NK cells significantly declined from S1 to S2, followed by an increase at S3, which was sustained until S6 (Figure 1A). However, the proportion of NK cells among total lymphocytes remained unchanged during reconstitution. NK cells were identified based on CD56 and NKp80 expression, while excluding other lineage markers (CD3, CD14, CD19, and CD123), as illustrated in Supplementary Figure S1B. We further categorized NK cells into two subsets based on CD56 expression: CD56bright and CD56dim. Our analysis revealed a post-autoHSCT increase in the more immature CD56bright NK cell subset and a concomitant decrease in CD56dim NK cells (Figure 1B).
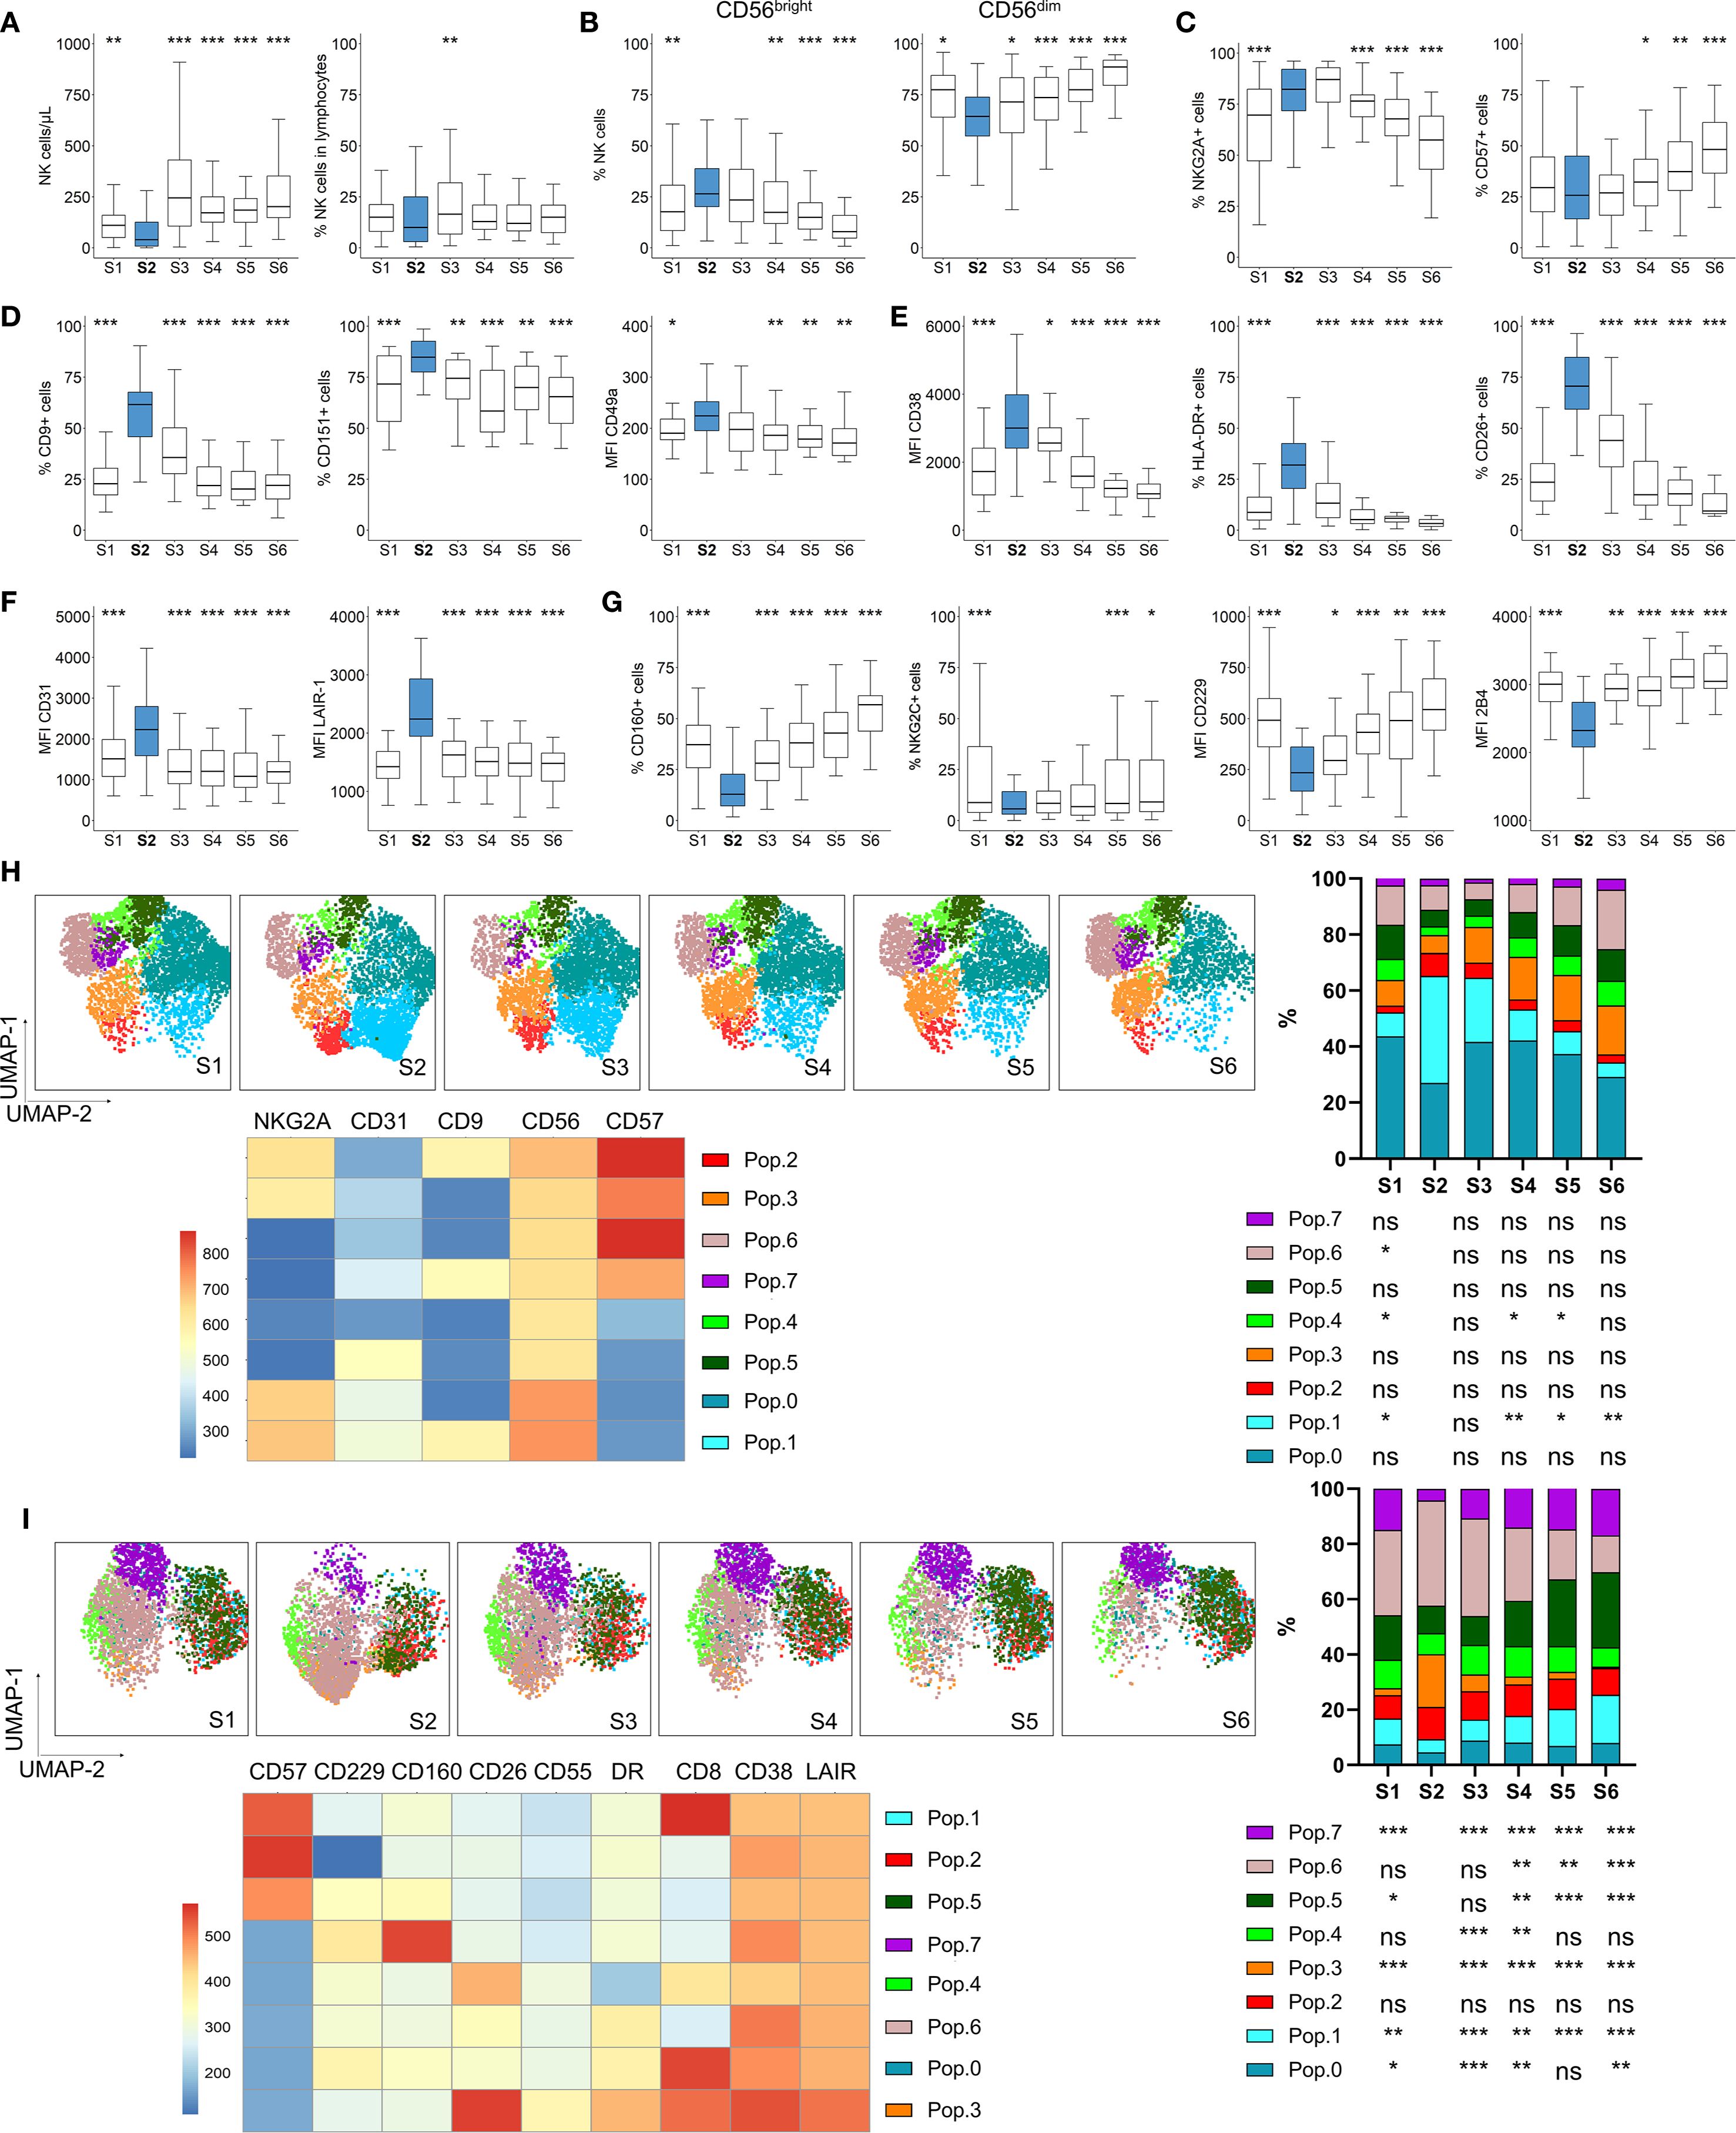
Figure 1. NK cell numbers and phenotype dynamics after autoHSCT. Boxplot graphs illustrating NK cell analysis at six time points: before autoHSCT (S1), after reaching leucocyte recovery (more than 1000 leukocytes/µl, typically around day 12 after autoHSCT) (S2), 30 days (S3), 100 days (S4), 180 days (S5), and one year after autoHSCT (S6). (A) Absolute NK cell counts (left) and percentage of NK cells within lymphocytes (right). (B) Percentages of CD56bright and CD56dim NK cell subsets. (C) Frequencies of NKG2A+ (left) and CD57+ (right) NK cells. (D) Percentages of CD9+ (left) and CD151+ (middle) NK cells and median fluorescence intensity (MFI) of CD49a (right). (E) MFI of CD38 (left), and frequencies of HLA-DR+ (middle) and CD26+ (right) NK cells. (F) MFI of CD31 (left) and LAIR-1 (right) on NK cells. (G) Frequencies of CD160+ (left) and NKG2C+ (middle) NK cells and MFI of CD229 (middle) and 2B4 (right). Boxplots display the median and interquartile range (IQR; 25–75th percentiles), with whiskers indicating the minimum and maximum values. Statistical significance was determined by comparing each sample to S2 (blue) using the Wilcoxon matched-pairs signed-rank test: *p < 0.05, **p < 0.01, ***p < 0.001; non-significant values were not indicated. (H, I) UMAP projection of CD56+ NK cell populations (Pop) identified by FlowSOM clustering tool for the specified markers from panels 1 (H) and 2 (I). Fluorescence intensity of each Pop is indicated in the column-scaled z-score, and bar graphs illustrate Pop distributions across time points (S1-S6). Comparisons were made with S2 using the Wilcoxon matched-pairs signed-rank test (*p < 0.05, **p < 0.01, ***p < 0.001; ns, not significant).
Given the observed shift towards an immature NK cell phenotype, we analyzed the expression of the maturation markers NKG2A and CD57. The percentage of NKG2A+ NK cells increased shortly after transplantation (from S1 to S2), while CD57+ NK cells increased at later time-points (>100 days, S4 and S5) (Figure 1C). Co-expression analysis of NKG2A and CD57 within NK cell subsets confirmed that the most immature CD56bright NK cells predominantly exhibited a NKG2A+CD57- phenotype. Notably, these NKG2A+CD57- constituted the most frequent subset among total and CD56dim NK cells at all time points (Supplementary Figure S2). Their frequency in CD56dim NK cells increased after S1 but gradually declined after S3, while the proportion of terminally differentiated NKG2A-CD57+ NK cells increased.
Previous reports indicate that genes associated with activation and several receptors are differentially expressed in adult MM patients undergoing autoHSCT (27). Among these, the decidual NK cell markers CD9, CD151, and CD49a (38–40) were of particular interest. In this study, we observed a transient increase in NK cells expressing CD9, CD151 and CD49a at S2, returning to pre-transplant levels by S6 (Figure 1D and Supplementary Figure S3A). Further analysis of CD9 and CD151 expression revealed that the CD9+CD151+ NK cell subset increased fourfold at S2 compared to S1, whereas the CD9- subset decreased proportionally (Supplementary Figure S3B), suggesting that CD9 is a predominant marker in this characteristic decidual-like phenotype post-autoHSCT. Since decidual NK cells are characterized by higher CD56 expression (39), we analyzed the MFI of CD56 in populations expressing CD9 and CD151. CD56 MFI increased at S2 (Supplementary Figure S3C), with CD9+CD151- NK cells displaying the highest CD56 expression (Supplementary Figure S3D). This aligns with previous reports indicating that CD9 is a specific marker of decidual and decidual-like NK cells, whereas CD151 is also expressed on peripheral NK cells (39, 41).
Analyses of activation markers revealed a transient increase in CD38 expression at S2, along with a rise in HLA-DR+ and CD26+ NK cells (Figure 1E, Supplementary Figure S4A), all of which are indicative of NK cell activation (42–44). Additionally, inhibitory receptors expression levels were upregulated at S2, including CD31, LAIR-1 (Figure 1F, Supplementary Figure S4B) and NKG2A (Figure 1C, a maturation marker, which is also an inhibitory receptor). Conversely, regarding activating receptors, the proportions of CD160+ and NKG2C+ NK cells decreased at S2, as well as the MFI of CD229 and 2B4 (also known as CD244) (Figure 1G, Supplementary Figure S4C).
Further analysis of additional receptors revealed an increase in CD55 expression, a potential inhibitory receptor and decidual NK cell marker in mice (45, 46) at S2 (Supplementary Figure S5). Previous reports have shown that expression of genes encoding for chemokine receptors, such as CCR5 and CCR7, was altered after autoHSCT in MM patients (27). In our study, the expression of CCR5, a homing receptor for infected tissues and tumors (47, 48), was upregulated at S2 (Supplementary Figure S5), while other chemokine receptors remained unchanged (data not shown). Interestingly, inhibitory receptor Siglec-7, which is associated with a highly functional NK cell subset (49, 50), exhibited a unique trend, decreasing at S2 (Supplementary Figure S5), in contrast to other inhibitory receptors. Activating receptor CD226 (DNAM-1) remained unchanged, whereas CD8, a marker linked to NK cell cytotoxicity (51), increased at S2, primarily in the CD56bright NK cell subset (Supplementary Figure S5).
To complement our supervised analysis, we conducted unsupervised clustering using uniform manifold approximation and projection (UMAP) and FlowSOM methodologies (Figures 1H, I). Among CD56+ NK cells, the analysis identified 8 distinct NK cell populations (or Pops) based on the expression of 5 (NKG2A, CD31, CD9, CD56, CD57) and 9 (CD57, CD160, CD229, CD55, CD38, LAIR-1, CD8, HLA-DR and CD26) surface markers analyzed in panel 1 and 2, respectively (Supplementary Table S1). In panel 1 (Figure 1H), we observed a significant increase in Pop 1 at S2, characterized by high expression of NKG2A, CD31, CD9, and CD56, but low CD57 expression. Conversely, Pop 4 and Pop 6 frequencies decreased at S2, with Pop 6 displaying higher CD57 levels. In panel 2 (Figure 1I), Pop 3 increased at S2, and is characterized by low CD57, CD229, and CD160 levels but high CD26, CD55, HLA-DR, CD38, and LAIR-1 expression. In contrast, Pop 7, characterized by high CD160 expression, decreased at S2. Additionally, Pop 6 decreased while Pop 5 increased after S4, coinciding with CD57 recovery. These unsupervised analysis confirmed the findings from our supervised approach.
Taken together, our results demonstrate that early after autoHSCT, NK cells acquire a more immature, activated, and decidual-like phenotype, with a receptor repertoire skewed toward an inhibitory profile. This is reflected by the transient increase in the expression of inhibitory receptors and the concurrent decrease in activating receptors.
Plasma cytokine profile following autoHSCT
We have previously observed that certain cytokines present immediately after autoHSCT may contribute to the acquisition of a decidual-like phenotype by NK cells (28). To investigate the influence of these cytokines on other markers, we quantified their plasma levels and analyzed their correlation with the expression of previously studied receptors in NK cells. Consistent with previous findings in both adult and pediatric patients (24, 26, 28), we observed a significant increase in IL-15 plasma levels shortly after autoHSCT in this cohort (Figure 2A). Next, correlation analyses were performed between flow cytometry data and plasma cytokine levels, although in Figure 2B we only displayed those correlations that yielded statistically significant results. Furthermore, IL-15 levels at S2 positively correlated with the expression of CD55, HLA-DR and CD26 (Figure 2B). Given that these markers are also upregulated at S2, this suggests that elevated IL-15 levels may contribute, at least partially, to the activation phenotype of NK cells at this time point.
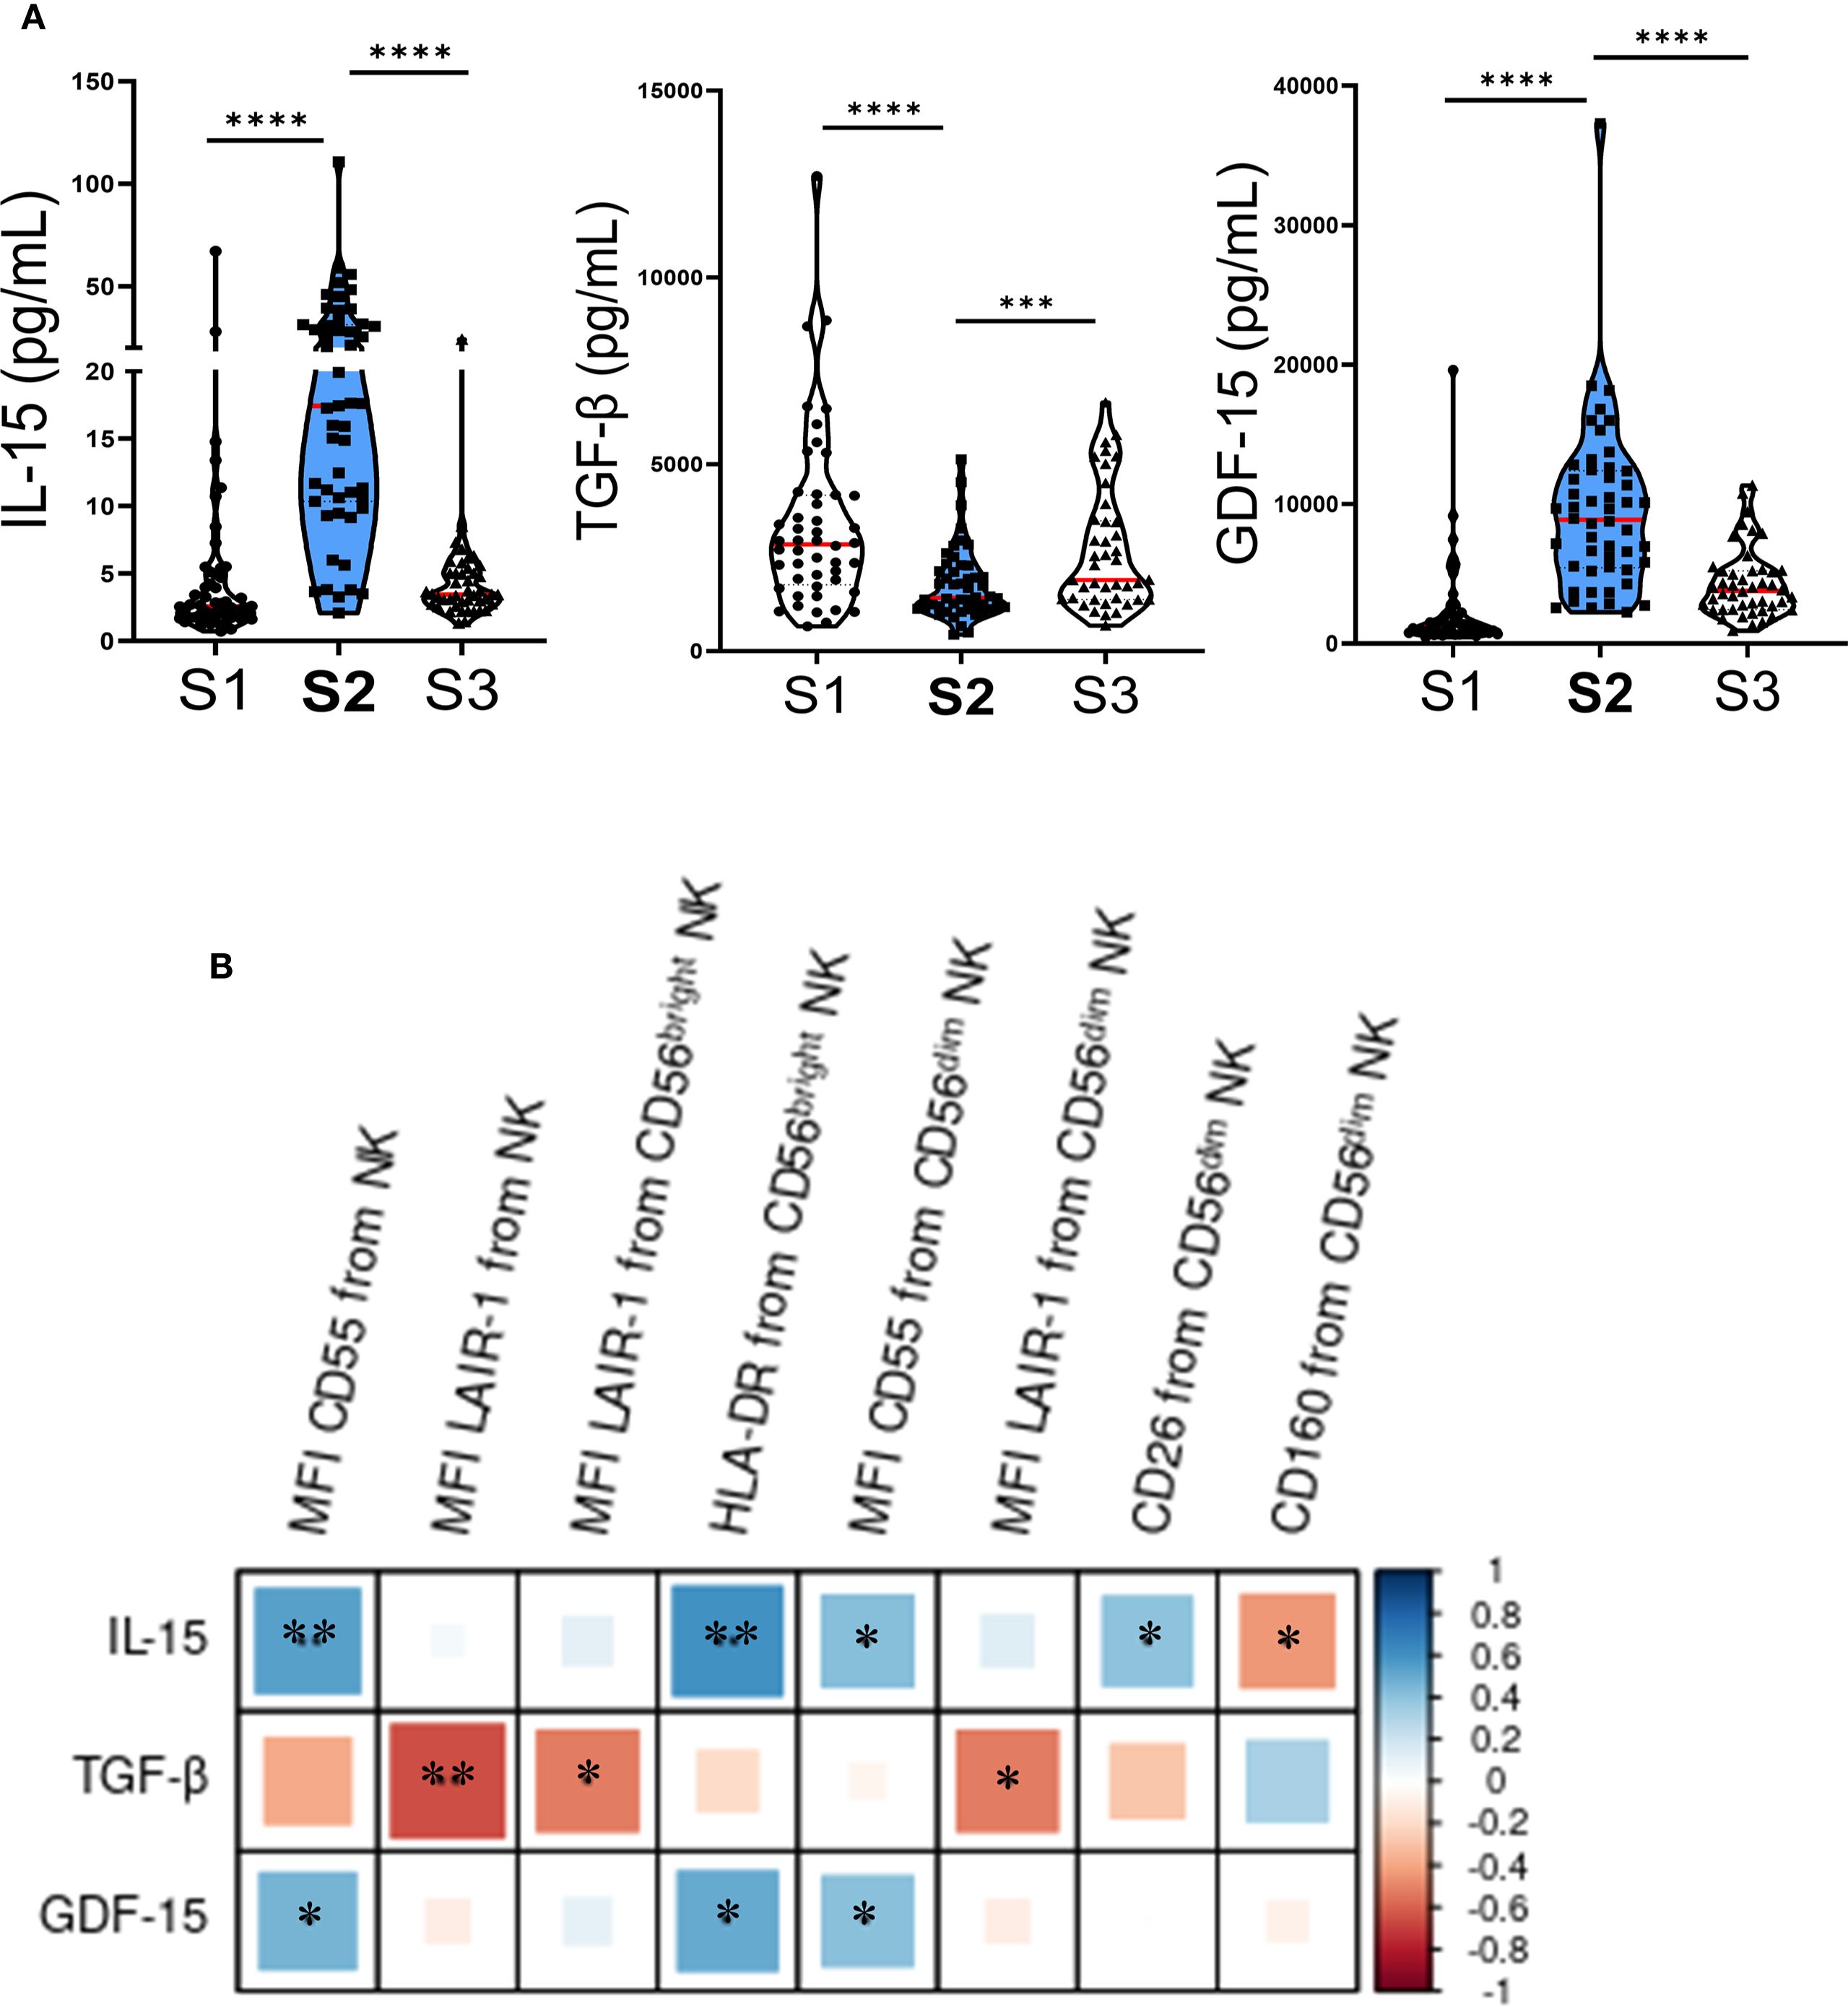
Figure 2. Plasma cytokine levels change early after autoHSCT and correlate with NK cell markers. (A) Violin plots depicting IL-15, TGF-β, and GDF-15 plasma levels at S1 (pre-autoHSCT), S2 (leukocyte recovery, around day 12), and S3 (30 days post-autoHSCT). Medians are indicated in red (S1 n=52; S2 n=51; S3 n=44) and IQR (25th–75th percentiles) in green. Comparisons with S2 were performed using the Wilcoxon matched-pairs signed-rank test (***p < 0.001, ****p < 0.0001). (B) Correlogram showing Pearson correlation coefficients between flow cytometry markers and cytokine plasma levels at S2. *p < 0.05, **p < 0.01; non-significant values not shown.
In contrast, plasma levels of TGF-β significantly decreased at S2 (Figure 2A). Additionally, we observed a negative correlation between plasma levels of TGF-β at S2 and the expression of LAIR-1, as well as a non-significant trend suggesting that TGF-β might counteract the effect of IL-15 on CD55, HLA-DR and CD26 expression (Figure 2B). Lastly, we examined the plasma levels of growth differentiation factor 15 (GDF-15) and found a significant increase at S2 (Figure 2A). GDF-15 levels positively correlated with the expression of CD55 and HLA-DR (Figure 2B), further supporting its potential involvement in shaping the post-transplant NK cell phenotype.
KIR expression increases following autoHSCT
KIRs regulate the ability of NK cells to recognize and kill tumor cells. KIR-ligand genotypes have been associated with patient outcomes in neuroblastoma (36), and changes in KIR expression have been observed following HSCT (25, 27). Therefore, we investigated KIR expression in our cohort. First, we analyzed the KIR haplotypes of the patients (Supplementary Table S2). We then assessed KIR expression exclusively in patients carrying the genes encoding the analyzed KIRs. Overall, we observed a transient increase in the percentage of KIR3DL1+, KIR2DL2/L3/S2+, KIR2DL1+ and KIR2DS4+ NK cells early after autoHSCT, predominantly within the CD56bright NK cell subset (Figures 3A-D). However, no association was found between KIR expression and disease progression (data not shown).
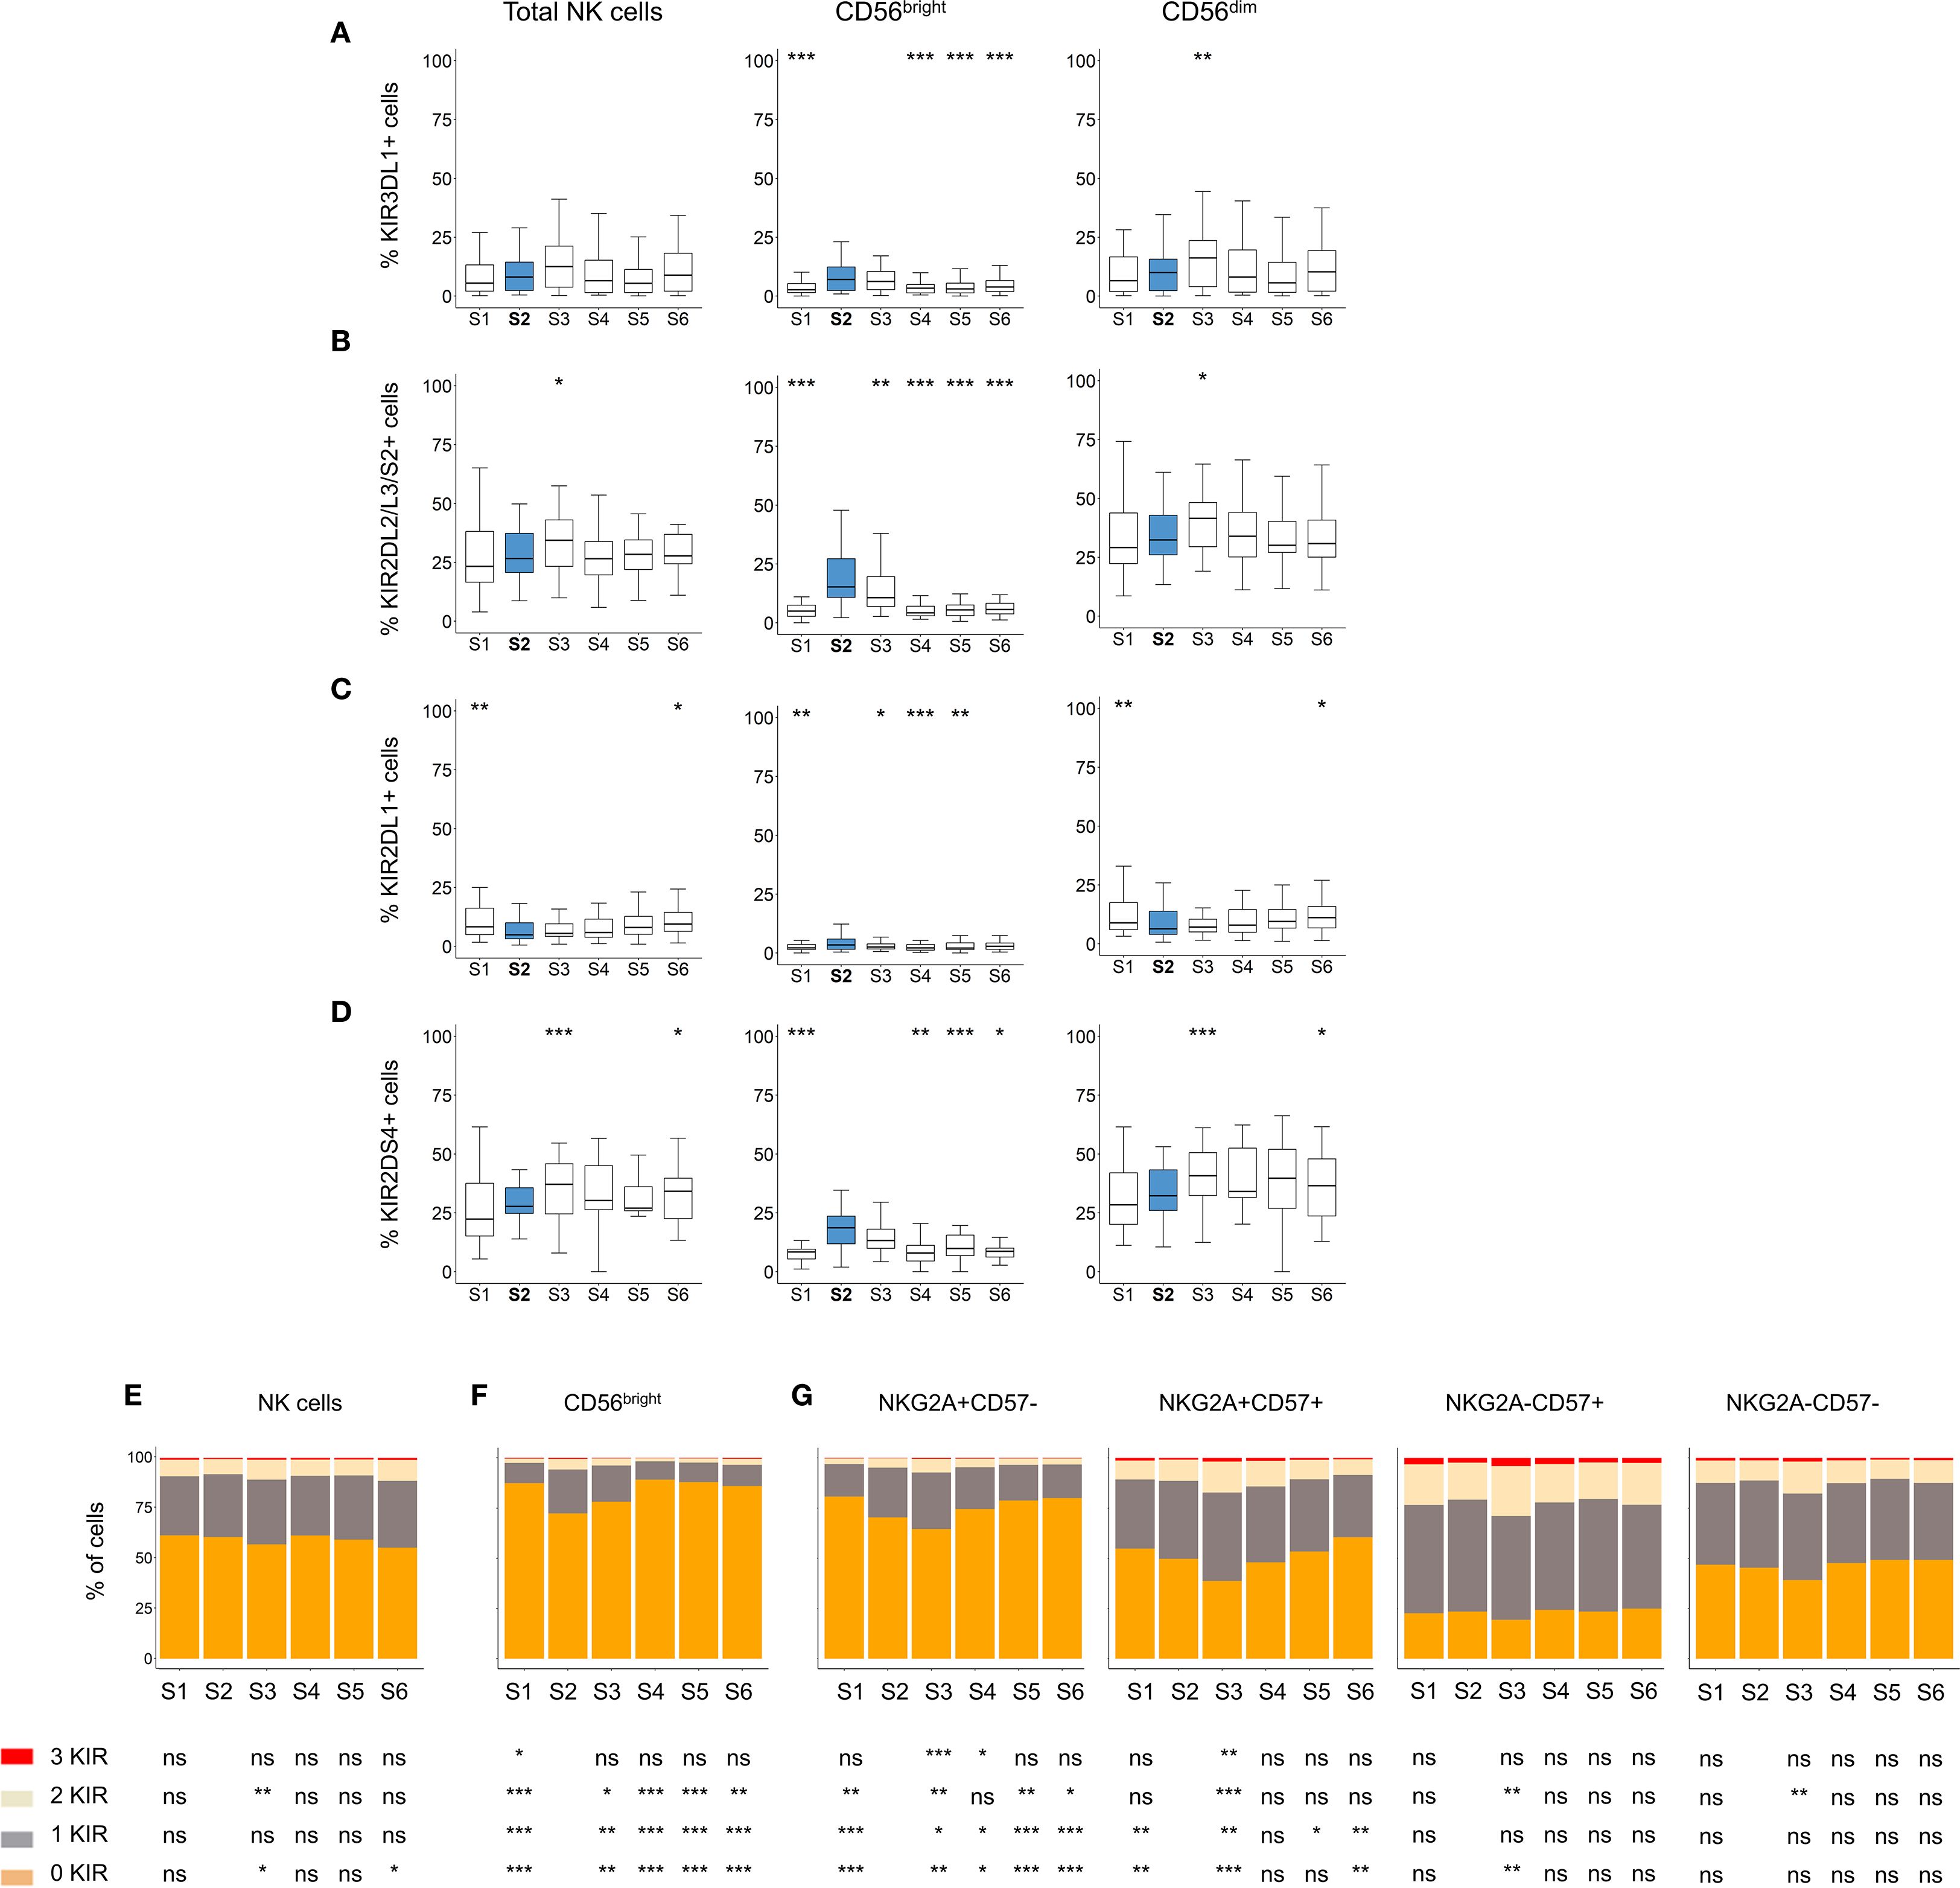
Figure 3. Analysis of KIR expression patterns in NK cells after autoHSCT. (A-D) Boxplot graphs showing the frequency of cells expressing KIR3DL1 (A), KIR2DL2/L3/S2 (B), KIR2DL1 (C) and KIR2DS4 (D) within total NK cells, as well as CD56dim and CD56bright NK cell subsets at S1-S6. Boxplots depict the median, IQR (25th–75th percentiles), and whiskers (minimum and maximum values). Significance was assessed by Wilcoxon matched-pairs signed-rank test relative to S2 (*p < 0.05, **p < 0.01, ***p < 0.001; non-significant values not indicated). (E-G) Bar graphs showing the percentage of NK cells expressing 0 (orange), 1 (grey), 2 (light yellow), or 3 (red) KIR (KIR2DL1, KIR2DL2/L3/S2 and KIR3DL1) across time points (S1-S6). KIR combination analyses in total NK cells (E), CD56bright NK cells (F), and in CD56dim NK cells according to NKG2A and CD57 expression (G). Data are represented as the mean of the percentages of each cell subpopulation. Wilcoxon matched-pairs signed-rank test comparisons with S2: *p < 0.05, **p < 0.01, ***p < 0.001; ns, not significant.
During NK cell differentiation, CD56dim NK cells progressively lose NKG2A expression while acquire CD57 and KIR (52). To further investigate this process, we analyzed the number of expressed KIRs (KIR3DL1, KIR2DL2/L3/S2 and KIR2DL1) across different NK cell subsets. No significant changes in KIR expression were observed on total NK cells after transplantation (Figure 3E). However, within the CD56bright subset, we detected a significant increase in the frequency of cells expressing one, two and tree KIRs at S2 (Figure 3F). Also, and given the altered maturation status of NK cells after autoHSCT (Figure 1E), particularly within the CD56dim subset, we examined KIR expression across different maturation stages. Immature CD56dim NK cells (NKG2A+CD57-) exhibited lower KIR expression compared to mature (NKG2A-CD57+) CD56dim NK cells (Figure 3G). Notably, both immature NKG2A+CD57- and NKG2A+CD57+ subsets showed a significant increase in KIR-expressing cells at S2 (Figure 3G). These findings suggest that KIR expression is transiently upregulated in immature NK cells early after autoHSCT at S2.
NK cell phenotype impacts NK cell function and correlates with progression-free survival in NHL patients undergoing autoHSC
To assess the clinical relevance of our findings, we first performed correlation analyses between the expression of markers that significantly changed after autoHSCT and relapse in the largest subcohort of patients with NHL (diffuse large B-cell lymphoma, follicular lymphoma, and mantle cell lymphoma) (Table 1) undergoing autoHSCT. However, no significant correlation was observed (data not shown). We then conducted Kaplan-Meier analysis, which revealed that NHL patients with lower frequencies of immature NKG2A+CD57- NK cells or higher frequencies of mature CD57+ NK cell subset at S3 exhibited significantly improved progression-free survival (PFS) (Supplementary Figures S6A, B). Additionally, we observed a trend suggesting that patients with lower levels of GDF-15 at S2 tended to have better PFS, although this association did not reach statistical significance (Supplementary Figure S6C). Given the clinical heterogeneity and limited sample size of our cohort, these findings require validation in larger, more homogeneous patient populations.
Our data indicate that inhibitory receptors such as LAIR-1 are upregulated, while activating receptors downregulated at S2 (Figure 1). Based on these findings, we hypothesized that the altered receptor repertoire observed at S2 might affect NK cell function. To test this hypothesis, we performed in vitro functional assays using patient-derived PBMCs (S1-S3) and agonist antibodies against LAIR-1 inhibitory receptor in a previously described P815-based degranulation assay (37) (see Materials and Methods). We tested the inhibitory effect of LAIR-1 in CD16-mediated degranulation. At S2, NK cell CD16-mediated degranulation significantly decreased (Figures 4A, B), coinciding with increased LAIR-1 expression (Figure 1F). Moreover, we observed a negative correlation between LAIR-1 upregulation and the degranulation capacity, although this did not reach statistical significance (Figures 4C, D). These findings suggest that increased expression of inhibitory receptors may contribute to impaired NK cell function early after autoHSCT.
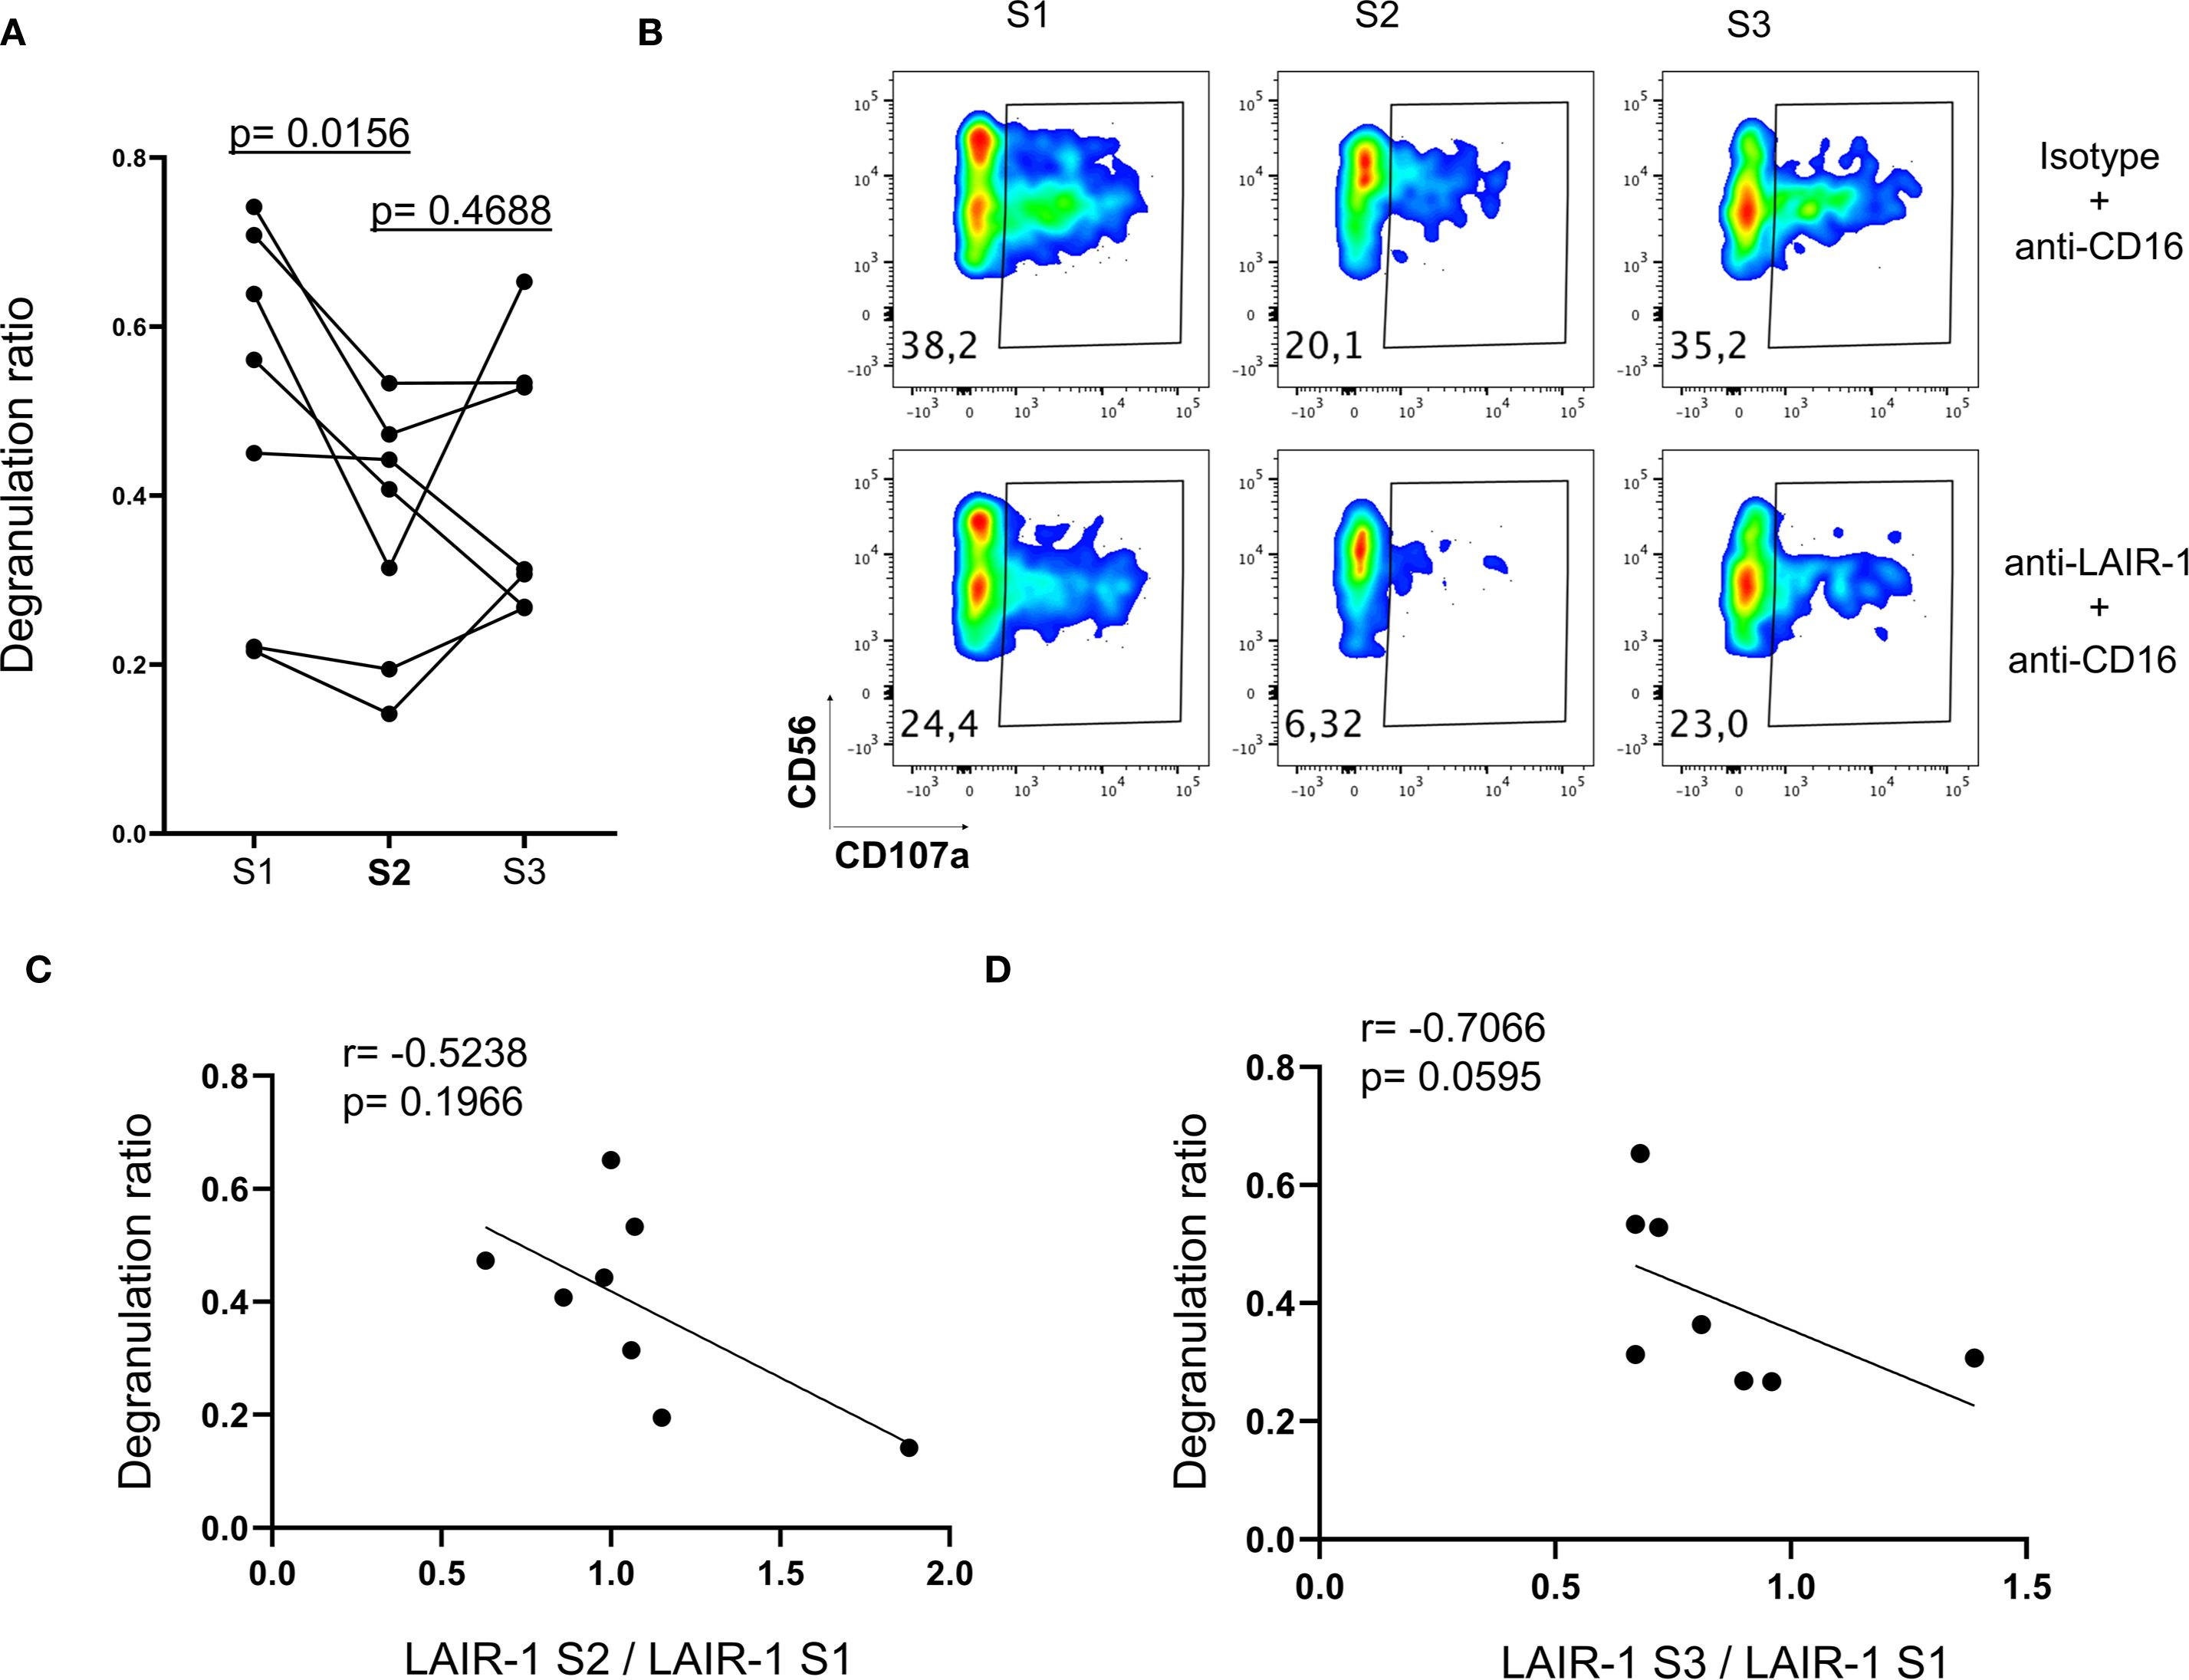
Figure 4. The impact of receptor repertoire changes in NK cell function. NK cells from patients at S1, S2 and S3 were analyzed for degranulation (CD107a) response to antibodies stimulation (see Materials and Methods). (A) Degranulation ratio is calculated according to the formula: percentage of CD107a+ NK cells in the presence of anti-LAIR-1 and anti-CD16 antibodies/percentage of CD107a+ NK cells in the presence of isotype control and anti-CD16 antibodies. Each point represents an individual patient (n=7). Comparisons with S2 were using Wilcoxon matched-pairs signed-rank test. (B) Representative degranulation (CD107a) data from a patient. (C) Correlogram depicting the Spearman correlation between LAIR-1 expression ratio (MFI of LAIR-1 at S2/MFI LAIR-1 at S1) and the degranulation ratio at S2. (D) Correlogram showing the Spearman correlation between LAIR-1 expression ratio (MFI of LAIR-1 at S3/MFI LAIR-1 at S1) and degranulation ratio at S3.
Discussion
In this study, we have investigated the reconstitution of NK cells in adult patients with various hematological malignancies following autoHSCT. We analyzed phenotypic alterations in NK cell subsets, measured plasma cytokine levels relevant to NK cell function, conducted in vitro functional assays to explore the impact of these phenotypic changes, and performed data analysis to identify potential prognostic biomarkers and elucidate mechanisms underlying NK cell phenotype modulation early after autoHSCT. Previous studies have reported substantial changes in the NK cell surface phenotype and the transcriptome following autoHSCT (25–28). Our findings reveal a shift towards a decidual-like, immature and activated phenotype, with an increased expression of inhibitory receptors and a reduction in activating receptors early after autoHSCT in lymphoma patients. This activated and decidual-like phenotype is characterized by an upregulated expression of CD56, CD9, CD49a, CD151, CD38, and HLA-DR shortly after autoHSCT. Furthermore, plasma cytokine levels were associated with these phenotypic changes, and the in vitro experiments suggest that some of these alterations may modulate NK cell function. Specifically, LAIR-1’s increased expression early after autoHSCT is able to inhibit CD16-mediated degranulation (Figure 4). Collagen is the ligand of LAIR-1 (53, 54). Interestingly, the upregulation of collagen expression by tumor cells and/or tumor stroma could lead to the downregulation of anti-tumor responses mediated by LAIR-1 expressed on NK cells (55, 56). This suggests that in certain specific circumstances, the increased expression of LAIR-1 following autoHSCT may have a role in controlling tumor growth. However, we have not seen a correlation between relapse and expression levels of LAIR-1 in our cohort. Undoubtedly, more studies in similar and other cohorts (perhaps in patients with solid tumors undergoing autoHSCT) are required to properly assign a role to LAIR-1 overexpressing NK cells in tumor control following autoHSCT. Regarding 2B4, it has been previously shown to deliver an inhibitory signal in decidual NK cells due to deficient expression of the signaling lymphocyte activation molecule (SLAM)–associated protein (SAP) at both mRNA and protein levels (57). However, in our study, we considered 2B4 an activating receptor because we are examining peripheral blood NK cells, not decidual NK cells. Furthermore, supporting our interpretation, our previous data on peripheral blood NK cells showed no significant change in SH2D1A, the gene encoding SAP, transcript levels in the S2 sample compared to S1 and S3 (27). This strongly suggests that, in the context of autoHSCT in peripheral blood, 2B4 primarily functions as an activating receptor.
The cytokine milieu plays a crucial role in shaping the NK cell phenotype in cancer patients undergoing autoHSCT. Correlation analyses (Figure 2B) indicated that the increased expression of activation markers such as HLA-DR and CD26, as well as receptors like CD55, could be driven, at least in part, by elevated IL-15 levels at S2 (Figure 2A). This aligns with previous studies, highlighting the importance of IL-15 in NK cell activation (28, 43, 58–60). Conversely, TGF-β exhibited a tendency to counteract the effects of IL-15 (Figure 2B); however, IL-15 appeared dominant, as marker expression correlated more strongly with IL-15 than TGF-β levels, in agreement with prior findings (28).
High frequencies of circulating CD9+ NK cells have been associated with poor cancer prognosis (61–64), suggesting that CD9 could serve as a prognostic biomarker in cancer patients. While CD9+ NK cells have been linked to prognosis in other cancer settings, our findings, coupled with our previous observations in MM and pediatric oncology patients, suggest that the robust expansion of this subset following autoHSCT is a phenomenon occurring independently of the specific underlying malignancy (27, 28). Furthermore, we believe that our data suggest that NK cell dynamics, at least for the parameters investigated in this article, are primarily influenced by the auto-HSCT procedure rather than by disease-specific heterogeneity, a finding supported by our previous work (26–28). Nevertheless, larger and more homogeneous patient cohorts will be necessary to establish CD9+ NK cells as a definitive prognostic biomarker.
In our cohort of hematological cancer patients, we observed that NK cells with an immature phenotype (NKG2A+CD57-) were most frequent at S2, whereas the more mature subset (NKG2A-CD57+) had the lowest frequencies at this time point, followed by a gradual increase, reaching peak levels at S5 and S6. This aligns with established NK cell developmental models, in which NK cells progressively lose NKG2A and acquire CD57 expression as they mature (29, 52). Immature CD56bright and NKG2A+CD57- NK cells expressing KIR expanded at S2 (Figure 3), consistent with previous observations in pediatric oncologic patients (28). These cells may represent NK cells that have upregulated CD56 expression in response to IL-15 stimulation (58).
Identifying novel prognostic biomarkers is of significant clinical relevance. We observed that NHL patients with lower frequencies of immature NKG2A+CD57- NK cells or higher frequencies of mature CD57+ NK cells at day +30 after autoHSCT (S3) exhibited superior PFS (Supplementary Figures S6A, B). This contrasts with previous findings in MM patients, where lower frequencies of mature CD57+NKG2A- NK cells were associated with improved clinical outcomes (26). These discrepancies may stem from differences in malignancies (MM vs. lymphomas) and conditioning regimens (melphalan 200 mg/m² vs. BEAM chemotherapy). In lymphomas, NKG2A-expressing NK cells may contribute to poorer prognosis due to potential inhibition by HLA-E expressing tumor cells (65, 66).
Finally, we observed a trend suggesting that NHL patients with lower GDF-15 levels at S2 tended to have improved PFS (Supplementary Figure S6C). GDF-15 has been implicated in NK cell inhibition in inflammation, pregnancy, and various cancers (67). Furthermore, serum levels of GDF-15 has been proposed as a biomarker in patients with cancer (68, 69). Although the mechanism of GDF-15 in cancer has long remained elusive, recent studies have demonstrated that it impairs LFA-1-mediated adhesion of T cells to activated endothelial cells, which is a crucial step for T cell extravasation (70). A similar inhibitory effect on NK cell trafficking is plausible; however, further studies are required to confirm this hypothesis.
Despite these findings, our results should be interpreted with caution due to the relatively small and heterogeneous nature of our cohort. Further studies involving larger and more homogenous patient populations will be required to validate these observations and confirm their clinical relevance. Nevertheless, our results provide understanding into the dynamics of the NK cell pool reconstitution following autoHSCT and may help to develop therapeutic strategies for cancer patients undergoing this treatment.
Data availability statement
The raw data supporting the conclusions of this article will be made available by the authors, without undue reservation.
Ethics statement
The studies involving humans were approved by Basque Ethics Committee for Clinical Research (BIO14/TP/003, PI+CES+INC-BIOEF 2017-03). The studies were conducted in accordance with the local legislation and institutional requirements. The participants provided their written informed consent to participate in this study. Ethical approval was not required for the studies on animals in accordance with the local legislation and institutional requirements because only commercially available established cell lines were used.
Author contributions
GA: Methodology, Writing – original draft. VS: Methodology, Writing – review & editing. AA: Writing – review & editing. AL: Writing – review & editing. IS: Writing – review & editing. AI: Writing – review & editing. RP: Writing – review & editing, Methodology. SP: Writing – review & editing, Formal analysis. BS: Formal analysis, Writing – review & editing. BM: Formal analysis, Writing – review & editing. RB: Methodology, Writing – review & editing. CG: Resources, Writing – review & editing. AU: Writing – review & editing, Resources. MR: Writing – review & editing, Methodology. MA: Writing – review & editing, Methodology. EA: Writing – review & editing, Resources. JM: Writing – review & editing, Resources. JG: Resources, Writing – review & editing. OZ: Writing – review & editing. LA: Conceptualization, Methodology, Writing – original draft, Writing – review & editing. FB: Conceptualization, Supervision, Writing – original draft, Writing – review & editing.
Funding
The author(s) declare financial support was received for the research and/or publication of this article. This work was funded by the following grants: Fundación AECC-Spanish Association Against Cancer (PROYE16074BORR) and BIOEF (Basque Foundation for Research and Innovation)-EiTB Maratoia (BIO20/CI/009). GA-P, AA-I and VS are recipients of a predoctoral contract funded by Fundación AECC-Spanish Association Against Cancer (PRDVZ21440ASTA, PRDVZ234209AMAR and PRDVZ246121SAND). AL-P is recipient of a predoctoral contract funded by La Caixa Foundation (100010434; LCF/BQ/DI22/11940012). AI-L is a recipient of a predoctoral contract funded by the Basque Government (PRE_2024_1_0189). GA-P, AA-I, VS and AL-P are recipients of a fellowship from the Jesús de Gangoiti Barrera Foundation (FJGB21/001, FJBG21/005, FJGB22/011, FJGB23/005 and FJGB23/007). BM-M is recipient of a postdoctoral contract funded by CSYF, European Social Fund, Andalucía, Spain (RH-0060-2020). LA is an Ikerbasque Research Fellow (COFUND program H2020-MSCA-COFUND-2020-101034228-WOLFRAM2) and FB is an Ikerbasque Research Professor.
Acknowledgments
We thank all patients and families who participated in this study, the staff from the Basque Biobank for Research and the staff from the Flow Cytometry Platform of Biobizkaia Health Research Institute. We also thank Rafael González for the critical reading of the manuscript.
Conflict of interest
The authors declare that the research was conducted in the absence of any commercial or financial relationships that could be construed as a potential conflict of interest.
Generative AI statement
The author(s) declare that no Generative AI was used in the creation of this manuscript.
Any alternative text (alt text) provided alongside figures in this article has been generated by Frontiers with the support of artificial intelligence and reasonable efforts have been made to ensure accuracy, including review by the authors wherever possible. If you identify any issues, please contact us.
Publisher’s note
All claims expressed in this article are solely those of the authors and do not necessarily represent those of their affiliated organizations, or those of the publisher, the editors and the reviewers. Any product that may be evaluated in this article, or claim that may be made by its manufacturer, is not guaranteed or endorsed by the publisher.
Supplementary material
The Supplementary Material for this article can be found online at: https://www.frontiersin.org/articles/10.3389/fimmu.2025.1629118/full#supplementary-material
References
1. Vivier E, Artis D, Colonna M, Diefenbach A, Di Santo JP, Eberl G, et al. Innate lymphoid cells: 10 years on. Cell. (2018) 174:1054–66. doi: 10.1016/j.cell.2018.07.017
2. Guillerey C. Roles of cytotoxic and helper innate lymphoid cells in cancer. Mamm Genome. (2018) 29:777–89. doi: 10.1007/s00335-018-9781-4
3. Krabbendam L, Bernink JH, and Spits H. Innate lymphoid cells: from helper to killer. Curr Opin Immunol. (2021) 68:28–33. doi: 10.1016/j.coi.2020.08.007
4. Prager I and Watzl C. Mechanisms of natural killer cell-mediated cellular cytotoxicity. J Leukoc Biol. (2019) 105:1319–29. doi: 10.1002/JLB.MR0718-269R
5. Michel T, Poli A, Cuapio A, Briquemont B, Iserentant G, Ollert M, et al. Human CD56bright NK cells: an update. J Immunol. (2016) 196:2923–31. doi: 10.4049/jimmunol.1502570
6. Cooper MA, Fehniger TA, and Caligiuri MA. The biology of human natural killer-cell subsets. Trends Immunol. (2001) 22:633–40. doi: 10.1016/S1471-4906(01)02060-9
7. Caligiuri MA. Human natural killer cells. Blood. (2008) 112:461–9. doi: 10.1182/blood-2007-09-077438
8. Freud AG, Mundy-Bosse BL, Yu J, and Caligiuri MA. The broad spectrum of human natural killer cell diversity. Immunity. (2017) 47:820–33. doi: 10.1016/j.immuni.2017.10.008
9. Long EO, Kim HS, Liu D, Peterson ME, and Rajagopalan S. Controlling natural killer cell responses: integration of signals for activation and inhibition. Annu Rev Immunol. (2013) 31:227–58. doi: 10.1146/annurev-immunol-020711-075005
10. Vivier E, Ugolini S, Blaise D, Chabannon C, and Brossay L. Targeting natural killer cells and natural killer T cells in cancer. Nat Rev Immunol. (2012) 12:239–52. doi: 10.1038/nri3174
11. Cerwenka A and Lanier LL. Natural killer cell memory in infection, inflammation and cancer. Nat Rev Immunol. (2016) 16:112–23. doi: 10.1038/nri.2015.9
12. Chen Y, Wang M, and Romaguera J. Current regimens and novel agents for mantle cell lymphoma. Br J Haematol. (2014) 167:3–18. doi: 10.1111/bjh.13000
13. Giulia P and Corradini P. Autologous stem cell transplantation for T-cell lymphomas. Semin Hematol. (2014) 51:59–66. doi: 10.1053/j.seminhematol.2013.11.002
14. Perales MA, Ceberio I, Armand P, Burns LJ, Chen R, Cole PD, et al. Role of cytotoxic therapy with hematopoietic cell transplantation in the treatment of Hodgkin lymphoma: guidelines from the American society for blood and marrow transplantation. Biol Blood Marrow Transpl. (2015) 21:971–83. doi: 10.1016/j.bbmt.2015.02.022
15. Shah N, Callander N, Ganguly S, Gul Z, Hamadani M, Costa L, et al. Hematopoietic stem cell transplantation for multiple myeloma: guidelines from the American society for blood and marrow transplantation. Biol Blood Marrow Transpl. (2015) 21:1155–66. doi: 10.1016/j.bbmt.2015.03.002
16. Porrata L, Ingle J, Litzow M, Geyer S, and Markovic S. Prolonged survival associated with early lymphocyte recovery after autologous hematopoietic stem cell transplantation for patients with metastatic breast cancer. Bone Marrow Transpl. (2001) 28:865–71. doi: 10.1038/sj.bmt.1703236
17. Porrata LF, Gertz MA, Inwards DJ, Litzow MR, Lacy MQ, Tefferi A, et al. Early lymphocyte recovery predicts superior survival after autologous hematopoietic stem cell transplantation in multiple myeloma or non-Hodgkin lymphoma. Blood. (2001) 98:579–85. doi: 10.1182/blood.V98.3.579
18. Porrata LF, Inwards DJ, Micallef IN, Ansell SM, Geyer SM, and Markovic SN. Early lymphocyte recovery post-autologous haematopoietic stem cell transplantation is associated with better survival in Hodgkin’s disease. Br J Haematol. (2002) 117:629–33. doi: 10.1046/j.1365-2141.2002.03478.x
19. Storek J, Geddes M, Khan F, Huard B, Helg C, Chalandon Y, et al. Reconstitution of the immune system after hematopoietic stem cell transplantation in humans. Semin Immunopathol. (2008) 30:425–37. doi: 10.1007/s00281-008-0132-5
20. Porrata LF, Litzow MR, and Markovic SN. Immune reconstitution after autologous hematopoietic stem cell transplantation. Mayo Clin Proc. (2001) 76:407–12. doi: 10.4065/76.4.407
21. Porrata LF. Natural killer cells are key host immune effector cells affecting survival in autologous peripheral blood hematopoietic stem cell transplantation. Cells. (2022) 11:3469. doi: 10.3390/cells11213469
22. Porrata LF, Inwards DJ, Ansell SM, Micallef IN, Johnston PB, Gastineau DA, et al. Early lymphocyte recovery predicts superior survival after autologous stem cell transplantation in non-Hodgkin lymphoma: A prospective study. Biol Blood Marrow Transpl. (2008) 14:807–16. doi: 10.1016/j.bbmt.2008.04.013
23. Rueff J, Medinger M, Heim D, Passweg J, and Stern M. Lymphocyte subset recovery and outcome after autologous hematopoietic stem cell transplantation for plasma cell myeloma. Biol Blood Marrow Transpl. (2014) 20:896–9. doi: 10.1016/j.bbmt.2014.03.007
24. Porrata LF, Inwards DJ, Micallef IN, Johnston PB, Ansell SM, Hogan WJ, et al. Interleukin-15 affects patient survival through natural killer cell recovery after autologous hematopoietic stem cell transplantation for non-Hodgkin lymphomas. Clin Dev Immunol. (2010) 2010:1–13. doi: 10.1155/2010/914945
25. Jacobs B, Tognarelli S, Poller K, Bader P, Mackensen A, and Ullrich E. NK cell subgroups, phenotype, and functions after autologous stem cell transplantation. Front Immunol. (2015) 6:583. doi: 10.3389/fimmu.2015.00583
26. Orrantia A, Terrén I, Astarloa-Pando G, González C, Uranga A, Mateos-Mazón JJ, et al. NK cell reconstitution after autologous hematopoietic stem cell transplantation: association between NK cell maturation stage and outcome in multiple myeloma. Front Immunol. (2021) 12:748207. doi: 10.3389/fimmu.2021.748207
27. Orrantia A, Vázquez-De Luis E, Astarloa-Pando G, Terrén I, Amarilla-Irusta A, Polanco-Alonso D, et al. In vivo expansion of a CD9+ Decidual-like NK cell subset following autologous hematopoietic stem cell transplantation. iScience. (2022) 25:105235. doi: 10.1016/j.isci.2022.105235
28. Astarloa-Pando G, Polanco-Alonso D, Sandá V, Orrantia A, Amarilla-Irusta A, Pérez-Fernández S, et al. Natural killer cells adopt an activated and decidual-like phenotype after autologous hematopoietic stem cell transplantation in children with cancer. Commun Med. (2025) 5:205. doi: 10.1038/s43856-025-00911-w
29. Orrantia A, Terrén I, Astarloa-Pando G, Zenarruzabeitia O, and Borrego F. Human nk cells in autologous hematopoietic stem cell transplantation for cancer treatment. Cancers (Basel). (2021) 13:1–20. doi: 10.3390/cancers13071589
30. Arteche-López A, Kreutzman A, Alegre A, Sanz Martín P, Aguado B, González-Pardo M, et al. Multiple myeloma patients in long-term complete response after autologous stem cell transplantation express a particular immune signature with potential prognostic implication. Bone Marrow Transpl. (2017) 52:832–8. doi: 10.1038/bmt.2017.29
31. Marra J, Greene J, Hwang J, Du J, Damon L, Martin T, et al. KIR and HLA genotypes predictive of low-affinity interactions are associated with lower relapse in autologous hematopoietic cell transplantation for acute myeloid leukemia. J Immunol. (2015) 194:4222–30. doi: 10.4049/jimmunol.1402124
32. Venstrom JM, Zheng J, Noor N, Danis KE, Yeh AW, Cheung IY, et al. KIR and HLA genotypes are associated with disease progression and survival following autologous hematopoietic stem cell transplantation for high-risk neuroblastoma. Clin Cancer Res. (2009) 15:7330–4. doi: 10.1158/1078-0432.CCR-09-1720
33. Leung W, Handgretinger R, Iyengar R, Turner V, Holladay MS, and Hale GA. Inhibitory KIR-HLA receptor-ligand mismatch in autologous haematopoietic stem cell transplantation for solid tumour and lymphoma. Br J Cancer. (2007) 97:539–42. doi: 10.1038/sj.bjc.6603913
34. Stringaris K and Barrett AJ. The importance of natural killer cell killer immunoglobulin-like receptor-mismatch in transplant outcomes. Curr Opin Hematol. (2017) 24:489–95. doi: 10.1097/MOH.0000000000000384
35. Gabriel IH, Sergeant R, Szydlo R, Apperley JF, DeLavallade H, Alsuliman A, et al. Interaction between KIR3DS1 and HLA-Bw4 predicts for progression-free survival after autologous stem cell transplantation in patients with multiple myeloma. Blood. (2010) 116:2033–9. doi: 10.1182/blood-2010-03-273706
36. Erbe AK, Wang W, Carmichael L, Kim KM, Mendoņca EA, Song Y, et al. Neuroblastoma patients’ KIR and KIR-ligand genotypes influence clinical outcome for dinutuximab-based immunotherapy: A report from the children’s oncology group. Clin Cancer Res. (2018) 24:189–96. doi: 10.1158/1078-0432.CCR-17-1767
37. Terrén I, Astarloa-Pando G, Amarilla-Irusta A, and Borrego F. P815-based redirected degranulation assay to study human NK cell effector functions. Methods Cell Biol. (2023) 173:33–48. doi: 10.1016/bs.mcb.2022.02.002
38. Vento-Tormo R, Efremova M, Botting RA, Turco MY, Vento-Tormo M, Meyer KB, et al. Single-cell reconstruction of the early maternal–fetal interface in humans. Nature. (2018) 563:347–53. doi: 10.1038/s41586-018-0698-6
39. Koopman LA, Kopcow HD, Rybalov B, Boyson JE, Orange JS, Schatz F, et al. Human decidual natural killer cells are a unique NK cell subset with immunomodulatory potential. J Exp Med. (2003) 198:1201–12. doi: 10.1084/jem.20030305
40. Li H, Hou Y, Zhang S, Zhou Y, Wang D, Tao S, et al. CD49a regulates the function of human decidual natural killer cells. Am J Reprod Immunol. (2019) 81:1–8. doi: 10.1111/aji.13101
41. Du X, Zhu H, Jiao D, Nian Z, Zhang J, Zhou Y, et al. Human-induced CD49a+ NK cells promote fetal growth. Front Immunol. (2022) 13:821542. doi: 10.3389/fimmu.2022.821542
42. Erokhina SA, Streltsova MA, Kanevskiy LM, Telford WG, Sapozhnikov AM, and Kovalenko EI. HLA-DR+ NK cells are mostly characterized by less mature phenotype and high functional activity. Immunol Cell Biol. (2018) 96:212–28. doi: 10.1111/imcb.1032
43. Yamabe T, Takakura K, Sugie K, Kitaoka Y, Takeda S, Okubo Y, et al. Induction of the 2B9 antigen/dipeptidyl peptidase IV/CD26 on human natural killer cells by IL-2, IL-12 or IL-15. Immunology. (1997) 91:151–8. doi: 10.1046/j.1365-2567.1997.00230.x
44. Deaglio S, Zubiaur M, Gregorini A, Bottarel F, Ausiello CM, Dianzani U, et al. Human CD38 and CD16 are functionally dependent and physically associated in natural killer cells. Blood. (2002) 99:2490–8. doi: 10.1182/blood.V99.7.2490
45. Finberg RW, White W, and Nicholson-Weller A. Decay-accelerating factor expression on either effector or target cells inhibits cytotoxicity by human natural killer cells. J Immunol. (1992) 149:2055–60. doi: 10.4049/jimmunol.149.6.2055
46. Han M, Hu L, Wu D, Zhang Y, Li P, Zhao X, et al. IL-21R-STAT3 signalling initiates a differentiation program in uterine tissue-resident NK cells to support pregnancy. Nat Commun. (2023) 14:7109. doi: 10.1038/s41467-023-42990-0
47. Khan IA, Thomas SY, Moretto MM, Lee FS, Islam SA, Combe C, et al. CCR5 is essential for NK cell trafficking and host survival following toxoplasma gondii infection. PloS Pathog. (2006) 2:0484–500. doi: 10.1371/journal.ppat.0020049
48. Yao X and Matosevic S. Chemokine networks modulating natural killer cell trafficking to solid tumors. Cytokine Growth Factor Rev. (2021) 59:36–45. doi: 10.1016/j.cytogfr.2020.12.003
49. Yang L, Feng Y, Wang S, Jiang S, Tao L, Li J, et al. Siglec-7 is an indicator of natural killer cell function in acute myeloid leukemia. Int Immunopharmacol. (2021) 99:107965. doi: 10.1016/j.intimp.2021.107965
50. Shao J-Y, Yin W-W, Zhang Q-F, Liu Q, Peng M-L, Hu H-D, et al. Siglec-7 defines a highly functional natural killer cell subset and inhibits cell-Mediated activities. Scand J Immunol. (2016) 84:182–90. doi: 10.1111/sji.12455
51. McKinney EF, Cuthbertson I, Harris KM, Smilek DE, Connor C, Manferrari G, et al. CD8+ NK cell transcriptomic signature associated with clinical outcome in relapsing remitting multiple sclerosis. Nat Commun. (2021) 12:635. doi: 10.1038/s41467-020-20594-2
52. Björkström NK, Riese P, Heuts F, Andersson S, Fauriat C, Ivarsson MA, et al. Expression patterns of NKG2A, KIR, and CD57 define a process of CD56dim NK-cell differentiation uncoupled from NK-cell education. Blood. (2010) 116:3853–64. doi: 10.1182/blood-2010-04-281675
53. Lebbink RJ, de Ruiter T, Adelmeijer J, Brenkman AB, van Helvoort JM, Koch M, et al. Collagens are functional, high affinity ligands for the inhibitory immune receptor LAIR-1. J Exp Med. (2006) 203:1419–25. doi: 10.1084/jem.20052554
54. Tang X, Narayanan S, Peruzzi G, Apara A, Natarajan K, Margulies DH, et al. Single residue, arginine 65, is critical for the functional interaction of leukocyte-associated inhibitory receptor-1 with collagens1. J Immunol. (2009) 182:5446–52. doi: 10.4049/jimmunol.0804052
55. Sivori S, Della Chiesa M, Carlomagno S, Quatrini L, Munari E, Vacca P, et al. Inhibitory receptors and checkpoints in human NK cells, implications for the immunotherapy of cancer. Front Immunol. (2020) 11:2156. doi: 10.3389/fimmu.2020.02156
56. Rygiel TP, Stolte EH, de Ruiter T, van de Weijer ML, and Meyaard L. Tumor-expressed collagens can modulate immune cell function through the inhibitory collagen receptor LAIR-1. Mol Immunol. (2011) 49:402–6. doi: 10.1016/j.molimm.2011.09.006
57. Vacca P, Pietra G, Falco M, Romeo E, Bottino C, Bellora F, et al. Analysis of natural killer cells isolated from human decidua: evidence that 2B4 (CD244) functions as an inhibitory receptor and blocks NK-cell function. Blood. (2006) 108:4078–85. doi: 10.1182/blood-2006-04-017343
58. Boyiadzis M, Memon S, Carson J, Allen K, Szczepanski MJ, Vance BA, et al. Up-regulation of NK cell activating receptors following allogeneic hematopoietic stem cell transplantation under a lymphodepleting reduced intensity regimen is associated with elevated IL-15 levels. Biol Blood Marrow Transpl. (2008) 14:290–300. doi: 10.1016/j.bbmt.2007.12.490
59. Erokhina SA, Streltsova MA, Kanevskiy LM, Grechikhina MV, Sapozhnikov AM, and Kovalenko EI. HLA-DR-expressing NK cells: effective killers suspected for antigen presentation. J Leukoc Biol. (2021) 109:327–37. doi: 10.1002/JLB.3RU0420-668RR
60. Wang L, Halliday D, Johnson PM, and Christmas SE. Expression of complement regulatory proteins on human natural killer cell subsets. Immunol Lett. (2007) 112:104–9. doi: 10.1016/j.imlet.2007.07.005
61. Albini A and Noonan DM. Decidual-like NK cell polarization: from cancer killing to cancer nurturing. Cancer Discov. (2021) 11:28–33. doi: 10.1158/2159-8290.CD-20-0796
62. Gallazzi M, Baci D, Mortara L, Bosi A, Buono G, Naselli A, et al. Prostate cancer peripheral blood NK cells show enhanced CD9, CD49a, CXCR4, CXCL8, MMP-9 production and secrete monocyte-recruiting and polarizing factors. Front Immunol. (2021) 11:586126. doi: 10.3389/fimmu.2020.586126
63. Bruno A, Bassani B, D’Urso DG, Pitaku I, Cassinotti E, Pelosi G, et al. Angiogenin and the MMP9-TIMP2 axis are up-regulated in proangiogenic, decidual NK-like cells from patients with colorectal cancer. FASEB J. (2018) 32:5365–77. doi: 10.1096/fj.201701103R
64. Gonzalez VD, Huang Y-W, Delgado-Gonzalez A, Chen S-Y, Donoso K, Sachs K, et al. High-grade serous ovarian tumor cells modulate NK cell function to create an immune-tolerant microenvironment. Cell Rep. (2021) 36:109632. doi: 10.1016/j.celrep.2021.109632
65. Fisher JG, Walker CJ, Doyle ADP, Johnson PWM, Forconi F, Cragg MS, et al. Selinexor enhances NK cell activation against Malignant B cells via downregulation of HLA-E. Front Oncol. (2021) 11:785635. doi: 10.3389/fonc.2021.785635
66. Kren L, Fabian P, Slaby O, Janikova A, Soucek O, Sterba J, et al. Multifunctional immune-modulatory protein HLA-E identified in classical Hodgkin lymphoma: possible implications. Pathol Res Pract. (2012) 208:45–9. doi: 10.1016/j.prp.2011.11.004
67. Wischhusen J, Melero I, and Fridman WH. Growth/differentiation factor-15 (GDF-15): from biomarker to novel targetable immune checkpoint. Front Immunol. (2020) 11:951. doi: 10.3389/fimmu.2020.00951
68. Xing R, Gan J, Mei J, Li Z, and Xu J. Serum GDF15 level as predictive biomarker of clinical outcome in patients with unresectable hepatocellular carcinoma treated with hepatic arterial infusion chemotherapy. Front Immunol. (2025) 16:1619387. doi: 10.3389/fimmu.2025.1619387
69. Hüllwegen M, Kleinert M, von Haehling S, and Fischer A. GDF15: from biomarker to target in cancer cachexia. Trends Cancer. (2025). doi: 10.1016/j.trecan.2025.06.007
Keywords: NK cells, autologous hematopoietic stem cell transplantation, autoHSCT, LAIR-1, CD9, GDF-15, IL-15, TGF-β
Citation: Astarloa-Pando G, Sandá V, Amarilla-Irusta A, Lopez-Pardo A, San Juan I, Iturbe-Larrondo A, Pérez-Garay R, Pérez-Fernández S, Santos-Zorrozúa B, Manzanares-Martín B, Bernardo R, González C, Uranga A, Rey M, Alonso M, Amutio E, Mateos-Mazón JJ, García-Ruiz JC, Zenarruzabeitia O, Amo L and Borrego F (2025) Dynamics of NK cell subsets following autologous hematopoietic stem cell transplantation in adult oncologic patients. Front. Immunol. 16:1629118. doi: 10.3389/fimmu.2025.1629118
Received: 15 May 2025; Accepted: 02 September 2025;
Published: 07 October 2025.
Edited by:
Shannon McCurdy, University of Pennsylvania, United StatesReviewed by:
Joseph Clara, University of Virginia, United StatesMariella Della Chiesa, University of Genoa, Italy
Copyright © 2025 Astarloa-Pando, Sandá, Amarilla-Irusta, Lopez-Pardo, San Juan, Iturbe-Larrondo, Pérez-Garay, Pérez-Fernández, Santos-Zorrozúa, Manzanares-Martín, Bernardo, González, Uranga, Rey, Alonso, Amutio, Mateos-Mazón, García-Ruiz, Zenarruzabeitia, Amo and Borrego. This is an open-access article distributed under the terms of the Creative Commons Attribution License (CC BY). The use, distribution or reproduction in other forums is permitted, provided the original author(s) and the copyright owner(s) are credited and that the original publication in this journal is cited, in accordance with accepted academic practice. No use, distribution or reproduction is permitted which does not comply with these terms.
*Correspondence: Laura Amo, bGF1cmEuYW1vaGVycmVyb0BiaW8tYml6a2FpYS5ldXM=; Francisco Borrego, ZnJhbmNpc2NvLmJvcnJlZ29yYWJhc2NvQGJpby1iaXprYWlhLmV1cw==