 Qiuhua Li1,2
 Ngoc Tuan Tran
 Shengkang Li
 Xinhua Chen
- 1Guangdong Provincial Key Laboratory of Marine Biology, Shantou University, Shantou, China
- 2State Key Laboratory of Mariculture Breeding, Key Laboratory of Marine Biotechnology of Fujian Province, College of Marine Sciences, Fujian Agriculture and Forestry University, Fuzhou, China
Background: Fish gills serve as critical immune interfaces against aquatic pathogens, yet their leukocyte heterogeneity in response to parasitic infections remains poorly understood.
Methods: Single-cell RNA sequencing was employed to elucidate leukocyte responses in the gills of Larimichthys crocea during Cryptocaryon irritans infection.
Results: A total of 13,070 leukocytes from the gills under steady-state and infected conditions were profiled and classified into eight principal lineages: T cells (> 70% of total immune cells), ILC2-like cells, NK-like cells, neutrophils, cpa5+ granulocytes, B cells, macrophages, and dendritic cells. Following infection, T cell subsets exhibited distinct responses: Regulatory T cells expanded and demonstrated immunoregulatory capacity; CD8+ T cells exhibited cytotoxic responses; CD4-CD8- T cells displayed Th17-like functions; and γδ T cells showed Th2-like activity. ILC2-like cells significantly increased in abundance and upregulated type 2 cytokine expression, whereas cytotoxic NK-like cells enhanced chemokine signaling and cytotoxicity. Neutrophils increased in number and oxidative activity, while cpa5+ granulocytes highlighted immunomodulatory functions. Macrophages, dendritic cells, and B cells exhibited compartmentalized activation states, upregulating gene modules associated with pathogen recognition, antigen processing/presentation, chemotactic activity, and antibody defenses.
Conclusions: These findings describe a multi-layered immune cell defense strategy in the gills of teleosts against parasitic infection, showing conserved and fish-specific adaptations. Understanding gill immunity provides viable targets for enhancing parasite resistance in aquaculture, such as modulating ILC2/Treg pathways to prevent infections.
1 Introduction
Vertebrates have evolved diverse respiratory structures to optimize gas exchange in their habitats (1). Aquatic species predominantly utilize evaginated structures such as gills, while terrestrial organisms employ invaginated lungs to minimize water loss. Teleost gills exhibit specialized structures: vascularized arches support filamentous projections that branch into secondary lamellae, maximizing surface area for efficient gas exchange (2). In addition to their role in respiration, gills serve as multifunctional interfaces involved in osmoregulation, acid-base homeostasis, and endocrine regulation (3–5). This direct exposure to the environment renders gills susceptible to pathogen invasion, necessitating a robust immunological system.
The gill immune system of teleosts integrates innate and adaptive components, akin to the pulmonary defenses observed in mammals (6). Subepithelial layers harbor diverse innate immune populations including monocytes/macrophages (7), granulocytes (neutrophils and mast cells/eosinophilic granule cells [MCs/EGCs]) (8), dendritic cells (DCs) (9), natural killer (NK) cells (10), and innate-like lymphocytes (ILs) (11, 12). Adaptive immunity is mediated by T cell subsets (CD4+, CD8+, and CD4-CD8- double-negative T cells) and B lymphocytes secreting immunoglobulin isotypes (IgM, IgD, and IgT) (1, 11, 12). Although these cellular populations have been partially characterized, comprehensive molecular profiling remains challenging due to the limited availability of fish-specific antibodies, which restricts our understanding of immune cell diversity and functional specialization.
Parasitic infections pose significant threats to vertebrate health. Notably, the ciliated protozoan Cryptocaryon irritans causes severe cryptocaryoniasis (“white spot disease”) on gill and body surfaces, posing a major threat to marine fish aquaculture globally (13). To combat extracellular parasites (e.g., helminths), mammals depend on well-defined type 2 immune responses, characterized by the activation and expansion of various innate immune cells—such as ILC2s, basophils, eosinophils, DCs, and mast cells (14–16). A similar pattern of innate immune recruitment has been observed in teleosts during parasitic infections. For instance, in Tinca tinca infected with Monobothrium wageneri, neutrophil counts at infection sites were significantly higher than in adjacent tissues or uninfected fish (17). Teleost MCs/EGCs, which exhibit histochemical features of both mammalian mast cells and eosinophils (18), migrate and aggregate at infection sites during helminth, acanthocephalan, or cestode infections (19, 20). Recent studies highlight the role of teleost immune cells in combating C. irritans (13). Infection by C. irritans triggers the accumulation of MCs/EGCs in the secondary lamellae of the gills of Sparus aurata (8), as well as macrophages, neutrophils, and MCs/EGCs in Epinephelus coioides (21, 22). These findings indicate the critical roles of innate immune cells in fish defense against various parasites, including C. irritans. In addition, adaptive immune cells, including B cells and T cells, have been observed to proliferate and aggregate in gills infected by parasites, with B cells secreting parasite-specific IgM/IgT antibodies (1, 23). However, the dynamic reorganization, functional plasticity, and coordinated interplay of distinct gill immune cell subsets during an active parasitic infection remain largely unexplored, limiting our understanding of mucosal defense mechanisms.
Single-cell RNA sequencing (scRNA-seq) technologies enable high-resolution deconstruction of heterogeneous tissues and pathogen-responsive cellular states. We hypothesized that C. irritans infection triggers lineage-specific expansion, functional reprogramming, and the emergence of novel effector mechanisms across diverse leukocyte populations. To test this hypothesis, we applied scRNA-seq to comprehensively map the immune landscapes of Larimichthys crocea (large yellow croaker) gills under both steady-state and C. irritans-infected conditions. Our analysis revealed previously uncharacterized immune cell diversity and identified infection-induced expansions of immune cell populations, including Foxp3+ regulatory T cells (Tregs), neutrophils, DCs, ILC2-like cells, NK-like cells, and B cells. Furthermore, we delineated transcriptomic reprogramming associated with Treg cell differentiation, Th-like polarization, cytotoxic responses, and antibody secretion. This work establishes a fundamental atlas of gill immunity in teleosts, providing insights into anti-parasitic defense mechanisms, which have implications for disease management in aquaculture.
2 Materials and methods
2.1 Experimental fish
L. crocea (average weight: 50 g) were obtained from a mariculture farm in Ningde, Fujian, China. Fish were acclimated in 100-L fiberglass-reinforced plastic tanks equipped with a recirculating aquaculture system (24 ± 2°C, UV-sterilized seawater) and fed daily with commercial pellets. After a 14-day acclimatization period, healthy individuals were selected for subsequent experiments. All procedures adhered to the Laboratory Animal Guideline (GB/T 35892–2018) and were approved by the Animal Ethics Committee of Fujian Agriculture and Forestry University. All fish were anesthetized using tricaine methanesulfonate (MS-222; MCE) before surgical dissection.
2.2 C. irritans challenge
C. irritans tomonts were harvested from naturally infected L. crocea and maintained in sterile seawater at 8°C with daily water renewal (23). The excystation of tomonts was induced by transferring them to 26°C for 72 hours. Freshly released theronts, less than 2 hours post-hatching, were quantified and used to infect fish. The experimental group was challenged with 3,000 theronts per fish through a 2-hour static immersion, while the control group underwent identical handling procedures without parasite exposure. Following the challenge, fish were transferred to separate flow-through tanks maintained at 24 ± 2°C. Gill tissues were collected at 60 hours post-infection (peak trophont maturation phase) for leukocyte isolation.
2.3 Leukocyte isolation
Gills were aseptically dissected, minced into 1-mm3 fragments, and digested in cold DMEM containing 1 mg/mL collagenase I, 1 mg/mL collagenase IV, 0.1% (w/v) NaCl, and 1× penicillin/streptomycin at 4°C for 2 hours. Tissue homogenates were filtered through a 70-μm cell strainer (BD Biosciences), washed twice with DMEM supplemented with 2% fetal bovine serum (FBS), and separated using a 34% Percoll gradient by centrifugation at 650 × g for 30 minutes at 4°C. Pelleted cells were treated with red blood cell (RBC) lysis buffer, washed, and assessed for viability (>90% by trypan blue exclusion). Cell counts were quantified via flow cytometry.
2.4 Single-cell RNA sequencing
Cell suspensions from the gills of five fish per group were pooled and adjusted to a concentration of ~1,000 cells/μL. These preparations were processed using the Chromium™ Single Cell 3’ Kit (10× Genomics). Gel bead-in-emulsions generation, cDNA amplification, and library preparation were performed following the manufacturer’s protocols. Libraries were sequenced on an Illumina NovaSeq 6000 platform (150-bp paired-end) by Gene Denovo Biotech (Guangzhou, China).
2.5 scRNA-seq data processing and cell type identification
Raw sequencing data were aligned to the L. crocea reference genome (GCF_000972845.2) using Cell Ranger (v3.1.0). Doublets were removed using DoubletFinder (v2.0.3). The cells were excluded if they met any of the following criteria: <500 or >4,000 detected genes, >20,000 UMI counts, or >10% mitochondrial reads. Post-filtering, data were normalized, integrated, and clustered using Seurat (v4.0.4) with 30 principal components at a clustering resolution of 0.5. Cell clusters were visualized using Uniform Manifold Approximation and Projection (UMAP). Cell identities were annotated based on conserved immune cell markers.
2.6 Differential expression analysis
For comprehensive identification of cluster-specific markers across all cellular subsets, the Wilcoxon rank-sum test was implemented through the FindAllMarkers function, comparing each cluster against the rest cells from all other clusters. Significantly upregulated genes were identified based on the following criteria: (1) genes had to be expressed at least 1.28-fold higher in the target cluster compared to other clusters; (2) genes must be detected in more than 25% of the cells within the target cluster; (3) an unadjusted p-value < 0.05. To investigate condition-specific transcriptional changes within defined immune subclusters, intra-cluster differential expression analysis was performed between control and infected groups using a hurdle model in MAST (Model-based Analysis of Single-cell Transcriptomics). Differentially expressed genes (DEGs) were defined as meeting all of the following thresholds: (1) absolute log2-fold change (log2FC) ≥ 1; (2) adjusted p-value ≤ 0.05 (Benjamini-Hochberg correction); (3) detection in ≥ 20% of cells within the target cluster.
2.7 Pathway enrichment
DEGs were subjected to Gene Ontology (GO) and Kyoto Encyclopedia of Genes and Genomes (KEGG) enrichment analysis using a hypergeometric test with false discovery rate (FDR) correction (FDR < 0.05). Enriched terms were mapped to biological processes, molecular functions, or pathways.
3 Results
3.1 Comprehensive immune cell annotation revealed T cell dominance in teleost gill immunity
To delineate the immune landscape of L. crocea gills, we conducted comparative scRNA-seq profiling of leukocytes isolated from control and C. irritans-infected specimens (Figure 1A). Sequencing achieved an average of 31,660 reads/cell (997 genes/cell) and 37,067 reads/cell (980 genes/cell) in the control and infected samples, respectively. Following stringent quality control (Supplementary Figure S1), 16,832 high-quality transcriptomes (control: 9,028; infected group: 7,804) were retained for further analysis. Unsupervised clustering delineated 25 transcriptionally distinct cell states, validated through UMAP visualization and cluster-specific marker heatmaps (Supplementary Figure S2).
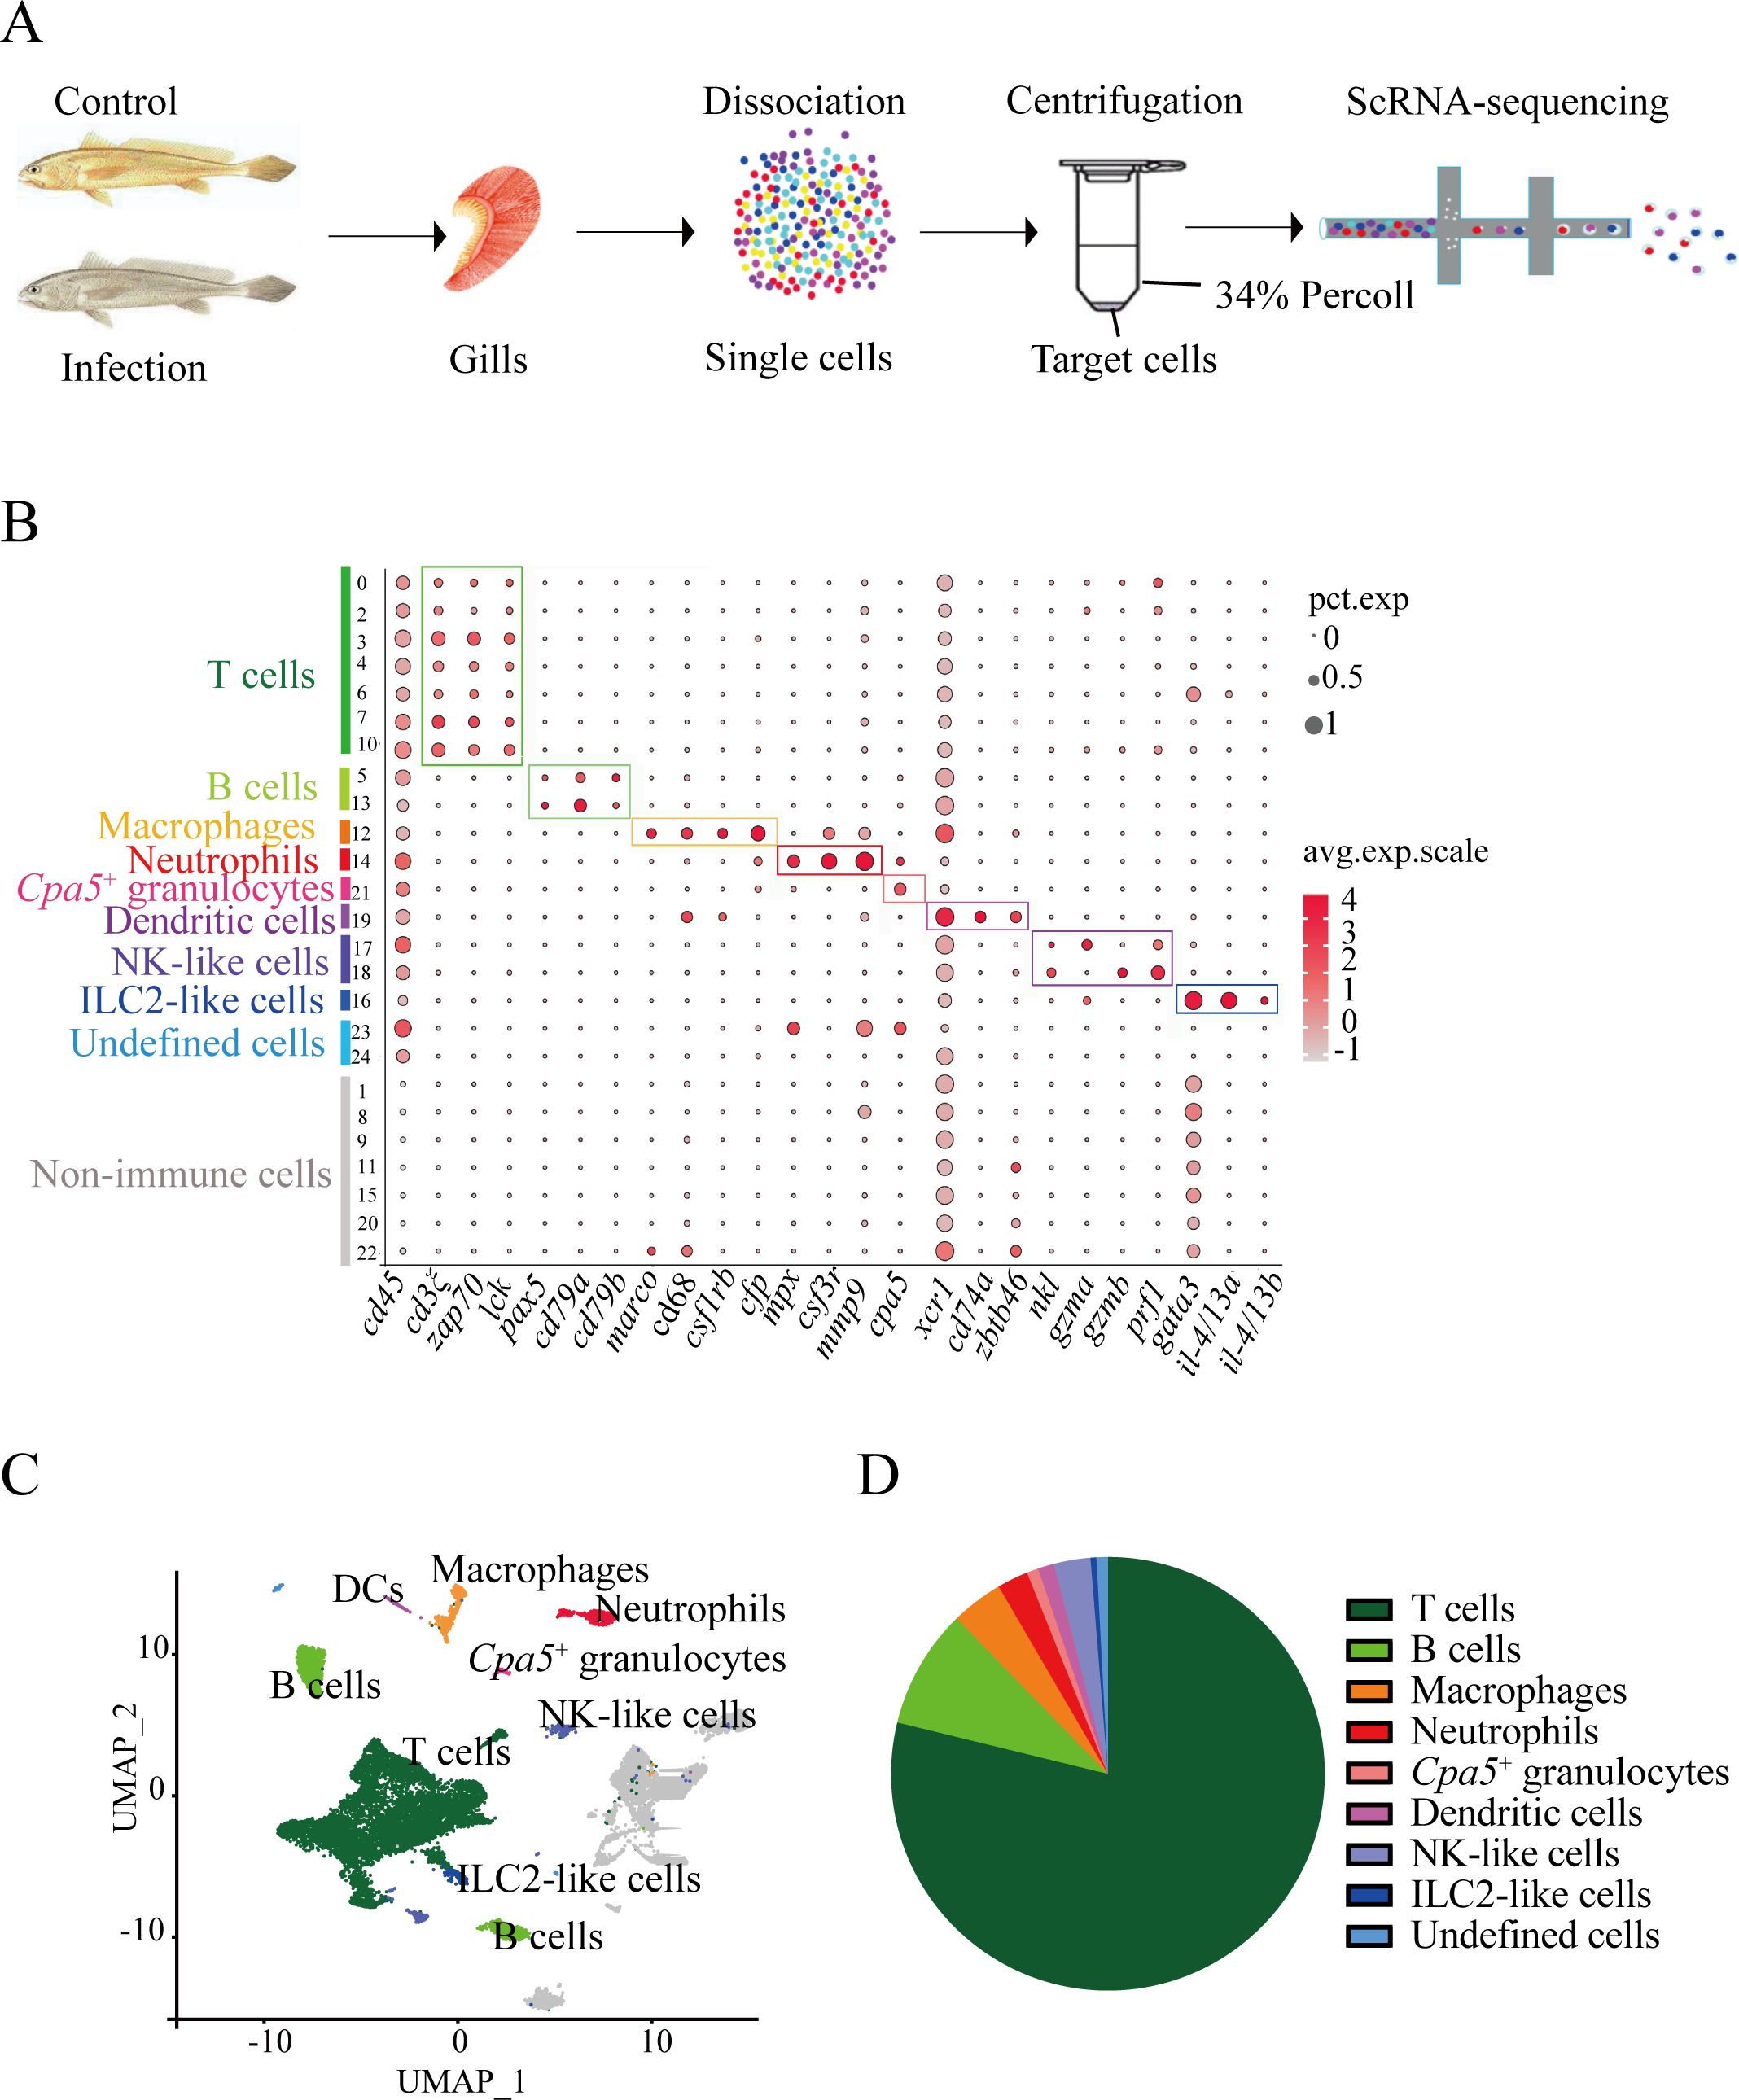
Figure 1. Major immune cell types in the L. crocea gills identified by 16,832 single-cell transcriptomes. (A) Schematic of experimental design. (B) Dot plot of putative marker genes for T cells, B cells, macrophages, neutrophils, cpa5+ granulocytes, dendritic cells (DCs), ILC2-like cells, NK-like cells, and non-immune cells across clusters. Bubble size and color intensity indicate the percentage of cells expressing each gene and the average expression level per cluster, respectively. (C) UMAP visualization of all immune cells. (D) Pie chart showing the relative abundance of major immune cell types in gills.
The 25 clusters were annotated into eight immune lineages and non-immune contaminants (Figures 1B, C; markers in Supplementary Table S1). T lymphocytes occupied clusters 0, 2, 3, 4, 6, 7, and 10, defined by the expression of canonical T-cell markers cd3ξ, zap70, and lck. B-cell compartments comprised clusters 5 (B-5) and 13 (B-13), identified by pax5, cd79a, and cd79b. Myeloid populations, including macrophages (Cluster 12 with the expression of csf1rb+/cfp+/macro+/cd68+), neutrophils (Cluster 14: mpx+/csf3r+/mmp9+), DCs (Cluster 19: cd74a+/xcr1+/zbtb46+), and cpa5+ cells (Cluster 21: cpa5+), were identified. Notably, cpa5 is specifically expressed in the zebrafish mast cell lineage (24). However, multiple mast cell markers (including kita and tps) were not detected (data not shown) in cpa5+ cells. These suggest that these cells can be classified as cpa5+ granulocytes and potentially represent a teleost-specific granulocyte subset with partial functional overlap with mast cells. Innate lymphoid diversity spanned NK-like cells (Clusters 17-18: nkl+/gzma+/gzmb+), and ILC2-like cells (Cluster 16: gata3+/il4/13a+/il4/13b+). A total of 3,762 non-immune cells (Clusters 1, 8, 9, 11, 15, 20, and 22), which lacked cd45 expression, were excluded from immune analyses. Transcriptomic analysis identified the top 20 differentially expressed genes per immune lineage, revealing both evolutionarily conserved and teleost-specific immune signatures (Supplementary Table S2). Strikingly, T cells constituted 71.6% (9,360 cells) of immune cell population (Figure 1D; Supplementary Table S3), establishing their central role in piscine mucosal immunity. In mammals, T cells comprised functionally distinct subsets, which mediate specialized roles in response to the parasite infection (25). This dominance provides the cellular substrate for exploring the diverse T cell subset responses (proliferation, differentiation, and cytokine production) during C. irritans infection.
3.2 Heterogeneity of T cell subsets
Our analysis partitioned T cells from two biological samples into 14 clusters (designated T0–T13) using a clustering resolution of 0.5 (Supplementary Figure S3A). Cluster validation through visualization of the top five variably expressed genes revealed a clear demarcation between all subsets in the heatmap analysis (Supplementary Figure S3B). Differential gene expression profiles across clusters, integrated with typical T-cell lineage markers, allowed for annotation of definitive subsets (Figure 2; DEGs in Supplementary Table S4; markers in Supplementary Table S5). The cluster T7 was classified as CD8+ cytotoxic T lymphocytes (CTLs) by expressing cd8a, cd8β, nkl, gzmb, and prf1 (Figure 2A). CD4+ T cell populations segregated into four functionally distinct subgroups, including regulatory T cells (Tregs), Th17 cells, Th1 cells, and naïve T cells (Figures 2A, B). The results found that the cluster T8 was annotated as Tregs (expressing foxp3 and tgfb1), T6 as Th1 cells (expressing lineage-defining transcription factor tbx21 and effector cytokines ifng and tnfa), T1 and T4 as Th17 cells (expressing characteristic markers rorc (RORγt), il17a/f1, il1r1, and il23r), T9 as γδ T cells (expressing tcrgc and a transcription factor sox4 (26), lacking CD4 and CD8 receptors), T2 as CD4-CD8- double-negative T cells (DNTs; lacking CD4 and CD8 expression), T5, T11, and T12 as proliferating T-cell subset (expressing DNA replication genes pcna, cdk1, and top2a). The ten most statistically significant subset-defining genes across all T cell populations showed the potential markers for T cell subsets in fish (Supplementary Table S6).
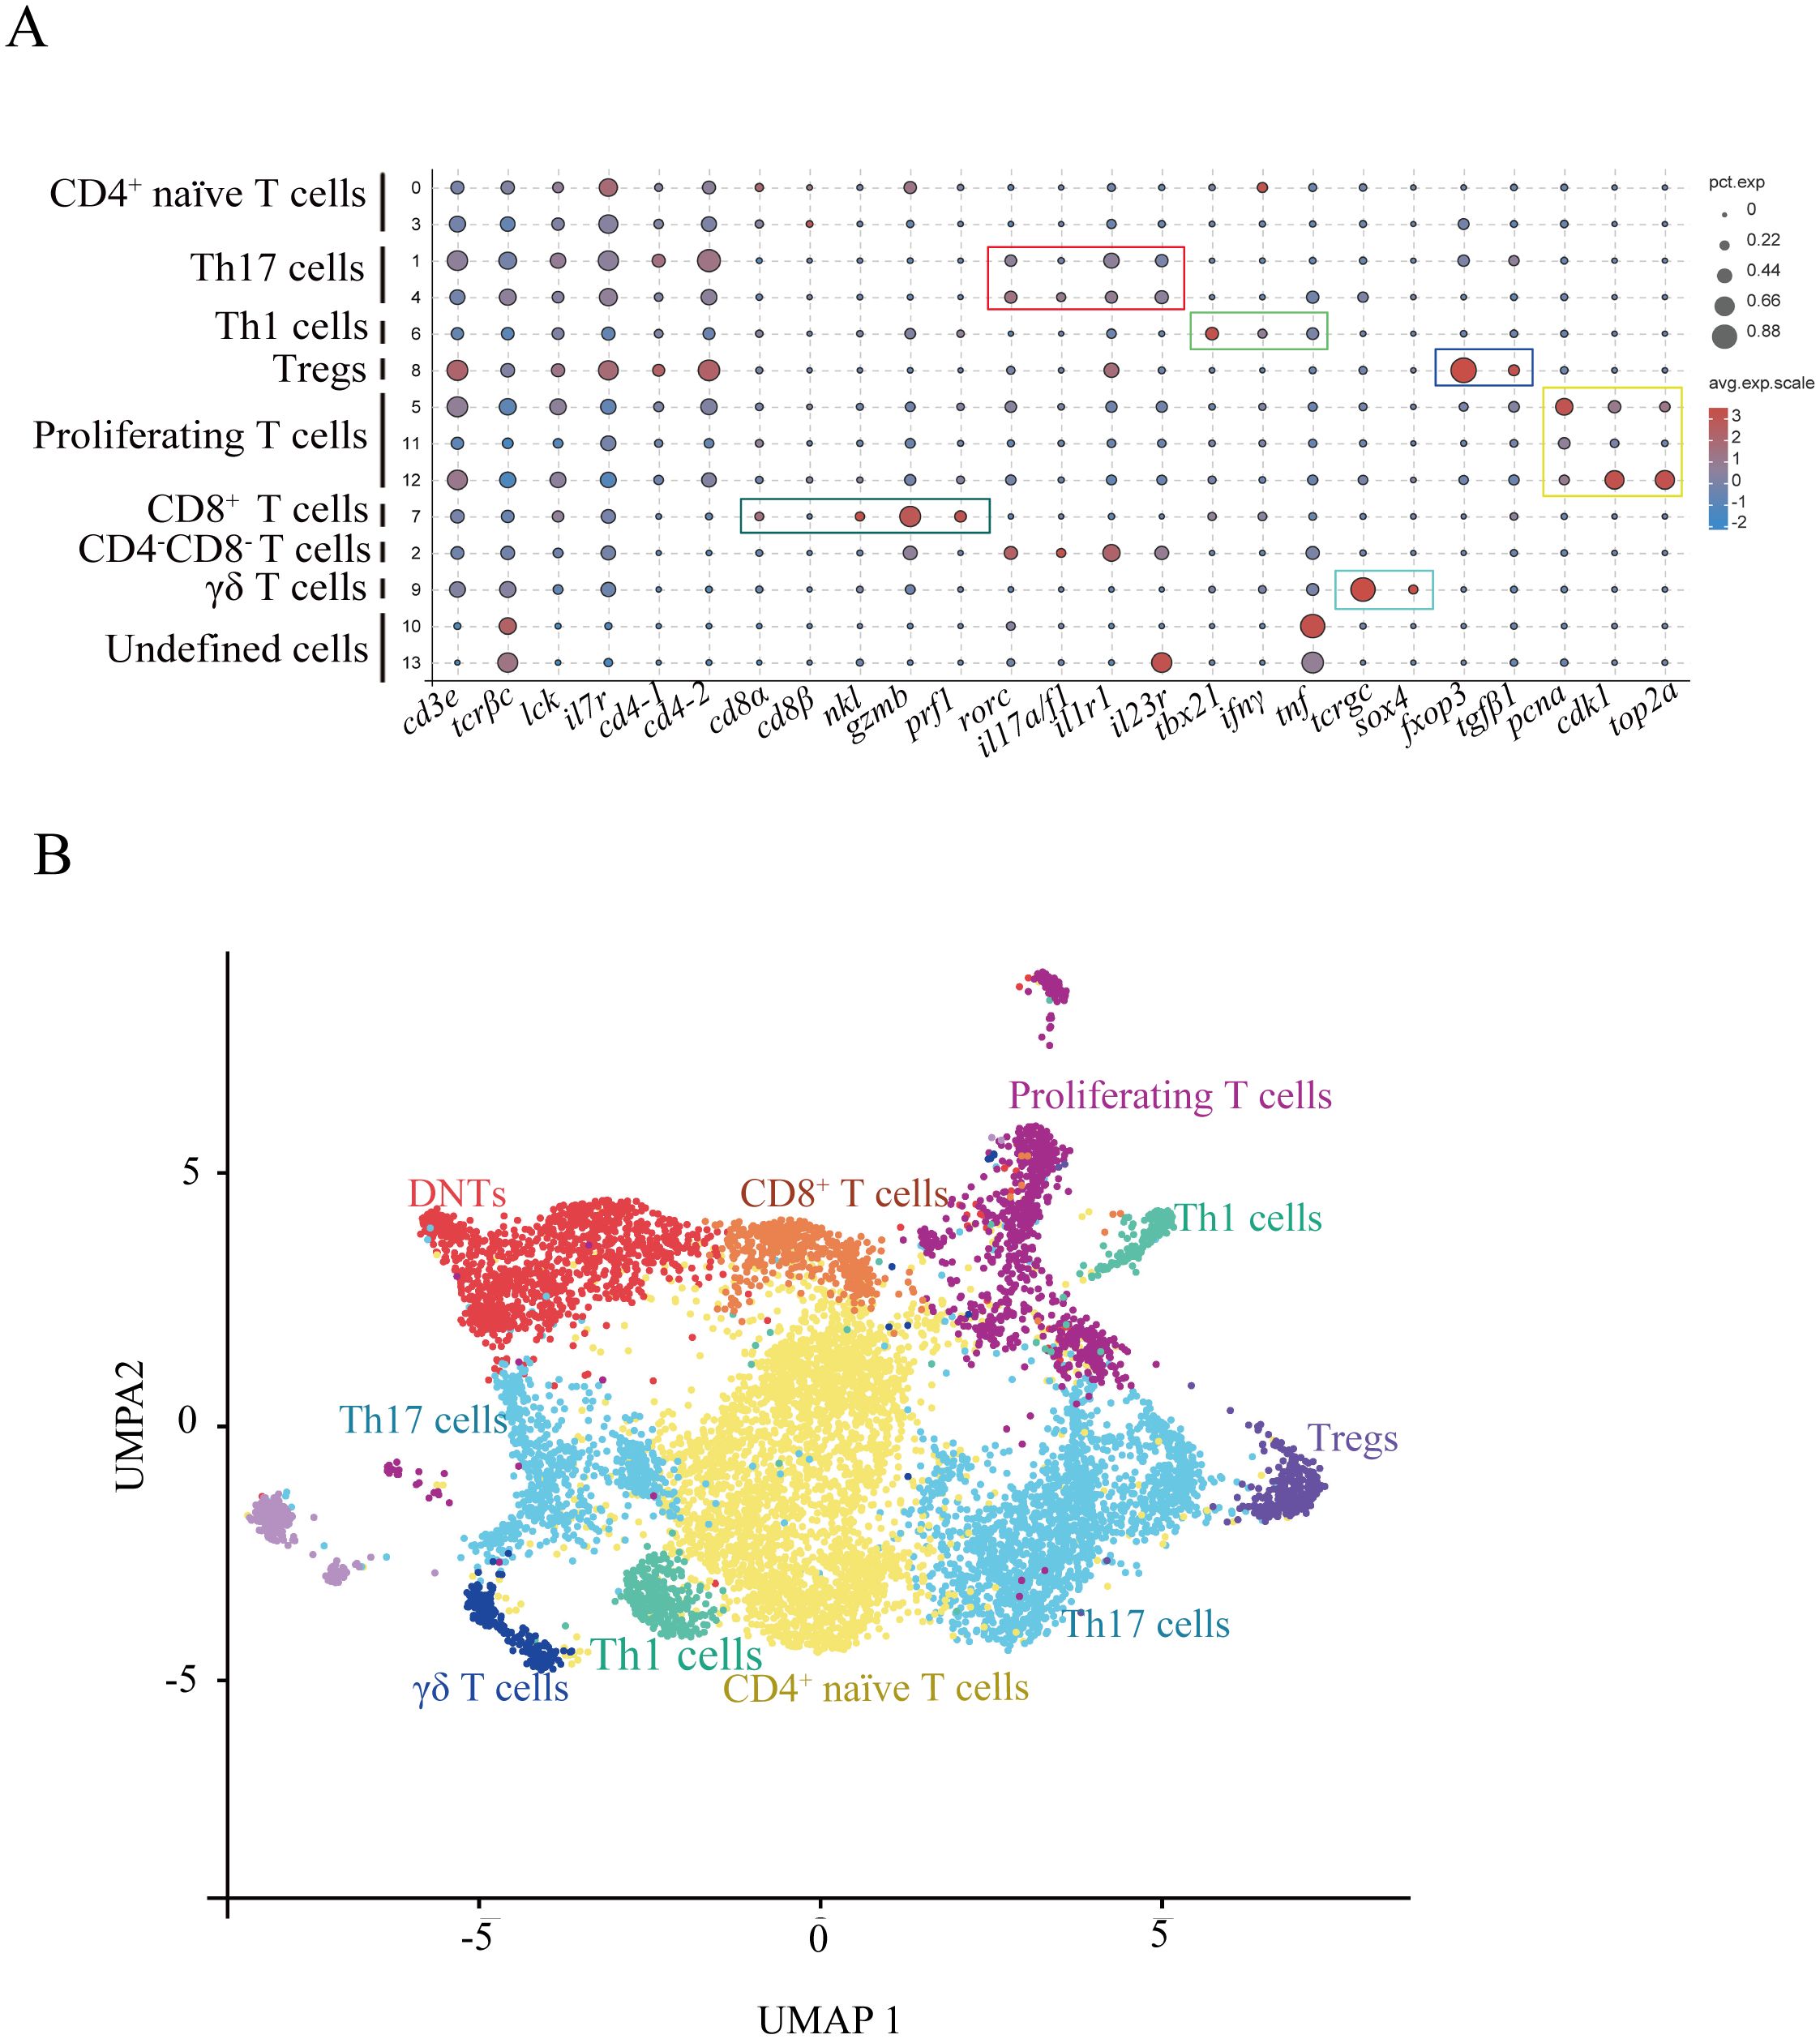
Figure 2. Heterogeneous subsets of T cells in gills. (A) Dot plots displaying marker gene expression levels and proportions for each T cell subset. (B) UMAP visualization of T cell subsets.
3.3 C. irritans challenge induced T cell proliferation and CD4+ T cell differentiation in gills
To investigate the T cell-mediated immune responses in gill tissue during pathogen challenge, we first assessed the redistribution of T cell subsets after C. irritans infection. At 60 hours post-infection, the number of proliferating T cells (T5, 11, and 12) increased from 8.28% to 11.59% (Figure 3A). Concurrently, an upregulation of pcna (encoding the proliferating cell nuclear antigen that enhances DNA polymerase processivity during replication) was observed in infected fish (Figure 3B). These data demonstrate the induction of T cell proliferation in gill tissue by C. irritans infection. Although overall T cell number decreased, mainly due to a sharp increase in myeloid cells, Treg numbers increased 2.89-fold (from 1.74% to 5.03%) after infection (Figure 3C). This Treg amplification was supported by significant induction of lineage-defining markers foxp3 and tgfb1 following pathogen exposure (Figure 3D). Furthermore, the proportion of naïve T cells (T0 and T3) decreased significantly, from 39.71% to 26.67% of total T cells (Figure 3E). Notably, Th1 and Th17 subsets remained stable after infection (Figure 3F), supported by the unchanged expression of their signature transcriptional regulators (tbx21 and rorc) and effector cytokines (ifng and il17a/f1). These results suggest preferential differentiation of naïve T cells into immunosuppressive Tregs rather than effector subsets during C. irritans infection.
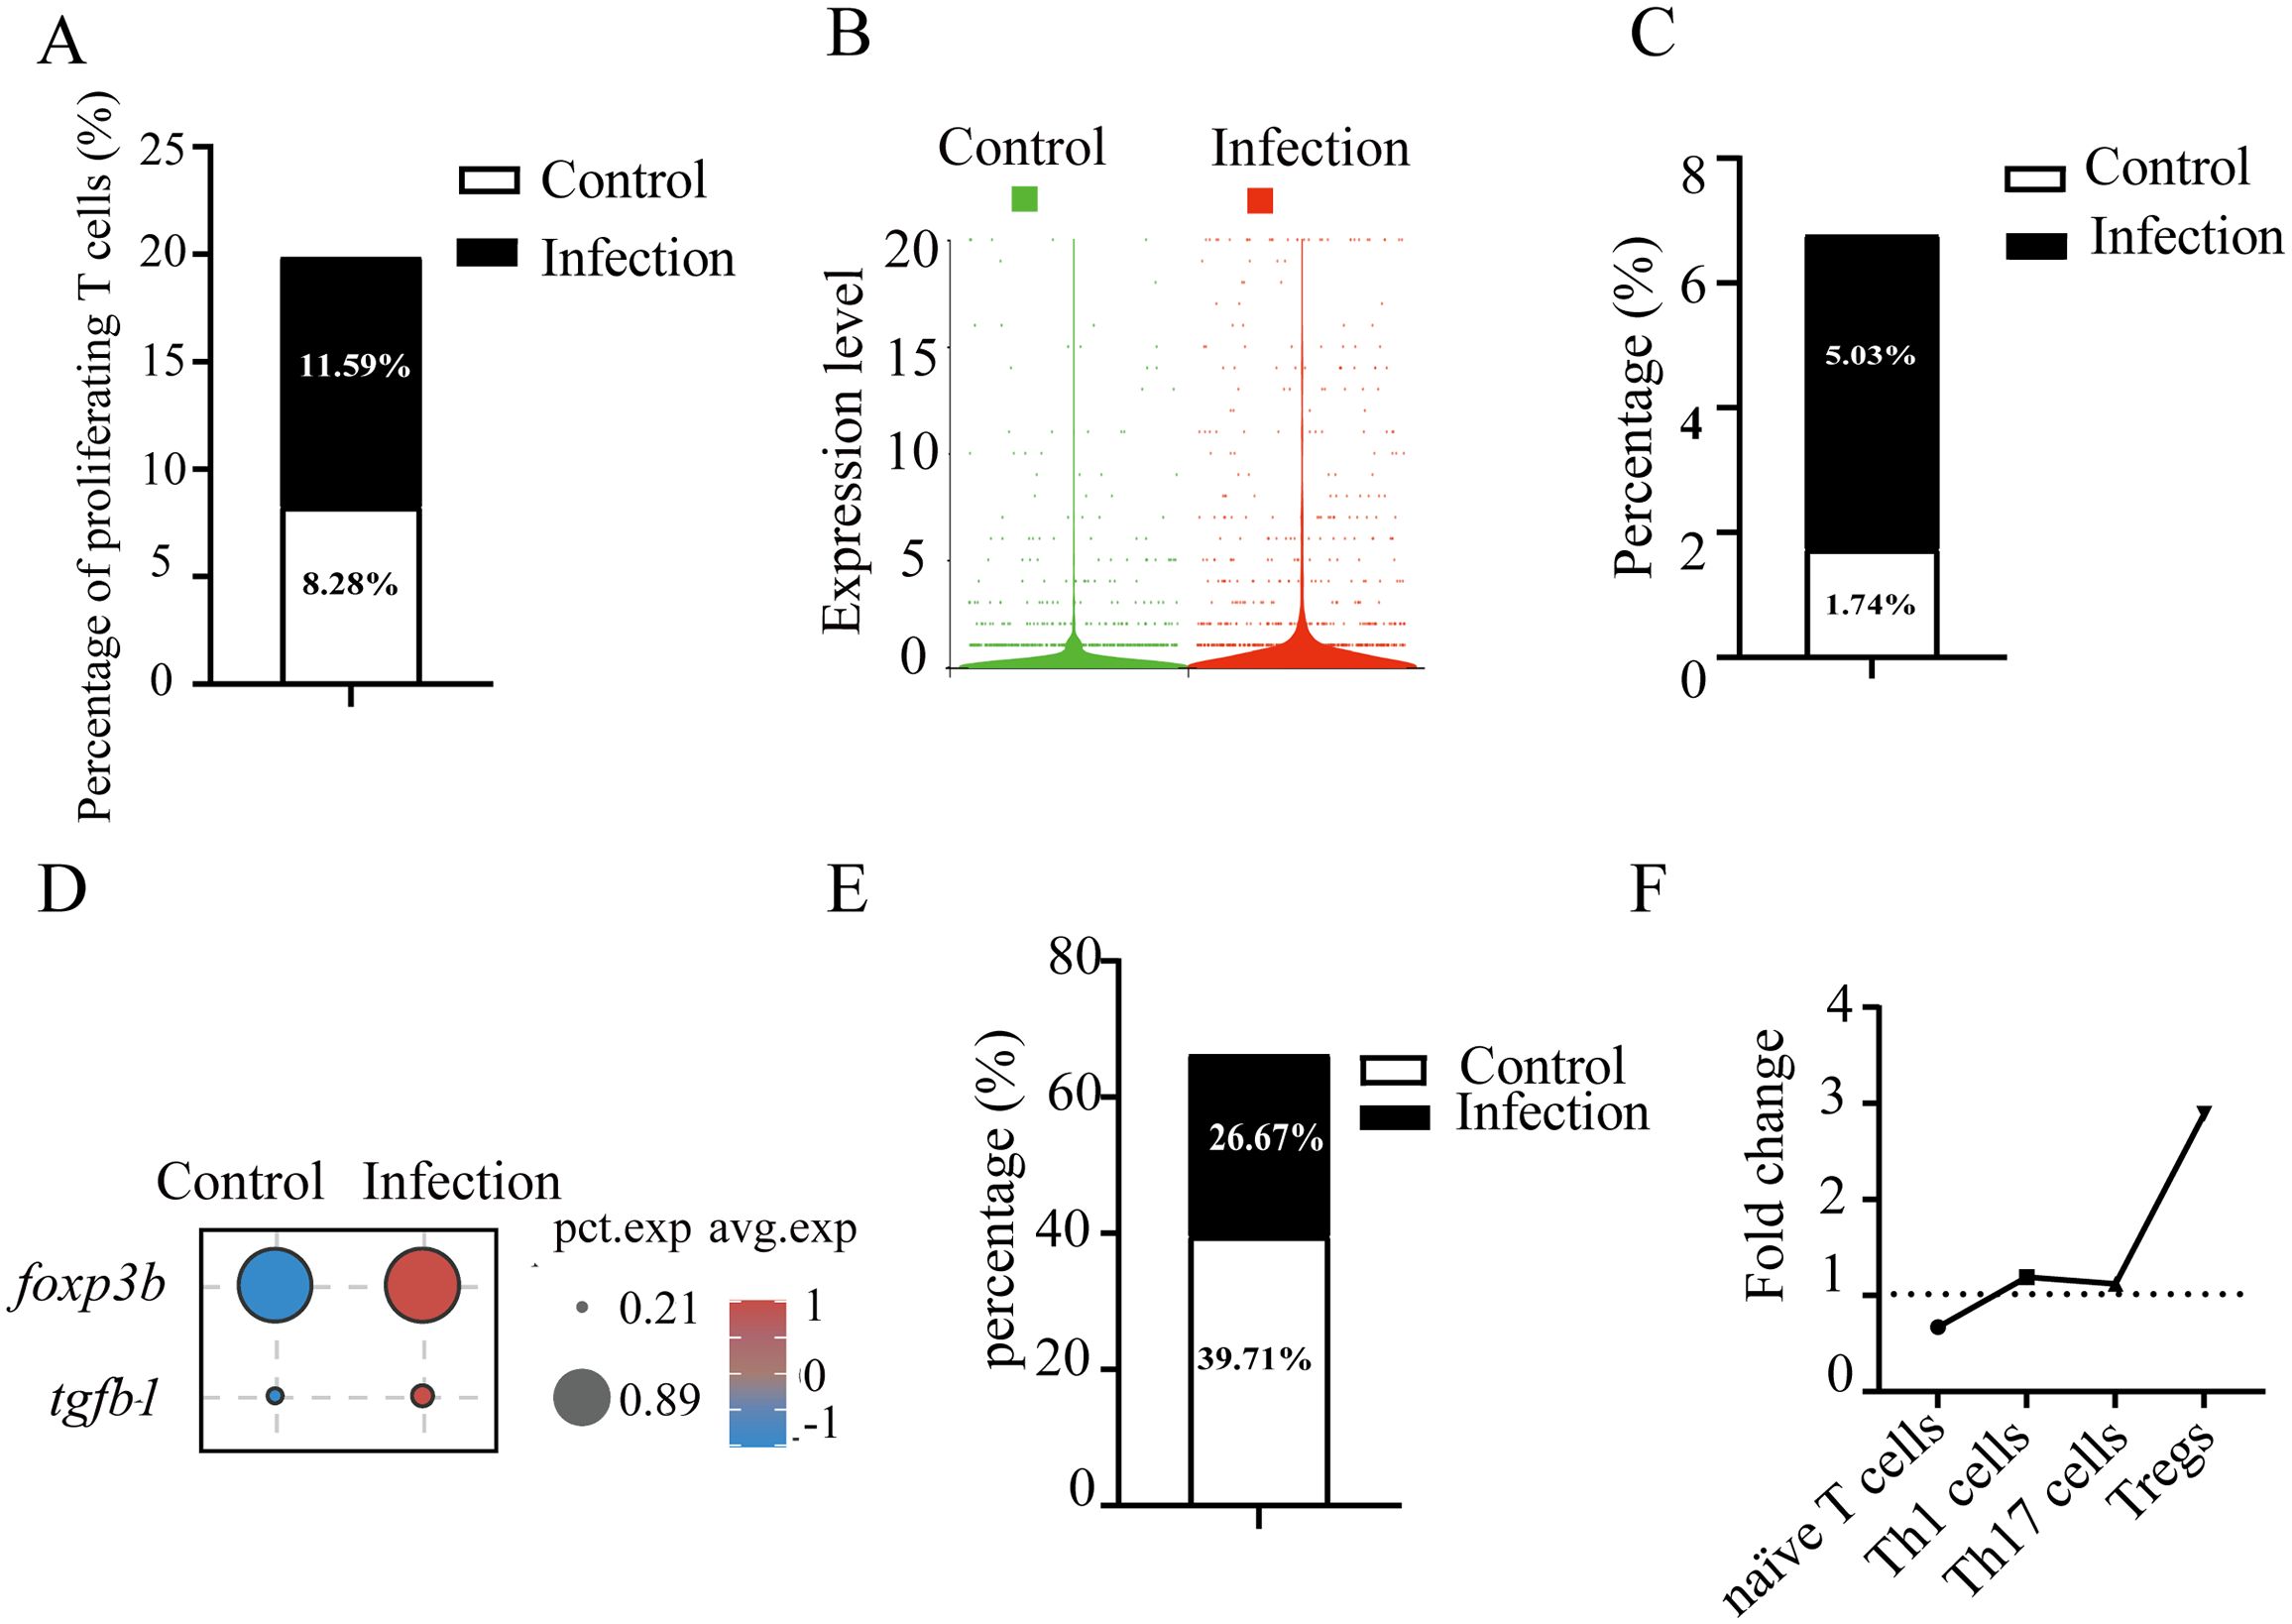
Figure 3. C. irritans infection induced T cell proliferation and Foxp3+ Treg differentiation. (A) Proportions of proliferating T cells (as a percentage of total T cells) in C. irritans-infected vs. normal gill tissues. Similar subpopulation analyses were performed for Tregs (C) and CD4+ naïve T cells (E). (B) Elevated average expression of pcna in the C. irritans-infected group compared to the control group. (D) Dot plots displaying expression levels of Treg cell-associated markers and the proportion of cells. (F) Line chart depicting fold changes in the percentages of CD4+ naïve T cells, Th1 cells, Th17 cells, and Tregs post-C. irritans infection.
3.4 DNTs in gills exhibited Th17-like function
DNTs exhibit functional plasticity through cytokine secretion (IL-4, IL-17, IFNγ, and TNFα) mirroring the activities of CD4+ T helper cells, termed helper DN T cells or Th-like DN T cells (27, 28). These functional DNTs demonstrate context-dependent protective or pathogenic roles across infection models (27, 29). Our results revealed that L. crocea DNTs (LcDNTs) accounted for 12.48% of total gill T cells under homeostasis, increasing to 14.57% after C. irritans challenge (Figure 4A). Comparative transcriptomic profiling across CD4+, CD8+, and DNT populations through integrative analysis identified subset-defining molecular signatures (Supplementary Figure S4A). Gene ontology analysis revealed DNT-specific enrichment of regulatory pathways, particularly metabolic process modulation and systemic biological regulation (Supplementary Figure S4B). LcDNTs were prominently engaged in cytokine-cytokine receptor and C-type lectin signaling pathways, as evidenced by differential expression of key mediators including cytokine receptors (il2rb, il1r1, and il17rα), death receptors (dr4), chemotaxis regulators (ccr6 and ccl20a.3), inflammatory cytokines (il22 and tnf), and signaling components (fcrγ, mapk1, pik3r1, and ikba) (Figure 4B, Supplementary Table S7). Notably, LcDNTs displayed Th17-polarized features, characterized by the elevated expression of lineage-defining transcription factor (rorc) and (molecules il17a/f1, il1r1, and il23r) compared to conventional CD4+ and CD8+ T cells (Figures 4C, 2A). Parasitic challenge induced the expression of il17a/f1 production (Figure 4D), as well as cytotoxic effector (gzma) and immunomodulatory factors (ccl5l, ccl20, il8, tnf, and tnfl) in LcDNTs (Figure 4D; Supplementary Table S8), confirming a functional Th17-like programming and dual cytotoxic and regulatory capacities, respectively. Systematic analysis of alternative Th-like DNT subtypes (e.g., Th1 and Th2) demonstrated minimal expression of lineage-specifying transcription factors (tbx21 and gata3), supporting a predominant Th17-like polarization phenotype.
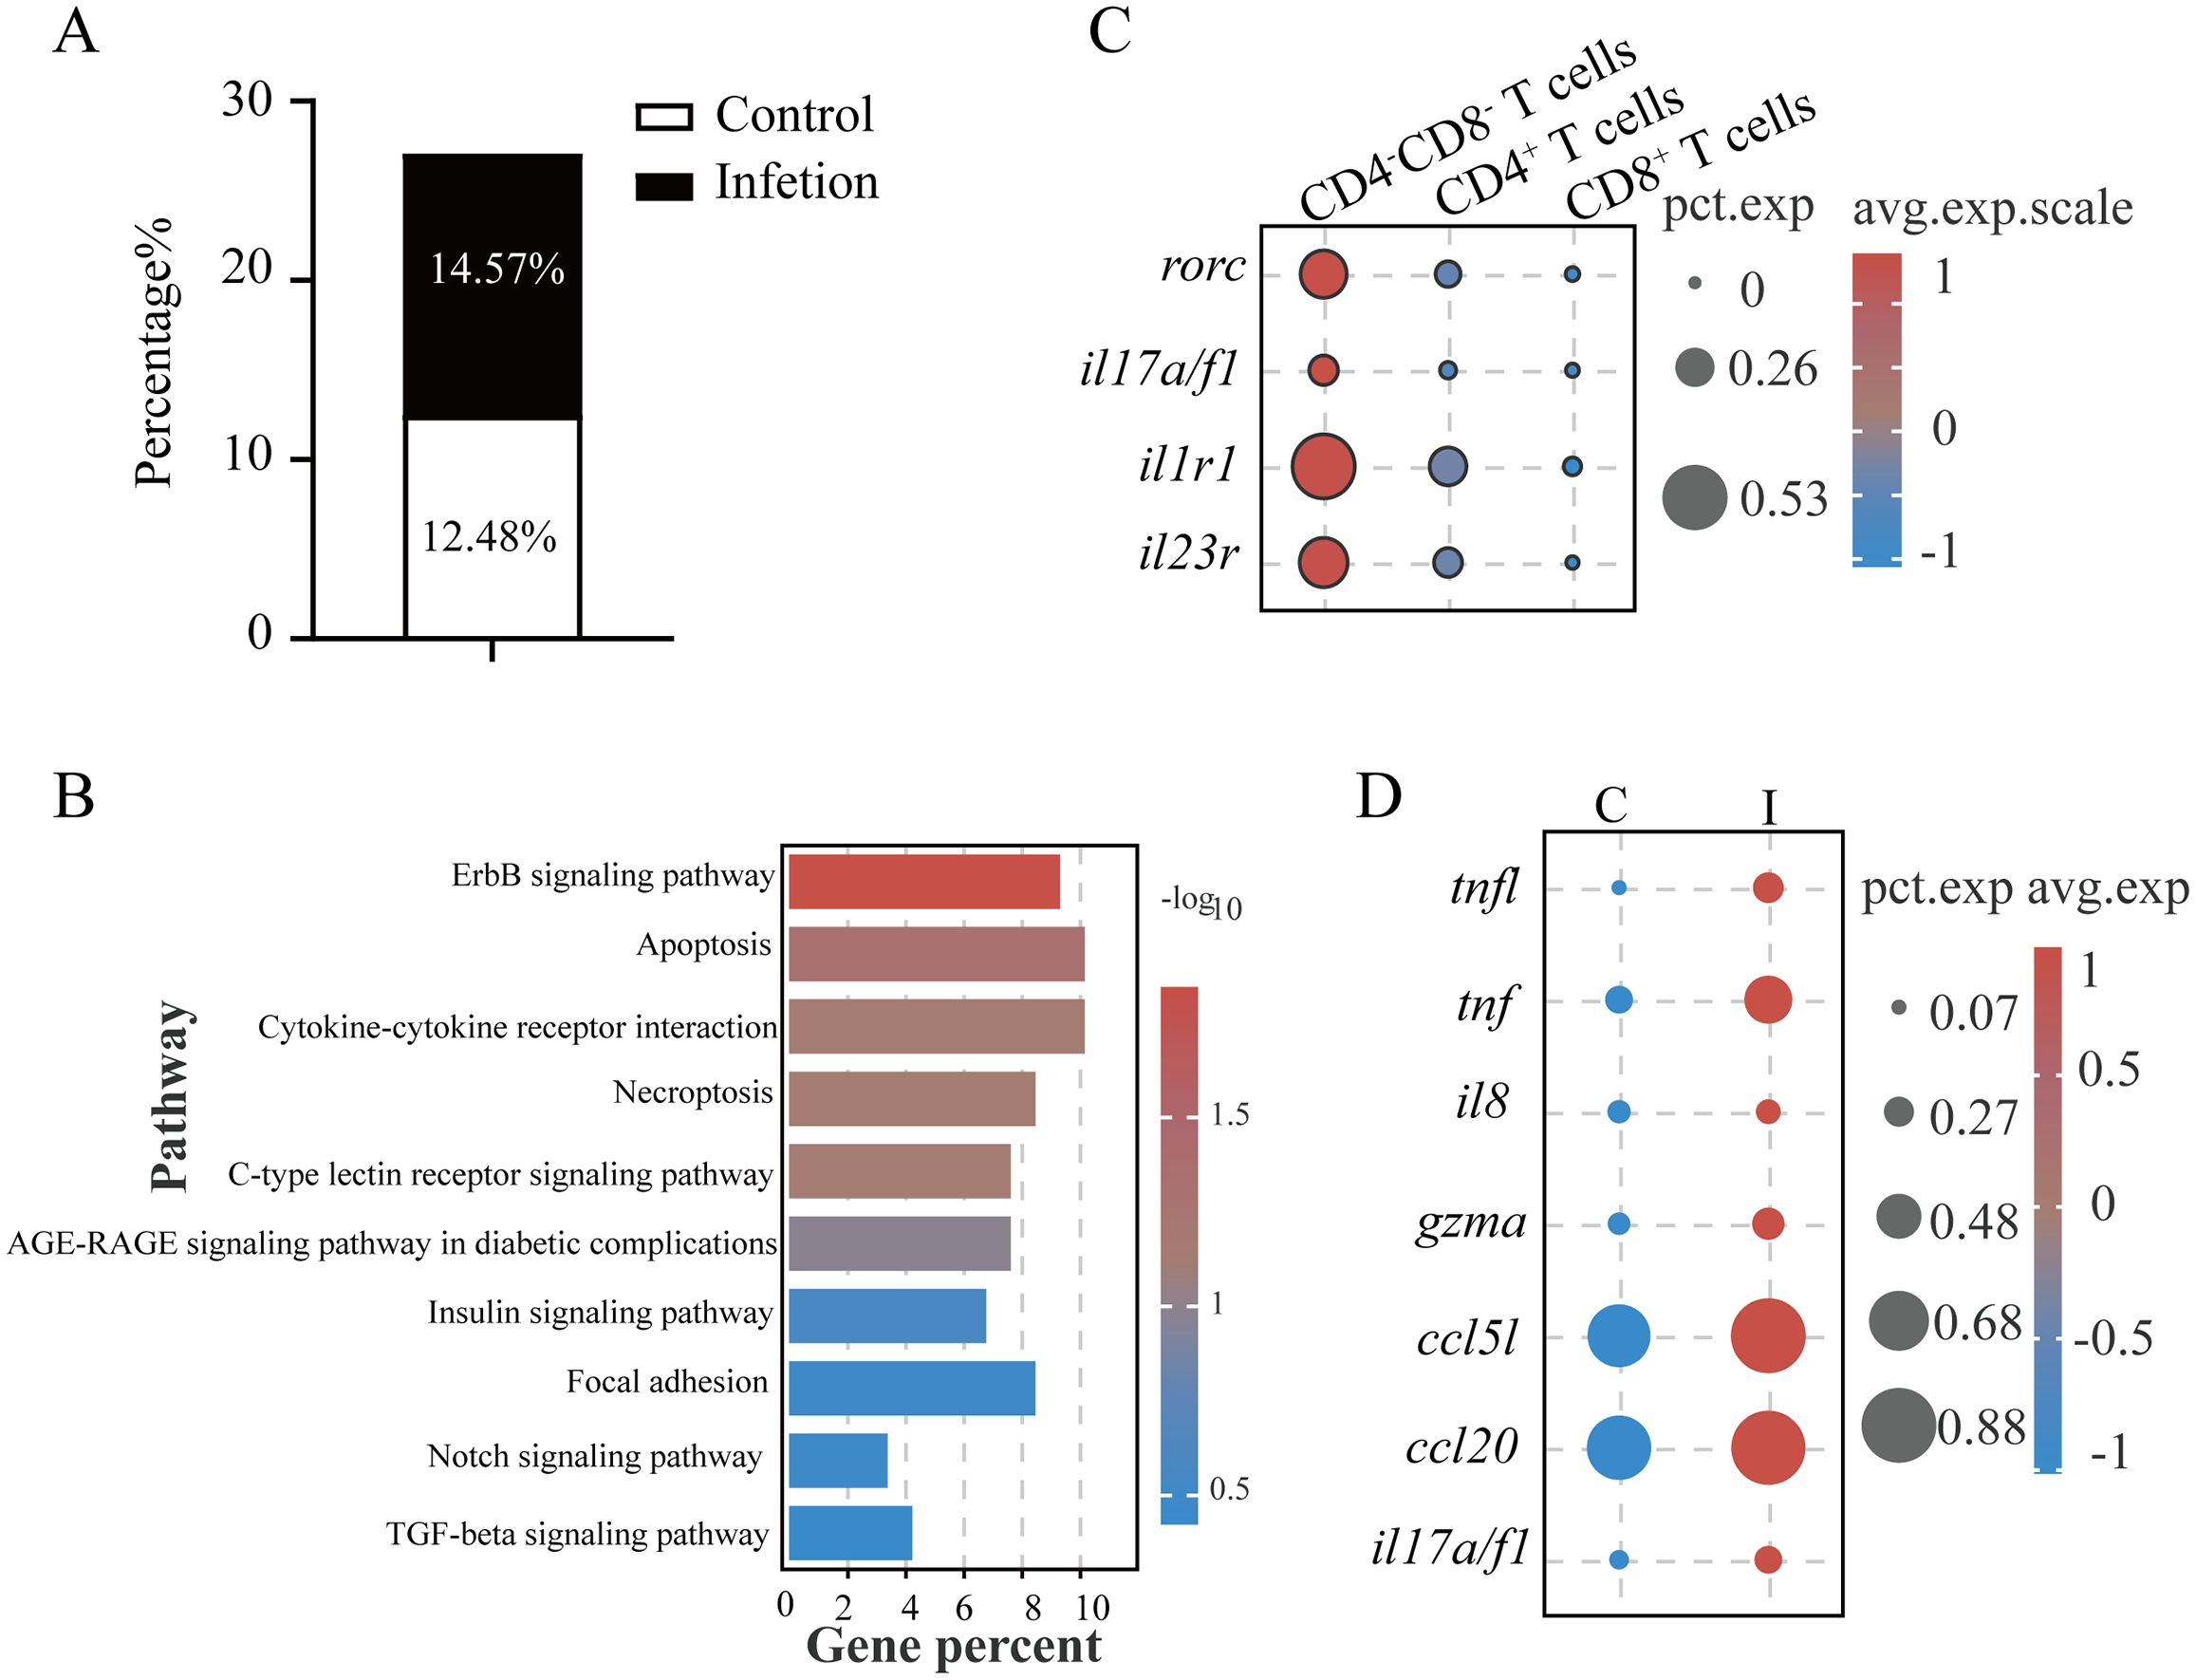
Figure 4. DNTs in L. crocea possessed Th17-like functions. (A) Proportions of DNTs in total T cells. (B) KEGG pathway enrichment in DNTs. (C) Th17-associated marker expression profiles in DN (CD4–CD8–), CD4+ and CD8+ T cells. (D) Immune-related gene expression in DNTs from control (C) and infected (I) groups.
3.5 Characterization of γδ T cells and CD8+ T cells
In mammalian systems, γδ T cells represent a functionally heterogeneous lymphocyte population with specialized roles in antimicrobial defense and immunomodulation. These cells exhibit remarkable plasticity, differentiating into cytotoxic effectors and helper-like subsets (Th1/Th2/Th17 analogs) upon activation while producing diverse cytotoxic mediators and cytokines to modulate the immune response (30). Our results identified L. crocea γδ T cells (cluster T9) as multifunctional effectors, demonstrating enriched expression of chemotaxis regulators (e.g., cxcl10, mcp1b, and ccl3), endocytosis and antigen processing components (e.g., cxcr4, chmp4b, arf6, cd74, h2-q9, rt1-b, and hla-drα), cytotoxic effectors (e.g., gzmb), and inflammatory mediators (e.g., tnf, tnfl, and il17a/f3) (Supplementary Tables S9, S10). Unique adhesion molecules cd2l and cldn4 (claudin-4) were specifically expressed in γδ T cells, potentially mediating intercellular interactions within gill microenvironments (Supplementary Tables S9, S10). The data revealed type 2 immune polarization in L. crocea γδ T cells, as evidenced by elevated expression of gata3, ap-1, cxcr4, and type 2 cytokines (il4/13a and il4/13b, homologous to mammalian il13 and il4, respectively) (Figure 5A). Parasitic challenge triggered a significant increase in the number of γδ T cells, ranging from 1.98% to 3.61% of total T cells (Figure 5B). Results also found that γδ T cells in the gills of controls exhibited minimal production of cytokines (such as tnf, il17a/f3, and tnfl). In contrast, the upregulation of cytotoxic effectors (gzma and gzmb), Th1/Th17-polarizing cytokines (tnf, tnfl, faslg, and il17a/f3), and Th2-associated transcriptional regulators (gata3) and cytokines (il4/13a and il4/13b) was found in infected fish (Figure 5C).
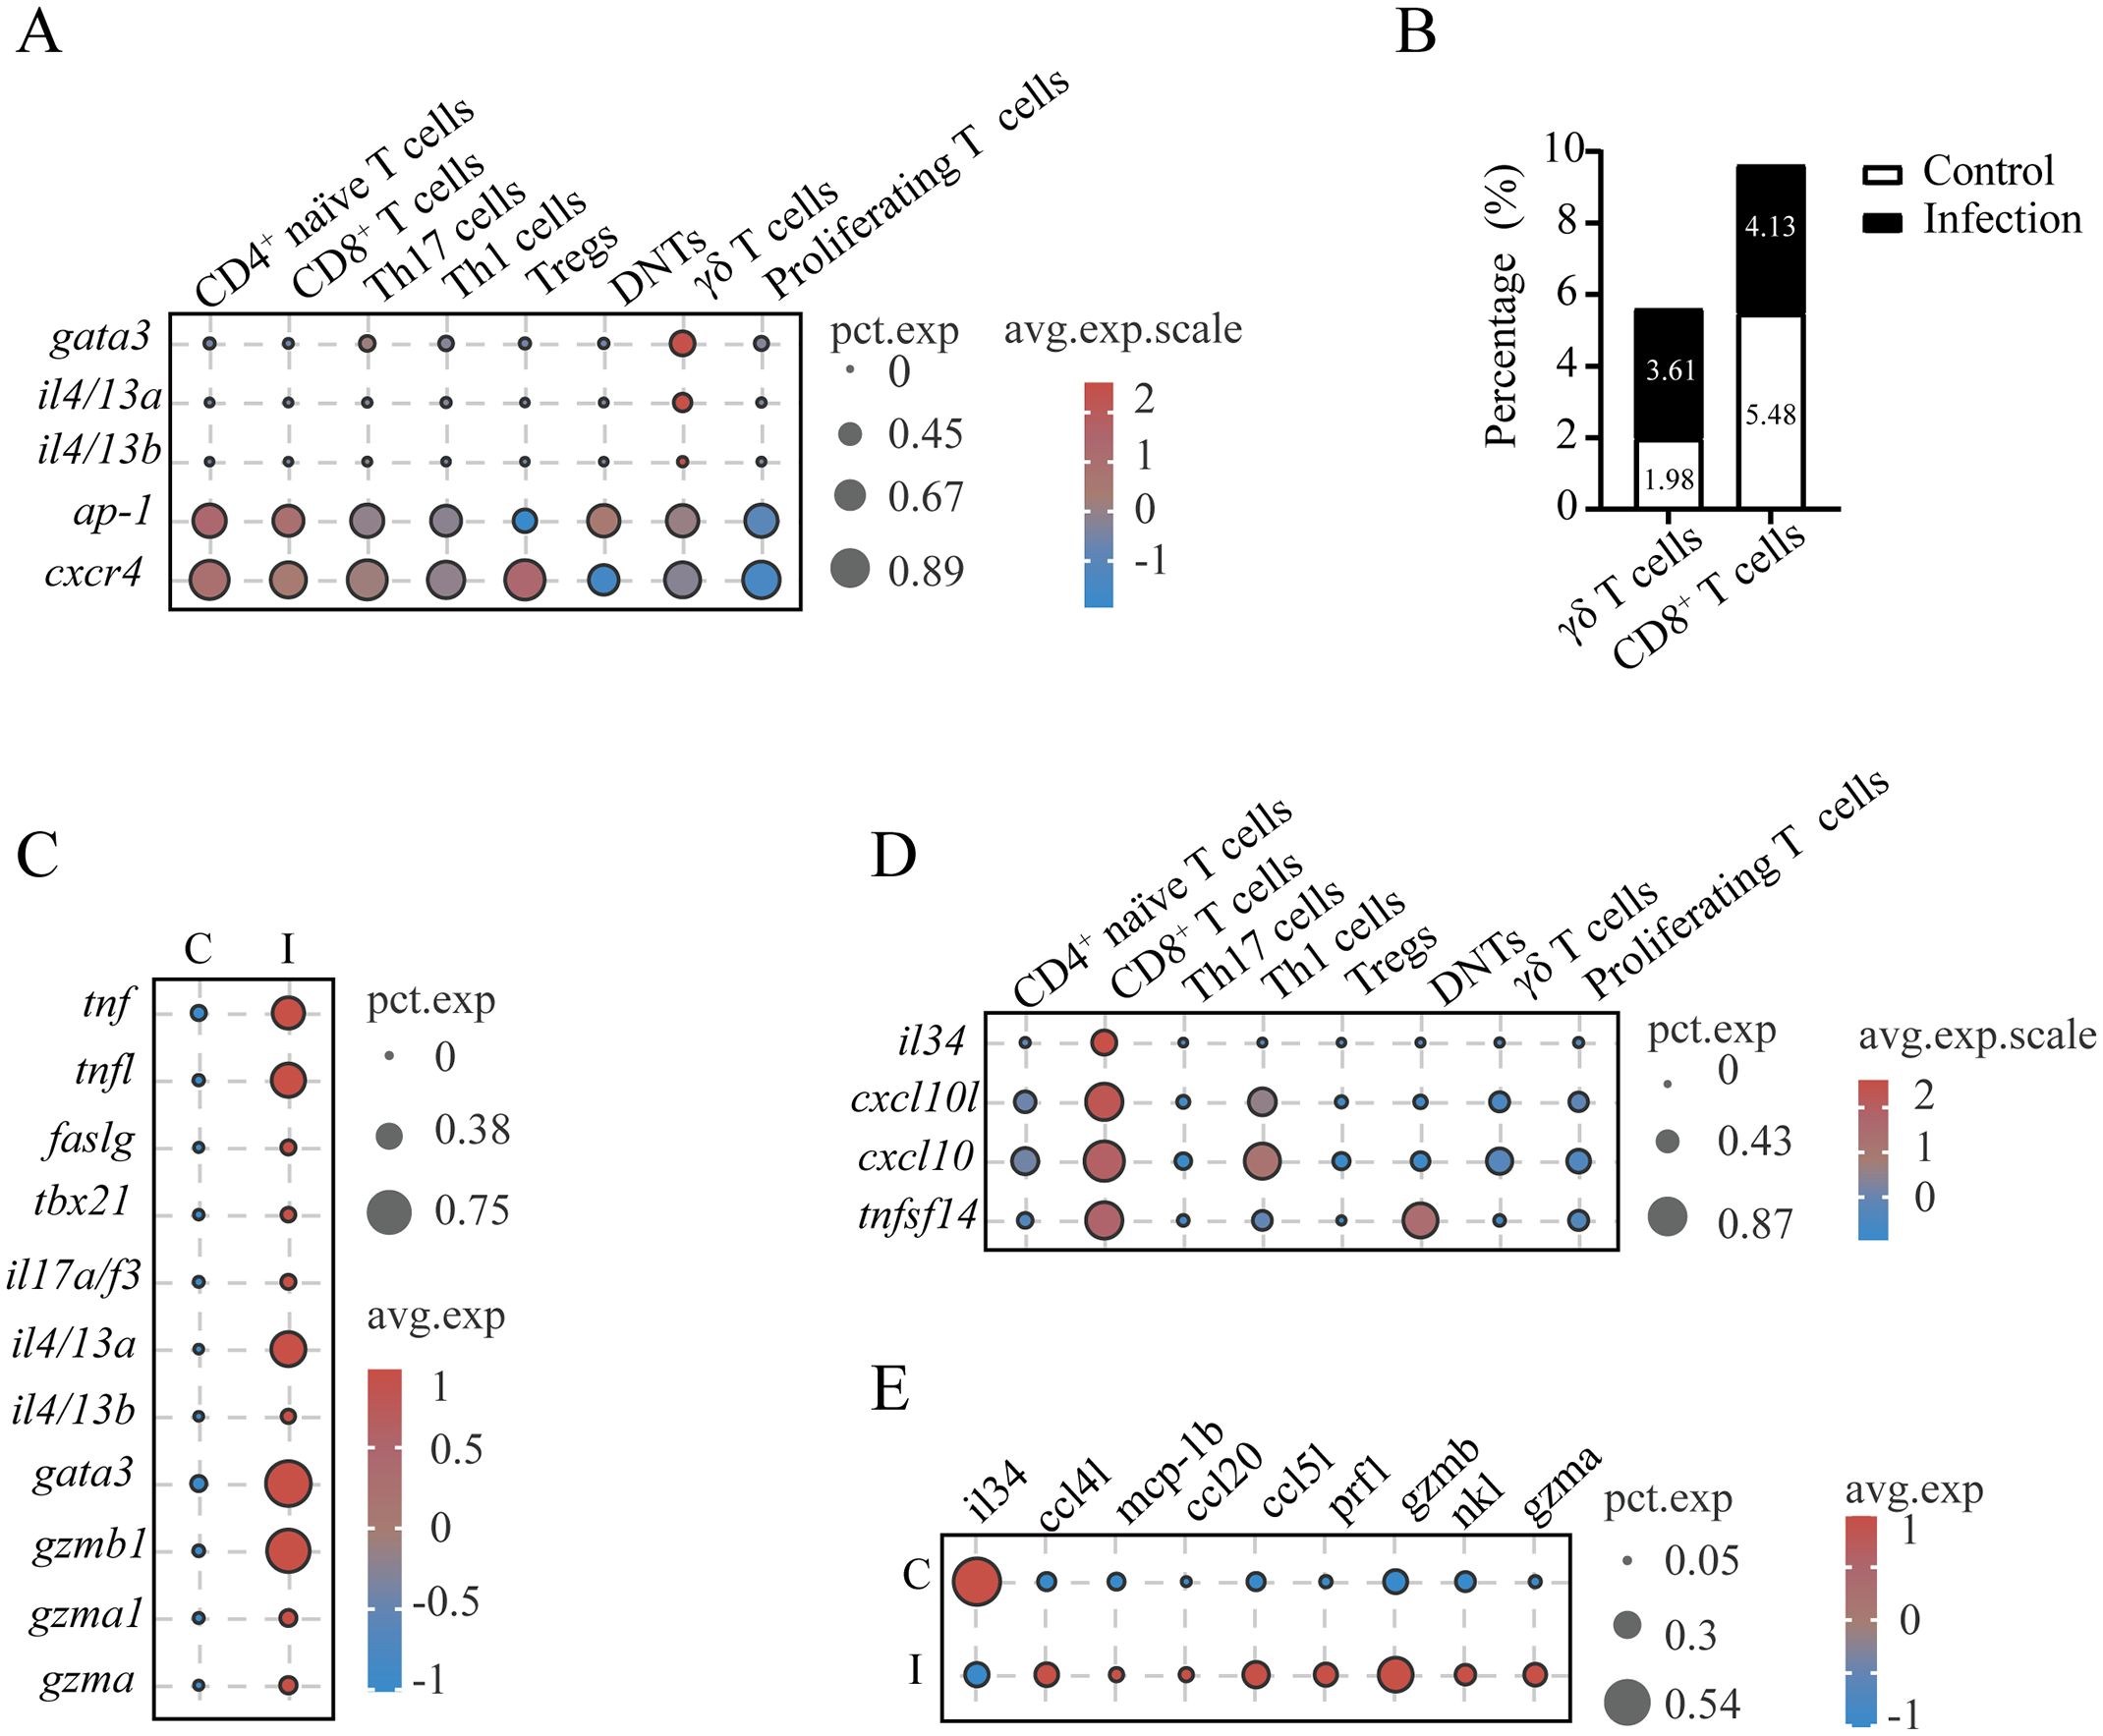
Figure 5. Functional characterization of γδ T cells and CD8+ T cells in L. crocea gills. (A) Expression profiles of type 2 immune polarization-associated genes in γδ T cells of L. crocea. (B) Proportional abundance of γδ T cells and CD8+ T cells relative to total T cells across experimental groups. (C) Comparative expression profiles of immune-related genes in γδ T cells between control (C) and C. irritans-infected (I) groups. (D) Cytokine expression signatures in CD8+ T cell populations. (E) Differential expression patterns of immune-related genes in CD8+ T cells from control versus infected groups.
Furthermore, the CD8+ CTL population (cluster T7) was found to express cytolytic effectors (nkl, gzmb, gzma, and prf1), immunoregulatory cytokines (il34 and tnfsf14), and chemoattractant cxcl10 (Figures 2A, 5D). Although the proportion of CD8+ CTLs decreased from 5.48% to 4.13% after infection (Figure 5B), these cells exhibited enhanced expression of cytolytic genes (nkl, gzmb, gzma, and prf1) and chemokines (ccl5l, ccl20, mcp1b, and ccl4l), while decreased the expression of il34 (Figure 5E). This dichotomy suggests CD8+ CTLs balance direct cytotoxicity (gzmb, gzma, and prf1) with immunoregulatory chemokine signaling during anti-parasitic responses.
3.6 LcILC2-like cells in gills exerted the Th2-like function upon C. irritans infection
A set of genes highly or specifically expressed in LcILC2-like cells (LcILC2s) was identified across samples, establishing a core transcriptomic signature for ILC2 populations in teleost gills (Supplementary Table S11), including transcription factor gata3 (essential for ILC2 lineage development) (31) and key effector cytokines il4/13a and il4/13b (Figures 1B, 6A; Supplementary Table S12). Notably, these cells expressed the st2 (il1rl1, encoding the IL-33 receptor), a hallmark surface marker for ST2+ ILC2s, and batf, a crucial regulator of IL-25-responsive migratory ILC2 cell fate and function (Figure 6A) (32, 33). Conservation of intracellular signaling was demonstrated through enrichment of MAPK pathway components (flt3, dusp5, mapk1, myd88, mknk1, and mras), which control proliferation and cytokine production in mammalian ILC2s (Figure 6B) (34–36). Intriguingly, typical mammalian ILC2-activating receptors (il-7r, il-9r, tslpr, and il25r) (36) were undetectable in LcILC2s, potentially reflecting teleost-specific adaptations. Instead, this population uniquely expressed endocytic receptors (cd209d, cd163l, and cd163), along with cytokine receptor (il21r) (Figure 6A). Following parasitic challenge, LcILC2s underwent an 8.7-fold expansion (from 0.43% to 3.74% of gill leukocytes; Figure 6C). The infection activated the upregulation of cytokine expression (il4/13a: 2.6-fold; il4/13b: 5.4-fold), and downregulation of il1b and il8 (Figure 6D).
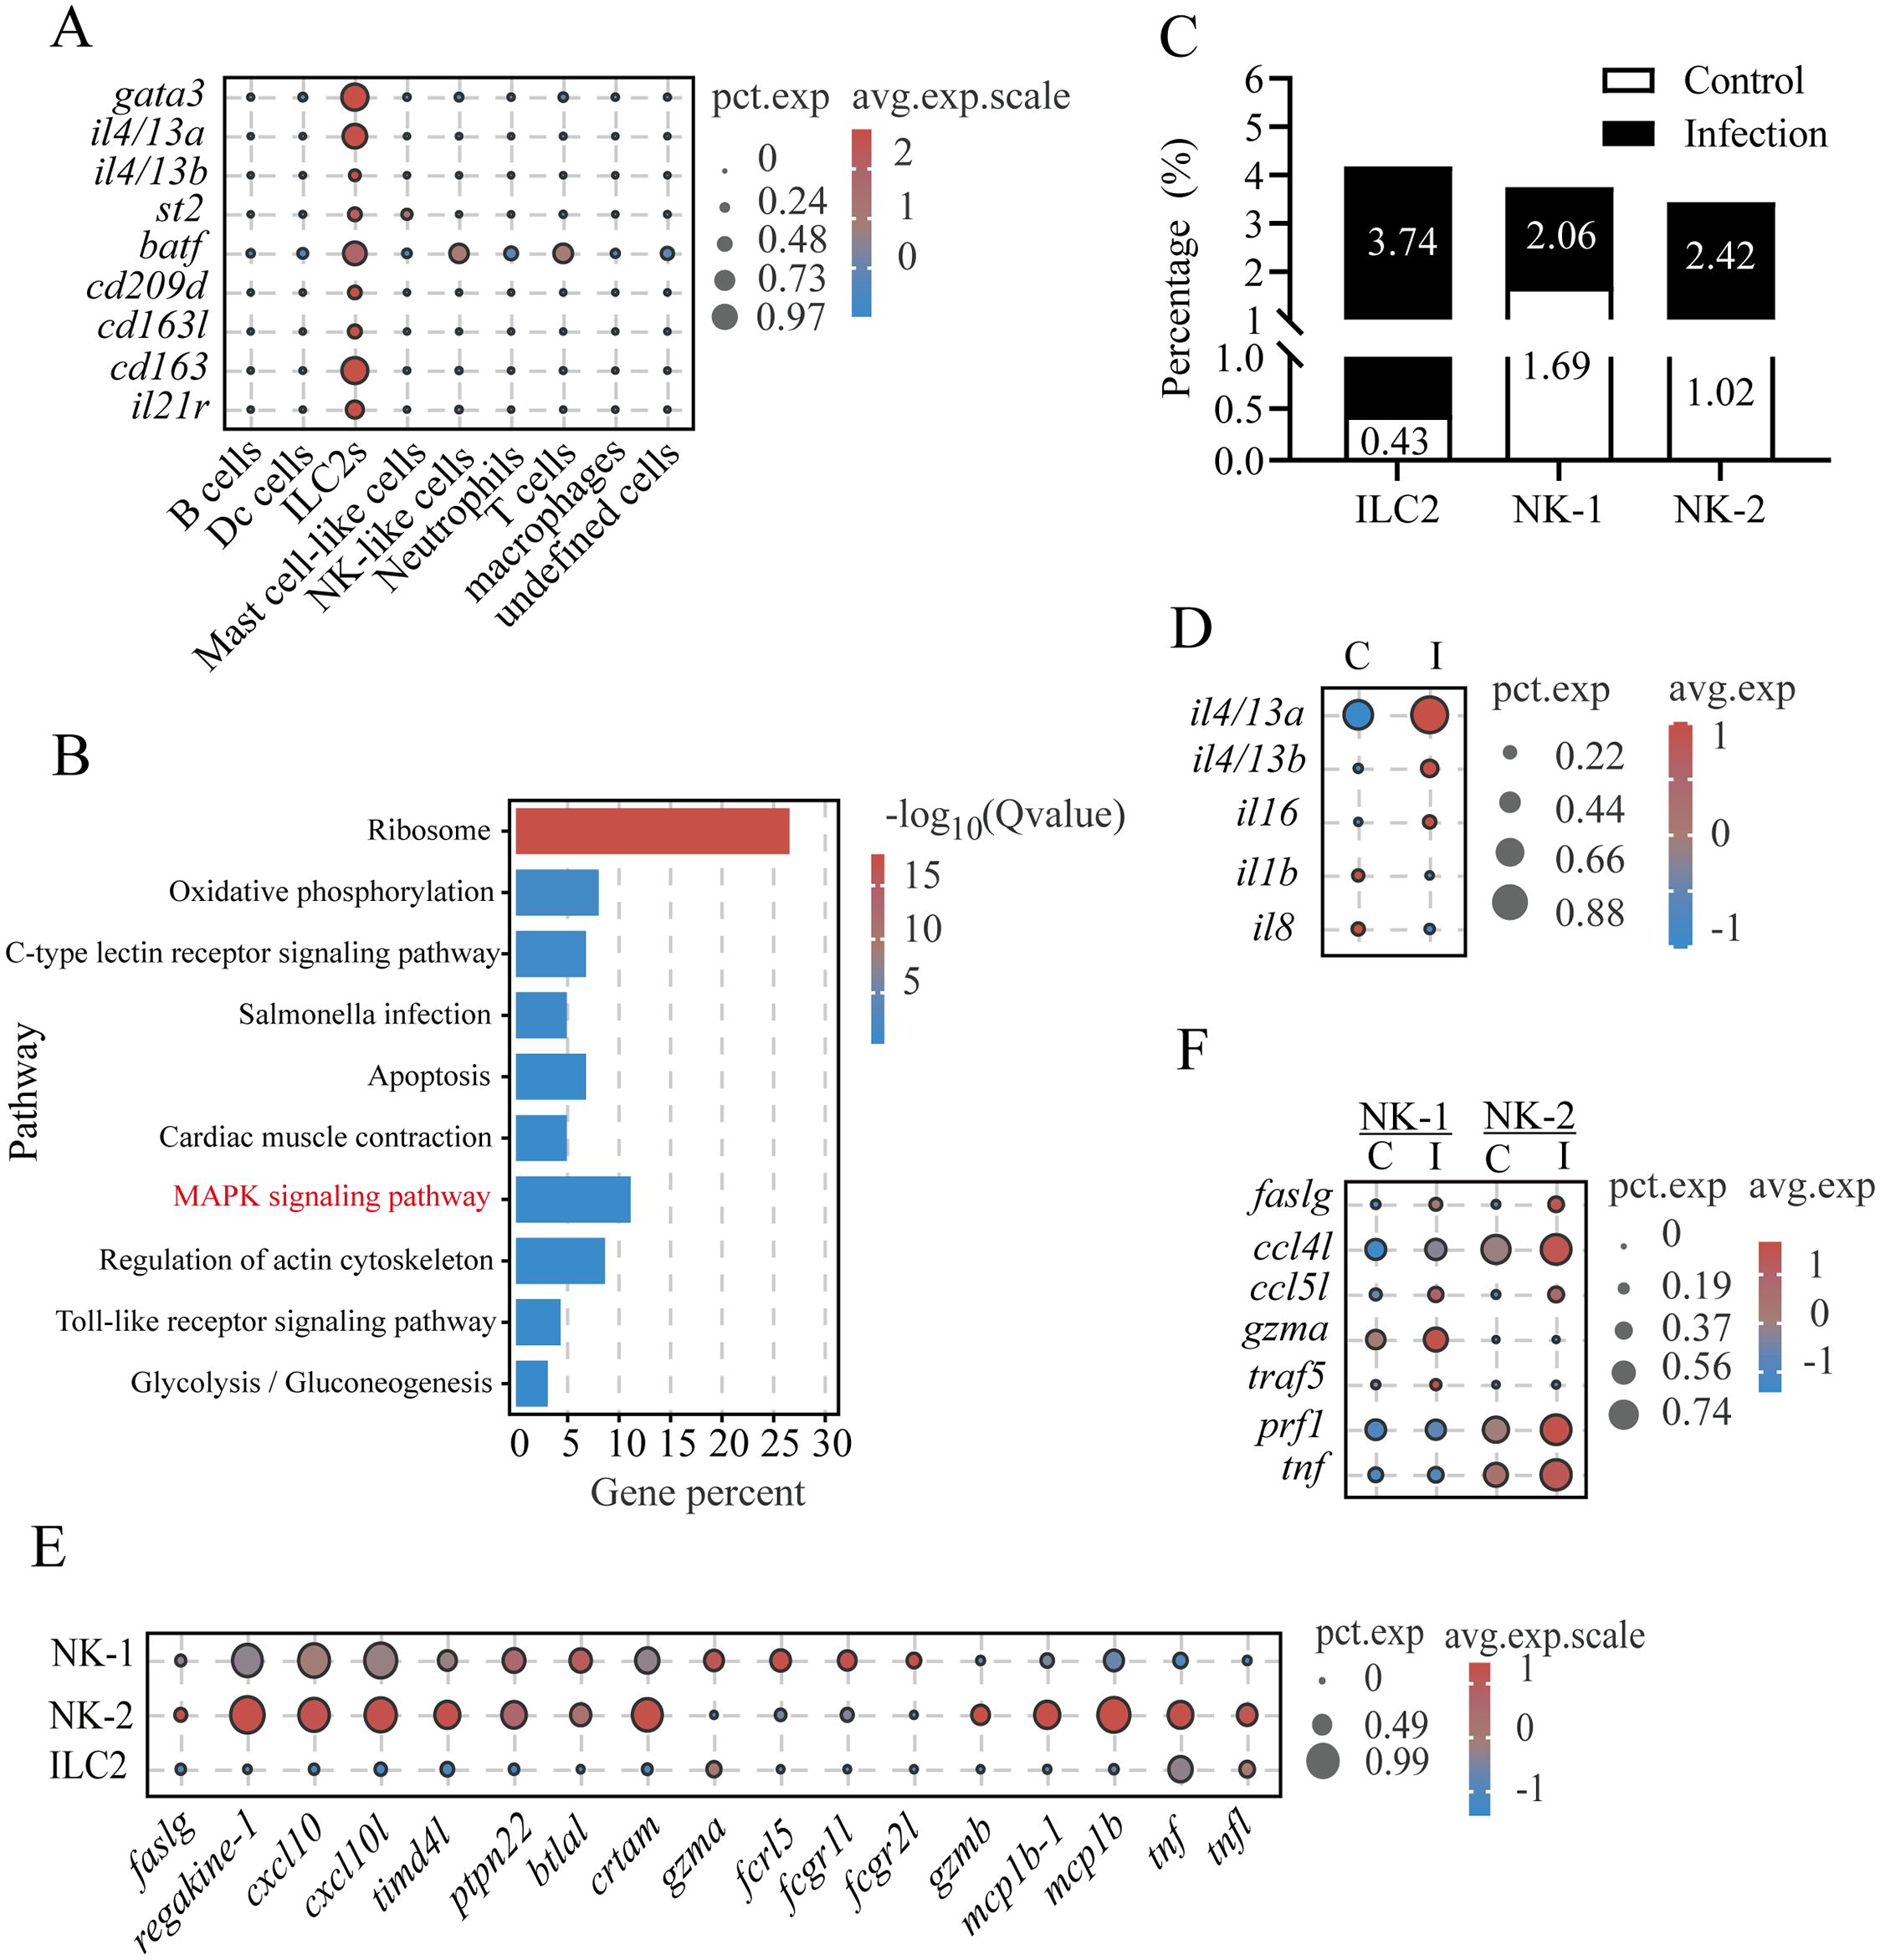
Figure 6. L. crocea ILC2-like cells exerted Th2-like functions upon C. irritans infection. (A) ILC2-like cell marker expression profiles. (B) KEGG pathway enrichment in ILC2-like cells. (C) Proportions of ILC2-like, NK-1, and NK-2 cells in total immune cells. (D) Immune-related gene expression in ILC2-like cells (control vs. infected). (E) Shared and differentially expressed genes between NK-1 and NK-2 subsets. (F) Infection-induced changes in NK-1 and NK-2 immune-related genes.
Within innate lymphoid populations, two cytotoxic NK cell subsets (NK-1 in cluster 17 and NK-2 in cluster 18) were characterized. Both subsets expressed core effector molecules (nkl, faslg, and prf1), chemotactic factors (e.g., regakine-1 and cxcl10), and immunoregulatory properties (e.g., timd4l, ptpn22, btlal, and crtam) (Figures 1B, 6E). NK-1 mainly expressed gzma and Fc receptor-related genes (fcrl5, fcgr1l, and fcgr2l), whereas NK-2 expressed gzmb and cytokines (mcp1b, tnf, and tnfl) (Figure 6E). This transcriptional divergence suggests compartmentalized functional roles between the cell subsets. The infection increased the proportion of both NK-1 (from 1.69% to 2.06%) and NK-2 (from 1.02% to 2.42%) (Figure 6C) and upregulated the pro-apoptotic effector (faslg) and chemokines (ccl5l and ccl4l) (Figure 6F). Subset-specific responses included an elevated expression of gzma and traf5 in NK-1 compared with prf1 and tnf upregulation in NK-2 (Figure 6F). These differential profiles suggest distinct cytotoxic mechanisms and compartmentalized immunoregulatory roles for NK-1 and NK-2 during C. irritans infection.
3.7 Differences of two granulocytes in gills and their response to C. irritans infection
Granulocytes are considered to be important effector cells in the protection of the gill mucosa of teleosts (8). However, the specific roles of individual subsets during parasitic infection are not well understood. To address this gap, we compared neutrophils and cpa5+ granulocytes to elucidate their functions in the gills of L. crocea during C. irritans challenge. Among 17,781 detected genes, 549 DEGs were identified in neutrophils, compared to 243 DEGs in cpa5+ granulocytes. GO enrichment analysis revealed that neutrophils were predominantly associated with proton transport (GO:0006818), hydrogen transport (GO:0015992), and macromolecular complex assembly (GO:0034622) (Supplementary Figure S5A). The cpa5+ granulocytes exhibited enrichment in processes related to single-organism signaling (GO:0044700), signaling receptor activity (GO:0023052), and cell communication (GO:0007154) (Supplementary Figure S5B). KEGG pathway analysis revealed significant enrichment of phosphatidylinositol signaling (ko04070), insulin signaling (ko04910), and C-type lectin receptor signaling pathways (immune recognition) in cpa5+ granulocytes, while oxidative phosphorylation (ko00190), proteasome activity (ko03050), phagocytosis (ko04145), and endocytosis (ko04144) pathways in neutrophils (Supplementary Figures S5C, D). In addition, cpa5+ granulocytes are involved in the expression of immune-related genes (such as clec4el, il6rβ, and cd97) and immunoregulatory factors (ccl8l, il16, and tgfb1), while neutrophils are related to the expression of chemotaxis receptors (cxcr1), inflammatory mediators (il1β and il8), chemokines (cklf and lect2l), and respiratory burst components (rac2) (Figure 7A; Supplementary Table S13). Additionally, protease profiling revealed lineage-specific enzymatic arsenals (mmp17l, mmp13, mmp9, cpe, ctsl, and alox15b), further supporting their different roles in immune defense (Figure 7A). These findings highlight significant functional differences between the two granulocyte populations, with neutrophils specializing in phagocytosis and oxidative killing and cpa5+ granulocytes involved in immunomodulation and pathogen recognition.
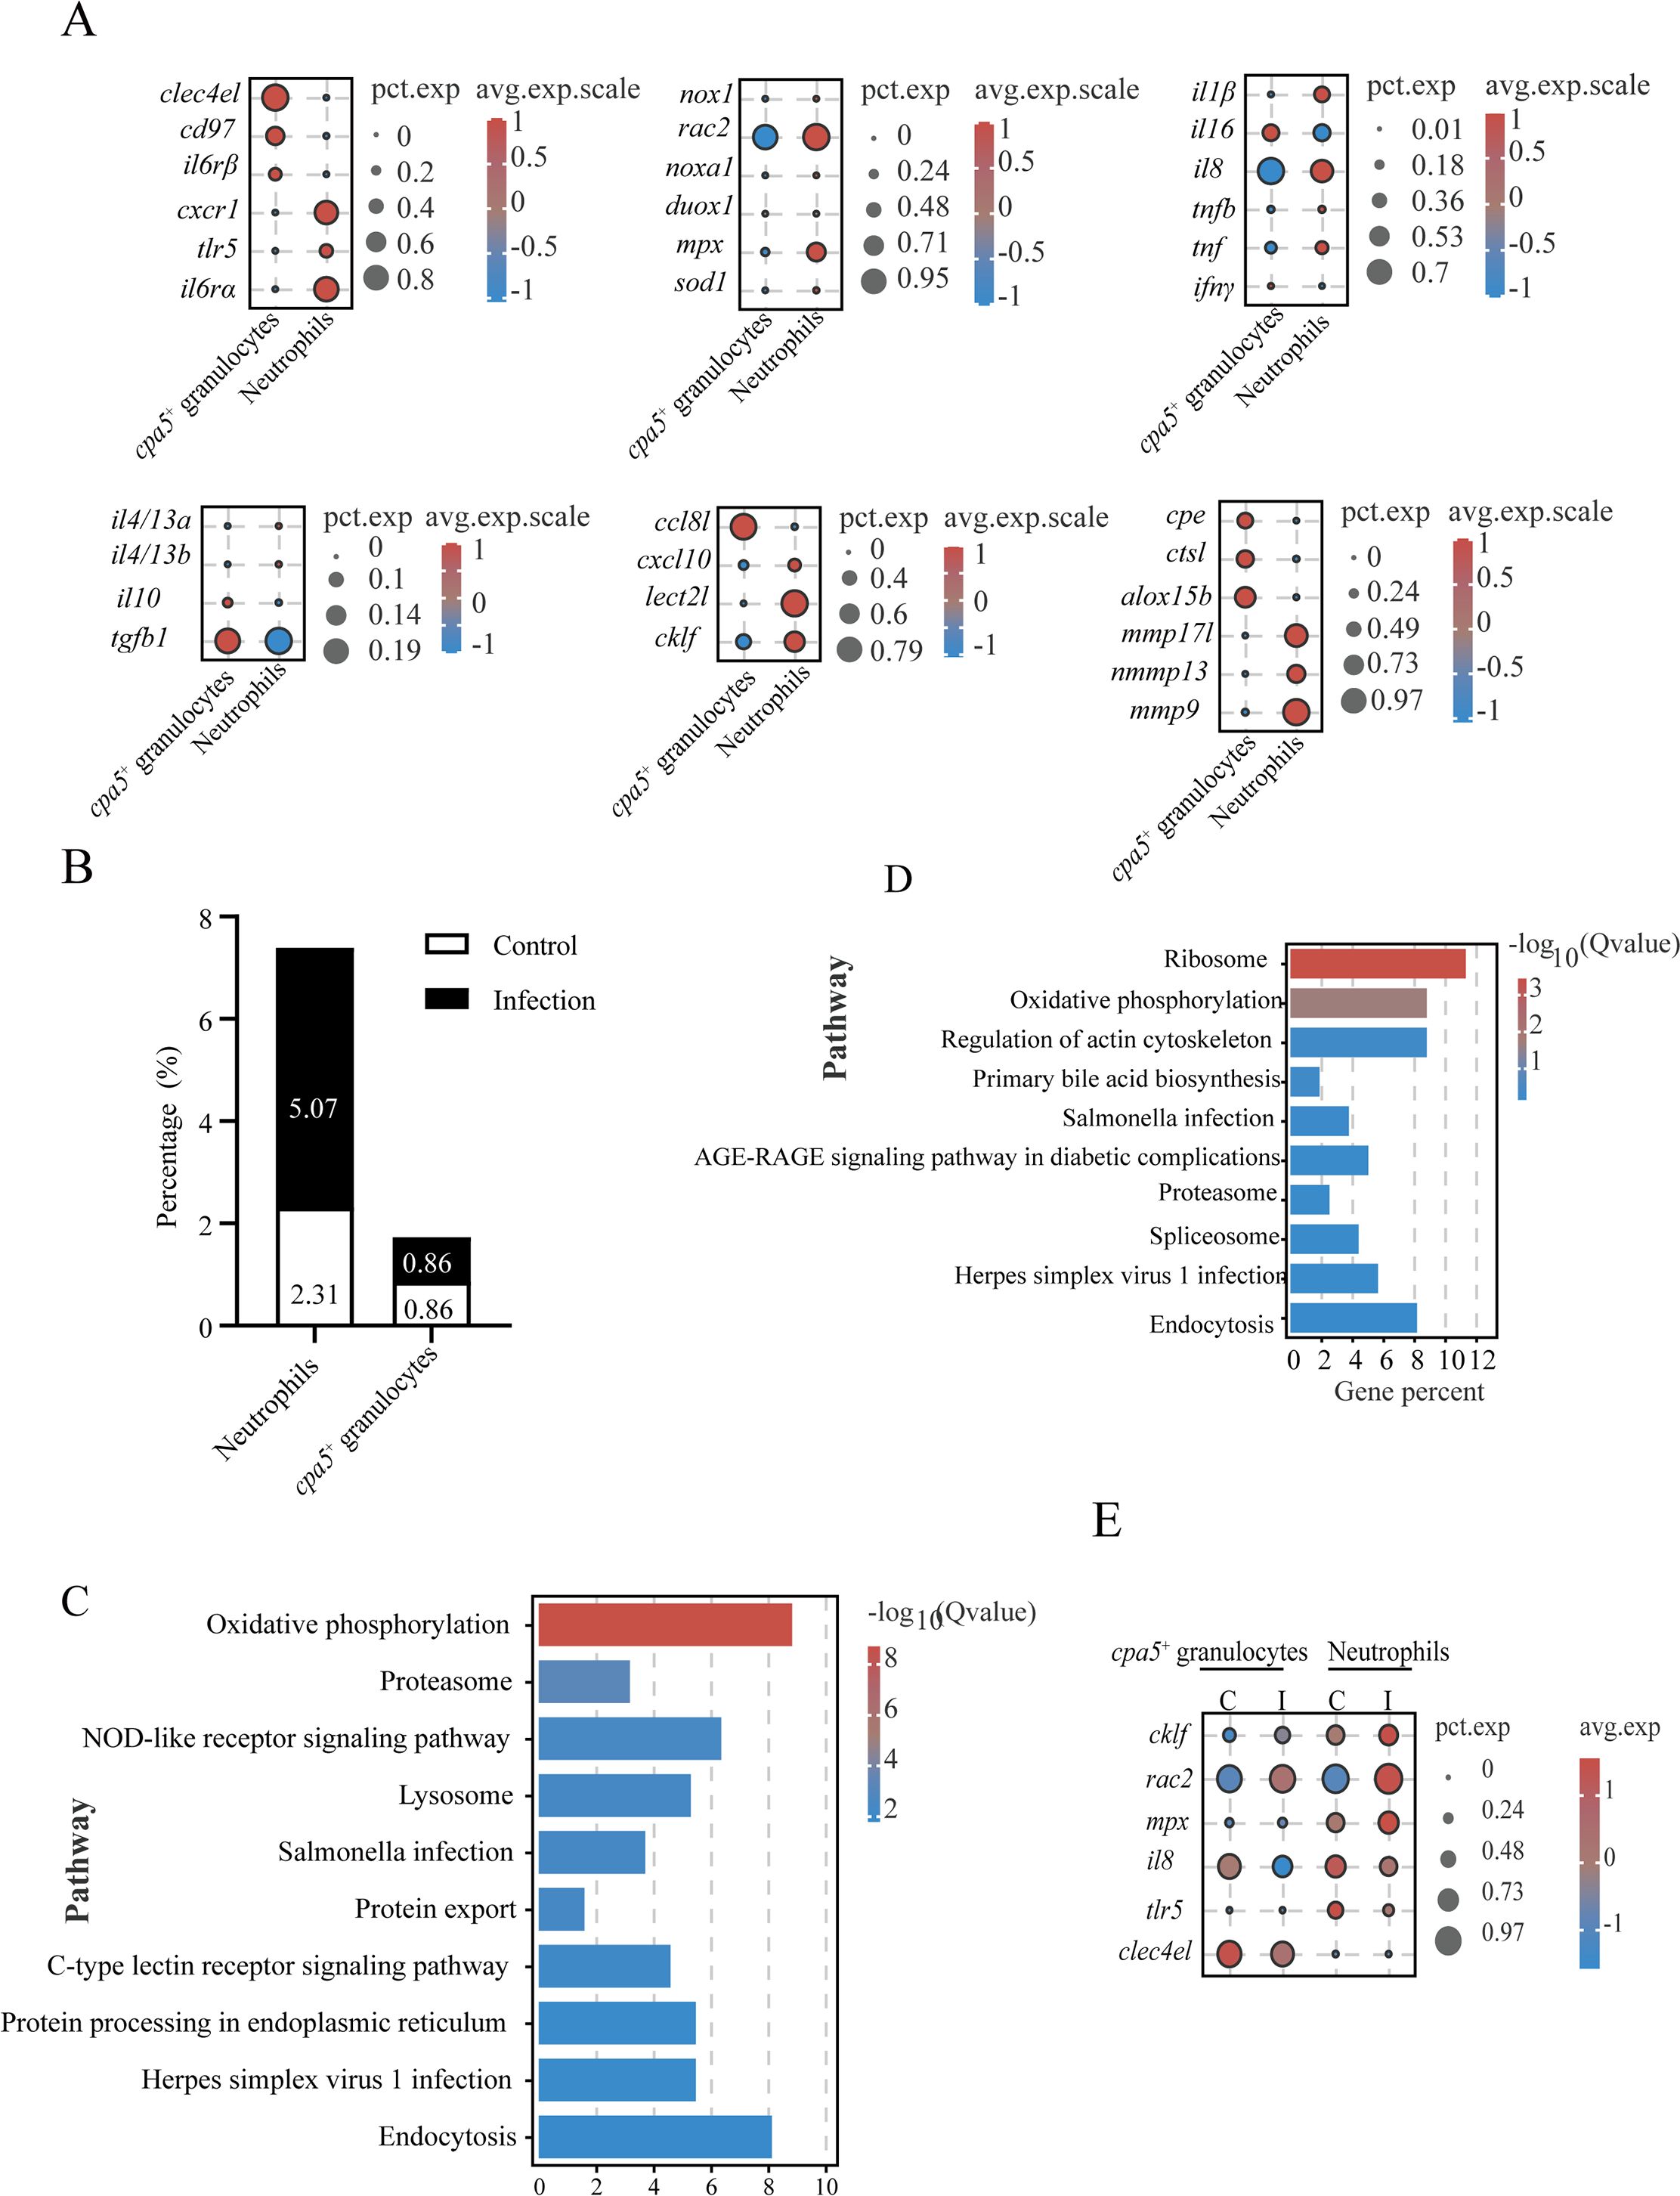
Figure 7. Comparative analysis of granulocyte populations and their responses to C. irritans infection. (A) Dot plot of differentially expressed genes between neutrophils and cpa5+ granulocytes. (B) Neutrophil and cpa5+ granulocyte cellular proportions in control vs. infected groups. (C, D) KEGG pathway enrichment in neutrophils (C) and cpa5+ granulocytes (D). (E) Immune-related gene expression changes in neutrophils and cpa5+ granulocytes post-infection.
Granulocytes were present in limited numbers in the gills of healthy fish (neutrophils: 2.31%; cpa5+ granulocytes: 0.86%) (Figure 7B). After C. irritans challenge, neutrophil counts increased to 5.07% (a 2.2-fold increase), while cpa5+ granulocyte counts remained stable (Figure 7B), suggesting the pathogen-specific mobilization of phagocytic defenses. This stability suggests that cpa5+ granulocytes may act as tissue-resident sentinels or immunomodulators, rather than undergoing rapid recruitment like neutrophils, potentially providing sustained regulatory signals or acting as a reservoir for later effector responses. Infection-responsive transcriptomic shifts revealed metabolic activation in both lineages, with upregulated oxidative phosphorylation (ko00190) The pathway Ribosome, which extends beyond the scope presented in Figure 7C (top 10), is not displayed in Figure 7C, despite the presence of significant enrichment. Therefore, we have removed this pathway, and Proteasome (ko03050) pathways (Figures 7C, D). The infection induced upregulation of chemoattractant (cklf) and respiratory burst effectors (rac2 and mpx), while suppressing inflammatory mediators (il8, tlr5, and clec4el) (Figure 7E). This dual response may indicate feedback regulation to mitigate tissue damage during late infection phases.
3.8 The responses of macrophages, dendritic cells and B cells in gills to C. irritans infection
KEGG pathway analysis revealed an upregulation of genes related to lysosomal and phagosomal pathways in macrophages, DCs, and B-5 cells (Cluster 5) (Figure 8A). Key genes within these pathways included cathepsins (ctsb, ctsk, and ctsz), lysosomal membrane proteins (limp2, npc2, and laptm4a), glycosidases (hexb), vacuolar ATPase subunits (atp6s1, atp6l, and atp6n), NADPH oxidase components (ncf1, nox2, and cyba), and vesicular trafficking regulators (rab5c, rab7, and rab11b) (Supplementary Table S14). These data suggest that B-5 cells, similar to macrophages and DCs, have phagocytic capacity. Macrophages expressed lineage-specific receptors (e.g., marco, mrc1, and csf1rb), complement system components (e.g., c1qbl, c2, and cfb), antigen presentation molecules (e.g., hla-drα, rt1-b, and cd74), and antimicrobial protein gene (bpi), indicating their roles in complement activation, antigen processing/presentation, and pathogen clearance in the gills (Figures 8B, 1B). DCs were characterized by transcription factors essential for their development (flt3, batf3, and znf366) (37), pattern recognition receptor (tlr7- a viral ssRNA sensor) (38), chemokines (ccl17 and ccl19l), and antigen presentation machinery (e.g., hla-drα, rt1-b, and cd74) (Figure 8B). B-5 cells exhibited antigen presentation activity (e.g., hla-drα, rt1-b, and ciita) and ribosome biogenesis signatures (e.g., rpl23, rpl39, and rpl37a) (Figure 8C), similar to B1-like cells in zebrafish (39). In contrast, B-13 cells showed features of plasma cells, with an enrichment in ER stress pathway activation (e.g., pdia4, erlec1, and txndc5), and upregulation of protein export machinery (e.g., srp14, hspa5, and srp19), immunoglobulin synthesis (ighm and ight), and differentiation-driving transcription factors (irf4l and prdm1a) (40) (Figure 8C).
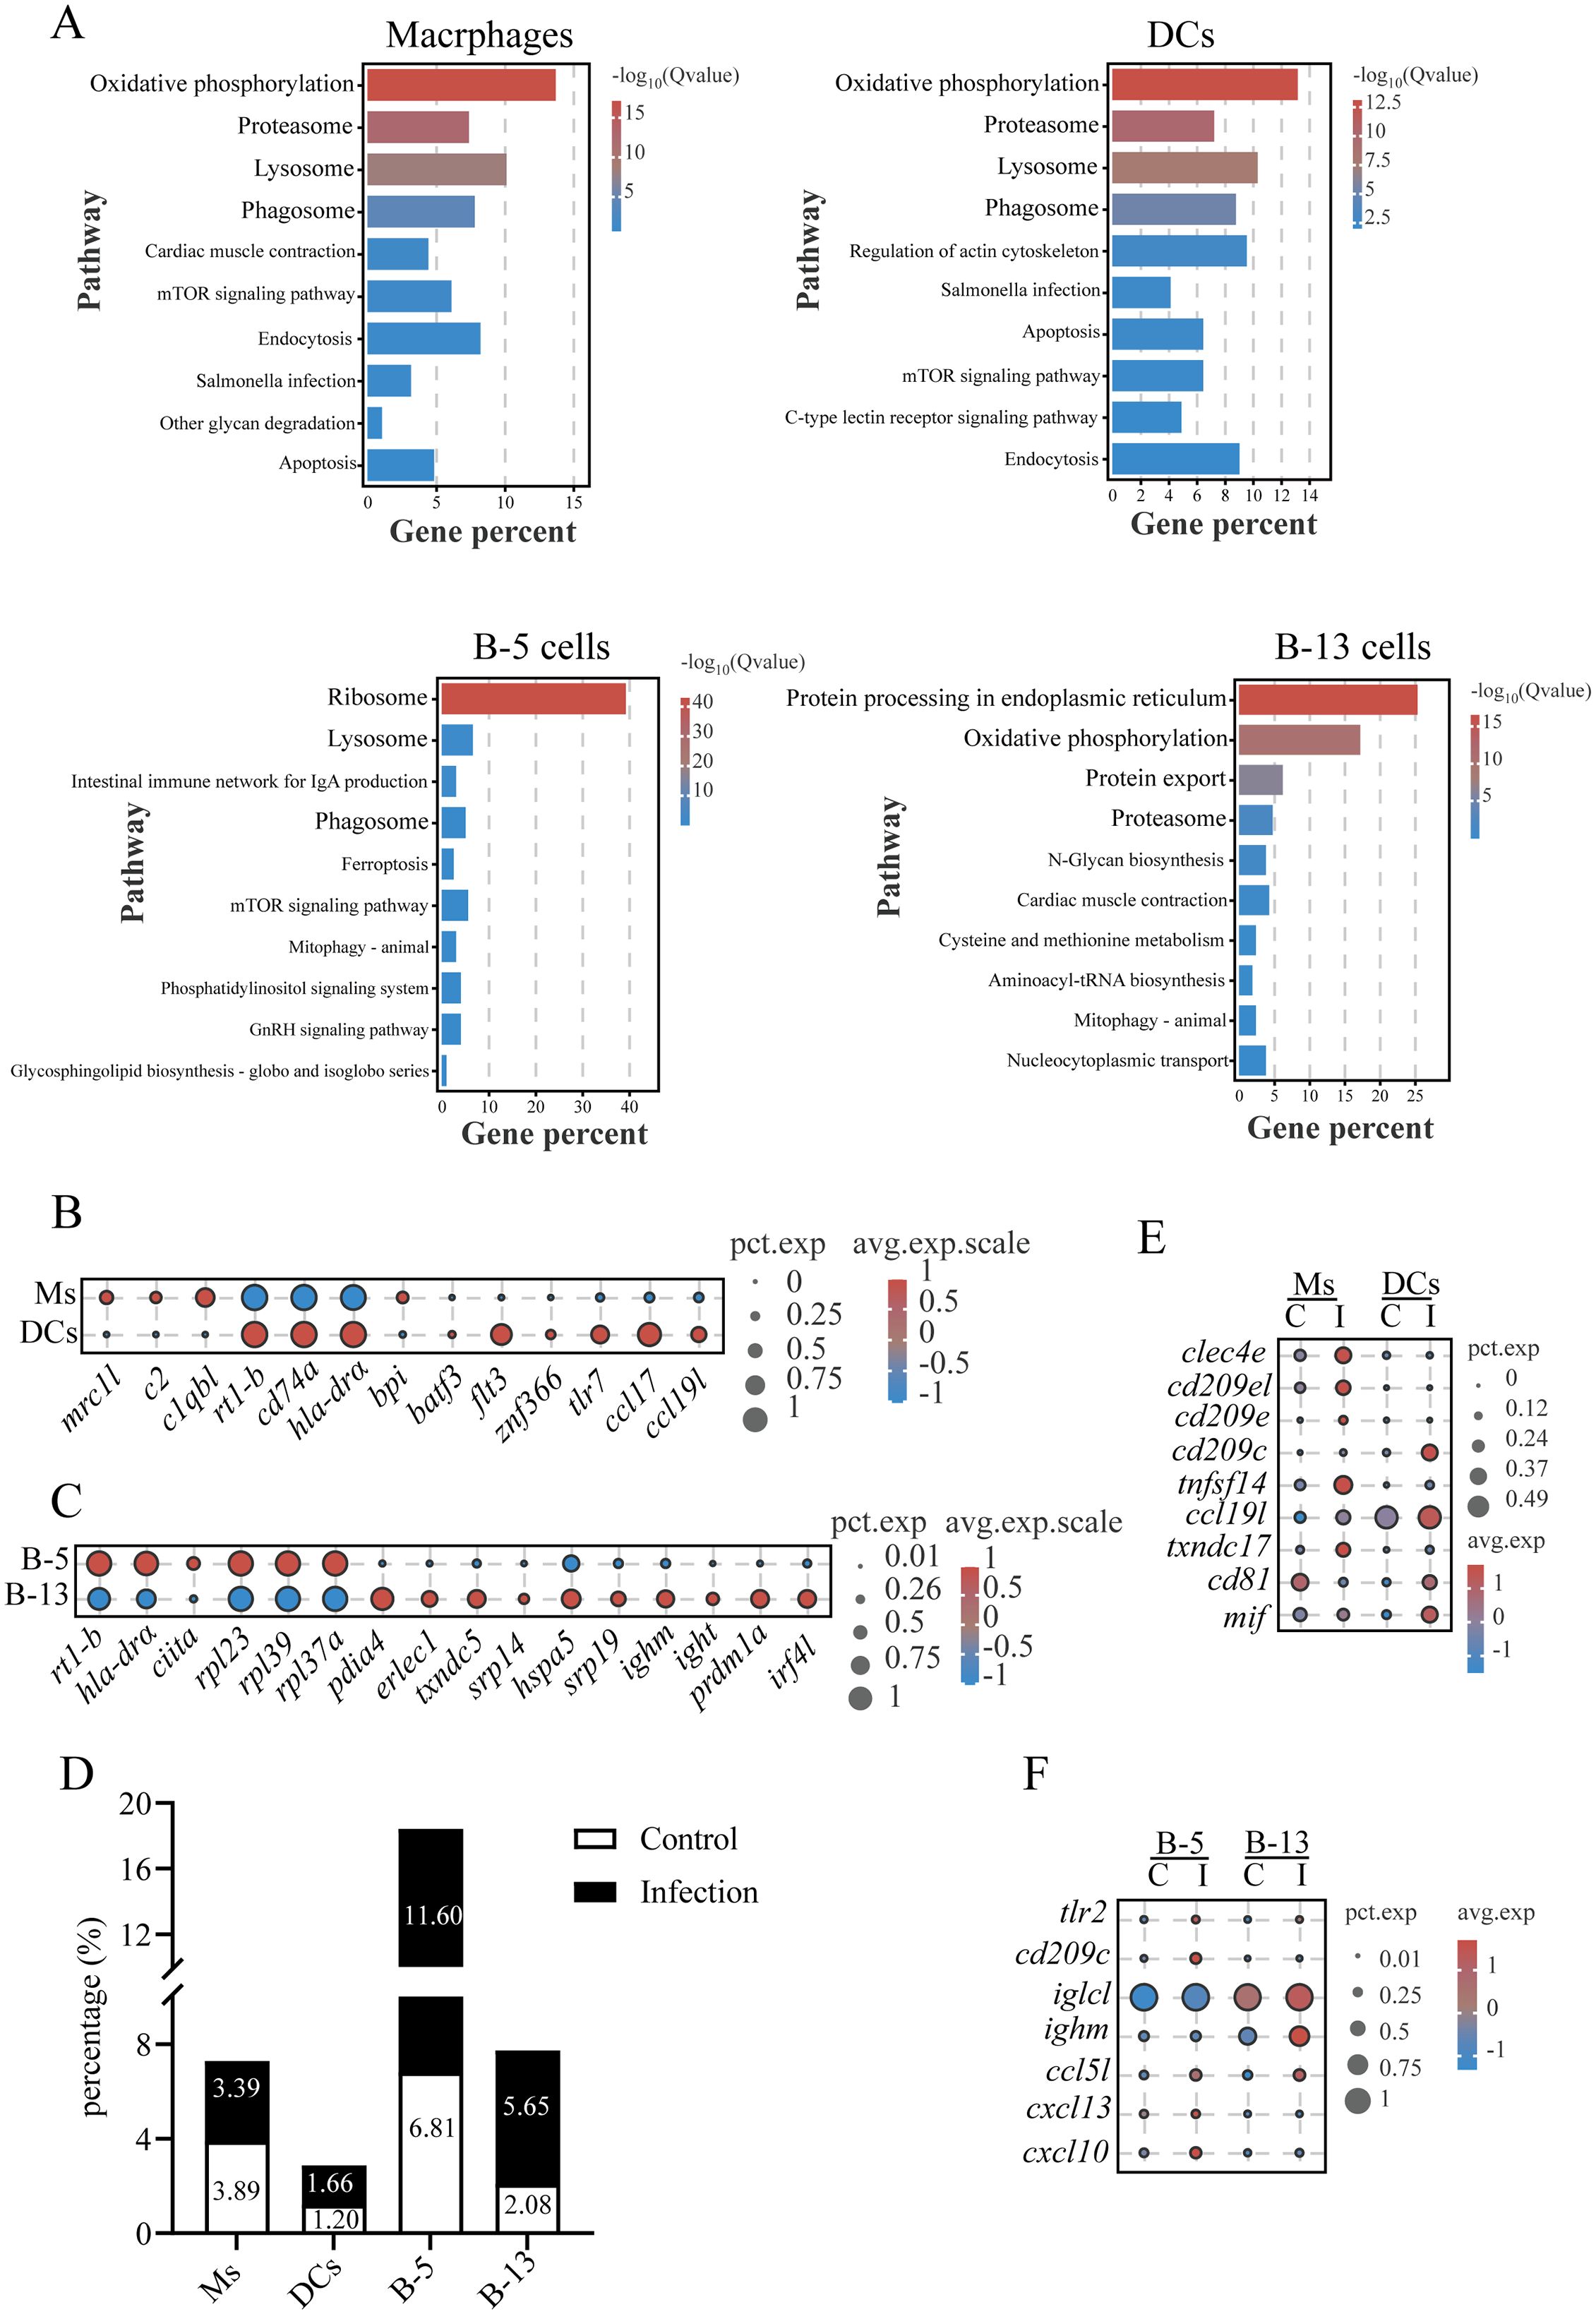
Figure 8. Characterization of macrophages, dendritic cells and B cells in gills and their responses to C. irritans infection. (A) KEGG pathway enrichment in macrophages, DCs, B-5 cells and B-13 cells. (B) Bubble plot comparing differentially expressed genes (DEGs) between macrophages (Ms) and DCs, highlighting lineage-specific functional difference. (C) Dot plot of differentially expressed genes between B-5 cells and B-13 cells. (D) Macrophages, DCs, B-5 cells and B-13 cells proportions in control vs. infected groups. (E) Immune-related gene expression changes in macrophages (Ms) and DCs post-infection. (F) Immune-related gene expression changes in B-5 cells and B-13 cells post-infection.
After C. irritans infection, the abundance of DCs, B-5, and B-13 cells increased from 1.20% to 1.66%, 6.81% to 11.60%, and 2.08% to 5.65%, respectively, while macrophages decreased (from 3.89% to 3.39%) (Figure 8D). Results found upregulation of pathogen-recognition receptors (clec4e, cd209c, cd209e, and tlr2) in macrophages, DCs, or B-5 cells in infected fish compared to controls (Figures 8E, F). Macrophages in the gills of infected fish exhibited increased expression of tnfsf14 (a cytokine that promotes T cell proliferation (41), 8.64-fold), ccl19l (a chemokine critical for naïve T cell recruitment (42), 3.37-fold), and txndc17 (a redox homeostasis regulator (43), 4.22-fold), compared to the controls. DCs showed elevated expression of tnfsf14 (15.06-fold), cd81 (MHC-II compartment regulator, 4.58-fold) and mif (a macrophage migration inhibitor, 3.7-fold) in infected fish compared to controls. Both B-5 and B-13 cells exhibited enhanced antibody production (iglcl and ighm) and upregulated expression of the T cell chemoattractant (ccl5l) in the infected fish (Figure 8F). Notably, B-5 cells specifically upregulated a lymphoid-organizing chemokine responsible for B cell follicle formation (44) (cxcl13) and a Th1-associated chemokine mediating T/NK cell recruitment (cxcl10) in the infected fish (Figure 8F). These results suggest coordinated roles for B cell subsets in adaptive immune regulation and lymphoid tissue remodeling in the gills of L. crocea during C. irritans infection.
4 Discussion
As a multifunctional organ at the host-environment interface, the gills of teleosts balance physiological homeostasis with pathogen defense through specialized leukocyte networks. However, their composition, heterogeneity, and regulatory roles in immune homeostasis remain largely unknown. T cells are crucial mediators of adaptive immunity. Our scRNA-seq analysis reveals that T cells dominate (>70%) the immune cell landscape of L. crocea gills, consistent with reports in Scophthalmus maximus and Oreochromis niloticus (10, 11). Similarly, in zebrafish (Danio rerio), recent immunohistochemical studies demonstrated an abundance of T cells in gill mucosa-associated lymphoid tissues (45, 46). These results indicate the important role of T cells in teleost gill immunity. Our results further identified seven T cell subpopulations in the gills, including DNTs, CD4+ naïve T cells, CD4+ Foxp3+ Tregs, CD4+ Th17 cells, CD4+ Th1 cells, CD8+ T cells, and γδ T cells, similar to the case of S. maximus gills (11). Critically, all L. crocea T cell subsets co-expressed TCR signaling components (zap70, lck, and cd3ζ), confirming the evolutionary conservation of antigen-driven activation mechanisms. These findings demonstrate that teleost gills contain multiple functionally specialized T cell lineages, which may play important roles in gill immunity.
The differentiation of naïve CD4+ T cells into specialized effector subsets represents a cornerstone of adaptive immunity, with lineage commitment dictated by pathogen class (47–50). Our study revealed that C. irritans infection elicits minimal Th1/Th17 subset modulation in L. crocea gills, a phenomenon potentially attributable to a shorter duration of infection or parasite-specific immunomodulation. Nevertheless, localized T cell proliferation acceleration aligns with prior reports of C. irritans infection causing clonal expansion of T cells in teleost gills (23). Notably, C. irritans infection triggered Treg differentiation and activation, characterized by the upregulation of foxp3 and tgfb1. This is consistent with mammalian helminth infection models, in which parasites directly or indirectly drive Treg differentiation through TGFβ signaling (51). Treg expansion likely represents a host defense mechanism to limit infection-induced immunopathology, such as tissue damage. However, it may also represent a strategy exploited by C. irritans to dampen effective anti-parasitic immunity and facilitate persistence. Excessive Treg activity can impair parasite clearance, as demonstrated in mouse models where Treg depletion enhanced pathogen elimination (52, 53). These findings suggest that C. irritans may exploit Treg expansion as an immune evasion strategy. Manipulating Treg activity, such as via targeted inhibition of TGFβ signaling during early infection, represents a potential therapeutic strategy for enhancing parasite clearance in aquaculture settings.
In contrast to mammalian CD8+ CTLs, which predominantly mediate antigen-dependent elimination of virus-infected or malignant cells through MHC-I-restricted mechanisms, teleost CD8+ T cells exhibit innate-like cytotoxicity against a variety of pathogens, including extracellular parasites. For example, Carassius auratus CD8+ T cells directly lyse Ichthyophthirius multifiliis depending on serine proteases and perforin (54). The cytolytic machinery may involve perforin-mediated pore formation, facilitating granzymes (serine proteases) delivery to disrupt target cell membrane integrity. Similarly, the antimicrobial peptide Nk-lysin (NKL, encoded by nkl) in teleosts demonstrates anti-parasitic activity (55). In L. crocea, transcriptional upregulation of nkl, prf1, and gzmb in CD8+ CTLs during C. irritans infection suggests conserved cytotoxic pathways against ectoparasites. This functional difference highlights the evolutionary ancient role of cytotoxic lymphocytes in direct anti-parasitic defense, with innate-like mechanisms operating alongside MHC-restricted immunity, emphasizing the importance of such responses on the mucosal surfaces of teleosts.
Despite sharing regulatory functions with Tregs, DNTs also secrete cytokines (IL-4, IL-17, IFN-γ, and TNF-α) to exert T helper (Th)-like activities, exhibiting protective roles across infection models in mammals (27). For instance, DNTs constitute a major responding T cell subset in murine lungs during Francisella tularensis infection, conferring protection via IL-17A and IFN-γ production (56). In teleosts, DNTs in S. maximus showed upregulated expression of cytotoxicity-related genes (faslg, nkl3, gzma, gzmb, and prf1) and the immunoregulatory gene il10 during Edwardsiella piscicida infection, suggesting dual roles in cytolysis and immune modulation (11). Our findings revealed that LcDNTs displayed Th17-like functional program (rorc and il17a/f1) and upregulated immunomodulatory factors (ccl5l and tnf) following C. irritans challenge. These results indicate that DNTs in teleosts, like mammals, contribute to the inflammatory response while retaining regulatory potential, underscoring the evolutionary conservation of the multifunctional role of DNTs in mucosal immunity.
γδ T cells represent an evolutionarily primitive T cell subset characterized by distinct TCRs and roles in innate and adaptive immunity, mainly categorizing into two functionally distinct T cell subsets (IFN-γ-producing γδ T1 cells and IL-17-secreting γδ T17 cells) (57). Additionally, Type 2-like γδ T effector cells have been identified in humans, although they do not consistently express signature cytokines such as IL-4 (58). In addition, a specific subset of Vγ1+Vδ6+ T cells in mice can produce large amounts of IL-4 and participate in helping B cells produce IgE (59). In teleosts, γδ T cells with functional similarities to mammalian γδ T cells have been found. For example, γδ T cells in D. rerio exhibit potent phagocytic capabilities and serve as antigen-presenting cells, initiating CD4+ T cell activation and promoting IgM/IgZ production (60). However, Th-like γδ T cells (specialized type 2 effectors) have not yet been identified in teleosts. In this study, γδ T cells in L. crocea displayed Th2-like effector properties, as marked by il4/13a/b expression. This reports the first characterization of specialized type 2 effector γδ T cells in teleosts, revealing a previously unrecognized heterogenous class within this lineage and a potential important role in regulating humoral immunity (e.g., Ig production) against parasitic infections.
ILC2s serve as tissue-resident sentinels in mucosal tissues, modulating type 2 immunity through GATA3-dependent cytokine production (e.g., IL-4/IL-13) to combat extracellular parasites (31, 36, 61). The identification of LcILC2s expressing gata3, il4/13a/b, and st2 (IL-33R) provided the first evidence of a conserved type 2 immune axis in the gills of teleost fish. The increased number of LcILC2s (8.7-fold) and cytokine induction in infected fish, compared with controls, are similar to the mammalian ILC2s response to helminths (62), suggesting its important role in anti-parasitic defenses and highlighting ILC2s as potential targets for mucosal vaccines against ectoparasites like C.irritans. In mammals, epithelial alarmins (IL-25/IL-33) activate ILC2s via receptors (IL-25R/IL-33R), driving IL-4/IL-13-dependent macrophage polarization, Th2 differentiation, and epithelial remodeling to expel parasites (50, 63–65). Intriguingly, the absence of canonical ILC2-activating receptors (il7r/il25r) and the unique expression of il21rl suggest a potential teleost-specific regulatory difference. Therefore, we propose that IL-21, a pleiotropic type I cytokine that modulates multiple immune cell types (T/B cells, macrophages, and DCs) (66), may serve as a potential teleost-specific ILC2 regulator and an immunostimulant against parasitic infection, although this hypothesis requires further confirmation. Notably, compared to conventional CD4+ T cells, the expression levels of gata3, il4/13a, and il4/13b are higher in LcILC2s, emphasizing the crucial role of ILC2s in the type 2 immune response of fish gills, especially in anti-parasitic defenses. This functional conservation of type 2 effector mechanisms, coupled with different receptor utilization, highlights both shared ancestry and lineage-specific adaptations in vertebrate ILC2 biology. These findings establish teleost ILC2-like cells as ancient mediators of mucosal antiparasitic immunity.
The phagocytic capacity of B-5 cells, marked by enrichment in phagosomal and lysosomal pathways, is consistent with emerging evidence that teleost B cells contribute to pathogen clearance via phagocytosis (67, 68). The higher abundance of both B-5 and plasma cell-like B-13 cells, combined with enhanced expression of ighm in infected gills, directly correlates with findings showing increased levels of parasite-specific IgM locally in the gills of L. crocea after C. irritans infection (23). This confirms the functional contribution of these gill-resident B cell subsets to local mucosal antibody responses. Recent advances underscore the significance of TLRs (e.g., TLR2) as pivotal pathogen sensors in aquatic species (69). Supporting this, our data show upregulation of tlr2 in infected B-5 cells, indicating its potential involvement in anti-parasitic responses. In mice, CXCL13 is a crucial regulator of B-cell migration and lymphoid tissue architecture, with CXCL13−/− mice exhibiting aberrant follicular organization (44). By analogy, the upregulation of cxcl13 in B-5 cells may promote the formation of gill-associated lymphoid tissues (e.g., ILT and ALT) in the gills of L. crocea. In Paralichthys olivaceus, CXCL10 exhibits dual functions as both an immunoregulator and a bactericidal agent (70). Thus, the induction of cxcl10 in B-5 cells may represent an additional mechanism to combat parasites, which needs confirmation in further studies. DCs emerged as important coordinators of adaptive immunity, enhancing tnfsf14 expression to promote T cell proliferation and ccl19l expression to facilitate naïve T cell recruitment. This functional regulation of DCs on T cells underscores their conserved role in bridging innate and adaptive defenses across vertebrates.
In conclusion, this study systematically deciphered the cellular atlas of mucosal immunity in the gills of teleost fish (Figure 9), unveiling a multi-layered defense mechanism mediated by various immune cells and providing an important model for comparative immunology. Future research may incorporate additional methodologies, such as cell sorting, CRISPR screening, or cell depletion, to further validate the role of the IL21RL signaling pathway in ILC2s and the mechanisms of Treg-mediated immune tolerance, providing new targets for anti-parasitic strategies in aquaculture.
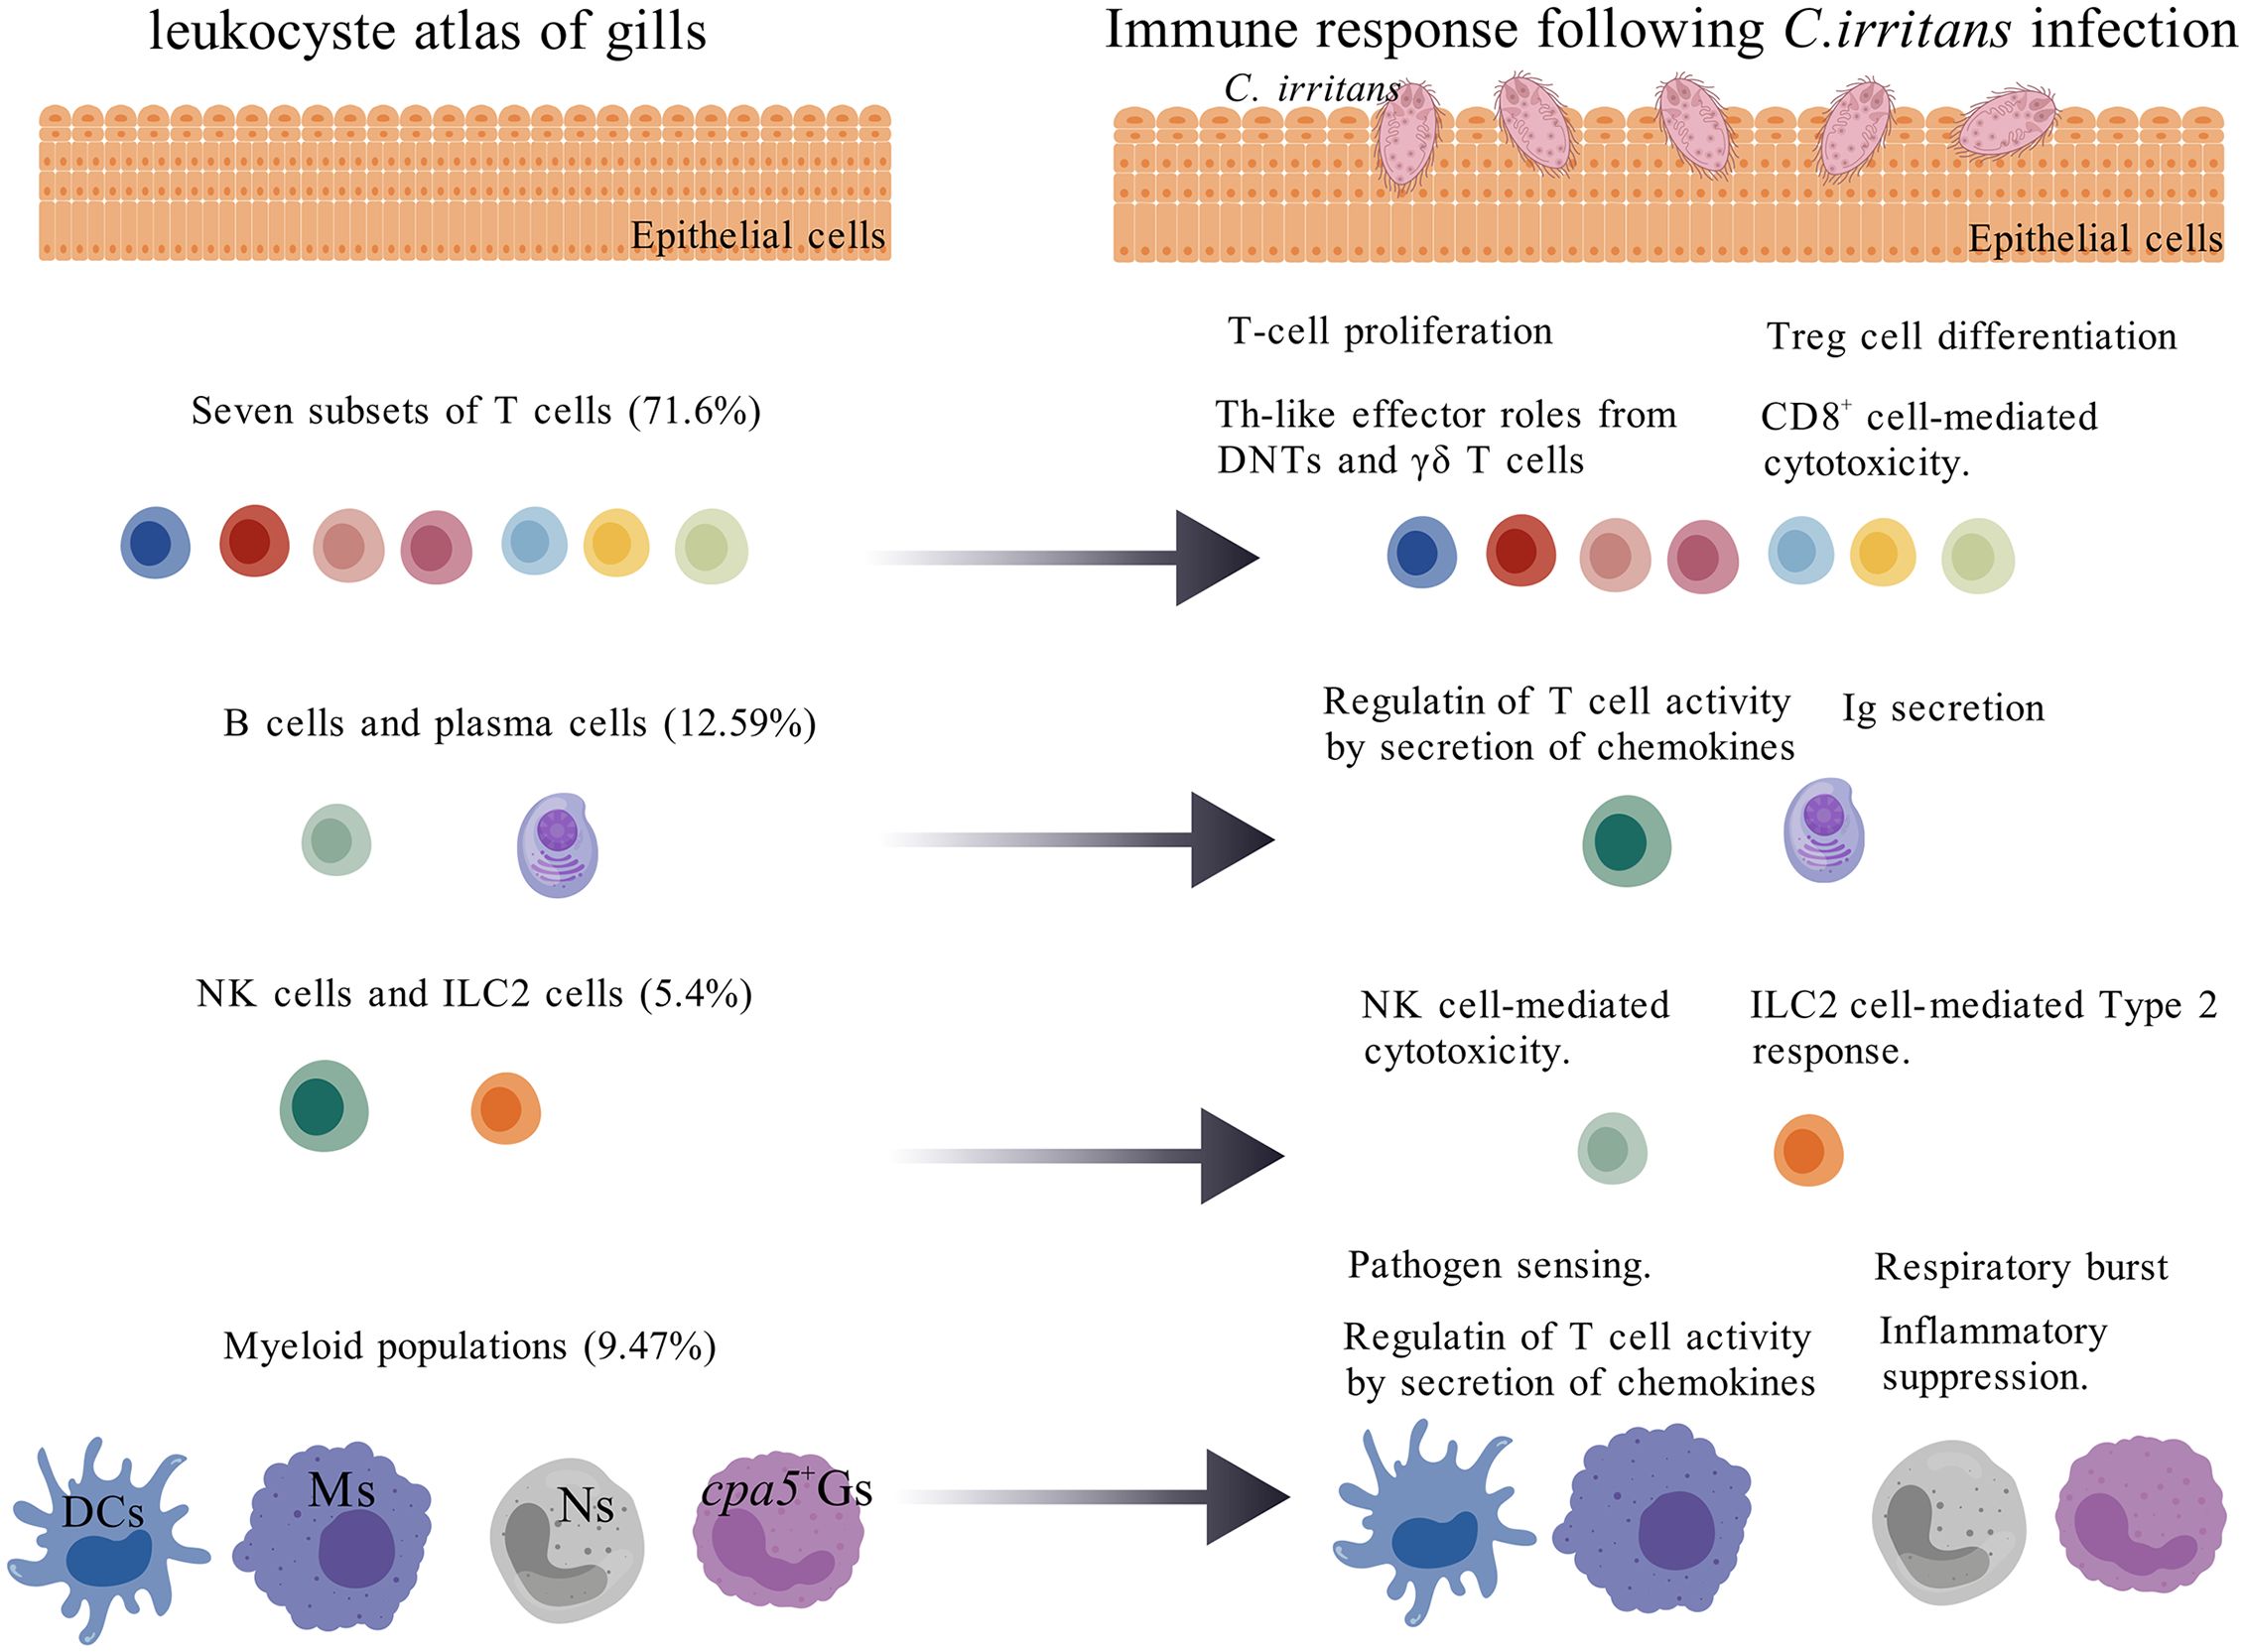
Figure 9. Leukocyte heterogeneity in the gills of L. crocea in response to C. irritans infection. Gill leukocytes are predominantly composed of T cells (>70% of total immune cells), followed by B cells, myeloid cells, and innate granulocytes (NK-like cells and ILC2-like cells). C. irritans infection triggered T cell proliferation and functional diversification, including: regulatory T cell (Treg) differentiation (Foxp3+), cytotoxic CD8+ T cell activation, Th17-like activity in DNTs, and Th2-like responses in γδ T cells. B cells exhibited IgM secretion and chemokine production. ILC2-like cells expanded significantly (8.7-fold increase) with upregulated type 2 cytokine expression, while cytotoxic NK subsets enhanced effector functions. Neutrophil (Ns) abundance and oxidative burst activity increased, whereas cpa5+ granulocytes (cpa5+Gs) maintained stable abundance but promoted immunomodulation. Macrophages (Ms) and dendritic cells (DCs) adopted compartment-specific activation states, upregulating gene modules linked to pathogen sensing, antigen processing/presentation, and chemotaxis.
Data availability statement
The datasets presented in this study can be found in online repositories. The names of the repository/repositories and accession number(s) can be found below: https://ngdc.cncb.ac.cn/gsa/, CRA025829.
Ethics statement
The animal study was approved by the Animal Ethics Committee of Fujian Agriculture and Forestry University. The study was conducted in accordance with the local legislation and institutional requirements.
Author contributions
QL: Data curation, Methodology, Formal Analysis, Funding acquisition, Writing – review & editing, Investigation, Writing – original draft. MW: Writing – original draft, Methodology, Investigation, Data curation, Software. CL: Methodology, Data curation, Writing – original draft. NTT: Writing – review & editing, Validation. JA: Writing – review & editing, Visualization, Supervision, Funding acquisition. SL: Writing – review & editing, Supervision. XC: Supervision, Methodology, Writing – review & editing, Funding acquisition, Resources, Validation.
Funding
The author(s) declare that financial support was received for the research and/or publication of this article. This work was supported by National Natural Science Foundation of China (U23A20253, 32102784, 42306147), China Agriculture Research System of MOF and MARA (CARS-47), Natural Science Foundation of Fujian Province (2022J01211209), and Fujian Agriculture and Forestry University (KFB23108).
Conflict of interest
The authors declare that the research was conducted in the absence of any commercial or financial relationships that could be construed as a potential conflict of interest.
Generative AI statement
The author(s) declare that no Generative AI was used in the creation of this manuscript.
Publisher’s note
All claims expressed in this article are solely those of the authors and do not necessarily represent those of their affiliated organizations, or those of the publisher, the editors and the reviewers. Any product that may be evaluated in this article, or claim that may be made by its manufacturer, is not guaranteed or endorsed by the publisher.
Supplementary material
The Supplementary Material for this article can be found online at: https://www.frontiersin.org/articles/10.3389/fimmu.2025.1633701/full#supplementary-material
References
1. Xu Z, Takizawa F, Parra D, Gomez D, Jorgensen LV, LaPatra SE, et al. Mucosal immunoglobulins at respiratory surfaces mark an ancient association that predates the emergence of tetrapods. Nat Commun. (2016) 7:10728. doi: 10.1038/ncomms10728
2. Alsafy MAM, Abd-Elhafeez HH, Rashwan AM, Erasha A, Ali S, and El-Gendy SAA. Anatomy, histology, and morphology of fish gills in relation to feeding habits: a comparative review of marine and freshwater species. BMC Zool. (2025) 10:3. doi: 10.1186/s40850-025-00223-5
3. Leonard EM, Porteus CS, Brink D, and Milsom WK. Fish gill chemosensing: knowledge gaps and inconsistencies. J Comp Physiol B. (2024) 194:1–33. doi: 10.1007/s00360-024-01553-5
4. Wood CM and Eom J. The osmorespiratory compromise in the fish gill. Comp Biochem Physiol A Mol Integr Physiol. (2021) 254:110895. doi: 10.1016/j.cbpa.2021.110895
5. Onukwufor JO and Wood CM. The osmorespiratory compromise in rainbow trout (Oncorhynchus mykiss): The effects of fish size, hypoxia, temperature and strenuous exercise on gill diffusive water fluxes and sodium net loss rates. Comp Biochem Physiol A Mol Integr Physiol. (2018) 219-220:10–8. doi: 10.1016/j.cbpa.2018.02.002
6. Zilionis R, Engblom C, Pfirschke C, Savova V, Zemmour D, Saatcioglu HD, et al. Single-cell transcriptomics of human and mouse lung cancers reveals conserved myeloid populations across individuals and species. Immunity. (2019) 50:1317–1334.e1310. doi: 10.1016/j.immuni.2019.03.009
7. Yun S, Xiao H, Wu K, Guo X, Liu Y, Lu Y, et al. MCSFR+ monocytes/macrophages are activated to produce IL-4/13 in the gill lamellae of grass carp after infection with bacterial pathogens. Aquaculture. (2024) 586:740812. doi: 10.1016/j.aquaculture.2024.740812
8. Cervera L, Gonzalez-Fernandez C, Arizcun M, Cuesta A, and Chaves-Pozo E. Severe Natural Outbreak of Cryptocaryon irritans in Gilthead Seabream Produces Leukocyte Mobilization and Innate Immunity at the Gill Tissue. Int J Mol Sci. (2022) 23:937. doi: 10.3390/ijms23020937
9. Zhou Q, Zhao C, Yang Z, Qu R, Li Y, Fan Y, et al. Cross-organ single-cell transcriptome profiling reveals macrophage and dendritic cell heterogeneity in zebrafish. Cell Rep. (2023) 42:112793. doi: 10.1016/j.celrep.2023.112793
10. Zheng S and Wang WX. Physiological and immune profiling of tilapia Oreochromis niloticus gills by high-throughput single-cell transcriptome sequencing. Fish Shellfish Immunol. (2023) 141:109070. doi: 10.1016/j.fsi.2023.109070
11. Wc A, Jh A, Wei WA, Ying WA, Hao CA, Qw A, et al. Multi-tissue scRNA-seq reveals immune cell landscape of turbot (Scophthalmus maximus). Fundam Res. (2022) 2:550–61. doi: 10.1016/j.fmre.2021.12.015
12. West AC, Mizoro Y, Wood SH, Ince LM, Iversen M, Jorgensen EH, et al. Immunologic profiling of the atlantic salmon gill by single nuclei transcriptomics. Front Immunol. (2021) 12:669889. doi: 10.3389/fimmu.2021.669889
13. Li YW, Jiang BA, Mo ZQ, Li AX, and Dan XM. Cryptocaryon irritans (Brown, 1951) is a serious threat to aquaculture of marine fish. Rev Aquacult. (2021) 14:218–36. doi: 10.1111/raq.12594
14. Klose CS and Artis D. Innate lymphoid cells as regulators of immunity, inflammation and tissue homeostasis. Nat Immunol. (2016) 17:765–74. doi: 10.1038/ni.3489
15. Siracusa MC, Comeau MR, and Artis D. New insights into basophil biology: initiators, regulators, and effectors of type 2 inflammation. Ann N Y Acad Sci. (2011) 1217:166–77. doi: 10.1111/j.1749-6632.2010.05918.x
16. Inclan-Rico JM and Siracusa MC. First responders: innate immunity to helminths. Trends Parasitol. (2018) 34:861–80. doi: 10.1016/j.pt.2018.08.007
17. Dezfuli BS, Giari L, Squerzanti S, Lui A, Lorenzoni M, Sakalli S, et al. Histological damage and inflammatory response elicited by Monobothrium wageneri (Cestoda) in the intestine of Tinca tinca (Cyprinidae). Parasit Vectors. (2011) 4:225. doi: 10.1186/1756-3305-4-225
18. Sfacteria A, Brines M, and Blank U. The mast cell plays a central role in the immune system of teleost fish. Mol Immunol. (2015) 63:3–8. doi: 10.1016/j.molimm.2014.02.007
19. Dezfuli BS, Giari L, Lui A, Lorenzoni M, and Noga EJ. Mast cell responses to Ergasilus (Copepoda), a gill ectoparasite of sea bream. Fish Shellfish Immunol. (2011) 30:1087–94. doi: 10.1016/j.fsi.2011.02.005
20. Reite OB and Evensen O. Inflammatory cells of teleostean fish: a review focusing on mast cells/eosinophilic granule cells and rodlet cells. Fish Shellfish Immunol. (2006) 20:192–208. doi: 10.1016/j.fsi.2005.01.012
21. Ni LY, Chen HP, Han R, Luo XC, Li AX, Li JZ, et al. Distribution of Mpeg1(+) cells in healthy grouper (Epinephelus coioides) and after Cryptocaryon irritans infection. Fish Shellfish Immunol. (2020) 104:222–7. doi: 10.1016/j.fsi.2020.06.018
22. Wang HQ, Zhou L, Yang M, Luo XC, Li YW, and Dan XM. Identification and characterization of myeloperoxidase in orange-spotted grouper (Epinephelus coioides). Fish Shellfish Immunol. (2018) 72:230–6. doi: 10.1016/j.fsi.2017.10.063
23. Ding Y, Zhang Y, Shen Y, Zhang Y, Li Z, Shi Y, et al. Aggregation and proliferation of B cells and T cells in MALTs upon Cryptocaryon irritans infection in large yellow croaker Larimichthys crocea. Fish Shellfish Immunol. (2024) 149:109535. doi: 10.1016/j.fsi.2024.109535
24. Dobson JT, Seibert J, Teh EM, Da’as S, Fraser RB, Paw BH, et al. Carboxypeptidase A5 identifies a novel mast cell lineage in the zebrafish providing new insight into mast cell fate determination. Blood. (2008) 112:2969–72. doi: 10.1182/blood-2008-03-145011
25. Sun L, Su Y, Jiao A, Wang X, and Zhang B. T cells in health and disease. Signal Transduct Target Ther. (2023) 8:235. doi: 10.1038/s41392-023-01471-y
26. Pellicci DG, Koay HF, and Berzins SP. Thymic development of unconventional T cells: how NKT cells, MAIT cells and gammadelta T cells emerge. Nat Rev Immunol. (2020) 20:756–70. doi: 10.1038/s41577-020-0345-y
27. Wu Z, Zheng Y, Sheng J, Han Y, Yang Y, Pan H, et al. CD3(+)CD4(-)CD8(-) (Double-negative) T cells in inflammation, immune disorders and cancer. Front Immunol. (2022) 13:816005. doi: 10.3389/fimmu.2022.816005
28. Yang L, Zhu Y, Tian D, Wang S, Guo J, Sun G, et al. Transcriptome landscape of double negative T cells by single-cell RNA sequencing. J Autoimmun. (2021) 121:102653. doi: 10.1016/j.jaut.2021.102653
29. Martina MN, Noel S, Saxena A, Bandapalle S, Majithia R, Jie C, et al. Double-negative alphabeta T cells are early responders to AKI and are found in human kidney. J Am Soc Nephrol. (2016) 27:1113–23. doi: 10.1681/ASN.2014121214
30. Rao A, Agrawal A, Borthakur G, Battula VL, and Maiti A. Gamma delta T cells in acute myeloid leukemia: biology and emerging therapeutic strategies. J Immunother Cancer. (2024) 12:e007981. doi: 10.1136/jitc-2023-007981
31. Hoyler T, Klose CS, Souabni A, Turqueti-Neves A, Pfeifer D, Rawlins EL, et al. The transcription factor GATA-3 controls cell fate and maintenance of type 2 innate lymphoid cells. Immunity. (2012) 37:634–48. doi: 10.1016/j.immuni.2012.06.020
32. Miller MM, Patel PS, Bao K, Danhorn T, O’Connor BP, and Reinhardt RL. BATF acts as an essential regulator of IL-25-responsive migratory ILC2 cell fate and function. Sci Immunol. (2020) 5:eaay3994. doi: 10.1126/sciimmunol.aay3994
33. Spits H and Mjosberg J. Heterogeneity of type 2 innate lymphoid cells. Nat Rev Immunol. (2022) 22:701–12. doi: 10.1038/s41577-022-00704-5
34. Petrova T, Pesic J, Pardali K, Gaestel M, and Arthur JSC. p38 MAPK signalling regulates cytokine production in IL-33 stimulated Type 2 Innate Lymphoid cells. Sci Rep. (2020) 10:3479. doi: 10.1038/s41598-020-60089-0
35. Griesenauer B and Paczesny S. The ST2/IL-33 axis in immune cells during inflammatory diseases. Front Immunol. (2017) 8:475. doi: 10.3389/fimmu.2017.00475
36. Thio CL and Chang YJ. The modulation of pulmonary group 2 innate lymphoid cell function in asthma: from inflammatory mediators to environmental and metabolic factors. Exp Mol Med. (2023) 55:1872–84. doi: 10.1038/s12276-023-01021-0
37. Nutt SL and Chopin M. Transcriptional networks driving dendritic cell differentiation and function. Immunity. (2020) 52:942–56. doi: 10.1016/j.immuni.2020.05.005
38. Bao M and Liu YJ. Regulation of TLR7/9 signaling in plasmacytoid dendritic cells. Protein Cell. (2013) 4:40–52. doi: 10.1007/s13238-012-2104-8
39. Hu CB, Wang J, Hong Y, Li H, Fan DD, Lin AF, et al. Single-cell transcriptome profiling reveals diverse immune cell populations and their responses to viral infection in the spleen of zebrafish. FASEB J. (2023) 37:e22951. doi: 10.1096/fj.202201505RRRR
40. Nutt SL, Hodgkin PD, Tarlinton DM, and Corcoran LM. The generation of antibody-secreting plasma cells. Nat Rev Immunol. (2015) 15:160–71. doi: 10.1038/nri3795
41. Tamada K, Shimozaki K, Chapoval AI, Zhai Y, Su J, Chen SF, et al. LIGHT, a TNF-like molecule, costimulates T cell proliferation and is required for dendritic cell-mediated allogeneic T cell response. J Immunol. (2000) 164:4105–10. doi: 10.4049/jimmunol.164.8.4105
42. Yan Y, Chen R, Wang X, Hu K, Huang L, Lu M, et al. CCL19 and CCR7 expression, signaling pathways, and adjuvant functions in viral infection and prevention. Front Cell Dev Biol. (2019) 7:212. doi: 10.3389/fcell.2019.00212
43. Liyanage DS, Omeka WKM, Yang H, Godahewa GI, Kwon H, Nam BH, et al. Identification of thioredoxin domain-containing protein 17 from big-belly seahorse Hippocampus abdominalis: Molecular insights, immune responses, and functional characterization. Fish Shellfish Immunol. (2019) 86:301–10. doi: 10.1016/j.fsi.2018.11.040
44. Cosgrove J, Novkovic M, Albrecht S, Pikor NB, Zhou Z, Onder L, et al. B cell zone reticular cell microenvironments shape CXCL13 gradient formation. Nat Commun. (2020) 11:3677. doi: 10.1038/s41467-020-17135-2
45. Resseguier J, Nguyen-Chi M, Wohlmann J, Rigaudeau D, Salinas I, Oehlers SH, et al. Identification of a pharyngeal mucosal lymphoid organ in zebrafish and other teleosts: Tonsils in fish? Sci Adv. (2023) 9:eadj0101. doi: 10.1126/sciadv.adj0101
46. Dalum AS, Kraus A, Khan S, Davydova E, Rigaudeau D, Bjorgen H, et al. High-resolution, 3D imaging of the zebrafish gill-associated lymphoid tissue (GIALT) reveals a novel lymphoid structure, the amphibranchial lymphoid tissue. Front Immunol. (2021) 12:769901. doi: 10.3389/fimmu.2021.769901
47. Tubo NJ and Jenkins MK. CD4+ T Cells: guardians of the phagosome. Clin Microbiol Rev. (2014) 27:200–13. doi: 10.1128/CMR.00097-13
48. Ai K, Li K, Jiao X, Zhang Y, Li J, Zhang Q, et al. IL-2-mTORC1 signaling coordinates the STAT1/T-bet axis to ensure Th1 cell differentiation and anti-bacterial immune response in fish. PLoS Pathog. (2022) 18:e1010913. doi: 10.1371/journal.ppat.1010913
49. Obeng-Adjei N, Portugal S, Tran TM, Yazew TB, Skinner J, Li S, et al. Circulating th1-cell-type tfh cells that exhibit impaired B cell help are preferentially activated during acute malaria in children. Cell Rep. (2015) 13:425–39. doi: 10.1016/j.celrep.2015.09.004
50. Zaiss DMW, Pearce EJ, Artis D, McKenzie ANJ, and Klose CSN. Cooperation of ILC2s and T(H)2 cells in the expulsion of intestinal helminth parasites. Nat Rev Immunol. (2024) 24:294–302. doi: 10.1038/s41577-023-00942-1
51. Grainger JR, Smith KA, Hewitson JP, McSorley HJ, Harcus Y, Filbey KJ, et al. Helminth secretions induce de novo T cell Foxp3 expression and regulatory function through the TGF-beta pathway. J Exp Med. (2010) 207:2331–41. doi: 10.1084/jem.20101074
52. Sawant DV, Gravano DM, Vogel P, Giacomin P, Artis D, and Vignali DA. Regulatory T cells limit induction of protective immunity and promote immune pathology following intestinal helminth infection. J Immunol. (2014) 192:2904–12. doi: 10.4049/jimmunol.1202502
53. Blankenhaus B, Klemm U, Eschbach ML, Sparwasser T, Huehn J, Kuhl AA, et al. Strongyloides ratti infection induces expansion of Foxp3+ regulatory T cells that interfere with immune response and parasite clearance in BALB/c mice. J Immunol. (2011) 186:4295–305. doi: 10.4049/jimmunol.1001920
54. Sukeda M, Shiota K, Kondo M, Nagasawa T, Nakao M, and Somamoto T. Innate cell-mediated cytotoxicity of CD8(+) T cells against the protozoan parasite Ichthyophthirius multifiliis in the ginbuna crucian carp, Carassius auratus langsdorfii. Dev Comp Immunol. (2021) 115:103886. doi: 10.1016/j.dci.2020.103886
55. Lama R, Pereiro P, Costa MM, Encinar JA, Medina-Gali RM, Perez L, et al. Turbot (Scophthalmus maximus) Nk-lysin induces protection against the pathogenic parasite Philasterides dicentrarchi via membrane disruption. Fish Shellfish Immunol. (2018) 82:190–9. doi: 10.1016/j.fsi.2018.08.004
56. Cowley SC, Meierovics AI, Frelinger JA, Iwakura Y, and Elkins KL. Lung CD4-CD8- double-negative T cells are prominent producers of IL-17A and IFN-gamma during primary respiratory murine infection with Francisella tularensis live vaccine strain. J Immunol. (2010) 184:5791–801. doi: 10.4049/jimmunol.1000362
57. Li Z, Yang Q, Tang X, Chen Y, Wang S, Qi X, et al. Single-cell RNA-seq and chromatin accessibility profiling decipher the heterogeneity of mouse gammadelta T cells. Sci Bull (Beijing). (2022) 67:408–26. doi: 10.1016/j.scib.2021.11.013
58. Sanchez Sanchez G, Papadopoulou M, Azouz A, Tafesse Y, Mishra A, Chan JKY, et al. Identification of distinct functional thymic programming of fetal and pediatric human gammadelta thymocytes via single-cell analysis. Nat Commun. (2022) 13:5842. doi: 10.1038/s41467-022-33488-2
59. Ullrich L, Lueder Y, Juergens AL, Wilharm A, Barros-Martins J, Bubke A, et al. IL-4-producing vgamma1(+)/vdelta6(+) gammadelta T cells sustain germinal center reactions in peyer’s patches of mice. Front Immunol. (2021) 12:729607. doi: 10.3389/fimmu.2021.729607
60. Wan F, Hu CB, Ma JX, Gao K, Xiang LX, and Shao JZ. Characterization of gammadelta T Cells from Zebrafish Provides Insights into Their Important Role in Adaptive Humoral Immunity. Front Immunol. (2016) 7:675. doi: 10.3389/fimmu.2016.00675
61. Ebihara T and Taniuchi I. Transcription factors in the development and function of group 2 innate lymphoid cells. Int J Mol Sci. (2019) 20:1377. doi: 10.3390/ijms20061377
62. Henry EK, Inclan-Rico JM, and Siracusa MC. Type 2 cytokine responses: regulating immunity to helminth parasites and allergic inflammation. Curr Pharmacol Rep. (2017) 3:346–59. doi: 10.1007/s40495-017-0114-1
63. Klein Wolterink RG, Kleinjan A, van Nimwegen M, Bergen I, de Bruijn M, Levani Y, et al. Pulmonary innate lymphoid cells are major producers of IL-5 and IL-13 in murine models of allergic asthma. Eur J Immunol. (2012) 42:1106–16. doi: 10.1002/eji.201142018
64. Kabata H, Moro K, and Koyasu S. The group 2 innate lymphoid cell (ILC2) regulatory network and its underlying mechanisms. Immunol Rev. (2018) 286:37–52. doi: 10.1111/imr.12706
65. Pelly VS, Kannan Y, Coomes SM, Entwistle LJ, Ruckerl D, Seddon B, et al. IL-4-producing ILC2s are required for the differentiation of T(H)2 cells following Heligmosomoides polygyrus infection. Mucosal Immunol. (2016) 9:1407–17. doi: 10.1038/mi.2016.4
66. Leonard WJ and Wan CK. IL-21 signaling in immunity. F1000Res. (2016) 5:F1000Faculty Rev-224. doi: 10.12688/f1000research.7634.1
67. Li J, Barreda DR, Zhang YA, Boshra H, Gelman AE, Lapatra S, et al. B lymphocytes from early vertebrates have potent phagocytic and microbicidal abilities. Nat Immunol. (2006) 7:1116–24. doi: 10.1038/ni1389
68. Wu L, Kong L, Yang Y, Bian X, Wu S, Li B, et al. Effects of cell differentiation on the phagocytic activities of igM(+) B cells in a teleost fish. Front Immunol. (2019) 10:2225. doi: 10.3389/fimmu.2019.02225
69. Ghani MU, Chen J, Khosravi Z, Wu Q, Liu Y, Zhou J, et al. Unveiling the multifaceted role of toll-like receptors in immunity of aquatic animals: pioneering strategies for disease management. Front Immunol. (2024) 15:1378111. doi: 10.3389/fimmu.2024.1378111
Keywords: gill immunity, Larimichthys crocea, single-cell transcriptomics, Cryptocaryon irritans, immune cell heterogeneity
Citation: Li Q, Wang M, Li C, Tran NT, Ao J, Li S and Chen X (2025) Single-cell transcriptomics unveils leukocyte heterogeneity in the gills of Larimichthys crocea in response to parasitic infection. Front. Immunol. 16:1633701. doi: 10.3389/fimmu.2025.1633701
Received: 23 May 2025; Accepted: 18 July 2025;
Published: 01 August 2025.
Edited by:
Zhen Xu, Chinese Academy of Sciences (CAS), ChinaReviewed by:
Doaa M. Mokhtar, Assiut University, EgyptMuhammad Usman Ghani, Southwest University, China
Copyright © 2025 Li, Wang, Li, Tran, Ao, Li and Chen. This is an open-access article distributed under the terms of the Creative Commons Attribution License (CC BY). The use, distribution or reproduction in other forums is permitted, provided the original author(s) and the copyright owner(s) are credited and that the original publication in this journal is cited, in accordance with accepted academic practice. No use, distribution or reproduction is permitted which does not comply with these terms.
*Correspondence: Shengkang Li, bGlza0BzdHUuZWR1LmNu; Xinhua Chen, Y2hlbnhpbmh1YUB0aW8ub3JnLmNu