 Duy T. Nguyen1*†
 Matthew A. Schaller2Krista P. Terracina3Xia Xu4Diego I. Pedro1†Alfonso Pepe1†Juan M. Urueña1Zadia Dupee2
 Nickolas Diodati2Ryan A. Smolchek1†Jack E. Famiglietti1Nhi Tran Yen Nguyen1Gerik W. Tushoski-Alemán3
 Kuoyuan Cheng4Lan Chen4Doug Linn4Vania Vidimar4Aquila Fatima4Soon Woo Kwon4
 Dongyu Sun4Hongmin Chen4Haiyan Xu4Brian Long4Lily Y. Moy4
 Bonnie J. Howell4George H. Addona5W. Gregory Sawyer1†
- 1Department of Mechanical and Aerospace Engineering, University of Florida, Gainesville, FL, United States
- 2Division of Pulmonary, Critical Care, and Sleep Medicine, University of Florida, Gainesville, FL, United States
- 3Department of Surgery, College of Medicine, University of Florida, Gainesville, FL, United States
- 4Department of Quantitative Biosciences, Merck & Co., Inc., Rahway, NJ, United States
- 5MRL, Discovery, Preclinical and Translational Medicine, Merck & Co., Inc., Rahway, NJ, United States
Immune checkpoint inhibitors have made remarkable impacts in treating various cancers, including colorectal cancer (CRC). However, CRC still remains a leading cause of cancer-related deaths. While microsatellite instability (MSI) CRC has shown positive responses to anti-PD-1 therapy, this subgroup represents a minority of all CRC patients. Extensive research has focused on identifying predictive biomarkers to understand treatment response in CRC. Interestingly, a growing number of clinical cases have reported favorable outcomes from a subtype of supposedly non-responder microsatellite stable (MSS) CRC, characterized by DNA polymerase ϵ (POLE) proofreading domain mutations with high tumor mutational burden (TMB). This subtype has shown a notable response, either partial or complete, to pembrolizumab as salvage treatment, often following significant disease progression. To improve efficiency, cost-effectiveness, and clinical outcomes, there is an essential need for a testing platform capable of promptly identifying evidence of anti-PD-1 response to inform treatment strategies. Here, we established a novel 3D ex vivo immunotherapy model using patient-derived tumor microexplants (or microtumors <1 mm) co-cultured with autologous peripheral blood mononuclear cells (PBMCs) from treatment-naïve CRC patients. We demonstrate that long-term ex vivo treatment with pembrolizumab induced a heterogeneous but appreciable interferon-gamma (IFN-γ) secretion, accompanied by infiltrating PBMCs. Intriguingly, a case study involving an MSS CRC phenotype harboring POLE mutation and associated ultrahigh TMB demonstrated a response to PD-1 blockade, potentially from the intratumoral immune cell population. Ultimately, this novel model could serve as a valuable tool in complementing clinical diagnostics and guiding personalized treatment plans for CRC patients, particularly those with specific phenotypes and mutational profiles.
1 Introduction
The initial success of programmed cell death 1 (PD-1) blockade in advanced colorectal cancer (CRC) patients was primarily demonstrated in patients with DNA mismatch repair deficiency, leading to FDA approval in 2017 for the treatment of unresectable or metastatic microsatellite instability-high (MSI-H) solid tumors in both adult and pediatric patients (1, 2). This marked the first time that the FDA approved a cancer treatment based on a biomarker instead of the primary site of origin. Despite these advancements, CRC remains one of the deadliest cancers worldwide, and a substantial number of patients are still ineligible for or do not benefit from anti-PD-1 therapy.
The significantly elevated tumor mutation burden (TMB) (≥10 mutations per megabase), observed in MSI CRC and across various cancer types is linked to a favorable response to immune checkpoint inhibitor therapy (3–5). This contributes to an enhanced prognosis for MSI CRC patients compared to those with microsatellite-stable (MSS) phenotypes (3, 6, 7). However, response to anti-PD-1 remains variable, even among MSI CRC patients (8). In a clinical study conducted in 2017, the objective response rate for anti-PD-1 treatment in advanced MSI cancers was found to be 53%, with 21% of patients achieving complete remission (2). Furthermore, the presence of intratumor and interpatient heterogeneity (9, 10), contributes to therapeutic resistance, even within well-defined responsive phenotypes (8). This underscores the important role of personalized medicine in optimizing treatment approaches (11).
MSS CRC is generally considered a non-responder phenotype to anti-PD-1 and represents the majority of CRC patients. Extensive research has been focused on identifying predictive biomarkers that can help determine the efficacy of checkpoint inhibitors, either as monotherapy or in combination with other therapeutic modalities for the treatment of MSS CRC. Recent studies have highlighted the significance of germline and somatic mutations in the DNA polymerase ϵ (POLE), particularly within the exonuclease (proofreading) domain codons 268-471, in contributing to high TMB. These mutations may serve as potential indicators of response to immune checkpoint inhibitor therapy (12). Mutations within the exonuclease domain of the POLE gene disrupt its proofreading function, resulting in subsequent hypermutation (13), which positively correlates to neoantigen burden and response to immunotherapy (14). Furthermore, clinical case studies have reported favorable responses to PD-1 blockade in MSS CRC patients carrying POLE mutations and exhibiting high TMB (Table 1) (15–18). Since these patients were diagnosed with MSS CRC phenotype, immunotherapy was an unconventional choice. Anti-PD-1 was only used as a salvage treatment after patients underwent multiple cycles of standard chemotherapy without improvement of disease progression, which generally causes extreme fatigue. Despite the promising outcomes from these cases, somatic mutation of the POLE exonuclease domain is rare in CRC (< 3%) and not all POLE mutations are associated with response to immune checkpoint therapy (19). In fact, the pathogenicity of the majority of POLE mutations, whether inside or outside the exonuclease domain, remains unknown (12). This highlights the necessity for a model to promptly detect evidence of response to anti-PD-1 therapy, especially in CRC patients exhibiting POLE-driven hypermutation, who may benefit from immunotherapy.
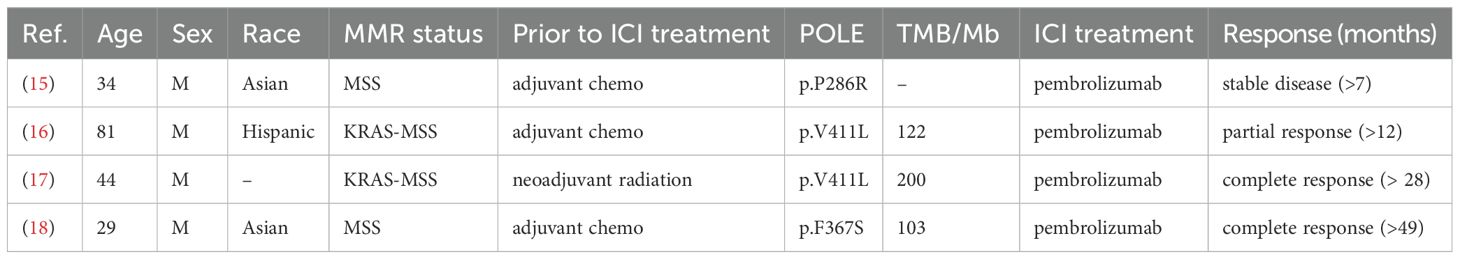
Table 1. Clinical response to ICI treatment in MSS colorectal cancers with POLE mutations.
Animal models have played a crucial role in advancing oncology research; however, relying solely on in vivo models has limitations, including genetic variations, resource-intensive requirements, time constraints, and differences in immune system responses. Complementary to in vivo studies, advanced ex vivo models have leveraged cutting-edge biotechnological techniques, providing a platform for a more profound mechanistic understanding of cancer development and progression. Integrating both in vivo and ex vivo approaches allows researchers to gain a comprehensive understanding of cancer biology and therapeutic responses.
Amongst 3D cell models, patient-derived explant is arguably the most representative model of human disease, providing a personalized and individual-specific representation. The ex vivo model inherently preserves the intact tissue extracellular matrix (ECM) along with a heterogeneous assembly of cellular components exhibiting diverse phenotypes and genotypes, each with distinct, context-dependent functions (20, 21). This intricate composition closely mirrors the original tumors (21–23). Despite the challenges in maintaining tissue explants ex vivo, recent advancements in biotechnology (22, 24–27), have revitalized this model, positioning it as a valuable preclinical tool for both basic and translational research. In previous work, we demonstrated the successful 3D long-term culture of mouse colorectal microexplants (24). The use of perfusion media, along with the removal of metabolic waste, enabled the preservation of cell viability, tissue architecture, and peristaltic-like activity in mouse gut microexplants (24). In another study, we characterized T cell locomotion within our 3D bioconjugated liquid-like solid microgel platform, designed to mimic the physical barrier of the solid tumor microenvironment (28). This enables a more comprehensive understanding of cancer-immune interactions (28).
Here, we developed an ex vivo model of patient-derived tumor microexplants, namely microtumors co-cultured with autologous peripheral blood mononuclear cells (PBMCs) to screen for evidence of early response to anti-PD-1 treatment (Figure 1). The CRC microtumors cultured in our custom-built perfusion platform (24), maintained cell viability and tissue heterogeneity with the presence of endogenous immune populations. Perfusion of pembrolizumab (anti-PD-1) through the co-culture for 7 days elicited IFNγ production and evidence of immune infiltration in responder cases (Figures 2, 3). Notably, we conducted a case study ex vivo involving MSS metastatic CRC harboring the POLE A456P exonuclease mutation, along with five additional mutations of unknown significance on the POLE gene (Figure 3). This case exhibited extremely high TMB through whole-exome sequencing (WES). Treatment with anti-PD-1 resulted in a response with IFNγ production. Interestingly, a similar study on MSI CRC with three POLE mutations of unknown significance did not elicit an appreciable response. Our ex vivo model suggests that CRC patients with POLE mutations and high TMB may benefit from immune checkpoint therapy. Our results demonstrated the development of a novel patient-based ex vivo model for immune checkpoint inhibitor therapeutic drug screens, aiding the development of personalized treatment plans.
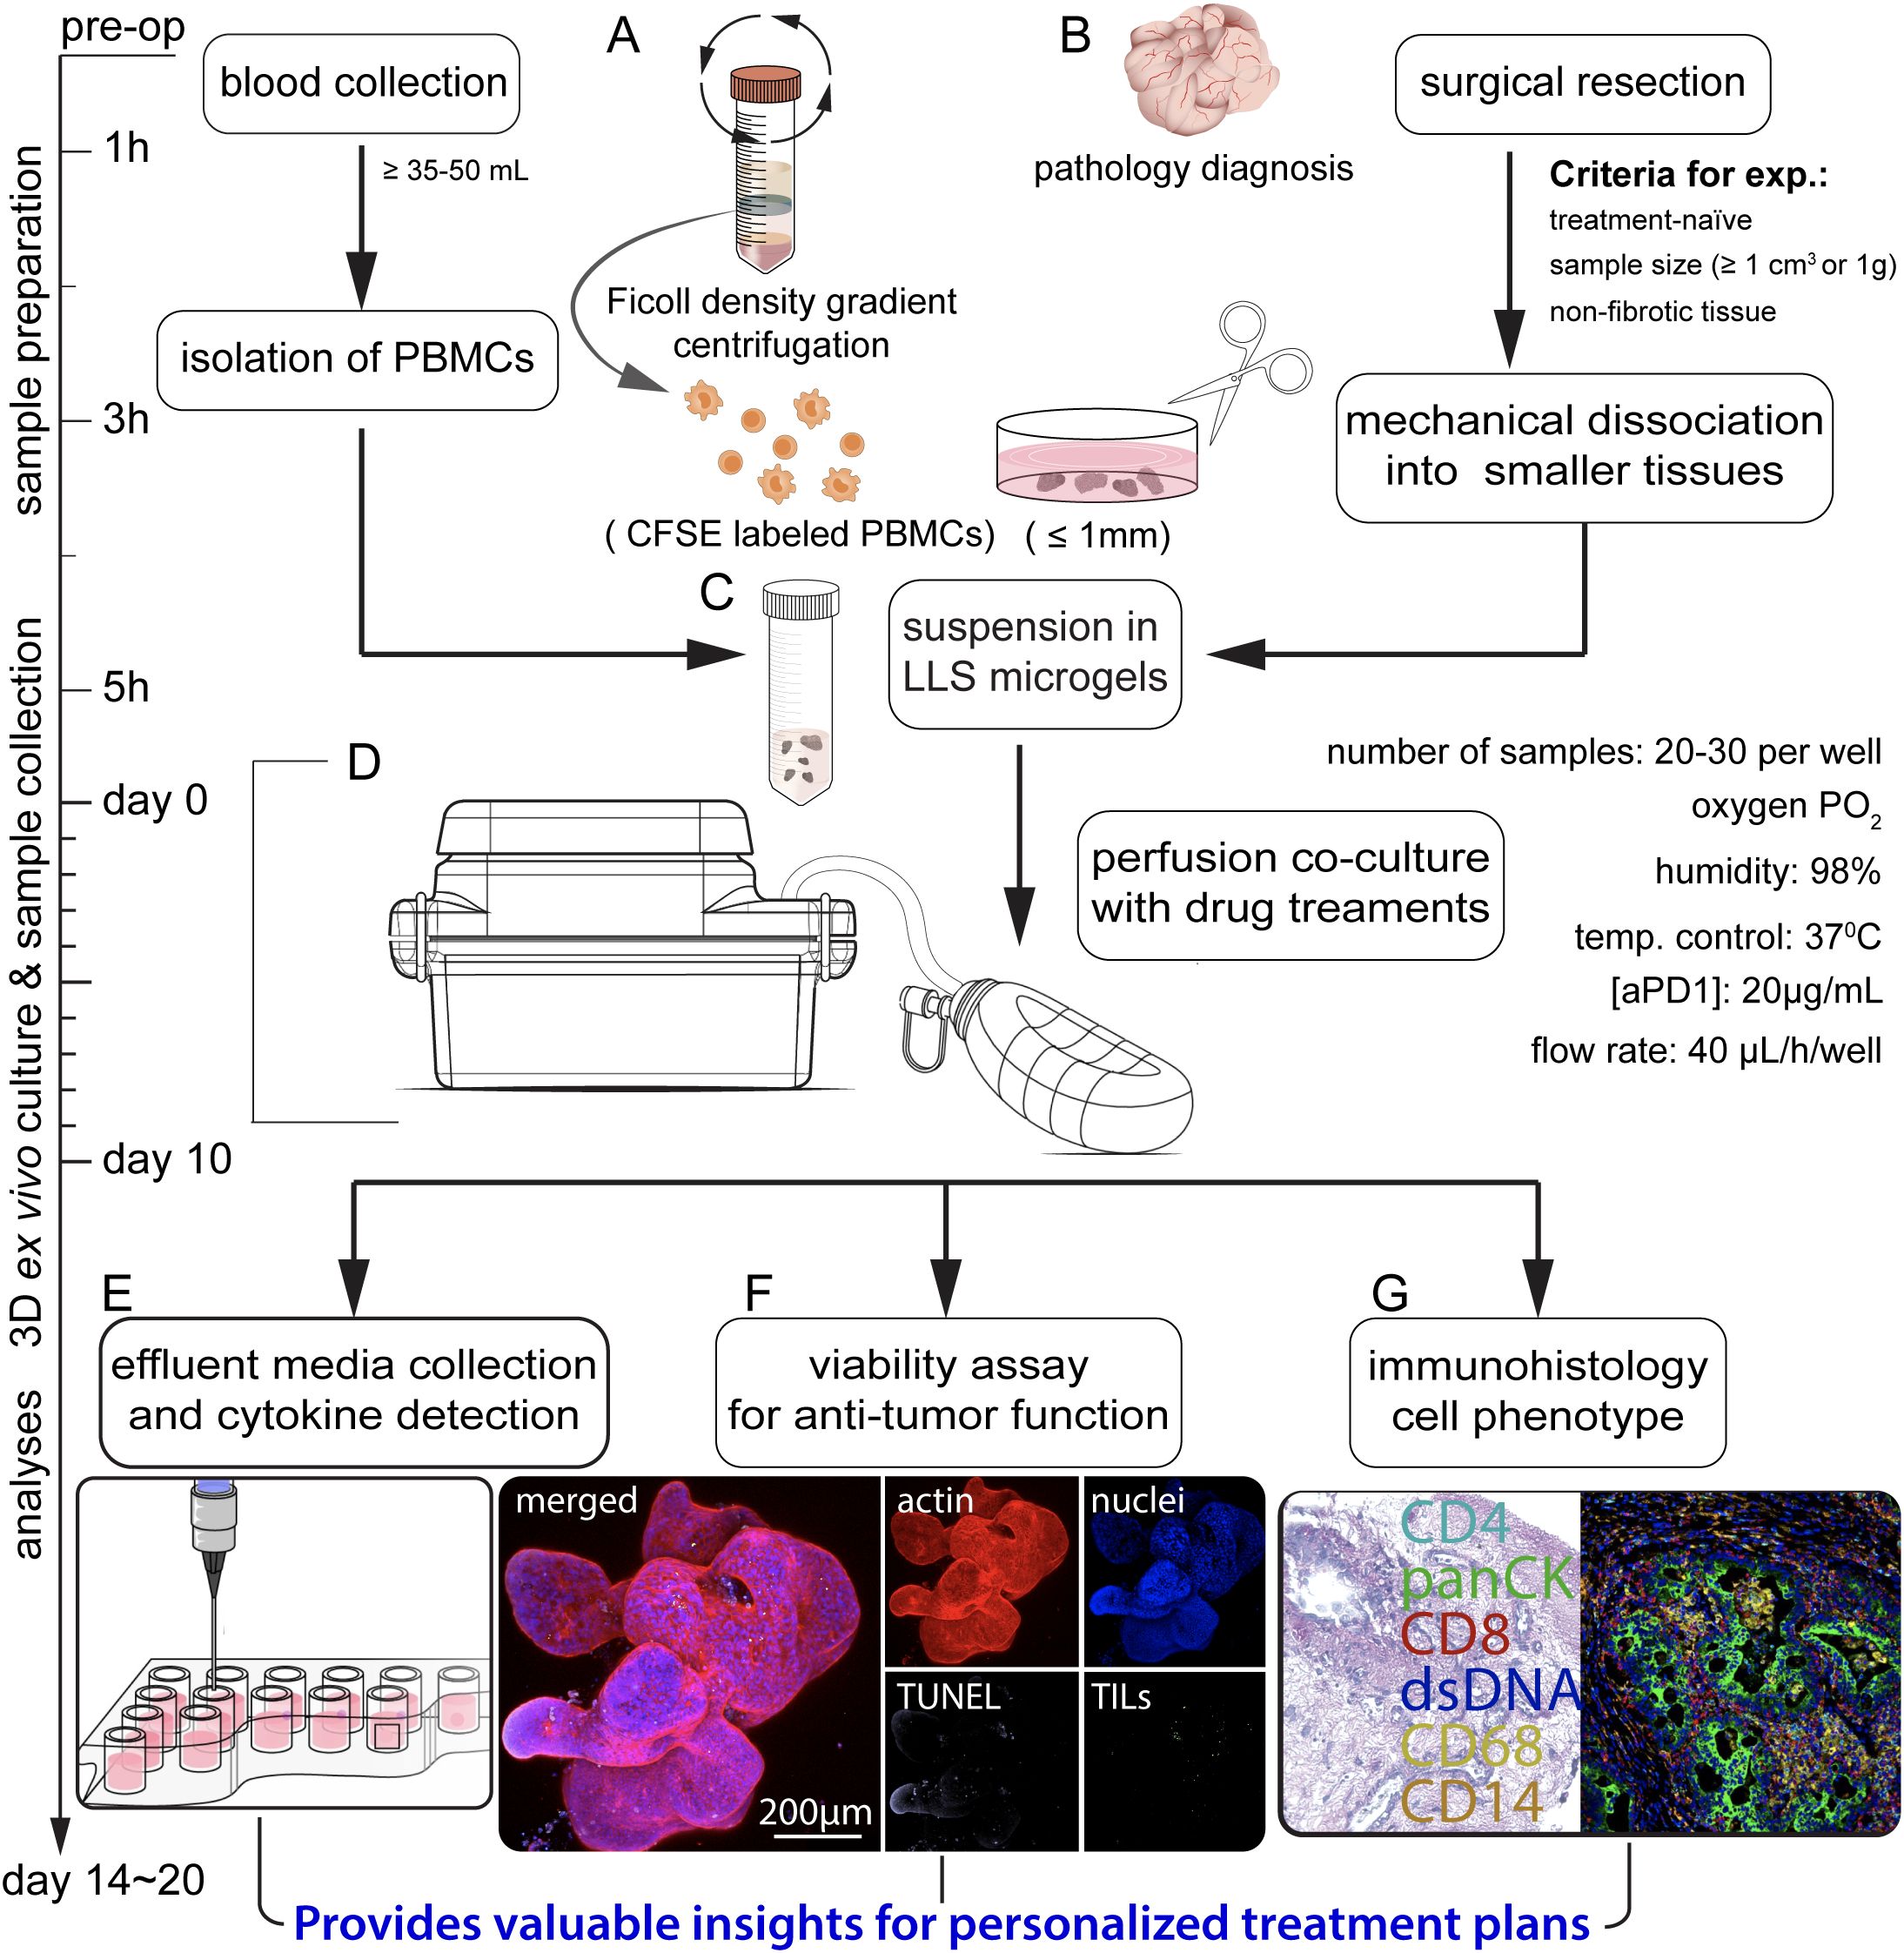
Figure 1. Schematic illustrating the sequential steps in the co-culture of patient-derived microtumors and autologous PBMCs for anti-PD-1 (aPD1) treatment. (A) Isolation of PBMCs from whole blood through Ficoll density gradient centrifugation, prelabeling with CFSE. (B) Surgical removal and collection of tumor specimens for pathology diagnoses, followed by mechanical dissection into tumor microexplants (namely microtumors; approximately ≤ 1 mm). (C) Uniform suspension of PBMCs and microtumors in LLS microgels. (D) Co-culture in a perfusion platform under varied treatment conditions. Assessment of immune response involves (E) analyzing effluent media for cytokine production, (F) evaluating immune infiltration and anti-tumor function, and (G) performing immunohistology.
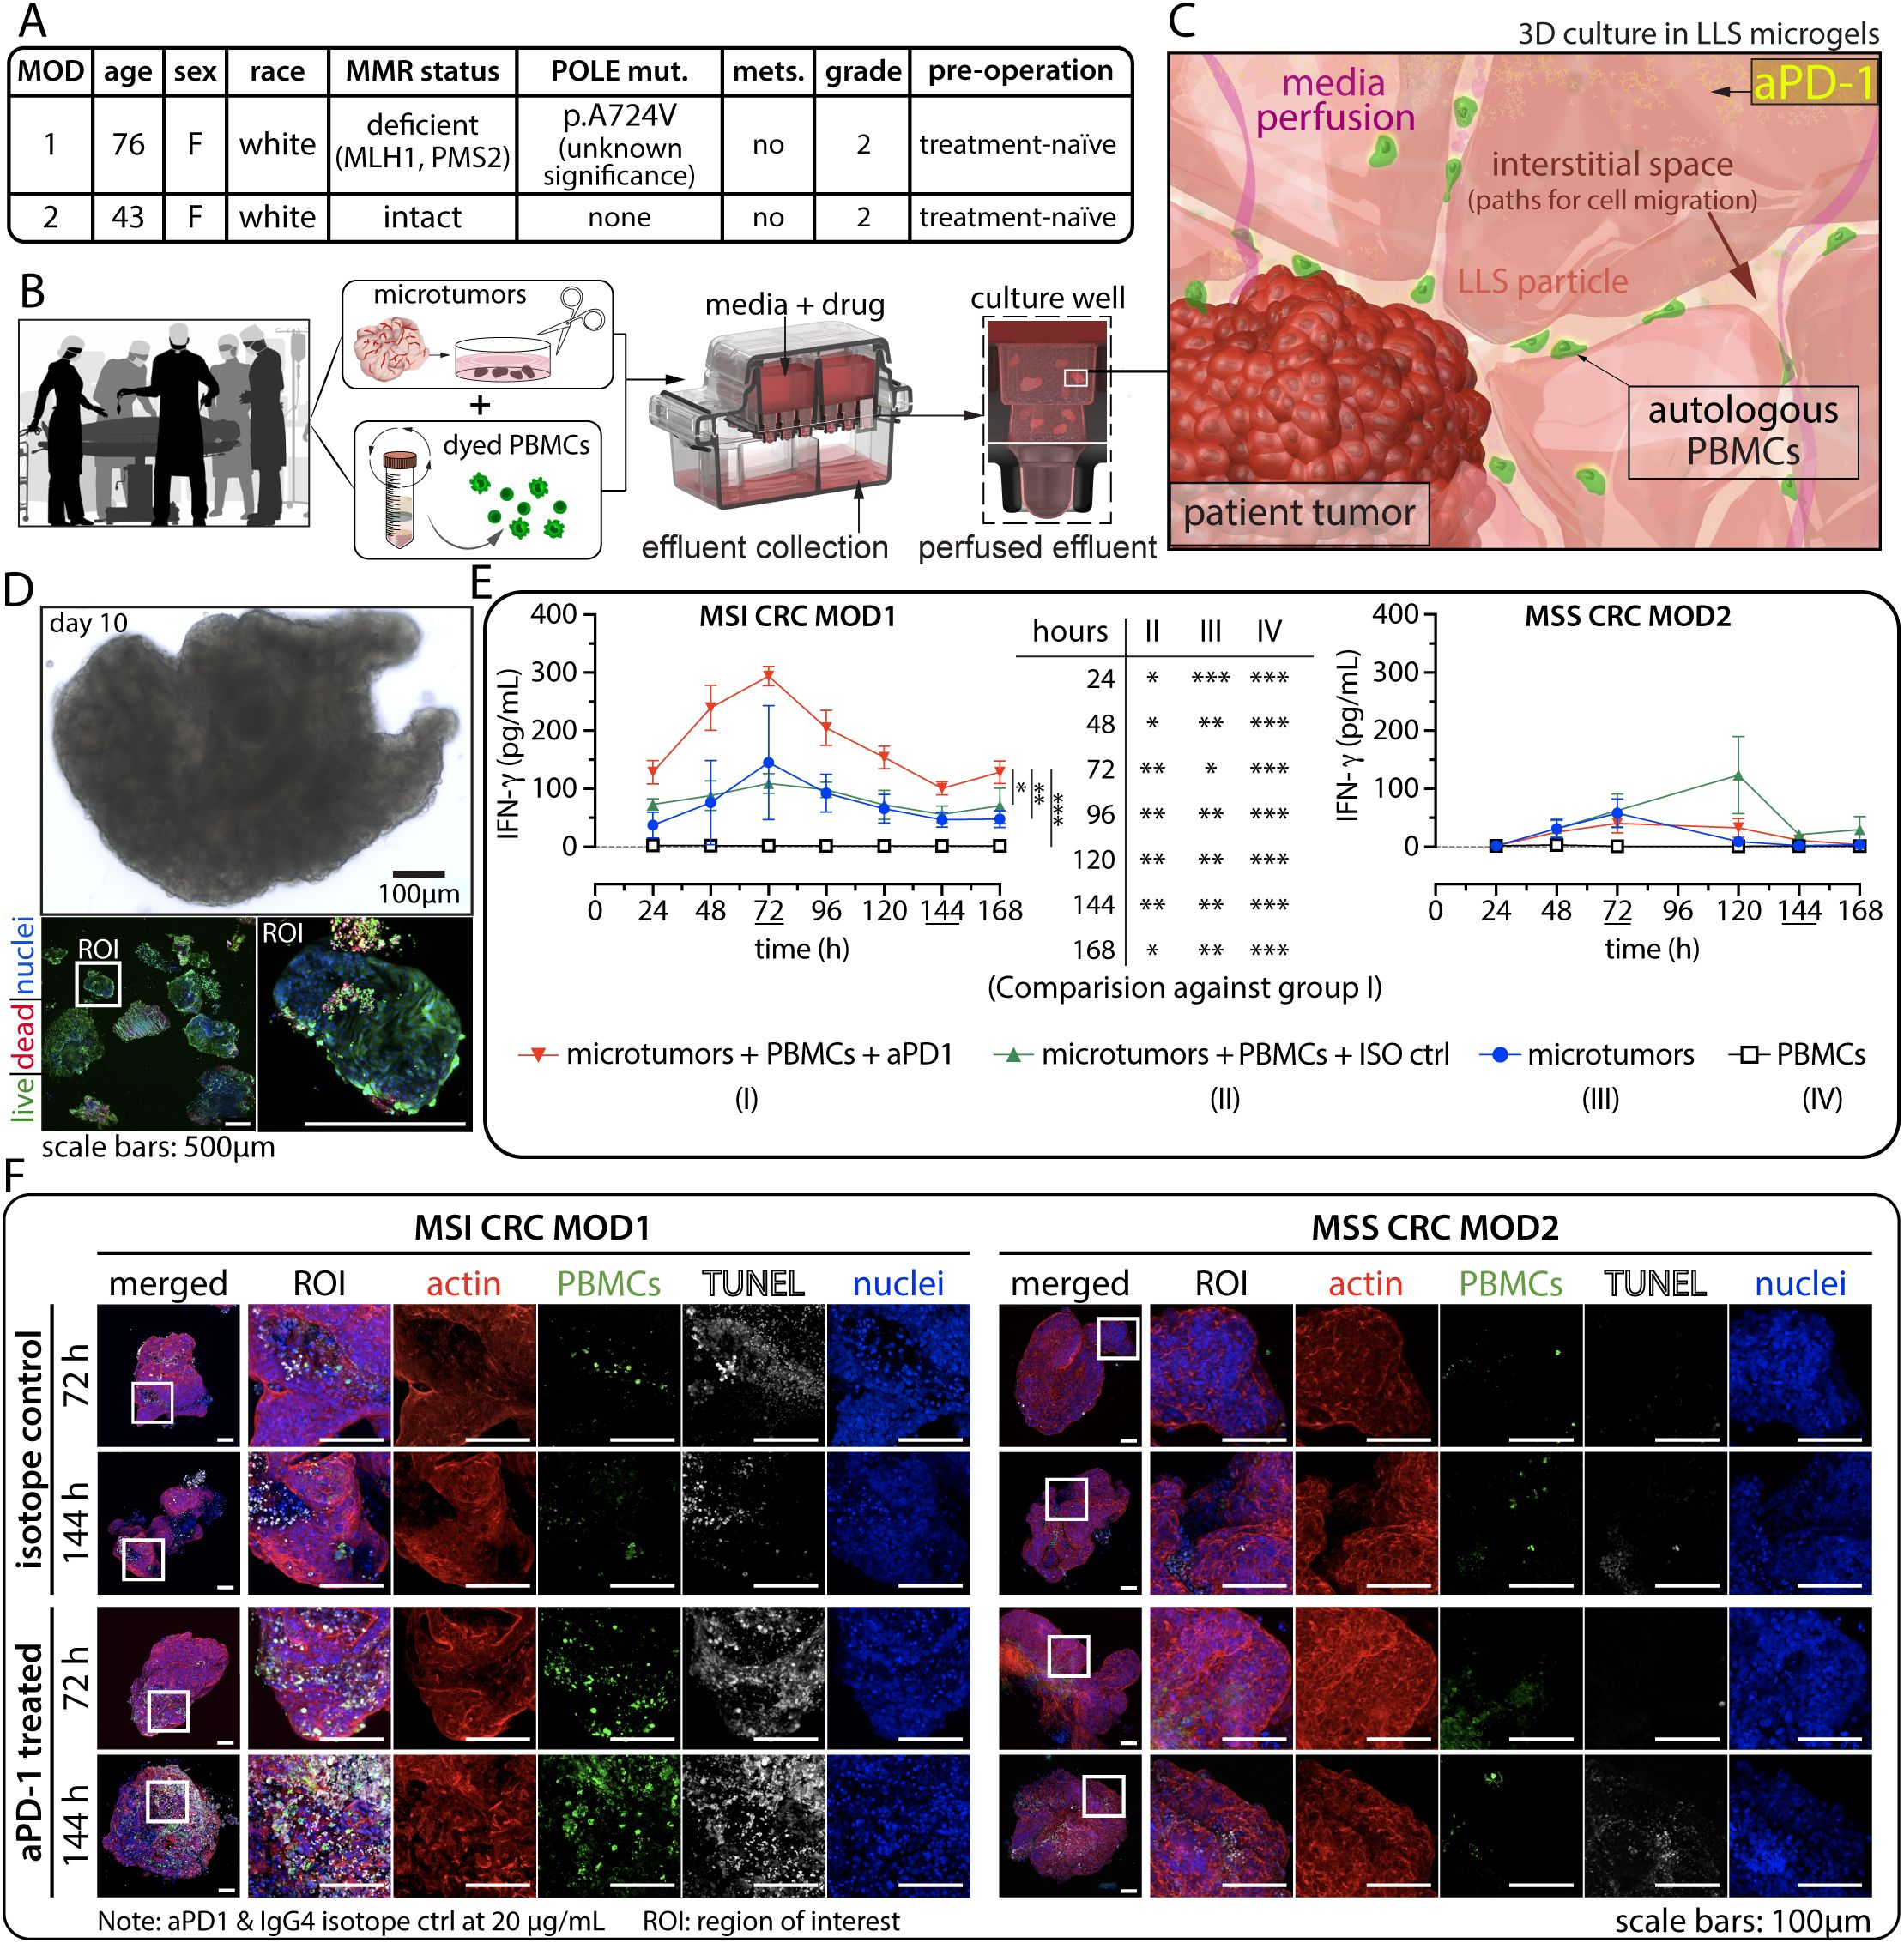
Figure 2. Evaluation of anti-PD-1 (aPD1) in patient-derived ex vivo models. (A) Patient-specific MMR status and other relevant information. (B) Schematic representation of the experimental workflow from blood draw and surgical resection to ex vivo co-culture of patient-derived microtumors and autologous PBMCs. (C) Illustration depicting the dynamic interaction between microtumors and immune cells within the 3D environment. (D) Typical tissue morphology (bright field) and immunofluorescence (IF) viability data using Calcein AM (live, green) and BOBO-3 Iodide (dead, red) after long-term ex vivo culture. (E) Detection of interferon-gamma (IFNγ) secretion from perfused media collected every 24 hours for 7 days in the 3D tumor-immune cells co-culture for MSI (left) and MSS (right) CRC cases. Statistical significance was shown for MOD1 only. There is no statistical significance for MOD2. Statistical analysis was performed using a two-way ANOVA followed by Tukey’s HSD post-hoc test for IFNγ level between the treatment groups at each time point. (technical replicates n=3 unless indicated otherwise, *p<0.05, **p<0.01, ***p<0.001). (F) TUNEL assay was employed to detect apoptotic cells, where the presence of CFSE+ immune infiltration correlates with regions of cell death. ROI: region of interest.
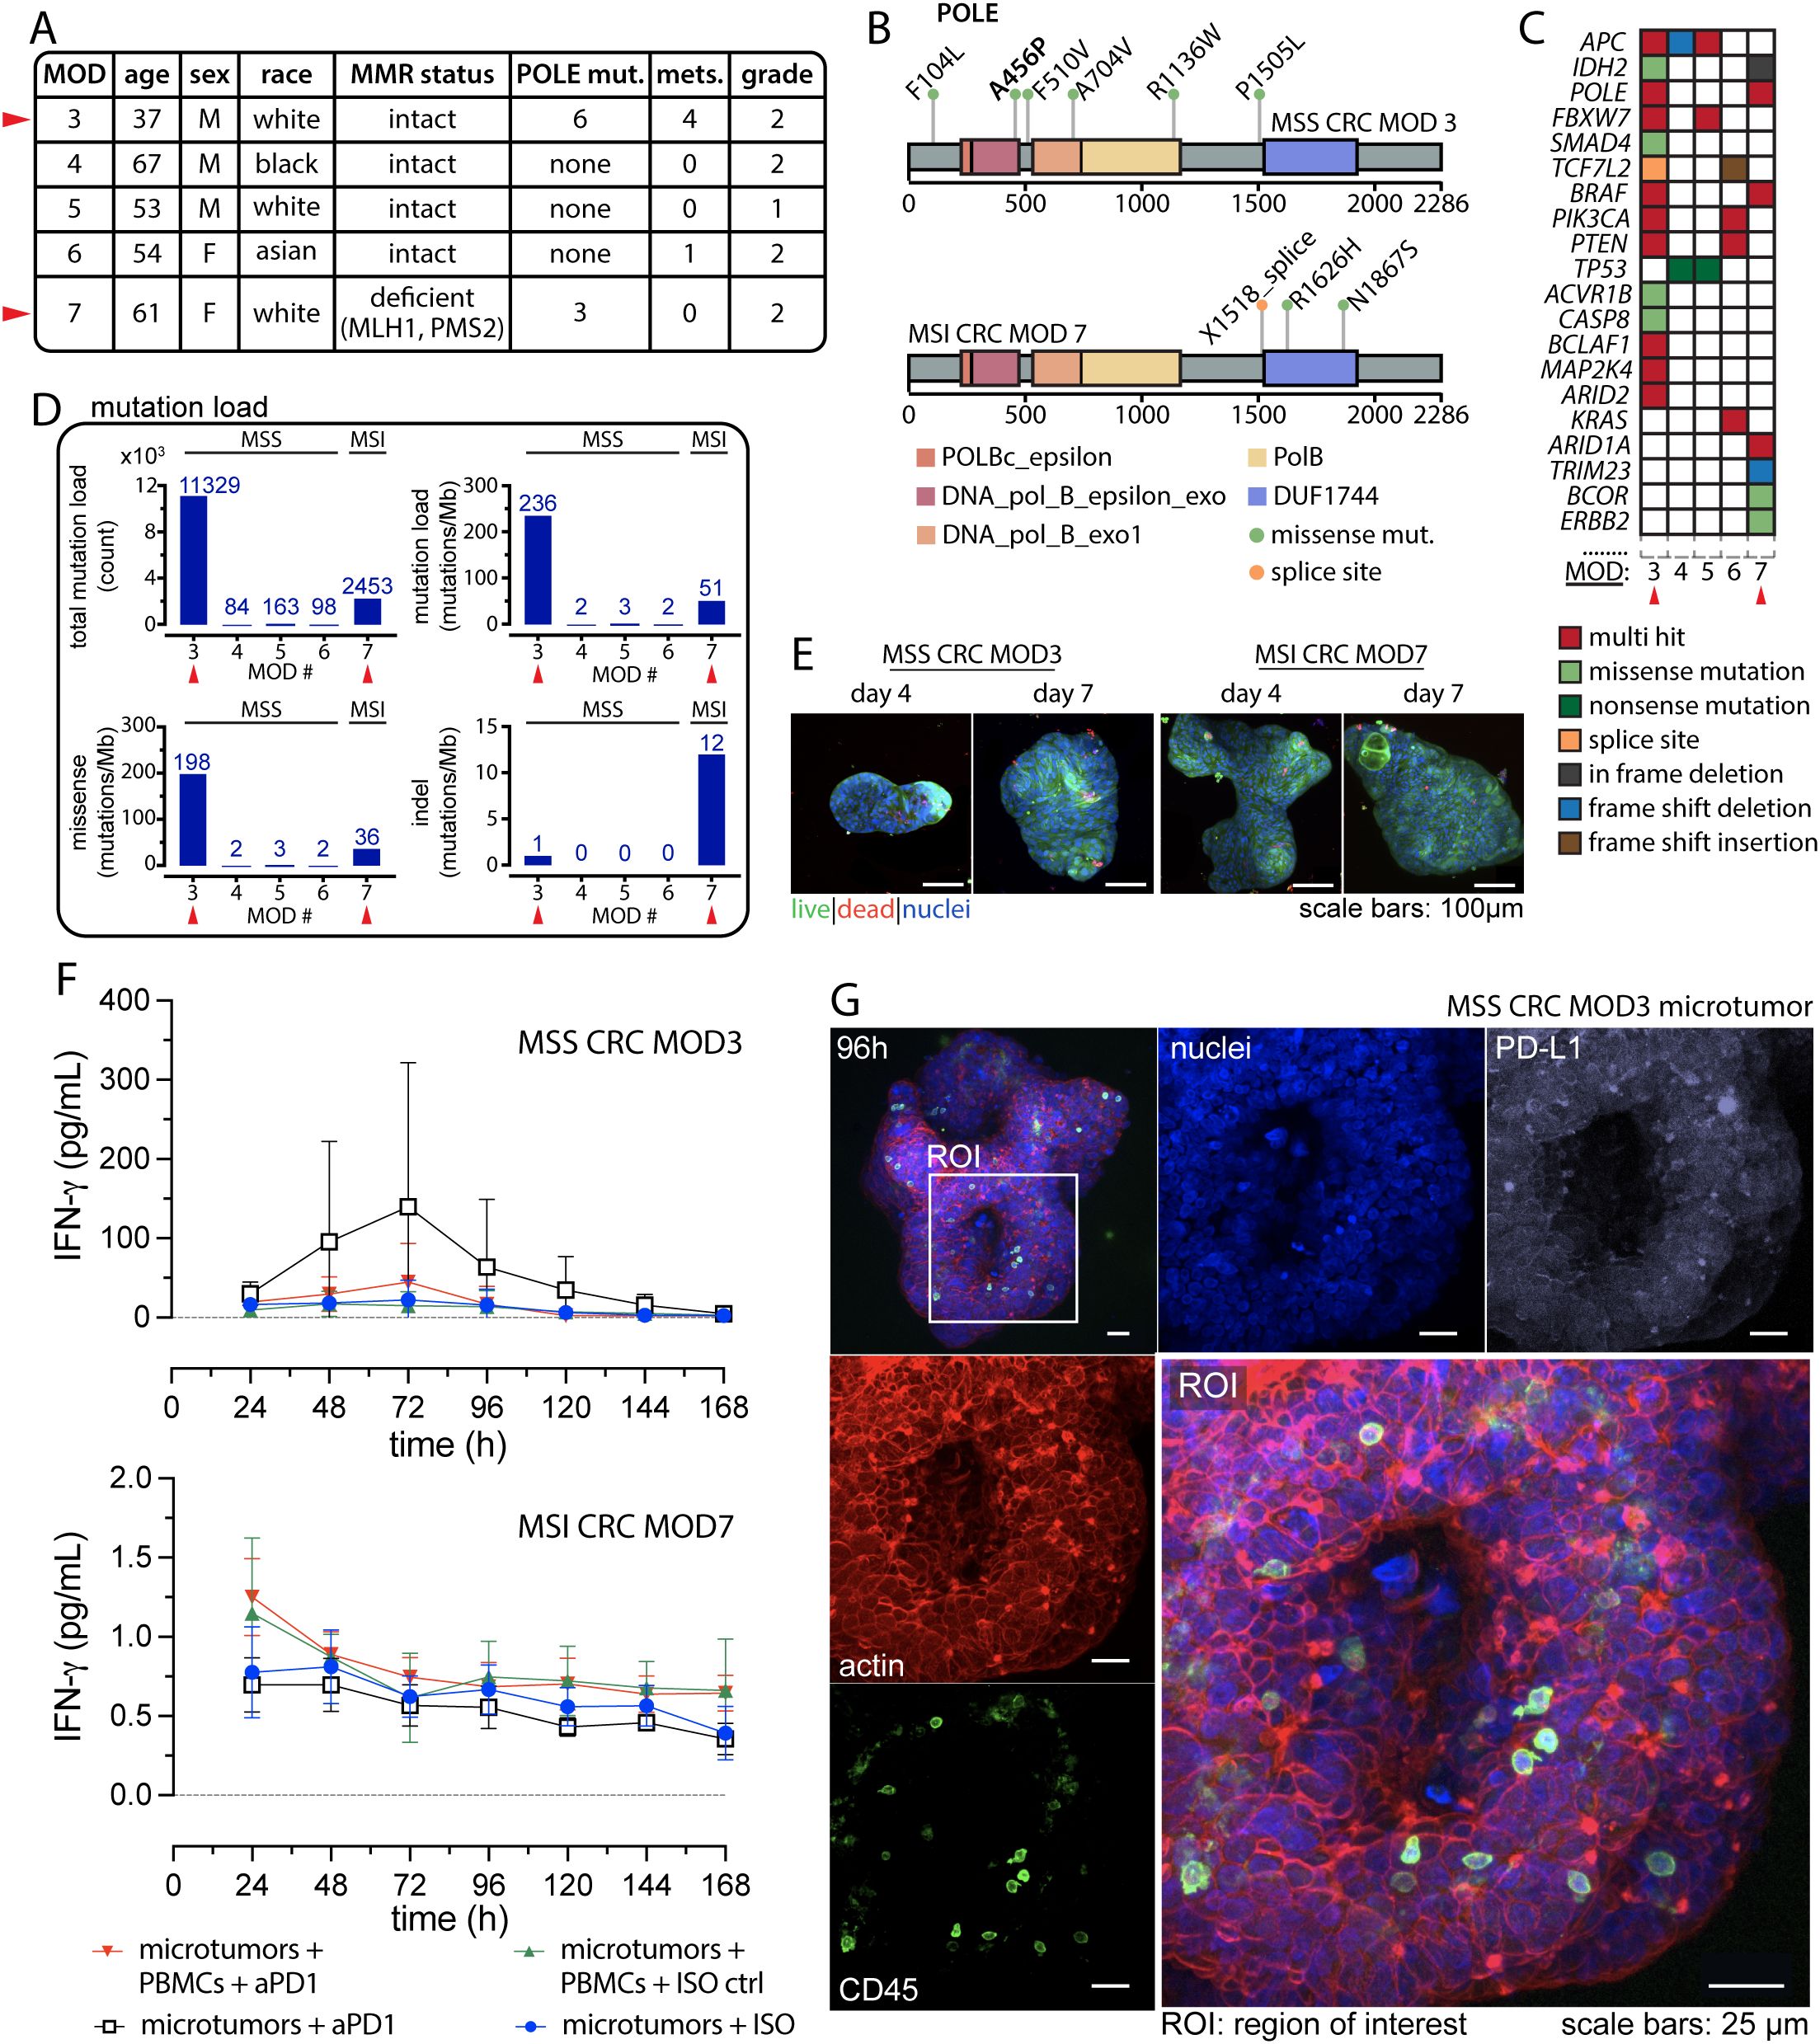
Figure 3. POLE mutations potentiate anti-tumor response to anti-PD-1 Treatment. (A) Patient information comparing case studies of CRC harboring POLE mutation with other MSS CRC cases. (B) Distribution of the POLE mutations within the POLE full-length sequence for MSS CRC MOD3 (top) and MSI CRC MOD7 (bottom). (C) Somatic mutation profiles in known cancer genes of CRC for the presented cases. (D) Mutation load reveals hypermutation status in MSS CRC with POLE mutation compared to other MSS and MSI phenotypes. (E) Typical IF viability data using Calcein AM (live, green) and BOBO-3 Iodide (dead, red) on day 4 and day 7 for the two case studies. (F) Detection of interferon-gamma (IFNγ) from effluent media collected every 24 hours for 7 days. Technical replicates, n=3 for all conditions. (G) Confocal images displaying resident immune cells in microtumors. An ROI highlights the detection of CD45+ intratumoral immune cell populations. Separate confocal channels show distinct fluorescent markers for actin (red), immune cells (green: CD45), nuclei (blue), and PD-L1 (white).
2 Materials and methods
2.1 Informed consent and ethical approval
This study was conducted in compliance with ethical standards and approved by the University of Florida Institutional Review Board (IRB) under protocol IRB202001363. All subjects were informed on the purpose of the study and gave written informed consent before participation. Informed consent was obtained from all participants or their legal guardians prior to the collection of any tissue sample. The study was carried out in accordance with the protocol and relevant guidelines and regulations, and the experimental protocol was approved by the University of Florida IRB (IRB202001363). No animal models were used during the conduct of this study.
2.2 Generation of tissue microexplants
The procedure of microexplant generation was previously reported (24). In brief, the surgically resected specimens were immediately submerged in ice-cold, calcium and magnesium-free PBS (1X) containing 10% FBS and transported to the laboratory within two hours of the surgery. External membranes and observable adipose tissues were removed using sterile forceps and scissors. The samples were washed three times with ice-cold PBS (1X). Holding on to one end of the sample with forceps, the sample was cut into smaller pieces using a surgical scalpel. The pieces were further cut with surgical scissors to sizes no larger than 1 mm. Without enzyme digestion, these microexplants were then transferred to a 15-mL tube containing approximately 10mL of ice-cold PBS and further chilled on ice for at least 5 minutes. The supernatant was discarded once a relatively clear collection of microexplants had settled at the bottom. This procedure was repeated three times to remove single cells and decellularized extracellular matrix (ECM) fragments. The collected microexplants were placed in 3D perfusion culture using pre-wetted wide-bore micropipette tips.
2.3 Peripheral blood mononuclear cells collection
Peripheral blood mononuclear cells (PBMCs) were isolated from the patient peripheral blood (~ 30–50 mL) using a Ficoll gradient (Ficoll-Paque Plus; Amersham Biosciences). The cells were labeled with carboxyfluorescein succinimidyl ester - CFSE (Cell Division Tracker Kit, 423801; BioLegend) and counted with a hemocytometer prior to the co-culture experiment.
2.4 Microexplants in perfusion culture
Perfusion culture was conducted as previously described (24). In brief, the microtumor samples were suspended in media-equilibrated liquid-like solid (LLS) microgels. A small sample of the microtumor-LLS mixture was placed on an inverted light microscope to count the microtumors per unit volume. Each well of a perfusion plate was loaded with 200µL of LLS containing PBMCs uniformly suspended at 106 cells/mL and approximately 30–40 CRC microtumors (Figures 1A–D). After loading, the plate was centrifuged at 100xg for 5 minutes at room temperature with a moderate acceleration and deceleration setting (Thermo Fisher Scientific, Waltham, MA, USA, Sorvall ST 40R). Culture media was carefully added to each quadrant of the plate to avoid disturbing the centrifuged microgels and samples. A 100cc Jackson-Pratt drain (Care Express, Cary, IL, USA, SU130-1305) was connected to establish a pressure gradient and initiate media perfusion as previously described (24). The culture conditions were maintained at 37°C with 5% CO2. The perfusion plates were maintained every 24 hours by adding pre-warmed media to the media reservoirs and collecting perfused media from the waste collection compartments.
2.5 Experimental conditions
Patient-derived microtumors and autologous PBMC were co-cultured long-term in the presence of pembrolizumab (anti-PD-1). We established three (3) control conditions: co-culture of tumor microexplants and CFSE labelled PBMCs, incorporating a human IgG4 isotype control (ISO ctrl); microtumors or PBMC alone with ISO ctrl or with anti-PD-1. Experimental conditions are clearly defined in the Results and the figures. The analysis was centered on differentiating evidence of immune response from MSI CRC as compared to MSS CRC. The IFNγ production between the responding versus non-responding cases was measured (Figures 1E–G). Note: pembrolizumab (anti-PD-1) was kindly provided by Merck & Co., Inc., Rahway, NJ, USA. The concentration of both pembrolizumab and the isotype control (IgG4) was 20 µg/mL for all experiments. Clinically, pembrolizumab achieves steady-state trough serum concentrations of approximately 50 µg/mL in patients receiving the standard 300 mg every two weeks (Q2W) dosing regimen. In ex vivo co-culture models, the absence of clearance mechanisms and the defined volume of culture medium enable consistent antibody exposure to target cells. A concentration of 20 µg/mL offers a conservative and effective dose that falls within the biologically active range and has been widely used in previous preclinical studies to block PD-1 signaling and elicit T-cell activation (29, 30).
2.6 Immunofluorescence assay
The immunofluorescence (IF) staining protocol was as previously completed in (24, 25). CRC microtumor samples were fixed in 4.0% formaldehyde in 1X PBS overnight at 4°C, washed twice, and incubated in PBS (1X) for 1 hour at room temperature. The samples were then permeabilized in 0.5% Triton X-100 (Sigma-Aldrich, St. Louis, MO, USA, X100-100ML) for 2 hours, washed twice, and blocked with 3% bovine serum albumin in PBS for 3 hours at room temperature. After blocking, samples were washed 3 times with PBS and incubated overnight with conjugated antibodies at 4°C. The antibodies used in this assay included E-cadherin (BD Biosciences, San Jose, CA, USA, 560062), Alexa Fluor® 488 Anti-CD45 antibody (Abcam, Cambridge, UK, ab197730), and Alexa Fluor™ 568 Phalloidin (Invitrogen, Waltham, MA, USA, A12380). After overnight incubation with the antibodies, the samples were washed 3 times with PBS and counterstained with Hoechst 33342 (Invitrogen, Waltham, MA, USA, H3570) for 15 minutes before imaging.
For live-cell viability assay, a live/dead kit (Thermo Fisher, Waltham, MA, USA, R37601) containing Calcein AM and BOBO-3 iodide was used, following the manufacturer’s protocol. Briefly, Calcein AM was gently mixed with BOBO-3 iodide. The solution was added to an equal volume of media-containing samples and incubated at 37°C with 5% CO2 for 30 minutes. Hoechst 33342 (Invitrogen, Waltham, MA, USA, H3570) was added to visualize cell nuclei. Subsequently, the samples underwent at least two washes with PBS (1X) before imaging. Samples were submerged in pre-warmed culture media and placed in a custom-built stage incubator for live-cell imaging.
2.7 TUNEL assay
Terminal deoxynucleotidyl transferase (TdT) dUTP Nick-End Labeling (TUNEL) assay (Click-iT Plus TUNEL assay, Invitrogen, Waltham, MA, USA, C10619) was applied to detect apoptosis in cancer cells and correlated with infiltrating CFSE labeled PBMCs. The assay was conducted following manufacturer protocol. All CRC microtumors were then imaged using a Nikon A1R HD25 confocal microscope equipped with a high-definition Galvano scanner.
2.8 Immunohistochemistry
Formalin-fixed paraffin-embedded (FFPE) tissues were sectioned at 5µm thickness and stained on the Leica Bond autostainer using optimized conditions for CD8 (CST#85336), CD4 (CST#48274), PD-1 (CST#86163), or PD-L1 (Abcam, Cambridge, UK, ab228415) antibodies. Serial sections were subjected to hematoxylin and eosin (H&E) staining.
2.9 Multiplexed ion beam imaging and analyses
FFPE tissues were sectioned at 5µm thickness, deparaffinized with xylene, and rehydrated with successive washes in reagent alcohol and water. Antigen retrieval was performed using Tris/EDTA pH9 solution (Dako) prior to blocking with 5% donkey serum. Slides were stained overnight at 4°C using a 25-plex cocktail of antibodies (dsDNA, beta-tubulin, CD298, CD4, CD11C, FOXP3, PD-1, PD-L1, GZMB, CD56, CD31, Ki67, CD14, CD68, CD8, CD3, CD45RO, VIM, alpha-SMA, pan-cytokeratin [pan-CK], CD20, PDPN, HLA-DR, HLA-ABC, and CD45). Following washings with TBS-T, slides were fixed for 5 minutes in 2% glutaraldehyde (Electron Microscopy Sciences), dehydrated with decreasing dilutions of ethanol, and dried prior to acquisition on MIBIscope. Ten (10) 800x800µm regions of interest (ROIs) per sample were selected based on the presence of immune infiltrates in serial H&E stains. The spatial locations of ROIs are clearly defined in the figures.
Following image quality control (QC), ROI regions were quantified as tumor based on pan-CK positivity or stroma based on VIM or alpha-SMA positivity. Watershed segmentation using a combination of nuclear, cytoplasmic, and membrane markers was used for immune population quantification. Cell classification was performed using a machine learning framework with pathologist-defined intensity thresholds for immune lineage markers. Marker intensities were quantified as ion counts per cell and cell densities were quantified as cells per mm2. The nearest neighbor analysis quantified the average distance from tumor cells to immune lineages. Statistical analyses were performed with GraphPad Prism8 using a one-way ANOVA with Tukey’s multiple comparison test. A cell density heat map was generated by normalizing population density with a z-score computation. Each column represents a single ROI, and each row reflects a different cell population. Red indicates higher values, and blue indicates lower values, as shown in the color scale.
2.10 IFNγ detection
A multi-parameter bead-based ELISA MSD IFNγ Small Spot assay (Meso Scale Diagnostics, MD, Cat#K151TTK-2) was employed to measure the IFNγ level from the daily perfused effluent media from the individual well of the perfusion platform. The assay was conducted following manufacturer protocol.
2.11 Somatic mutation
Whole exome sequencing (WES) reads were aligned to human reference genome GRCh37 with Sentieon v201808.06 (31) including post-processing steps (deduplication, indel realignment and base quality recalibration) to generate the bam files for downstream analysis. Somatic mutations in the tumor samples were called with GATK v4.1.4.0 Mutect 2 (32) using the matched tumor-infiltrated lymphocyte (TIL) samples as paired-normal controls. A panel of 522 normal samples was also used. Mutations with total read depth < 15 or mutant allele read depth < 4 were excluded, and the resulting mutations were further filtered with dbSNP b151 (33) and COSMIC v90 (34) databases. Specifically, mutations listed in dbSNP while not present in COSMIC were excluded. VEP v98 (35) was used to annotate the mutations. All protein-altering mutations (including splicing site mutations) were used for calculating mutation load. The length of regions used to calculate the normalized mutation count per megabase value was obtained by intersecting the WES bait regions and refGene exon regions padded with +/- 2 bp for splicing sites. The R package maftools (36) was used to generate the plots of mutations on the POLE protein.
2.12 Statistical analysis
GraphPad Prism software was used for statistical analysis. For Figure 2, we used a two-way ANOVA followed by Tukey’s HSD posthoc test for IFNγ level between the treatment groups at each time point. For Figure 4, we used one-way ANOVA with multiple comparison tests for multiple-group comparisons. Statistical analysis was also indicated in the figure captions.
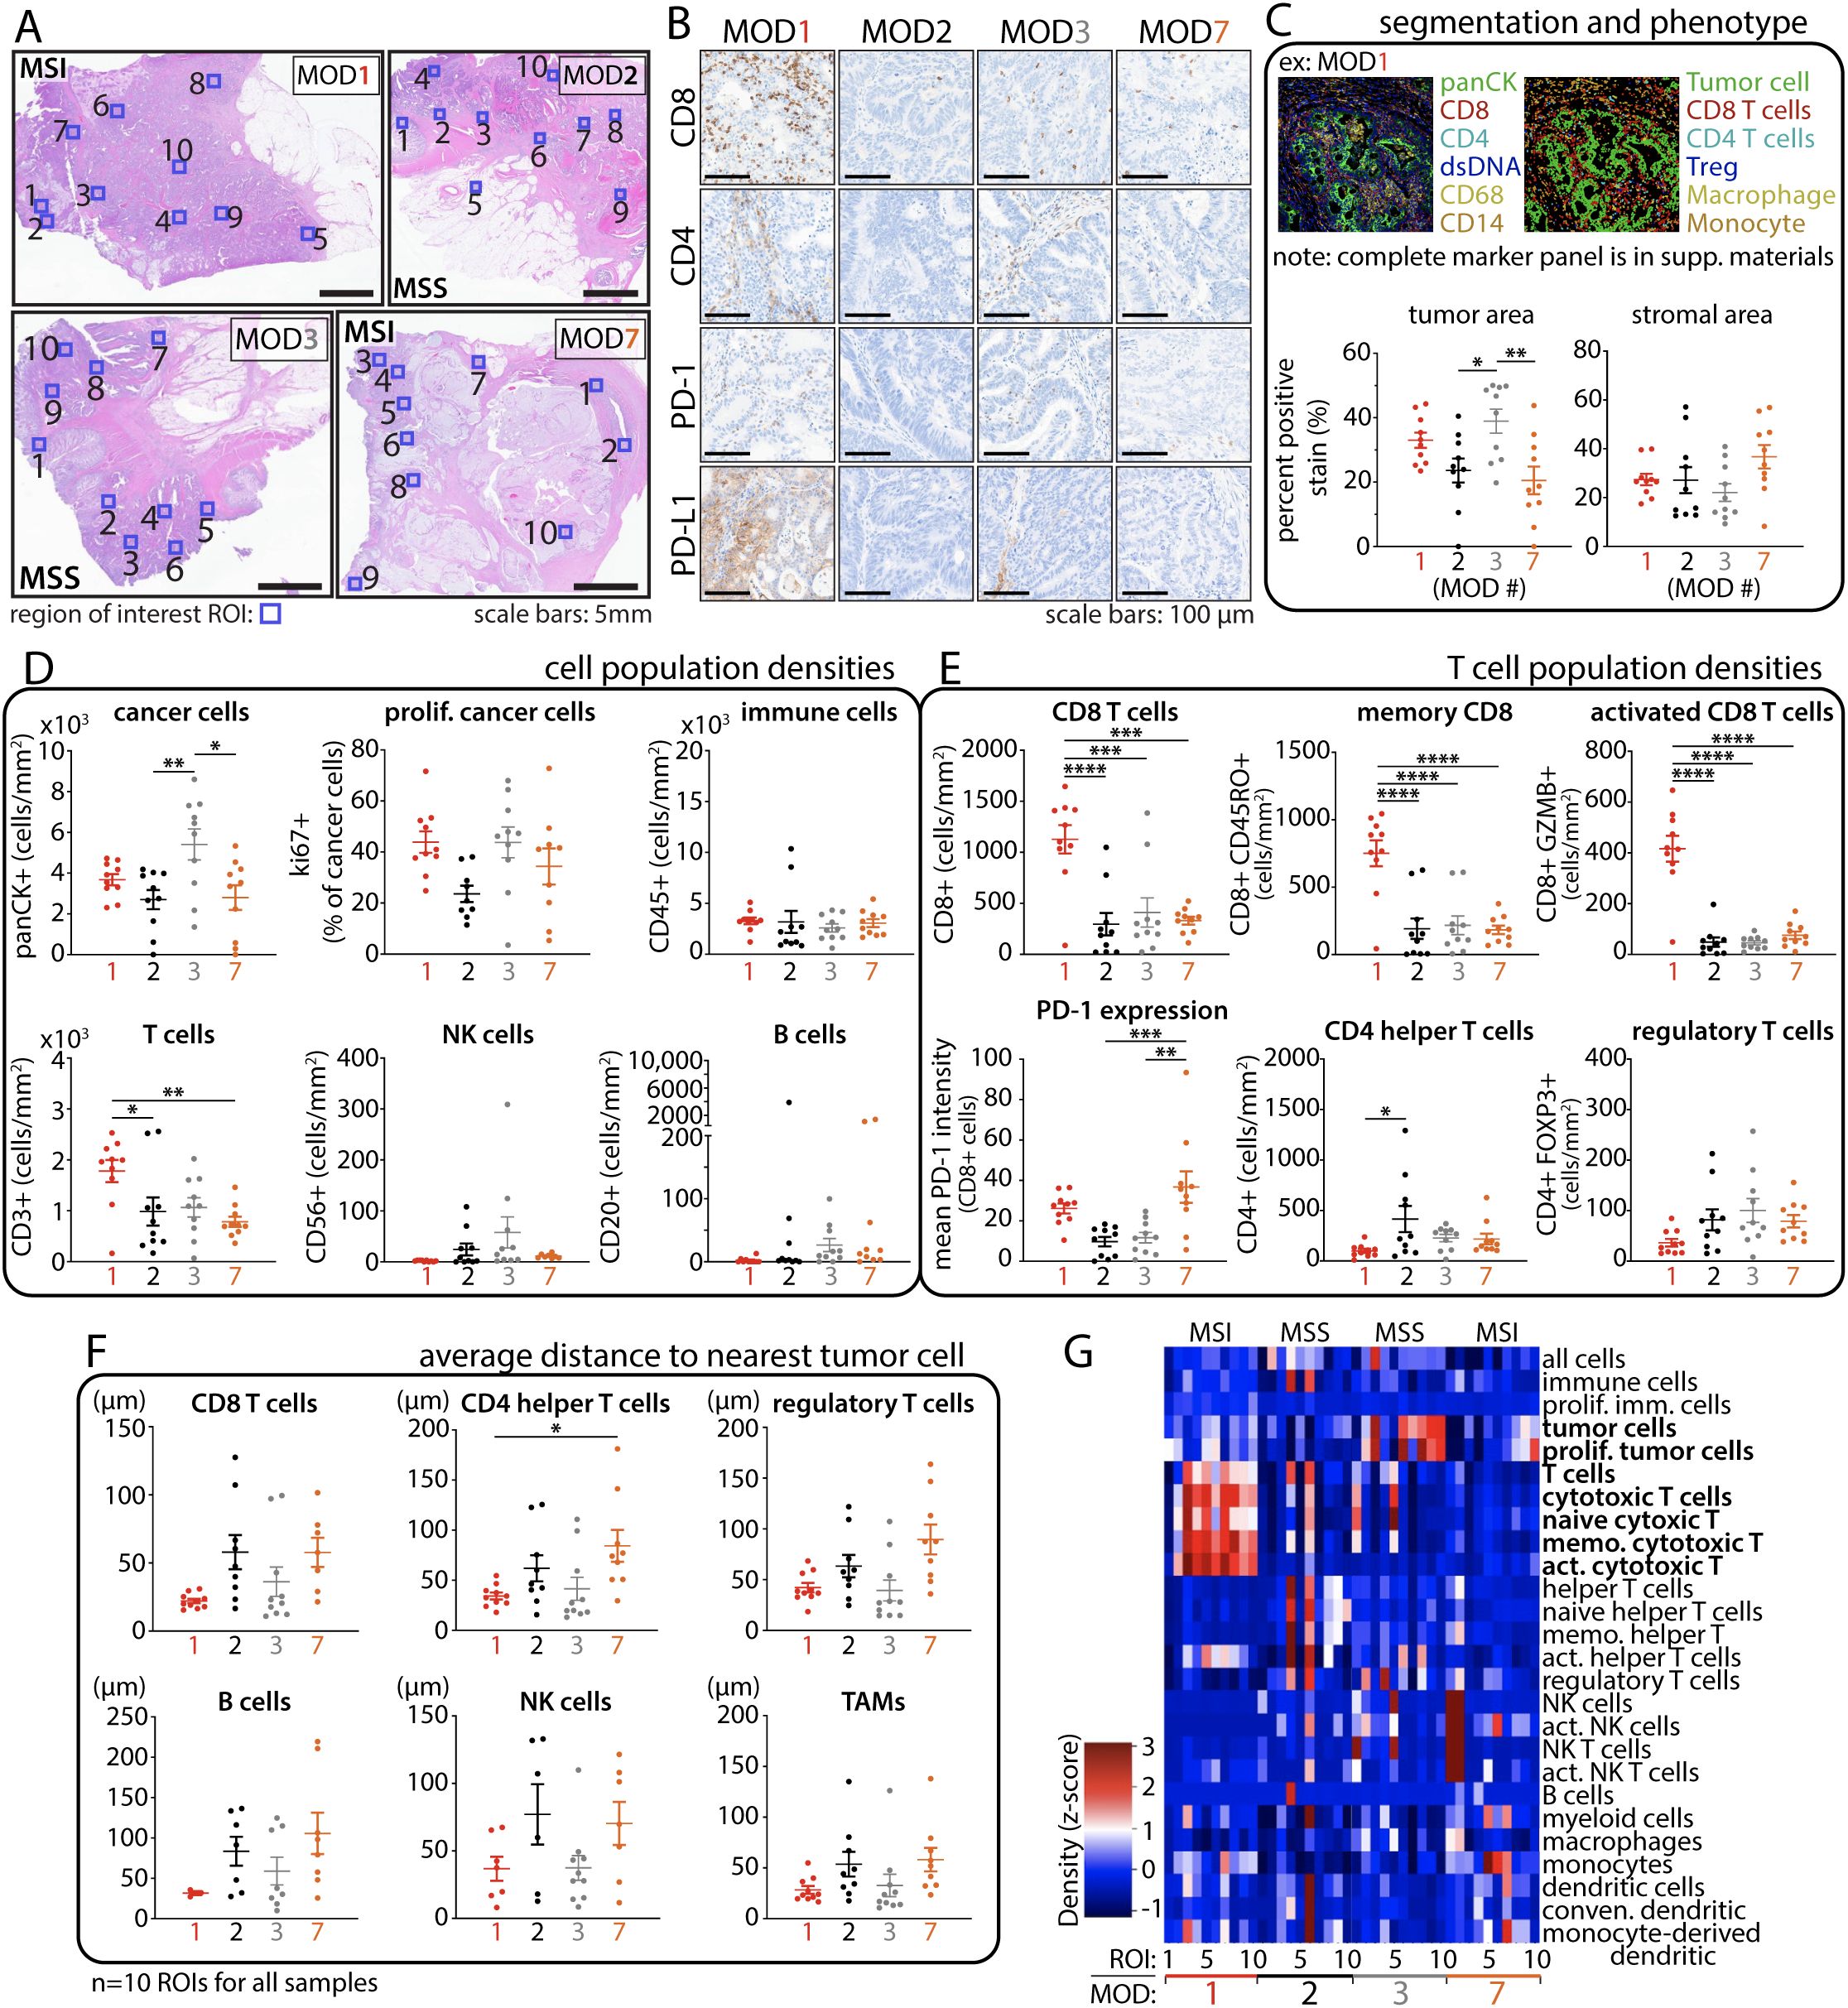
Figure 4. Multiplex immune cell profiling reveals heterogenous intratumoral immune populations in CRC tumors. (A) Histology images depict individual tumors with regions of interest (ROIs, blue box, n=10) selected for immune cell profiling. (B) IHC staining of TILs and immune checkpoint expression. (C) Representative example of cell segmentation and immune phenotyping. Tumor and stromal areas exhibit strong agreement with histology images from A. (D) Cell population densities (cells per mm2) show heterogeneous distribution among patients, even in those with similar CRC phenotypes. (E) T-cell population densities. (F) Proximity analysis reveals closer T cell distance to tumor cells in MOD1 (MSI) and MOD3 (MSS POLE) compared to other cases. (G) Cell density heat map reveals a high proportion of T cells in MOD1 compared to the rest of the samples. Statistical analysis was performed using One-Way ANOVA followed by Tukey multiple comparison test; *p < 0.05, **p < 0.01, ***p < 0.001, and ****p < 0.0001.
3 Results
3.1 Co-culture of patient-derived CRC microtumors and autologous PBMCs
The CRC cases were selected for the ex vivo model based on the following criteria: being treatment-naïve, having a sufficient blood draw (at least 35–50 mL) for PBMC isolation, and having a sufficient sample size (≥ 1 cm3 or 1g) without observable fibrotic tissue (Figures 1A, B). Tissue specimens were collected from properly consented colorectal cancer patients enrolled in our research program, Microtissues for Oncology and Drug Discovery (MODEL or MOD) (Figure 2A, Supplementary Table S1).
After surgical resection, specimens were promptly collected and delivered to the pathology department for analysis. Subsequently, a portion of the tissue was forwarded to our laboratory for experiment. The specimens were mechanically dissociated into smaller tissue fragments (≤ 1 mm) and co-cultured with CFSE-labeled PBMCs (106 cells/mL) as shown in the workflow in Figures 1A–D and 2B. In previous work, we demonstrated the capacity of T cells to navigate through the interstitial space of a Liquid-Like Solid (LLS) material, then infiltrate, and effectively eliminate target tumors in a 3D static co-culture (28). Building upon these previous findings (28), our objective was to construct an ex vivo model involving the co-culture of patient-derived tumors and immune cells to assess the anti-tumor response to Immune Checkpoint Inhibitor (ICI) therapy. We also employed a custom-built 3D platform to support the ex vivo co-culture of cells and tissues through the mechanism of media perfusion transport (24). In the culture chamber, the LLS provides a stable 3D support structure for immune cells and tumor microexplants, referred to as microtumors interchangeably in this study (28). The interstitial space between microgel particles facilitates cell motility and allows the perfusion of media (24, 28), (Figure 2C). The platform ensures a constant supply of culture media and the removal of waste metabolites through a continuous flow (24).
We observed a heterogeneous microtumor morphology with an intact tumor boundary, confirming the presence of viable cell populations and indicating signs of proliferation and self-organization over time, as typically shown in Figures 1F, 2D. To evaluate immune cell infiltration, the co-cultured samples were collected and thoroughly washed with PBS (1X) to remove surrounding non-infiltrating PBMC cells. Consequently, the detectable CFSE+ PBMC population in the microtumors exclusively represents infiltrated immune cells after long-term co-culture (Supplementary Figure S1). In summary, we demonstrated that microtumors and autologous PBMCs remained viable over an extended co-culture in our perfusion platform, making them suitable for drug screening.
3.2 Ex vivo response to pembrolizumab: MSI vs MSS CRC
We co-cultured patient-derived CRC microtumors with autologous CFSE-labeled PBMCs and treated them with pembrolizumab (defined as microtumors + PBMCs + anti-PD-1) at 20 µg/mL under perfusion. We established three control conditions to assess anti-tumor response: (1) co-culture of tumor microexplants and CFSE labelled PBMCs, incorporating a human IgG4 isotype control (defined as microtumors+ PBMCs+ ISO ctrl) at 20 µg/mL. This critical control ensured that any observed anti-tumor response would be specific to the PD-1 blockade. In addition, (2) microtumors alone and (3) PBMCs alone were used to evaluate the baseline anti-tumor activities from pre-existing Tumor-Infiltrating Lymphocyte (TILs) populations and the patient’s immune system respectively.
The levels of IFNγ in the daily perfused media were analyzed. IFNγ serves as a key indicator of immune-mediated anti-tumor function resulting from anti-PD-1 treatment. A significant elevation in IFNγ levels was observed in CRC microtumors-PBMC co-culture following anti-PD-1 treatment in MSI CRC MOD1 (Figure 2E). The IFNγ level remained consistently higher than in all three control conditions throughout the study, reaching its peak at 72 hours. This suggests a potential recovery period for these biological samples post-resection, tissue process, and ex vivo culture. Furthermore, the IFNγ level in MSS CRC MOD2 coculture, which was expected to be a non-responder to anti-PD-1 therapy, remained consistently low across all treatment conditions (Figure 2E).
Subsequently, we investigated immune infiltration by detecting CFSE+ cells and identified late-stage apoptosis using TUNEL assay. In the MSI CRC responder group, we observed a correlation between the spatial localization of a high number of infiltrating CFSE+ PBMCs (green) and TUNEL-labeled cancer cell death (white), indicating immune-mediated killing in microtumors-PBMCs co-cultured treated with anti-PD-1 (Figure 2F). This correlation was not observed in the three control groups. Consistently, we did not observe significant CFSE+ or TUNEL signal in the non-responder MSS CRC case. To verify the specificity of TUNEL labeling and CFSE+ signals, we co-stained for nuclei and the actin cytoskeletal network, ensuring the identification of cells and confirming intact tissue and cellular morphology respectively (Figure 2F).
3.3 POLE A456P mutation potentiates high tumor mutation burden and ex vivo response to pembrolizumab
Given recent clinical case studies reporting partial or complete responses in POLE-mutated MSS CRC, we aimed to investigate evidence of ex vivo response within our model. We received a case from a 37-year-old Caucasian male diagnosed with treatment-naïve, moderately differentiated MSS CRC harboring POLE mutations, who underwent surgery for tumor removal. The tumor specimen was collected, promptly sent to pathology, and then delivered directly to our laboratory for experiment. In this report, the case is labeled as MOD3, and its clinical data are presented in Figure 3A and Supplementary Table S1. NextGen sequencing data retrieved from the UF Shands Clinical and Translational Science Institute (CTSI) RedCap database (PID 11877, project title: MOD2EL v2) revealed multiple POLE mutations for this case. We also conducted whole exome sequencing (WES) and confirmed the presence of six missense mutations on the POLE full-length sequence as illustrated in Figure 3B. Notably, the amino acid mutation p.Ala456Pro (p.A456P; c.1366G>C) identified on exon 14, is situated in the exonuclease domain and has been suggested as a recurrent somatic aberration and identified as a pathogenic POLE hotspot mutation for endometrial cancer (37, 38). In addition, mutations in the POLE exonuclease domain are often found in MSS tumors, leading to hypermutation and associated response to immunotherapy (12). The remaining five mutations, distributed across other domains of the POLE gene, are of unknown significance.
In subsequent studies, we further characterized and compared the mutation profiles of additional CRC cases, including three MSS CRC MOD 4, 5 and 6. In addition, we performed an ex vivo experiment on an MSI CRC case namely MOD7, which also harbors POLE mutations, for comparison with MSS CRC MOD3. WES analysis of MOD7 unveiled the presence of two missense mutations and one splice site mutation within the POLE gene. The pathogenic significance of these mutations has not been reported. We presented the clinical data for these CRC cases in Figure 3A and Supplementary Table S1, along with their somatic mutation profiles in key CRC-associated genes (39) in Figure 3C. Although MOD3 and MOD7 share multi-hit POLE mutations, they demonstrate distinct driver gene profiles. Notably, MSS CRC MOD3 presents a significantly higher number of these mutations compared to other MSS CRC cases and even to MSI MOD7. MSS MOD4 and 5 exhibited the most similar driver gene mutations (TP53 and APC) and copy number alteration (CNA) profiles, with these two genes displaying the most widespread CNAs across the genome. Additionally, typical CNAs observed in CRC, such as gains in chromosome 13 (chr 13) and losses in chromosome 18 (chr 18), are evident in these samples. On the other hand, MOD6 exhibits a unique driver gene mutation profile, featuring alterations in PIK3CA, PTEN, and KRAS, along with specific CNAs, including losses in chr 1p, 17, and 18.
Furthermore, MSI CRC MOD7 with POLE mutations, demonstrates hypermutation with a high mutation load of 51 mutations per megabase (mutations/Mb) (Figure 3D). MOD7 exhibits a distinctive driver mutation profile, featuring numerous CNAs (gains in chr 1q, 2, 13), and a higher frequency of indel mutations (12 mutations/Mb), which is commonly observed in MSI CRCs. This mutation profile sets it apart from all other MSS cases in this study. Remarkably, MSS CRC MOD3 exhibits an ultra-mutated phenotype, revealing an even higher TMB with an estimated total mutation count of 11,329 and a mutation load of 236 mutations/Mb (Figure 3D). This is approximately more than four times that of MOD7 and approximately 70 times more than MOD4, 5, and 6 cases.
We proceeded to investigate the evidence of response to anti-PD-1 therapy for MSS CRC MOD3 and MSI CRC MOD7 using our ex vivo model, as described above. The workflow is illustrated in Figure 1, where patient whole blood and tumor tissue specimens were collected for the experiment following selection for pathology examination. IF assays at specific time points revealed microtumors with robust cell viability and intact boundaries, indicative of a well-organized and thriving culture (Figure 3E).
We established four conditions for the studies: (1) co-culture of MOD3 and MOD7 microtumors and patient-matched CFSE-labeled PBMCs with pembrolizumab (20 µg/mL) through continuous, unidirectional vertical perfusion. As a control (2) we also treated the co-culture with human IgG4 isotype control (ISO). In addition, (3) we treated microtumors alone with pembrolizumab (defined as: microtumors + anti-PD-1) to investigate potential anti-tumor responses stemming from TILs populations and (4) microtumors alone with ISO (defined as: microtumors + ISO ctrl) as an additional control. In line with the previous co-culture experiments, we evaluated daily perfused media for IFNγ levels, serving as an indicator of an immune-mediated anti-tumor response. Although not statistically significant, a higher trend in IFNγ production was observed in the microtumor-alone condition following anti-PD-1 treatment, suggesting a potential anti-tumor response from the TILs population (Figure 3F). Further investigation is needed to confirm this finding and clarify whether local immune reinvigoration contributes to effective recruitment of PBMCs and overall anti-tumor response. Figure 3G presents confocal IF images of a representative MOD3 microtumor cultured for 96 hours, revealing abundant CD45+ TILs in the microtumors. On the other hand, the co-culture of microtumors with PBMCs at the same anti-PD-1 dose resulted in a minimal response, possibly due to the presence of myeloid-derived suppressor cells within the PBMCs (40, 41), potentially dampening the anti-tumor effect (42, 43).
3.4 Intra- and inter-tumor heterogeneities
We closely examined the tumor microenvironment (TME) in the selected CRC cases to explore intra- and inter-tumor heterogeneity influencing the response to anti-PD-1 treatment. We employed multiplexed ion beam imaging (MIBI) platform to capture ten regions of interest (800 x 800µm) within formalin-fixed paraffin-embedded (FFPE) specimen sections (Figure 4A), ensuring a precise representation of the TME.
IHC staining of the entire tissue displayed a heterogeneous distribution of CD8+ and CD4+ T cells across all samples, with notably significant expression observed in MSI CRC MOD1 (Figure 4B). In addition, TILs are notably present in MSS CRC MOD3 compared to MOD2 and even MSI CRC MOD7. We applied a comprehensive 25-marker panel to conduct a thorough profiling of various immune subsets present within the complex landscape of the TME in these cases. The analyses were done blinded to patient outcome and CRC phenotype. Macroscopic region analysis initially revealed that MOD7 exhibits the highest stromal distribution, whereas MOD3 has the greatest tumor area, as quantified in Figure 4C and visually depicted in Figure 4A.
Cell segmentation and phenotyping revealed cellular heterogeneity, as evidenced by variations in cell population densities (Figure 4D), which shows higher cancer cell populations for MSS MOD3 and significantly high TILs in MSI MOD1. Further analysis showed significantly higher CD8+ T cell densities in MSI MOD1 compared to other samples (Figure 4E). Consistent with other studies, there is more PD-1 expression on CD8+ T cells for both MSI cases, MOD1 and MOD7. Remarkably, although the count of CD8+ T cells is not markedly elevated in MSS MOD3, spatial analysis of T cell distribution reveals that, on average, these immune cells are localized closer to tumor cells in both MOD1 and MOD3 cases compared to the rest of the samples (Figure 4F). However, these findings are limited by sample size and the number of ex vivo cases. Further investigations are necessary to draw a better definitive conclusion. This close cancer-immune proximity could contribute to the observed anti-tumor response to anti-PD-1 treatment in both cases. Intra- and inter-tumor heterogeneity in cell populations and phenotypes across all cases are effectively summarized and depicted in the cell density heatmap (Figure 4G). Notably, there is a significant elevation in the T cell population for MOD1, contrasting with MOD7 despite both sharing the same MSI CRC phenotype.
4 Discussion
To our knowledge, this study pioneered the development of the first ex vivo model involving long-term co-culture of patient-derived CRC microtumors with autologous PBMCs for screening responses to immunotherapy. The LLS microgels act as an ECM scaffold, stably upholding microtumors and immune cells in 3D, while the interstitial space between microgel particles enables unconstrained cellular activities (24, 28). In a target-specific CAR T cell killing assay, IFNγ typically peaks within the initial 24–48 hours of co-culture (22, 44, 45). However, in this study, we observed the peak IFNγ production in our system at 72 hours. This “delay” in peak IFNγ suggested a period of recovery from ex vivo culture for T cell activation and engagement in anti-tumor activities in response to anti-PD-1 treatment. In addition, LLS microgels are non-degradable, and T cells must navigate the tortuous microchannel network of the interstitial space between the microgels to infiltrate the microtumors via chemotaxis (28). Therefore, this platform imposes physical barriers to T cell migration in 3D, mimicking immunosuppressive properties of a TME in solid tumors (28), thereby further delaying immune-mediated antitumor function.
Response to PD-1 blockade from CRC patients diagnosed with POLE mutations has been reported in clinical case studies even for non-responder MSS phenotype. In most of these cases, immunotherapy was not given as a first-line treatment. Instead, the patients had to undergo other cancer treatment modalities, including neo-or adjuvant chemotherapy, which are costly and often lead to low quality of life. The application of ex vivo models may facilitate the rapid screening of effective drug combinations and the study of their mechanisms of action or resistance. This study presents the first evidence of an ex vivo response to checkpoint therapy in MSS CRC, characterized by the presence of the POLE A456P mutation and an additional five somatic POLE mutations of unknown significance. While POLE A456P has been suggested to be pathogenic for endometrial cancer (46), its pathogenicity remains of unknown significance for CRC (38, 47). This case in our studies exhibited significantly high TMB, four times that of MSI MOD7 and approximately 70 times more than other MSS MOD4, 5, and 6. In fact, the MOD3 case exhibits an even higher mutation load at 236 mutations/Mb compared to all existing clinical case studies of POLE-mutated MSS CRCs that have shown partial or complete responses to pembrolizumab (Table 1). The highest mutation load reported in these previous studies was 200 mutations/Mb. In addition, high TMB has been proposed as an independent predictive biomarker for the response to immune checkpoint inhibitors (3, 4, 7). Notably, the CCTG CO.26 study demonstrated a correlation between TMB and the efficacy of dual immunotherapy, suggesting potential benefits for patients with TMB > 28 mutations/Mb (5). However, questions persist regarding the underlying mechanisms of response and acquired resistance. It remains to be elucidated whether the response is primarily driven by mutation load, leading to the generation of neoantigens and subsequent immune activation.
Furthermore, an important question centers on whether PD-1 blockade will primarily boost the existing intratumoral immune cells (22, 48), or recruit new T-cell infiltration (clonal replacement) (49–51). Using paired single-cell RNA and T-cell receptor sequencing, Yost and colleagues demonstrated that the T-cell response to checkpoint inhibitors primarily depends on T-cell infiltration, rather than the reinvigoration of pre-existing tumor-specific T cells, which may be less responsive than previously thought (49, 52, 53). Building on this approach, a recent study provided extensive profiling of T-cell clonotypes across different tumor-associated tissue regions, revealing the anatomical distribution of tumor-specific T cells in patients undergoing immune checkpoint inhibitor therapy (54). These findings underscore the importance of systemic immunity, not just local immune responses, in effective T-cell recruitment and overall cancer immunotherapy (55). However, the mechanisms underlying tissue-specific immune recruitment remain poorly understood. One hypothesis is that local immune reinvigoration may precede T-cell recruitment from peripheral immune reservoirs or adjacent tissues (56). Nevertheless, the extent to which local activation is required for efficient recruitment and a robust systemic anti-tumor response remains an open question. Interestingly, although not statistically significant, we observed a notable increase in IFNγ levels in microtumors treated with anti-PD-1 in the case of MSS CRC MOD3 harboring POLE mutations. This finding suggests a potential anti-tumor role for the intratumoral immune cell population, aligning with observations from a recent study (22). However, this level was trivial when microtumors were co-cultured with PBMCs in the presence of the drug. This is perhaps due to immunosuppression from myeloid-derived suppressor cells (MDSCs) which are present in PBMCs (57, 58). Further investigation into MDSCs and other immunosuppressive populations in responder versus non-responder phenotypes through comprehensive profiling may provide deeper insights into the mechanisms underlying the response to anti-PD-1 therapy. On the contrary, IFNγ level was the highest in microtumor-PBMC co-culture with anti-PD-1 treatment for MSI CRC MOD1, which is enriched in TILs (Figure 4). While TIL enrichment is widely reported for MSI CRC, this finding further suggests potential immune reinvigoration, possibly facilitating initial immune recruitment and clonal replacement. Future studies are essential to confirm whether anti-PD-1 induces clonal replacement of effector T cells in responder CRCs.
It is feasible that the synergy between mutation load and neoantigens primes the tumor for a response to anti-PD-1. Even in small quantities, existing TILs could initiate the initial response, triggering the release of inflammatory cytokines and subsequent recruitment of more immune cells to the tumor mass. Investigation of the immune cell phenotype in each tumor, correlated with functional data from ex vivo treatment with immune cell therapy will improve our understanding of the mechanism(s) that govern the efficacy of immunotherapy. Particularly, it would be highly advantageous to explore the correlation between MDSC levels in both circulating and tumor-infiltrating environments in MSS versus MSI phenotypes. In addition, investigating the potential impact of POLE pathogenic mutations on this cell population as markers of response to immunotherapy holds substantial promise. Furthermore, combination therapy involving immune checkpoint inhibitors for MSS CRC is currently under intensive investigation (59). The ex vivo model may also be used to screen the efficacy of mono or combination therapy in other cancer types with autologous immune cells. Given the rarity of pathogenic POLE mutations in CRC, our model aids in establishing preliminary evidence of any potential response to immunotherapy.
This study has limitations, including the need for a larger sample size to improve statistical analysis and additional cases to enhance predictive power. Nevertheless, it stands out as a technically advanced investigation due to the use of a 3D media-perfused ex vivo platform that supports interstitial migration of immune cells (28). To our knowledge, this is the first ex vivo model enabling long-term 3D co-culture of patient-derived microtumors and matched PBMCs under media perfusion. In addition, while anti-PD-1 therapy is typically used for advanced metastatic MSI CRC, the treatment-naïve status of all cases in this study revealed evidence of immune activation is notable in MSI MOD1, highlighting a differential response compared to the non-responder MSI MOD7 despite sharing the same MMR status. The observed presence of intratumoral immune cells via multiplex IF and the spatial distribution of lymphocytes in POLE-mutated CRC further underscore the platform’s potential for mechanistic insights. These findings collectively highlight the promise of this platform for future studies aimed at unraveling tumor-immune dynamics and therapeutic responses.
5 Conclusion
The presence of inter- and intra-tumor heterogeneity has a profound impact on the landscape of cancer treatment options. Unfortunately, many CRC patients do not typically benefit from immunotherapy, which often leads to alternative chemotherapies and other suboptimal treatments. However, emerging evidence indicates that identifying CRC patients with pathological POLE mutations, exhibiting high TMB may serve as potential predictors of favorable response to immunotherapy. Further evaluation of these mutations as potential biomarkers for overall TMB, their correlation with the response to immune checkpoint blockade, and elucidation of the mechanisms of response provide additional opportunities for future research. Ex vivo model systems may play an important role in developing personalized cancer treatment strategies, a key factor for achieving optimal outcomes.
Data availability statement
The datasets generated in this study are included in this published article and its supplementary information files. Additional raw data are available from the corresponding author (ZHV5Lm5ndXllbkBtb2ZmaXR0Lm9yZw==) upon reasonable request. Due to patient privacy concerns, the UF Shands Clinical and Translational Science Institute (CTSI) RedCap database are not publicly available.
Ethics statement
This study was conducted in compliance with ethical standards and approved by the University of Florida Institutional Review Board (IRB) under protocol IRB202001363. The studies were conducted in accordance with the local legislation and institutional requirements. The participants provided their written informed consent to participate in this study.
Author contributions
DN: Conceptualization, Data curation, Formal analysis, Funding acquisition, Investigation, Methodology, Resources, Supervision, Visualization, Writing – original draft, Writing – review & editing. MS: Conceptualization, Formal analysis, Investigation, Methodology, Supervision, Validation, Writing – review & editing. KT: Conceptualization, Investigation, Methodology, Writing – review & editing. XX: Formal analysis, Investigation, Methodology, Validation, Writing – review & editing. DP: Formal analysis, Investigation, Writing – review & editing. AP: Data curation, Formal analysis, Investigation, Writing – review & editing. JU: Conceptualization, Investigation, Methodology, Writing – review & editing. ZD: Formal analysis, Investigation, Methodology, Validation, Writing – review & editing. ND: Investigation, Methodology, Writing – review & editing. RS: Conceptualization, Investigation, Methodology, Writing – review & editing. JF: Conceptualization, Investigation, Methodology, Writing – review & editing. NN: Writing – original draft, Writing – review & editing. GT-A: Methodology, Writing – review & editing. KC: Data curation, Formal analysis, Methodology, Writing – review & editing. LC: Data curation, Formal analysis, Methodology, Writing – review & editing. DL: Data curation, Formal analysis, Methodology, Writing – review & editing. VV: Data curation, Formal analysis, Methodology, Writing – review & editing. AF: Data curation, Formal analysis, Methodology, Writing – review & editing. SK: Data curation, Formal analysis, Methodology, Writing – review & editing. DS: Data curation, Formal analysis, Methodology, Writing – review & editing. HC: Data curation, Formal analysis, Methodology, Writing – review & editing. HX: Formal analysis, Investigation, Methodology, Supervision, Writing – original draft, Writing – review & editing. BL: Investigation, Supervision, Writing – review & editing. LM: Investigation, Supervision, Writing – review & editing. BH: Investigation, Supervision, Writing – review & editing. GA: Investigation, Supervision, Writing – review & editing. WS: Conceptualization, Data curation, Formal analysis, Funding acquisition, Investigation, Methodology, Supervision, Validation, Writing – review & editing.
Funding
The author(s) declare financial support was received for the research and/or publication of this article. We thank the National Science Foundation Graduate Research Fellowship (DGE-1842473, DN), Merck Sharp & Dohme LLC, a subsidiary of Merck & Co., Inc., Rahway, NJ, USA (WS and DN), and the Moffitt Cancer Center for funding this work.
Acknowledgments
Part of this work was published in author Duy T. Nguyen's doctoral dissertation: Nguyen, Duy T. 2022. “Cancer Immunotherapy in 3D : In Vitro Models of Tumor-Immune Interactions.” Doctoral Dissertation, University of Florida. https://www.proquest.com/docview/2924882687. The abstract of this work was also submitted to 2025 AACR annual Conference: Duy T. Nguyen, Matthew A. Schaller, Krista P. Terracina, Xia Xu, Diego I. Pedro, Alfonso Pepe, Juan M. Urueña, Zadia Dupee, Nickolas Diodati, Ryan Smolchek, Jack E. Famiglietti, Tran Yen Nhi Nguyen, Gerik Tushoski, Kuoyuan Cheng, Lan Chen, Doug Linn, Vania Vidimar, Aquila Fatima, Soon Woo Kwon, Dongyu Sun, Hongmin Chen, Haiyan Xu, Brian Long, Lily Y. Moy, Bonnie J. Howell, George H. Addona, W. Gregory Sawyer. Patient-derived colorectal microtumors predict response to anti-PD1 therapy [abstract]. In: Proceedings of the American Association for Cancer Research Annual Meeting 2025; Part 1 (Regular Abstracts); 2025 Apr 25-30; Chicago, IL. Philadelphia (PA): AACR; Cancer Res 2025;85(8_Suppl_1):Abstract nr 2193.
Conflict of interest
Authors XX, KC, LC, DL, VV, AF, SK, DS, HC, HX, BL, LM, BH and GA were employed by the company Merck Sharp & Dohme LLC, a subsidiary of Merck & Co., Inc., Rahway, NJ, USA. The remaining authors declare that the research was conducted in the absence of any commercial or financial relationships that could be construed as a potential conflict of interest.
The authors declare that this study received funding from the National Science Foundation Graduate Research Fellowship (DGE-1842473,DN), Merck Sharp & Dohme LLC, a subsidiary of Merck & Co., Inc., Rahway, NJ, USA. The funder had the following involvement: study design, collection, analysis, interpretation of data, the writing of this article or the decision to submit it for publication.
Generative AI statement
The author(s) declare that no Generative AI was used in the creation of this manuscript.
Publisher’s note
All claims expressed in this article are solely those of the authors and do not necessarily represent those of their affiliated organizations, or those of the publisher, the editors and the reviewers. Any product that may be evaluated in this article, or claim that may be made by its manufacturer, is not guaranteed or endorsed by the publisher.
Supplementary material
The Supplementary Material for this article can be found online at: https://www.frontiersin.org/articles/10.3389/fimmu.2025.1640500/full#supplementary-material
References
1. Marcus L, Lemery SJ, Keegan P, and Pazdur R. FDA approval summary: Pembrolizumab for the treatment of microsatellite instability-high solid tumors. Clin Cancer Res. (2019) 25:3753–8. doi: 10.1158/1078-0432.CCR-18-4070
2. Le DT, Durham JN, Smith KN, Wang H, Bartlett BR, Aulakh LK, et al. Mismatch repair deficiency predicts response of solid tumors to PD-1 blockade. Science. (2017) 357:409–13. doi: 10.1126/science.aan6733
3. Sha D, Jin Z, Budczies J, Kluck K, Stenzinger A, and Sinicrope FA. Tumor mutational burden as a predictive biomarker in solid tumors. Cancer Discov. (2020) 10:1808–25. doi: 10.1158/2159-8290.CD-20-0522
4. Klempner SJ, Fabrizio D, Bane S, Reinhart M, Peoples T, Ali SM, et al. Tumor mutational burden as a predictive biomarker for response to immune checkpoint inhibitors: A review of current evidence. Oncologist. (2020) 25:e147–59. doi: 10.1634/theoncologist.2019-0244
5. Chen EX, Jonker DJ, Loree JM, Kennecke HF, Berry SR, Couture F, et al. Effect of combined immune checkpoint inhibition vs best supportive care alone in patients with advanced colorectal cancer: the Canadian Cancer Trials Group CO.26 study. JAMA Oncol. (2020) 6:831. doi: 10.1001/jamaoncol.2020.0910
6. Havel JJ, Chowell D, and Chan TA. The evolving landscape of biomarkers for checkpoint inhibitor immunotherapy. Nat Rev Cancer. (2019) 19:133–50. doi: 10.1038/s41568-019-0116-x
7. Samstein RM, Lee C-H, Shoushtari AN, Hellmann MD, Shen R, Janjigian YY, et al. Tumor mutational load predicts survival after immunotherapy across multiple cancer types. Nat Genet. (2019) 51:202–6. doi: 10.1038/s41588-018-0312-8
8. Sahin IH, Akce M, Alese O, Shaib W, Lesinski GB, El-Rayes B, et al. Immune checkpoint inhibitors for the treatment of MSI-H/MMR-D colorectal cancer and a perspective on resistance mechanisms. Br J Cancer. (2019) 121:809–18. doi: 10.1038/s41416-019-0599-y
9. Vitale I, Shema E, Loi S, and Galluzzi L. Intratumoral heterogeneity in cancer progression and response to immunotherapy. Nat Med. (2021) 27:212–24. doi: 10.1038/s41591-021-01233-9
10. Punt CJA, Koopman M, and Vermeulen L. From tumour heterogeneity to advances in precision treatment of colorectal cancer. Nat Rev Clin Oncol. (2017) 14:235–46. doi: 10.1038/nrclinonc.2016.171
11. Goetz LH and Schork NJ. Personalized medicine: motivation, challenges, and progress. Fertility Sterility. (2018) 109:952–63. doi: 10.1016/j.fertnstert.2018.05.006
12. Garmezy B, Gheeya J, Lin HY, Huang Y, Kim T, Jiang X, et al. Clinical and molecular characterization of POLE mutations as predictive biomarkers of response to immune checkpoint inhibitors in advanced cancers. JCO Precis Oncol. (2022) 6:e2100267. doi: 10.1200/PO.21.00267
13. Wang F, Zhao Q, Wang YN, Jin Y, He MM, Liu ZX, et al. Evaluation of POLE and POLD1 mutations as biomarkers for immunotherapy outcomes across multiple cancer types. JAMA Oncol. (2019) 5:1504. doi: 10.1001/jamaoncol.2019.2963
14. Rooney MS, Shukla SA, Wu CJ, Getz G, and Hacohen N. Molecular and genetic properties of tumors associated with local immune cytolytic activity. Cell. (2015) 160:48–61. doi: 10.1016/j.cell.2014.12.033
15. Wang C, Gong J, Tu TY, Lee PP, and Fakih M. Immune profiling of microsatellite instability-high and polymerase ϵ (POLE)-mutated metastatic colorectal tumors identifies predictors of response to anti-PD-1 therapy. J Gastrointest. Oncol. (2018) 9:404–15. doi: 10.21037/jgo.2018.01.09
16. Gong J, Wang C, Lee PP, Chu P, and Fakih M. Response to PD-1 blockade in microsatellite stable metastatic colorectal cancer harboring a POLE mutation. J Natl Compr Canc Netw. (2017) 15:142–7. doi: 10.6004/jnccn.2017.0016
17. Silberman R, Steiner DF, Lo AA, Gomez A, Zehnder JL, Chu G, et al. Complete and prolonged response to immune checkpoint blockade in POLE -mutated colorectal cancer. JCO Precis Oncol. (2019) 3:1–5. doi: 10.1200/PO.18.00214
18. Chen J and Lou H. Complete response to pembrolizumab in advanced colon cancer harboring somatic POLE F367S mutation with microsatellite stability status: A case study. OTT. (2021) 14:1791–6. doi: 10.2147/OTT.S300987
19. Ma X, Dong L, Liu X, Ou K, and Yang L. POLE/POLD1 mutation and tumor immunotherapy. J Exp Clin Cancer Res. (2022) 41:216. doi: 10.1186/s13046-022-02422-1
20. He C, Xu K, Zhu X, Dunphy PS, Gudenas B, Lin W, et al. Patient-derived models recapitulate heterogeneity of molecular signatures and drug response in pediatric high-grade glioma. Nat Commun. (2021) 12. doi: 10.1038/s41467-021-24168-8
21. Powley IR, Patel M, Miles G, Pringle H, Howells L, Thomas A, et al. Patient-derived explants (PDEs) as a powerful preclinical platform for anti-cancer drug and biomarker discovery. Br J Cancer. (2020) 122:735–44. doi: 10.1038/s41416-019-0672-6
22. Voabil P, De Bruijn M, Roelofsen LM, Hendriks SH, Brokamp S, Van Den Braber M, et al. An ex vivo tumor fragment platform to dissect response to PD-1 blockade in cancer. Nat Med. (2021) 27:1250–61. doi: 10.1038/s41591-021-01398-3
23. Kokkinos J, Sharbeen G, Haghighi KS, Ignacio RMC, Kopecky C, Gonzales-Aloy E, et al. Ex vivo culture of intact human patient derived pancreatic tumour tissue. Sci Rep. (2021) 11:1944. doi: 10.1038/s41598-021-81299-0
24. Nguyen DT, Famiglietti JE, Smolchek RA, Dupee Z, Diodati N, Pedro DI, et al. 3D in vitro platform for cell and explant culture in liquid-like solids. Cells. (2022) 11:1–15. doi: 10.3390/cells11060967
25. Schaller MA, Sharma Y, Dupee Z, Nguyen D, Urueña J, Smolchek R, et al. Ex vivo SARS-CoV-2 infection of human lung reveals heterogeneous host defense and therapeutic responses. JCI Insight. (2021) 6. doi: 10.1172/jci.insight.148003
26. Eduati F, Utharala R, Madhavan D, Neumann UP, Longerich T, Cramer T, et al. A microfluidics platform for combinatorial drug screening on cancer biopsies. Nat Commun. (2018) 9:2434. doi: 10.1038/s41467-018-04919-w
27. Law AMK, Chen J, Colino‐Sanguino Y, Fuente LRDL, Fang G, Grimes SM, et al. ALTEN: A high-fidelity primary tissue-engineering platform to assess cellular responses ex vivo. Advanced Sci. (2022) 9:2103332. doi: 10.1002/advs.202103332
28. Nguyen DT, Liu R, Ogando-Rivas E, Pepe A, Pedro D, Qdaisat S, et al. Bioconjugated liquid-like solid enhances characterization of solid tumor - chimeric antigen receptor T cell interactions. Acta Biomaterialia. (2023). doi: 10.1016/j.actbio.2023.09.042
29. Dijkstra KK, Cattaneo CM, Weeber F, Chalabi M, van de Haar J, Fanchi LF, et al. Generation of tumor-reactive T cells by co-culture of peripheral blood lymphocytes and tumor organoids. Cell. (2018) 174:1586–1598.e12. doi: 10.1016/j.cell.2018.07.009
30. Neal JT, Li X, Zhu J, Giangarra V, Grzeskowiak CL, Ju J, et al. Organoid modeling of the tumor immune microenvironment. Cell. (2018) 175:1972–1988.e16. doi: 10.1016/j.cell.2018.11.021
31. Freed D, Aldana R, Weber JA, and Edwards JS. The Sentieon Genomics Tools - A fast and accurate solution to variant calling from next-generation sequence data. Bioinformatics. (2017). doi: 10.1101/115717
32. Benjamin D, Sato T, Cibulskis K, Getz G, Stewart C, and Lichtenstein L. Calling somatic SNVs and indels with mutect2. Bioinformatics. (2019). doi: 10.1101/861054
33. Sherry ST, Ward M, and Sirotkin K. dbSNP—Database for single nucleotide polymorphisms and other classes of minor genetic variation. Genome Res. (1999) 9:677–9. doi: 10.1101/gr.9.8.677
34. Tate JG, Bamford S, Jubb HC, Sondka Z, Beare DM, Bindal N, et al. COSMIC: the catalogue of somatic mutations in cancer. Nucleic Acids Res. (2019) 47:D941–7. doi: 10.1093/nar/gky1015
35. McLaren W, Gil L, Hunt SE, Riat HS, Ritchie GRS, Thormann A, et al. The ensembl variant effect predictor. Genome Biol. (2016) 17:122. doi: 10.1186/s13059-016-0974-4
36. Mayakonda A, Lin D-C, Assenov Y, Plass C, and Koeffler HP. Maftools: efficient and comprehensive analysis of somatic variants in cancer. Genome Res. (2018) 28:1747–56. doi: 10.1101/gr.239244.118
37. Imboden S, Nastic D, Ghaderi M, Rydberg F, Rau TT, Mueller MD, et al. Phenotype of POLE-mutated endometrial cancer. PloS One. (2019) 14:e0214318. doi: 10.1371/journal.pone.0214318
38. Stenzinger A, Pfarr N, Endris V, Penzel R, Jansen L, Wolf T, et al. Mutations in POLE and survival of colorectal cancer patients – link to disease stage and treatment. Cancer Med. (2014) 3:1527–38. doi: 10.1002/cam4.305
39. Lawrence M S, Stojanov P, Mermel C H, Robinson J T, Garraway L A, Golub T R, et al. Discovery and saturation analysis of cancer genes across 21 tumour types. Nature. (2014) 505:495–501. doi: 10.1038/nature12912
40. Kotsakis A, Harasymczuk M, Schilling B, Georgoulias V, Argiris A, and Whiteside TL. Myeloid-derived suppressor cell measurements in fresh and cryopreserved blood samples. J Immunol Methods. (2012) 381:14–22. doi: 10.1016/j.jim.2012.04.004
41. Siemińska I, Węglarczyk K, Walczak M, Czerwińska A, Pach R, Rubinkiewicz M, et al. Mo-MDSCs are pivotal players in colorectal cancer and may be associated with tumor recurrence after surgery. Trans Oncol. (2022) 17:101346. doi: 10.1016/j.tranon.2022.101346
42. Li K, Shi H, Zhang B, Ou X, Ma Q, Chen Y, et al. Myeloid-derived suppressor cells as immunosuppressive regulators and therapeutic targets in cancer. Sig Transduct Target Ther. (2021) 6:362. doi: 10.1038/s41392-021-00670-9
43. Johnson B. Targeting myeloid-derived suppressor cell trafficking as a novel immunotherapeutic approach in microsatellite stable colorectal cancer. Cancers. (2023) 15:5484. doi: 10.3390/cancers15225484
44. Wang X, Scarfò I, Schmidts A, Toner M, Maus MV, and Irimia D. Dynamic profiling of antitumor activity of CAR T cells using micropatterned tumor arrays. Advanced Sci. (2019) 6. doi: 10.1002/advs.201901829
45. ChatGPT said: Sahoo P, Yang X, Abler D, Maestrini D, Adhikarla V, Frankhouser D, et al. Mathematical deconvolution of CAR T-cell proliferation and exhaustion from real-time killing assay data. J R Soc Interface. (2020) 17. doi: 10.1098/rsif.2019.0734
46. León‐Castillo A, Britton H, McConechy MK, McAlpine JN, Nout R, Kommoss S, et al. Interpretation of somatic POLE mutations in endometrial carcinoma. J Pathol. (2020) 250:323–35. doi: 10.1002/path.5372
47. Giannakis M, Mu XJ, Shukla SA, Qian ZR, Cohen O, Nishihara R, et al. Genomic correlates of immune-cell infiltrates in colorectal carcinoma. Cell Rep. (2016) 15:857–65. doi: 10.1016/j.celrep.2016.03.075
48. Siddiqui I, Schaeuble K, Chennupati V, Fuertes Marraco SA, Calderon-Copete S, Pais Ferreira D, et al. Intratumoral tcf1+PD-1+CD8+ T cells with stem-like properties promote tumor control in response to vaccination and checkpoint blockade immunotherapy. Immunity. (2019) 50:195–211.e10. doi: 10.1016/j.immuni.2018.12.021
49. Yost KE, Satpathy AT, Wells DK, Qi Y, Wang C, Kageyama R, et al. Clonal replacement of tumor-specific T cells following PD-1 blockade. Nat Med. (2019) 25:1251–9. doi: 10.1038/s41591-019-0522-3
50. Wu TD, Madireddi S, DeAlmeida PE, Banchereau R, Chen YJJ, Chitre AS, et al. Peripheral T cell expansion predicts tumour infiltration and clinical response. Nature. (2020) 579:274–8. doi: 10.1038/s41586-020-2056-8
51. Zhang J, Ji Z, Caushi JX, ElAsmar M, Anagnostou V, Cottrell TR, et al. Compartmental analysis of T-cell clonal dynamics as a function of pathologic response to neoadjuvant PD-1 blockade in resectable non–small cell lung cancer. Clin Cancer Res. (2020) 26:1327–37. doi: 10.1158/1078-0432.CCR-19-2931
52. Pauken KE, Sammons MA, Odorizzi PM, Manne S, Godec J, Khan O, et al. Epigenetic stability of exhausted T cells limits durability of reinvigoration by PD-1 blockade. Science. (2016) 354:1160–5. doi: 10.1126/science.aaf2807
53. Ghoneim HE, Fan Y, Moustaki A, Abdelsamed HA, Dash P, Dogra P, et al. De novo epigenetic programs inhibit PD-1 blockade-mediated T cell rejuvenation. Cell. (2017) 170:142–157.e19. doi: 10.1016/j.cell.2017.06.007
54. Pai JA, Hellmann MD, Sauter JL, Mattar M, Rizvi H, Woo HJ, et al. Lineage tracing reveals clonal progenitors and long-term persistence of tumor-specific T cells during immune checkpoint blockade. Cancer Cell. (2023) 41:776–790.e7. doi: 10.1016/j.ccell.2023.03.009
55. Spitzer MH, Carmi Y, Reticker-Flynn NE, Kwek SS, Madhireddy D, Martins MM, et al. Systemic immunity is required for effective cancer immunotherapy. Cell. (2017) 168:487–502.e15. doi: 10.1016/j.cell.2016.12.022
56. Sakuishi K, Apetoh L, Sullivan JM, Blazar BR, Kuchroo VK, and Anderson AC. Targeting Tim-3 and PD-1 pathways to reverse T cell exhaustion and restore anti-tumor immunity. J Exp Med. (2010) 207:2187–94. doi: 10.1084/jem.20100643
57. OuYang L-Y, Wu X-J, Ye S-B, Zhang R, Li Z-L, Liao W, et al. Tumor-induced myeloid-derived suppressor cells promote tumor progression through oxidative metabolism in human colorectal cancer. J Transl Med. (2015) 13:47. doi: 10.1186/s12967-015-0410-7
58. Zhang B, Wang Z, Wu L, Zhang M, Li W, Ding J, et al. Circulating and tumor-infiltrating myeloid-derived suppressor cells in patients with colorectal carcinoma. PloS One. (2013) 8:e57114. doi: 10.1371/journal.pone.0057114
59. El-Khoueiry AB, Fakih M, Gordon MS, Tsimberidou AM, Bullock AJ, Wilky BA, et al. Results from a phase 1a/1b study of botensilimab (BOT), a novel innate/adaptive immune activator, plus balstilimab (BAL; anti-PD-1 antibody) in metastatic heavily pretreated microsatellite stable colorectal cancer (MSS CRC). JCO. (2023) 41:LBA8–8. doi: 10.1200/JCO.2023.41.4_suppl.LBA8
Keywords: colorectal cancer, CRC, microsatellite instability, immune checkpoint inhibitor, immunotherapy, anti-PD-1, patient-derived explants, ex vivo
Citation: Nguyen DT, Schaller MA, Terracina KP, Xu X, Pedro DI, Pepe A, Urueña JM, Dupee Z, Diodati N, Smolchek RA, Famiglietti JE, Nguyen NTY, Tushoski-Alemán GW, Cheng K, Chen L, Linn D, Vidimar V, Fatima A, Kwon SW, Sun D, Chen H, Xu H, Long B, Moy LY, Howell BJ, Addona GH and Sawyer WG (2025) Patient-derived colorectal microtumors predict response to anti-PD-1 therapy. Front. Immunol. 16:1640500. doi: 10.3389/fimmu.2025.1640500
Received: 03 June 2025; Accepted: 22 July 2025;
Published: 12 August 2025.
Edited by:
Talita Glaser, Rutgers, The State University of New Jersey, United StatesCopyright © 2025 Nguyen, Schaller, Terracina, Xu, Pedro, Pepe, Urueña, Dupee, Diodati, Smolchek, Famiglietti, Nguyen, Tushoski-Alemán, Cheng, Chen, Linn, Vidimar, Fatima, Kwon, Sun, Chen, Xu, Long, Moy, Howell, Addona and Sawyer. This is an open-access article distributed under the terms of the Creative Commons Attribution License (CC BY). The use, distribution or reproduction in other forums is permitted, provided the original author(s) and the copyright owner(s) are credited and that the original publication in this journal is cited, in accordance with accepted academic practice. No use, distribution or reproduction is permitted which does not comply with these terms.
*Correspondence: Duy T. Nguyen, ZHV5Lm5ndXllbkBtb2ZmaXR0Lm9yZw==
†Present address: Department of Bioengineering, Moffitt Cancer Center, Tampa, FL, United States