 Xinyi Song
 Qin Yang
 Yuye Wang
 Ning Yu
- 1Department of Dermatology, Shanghai Skin Disease Hospital, Institute of Psoriasis, Tongji University School of Medicine, Shanghai, China
- 2Department of Dermatology, Huashan Hospital, Fudan University, Shanghai, China
Background: Psoriasis severity and symptoms are widely known to vary seasonally. However, evidence on the impact of seasonality on treatment outcomes is limited, with vague season definitions. It also remains unclear whether seasons represent static meteorological levels or dynamic trends.
Objective: To assess the impact of a novel temperature trend-defined seasonality on psoriasis treatment responses at 2 and 3 months.
Methods: Data were derived from the Shanghai Psoriasis Effectiveness Evaluation CoHort (SPEECH), a prospective, multicenter registry assessing the effectiveness of biologics (adalimumab, ustekinumab, secukinumab and ixekizumab), conventional systemic therapies (acitretin and methotrexate), and phototherapy. Patients were categorized into warming (consistent temperature increase), transition (non-unidirectional changes), and cooling (consistent temperature decrease) groups based on ambient temperature trends during the treatment period. Effectiveness was defined as achieving Psoriasis Area and Severity Index (PASI) 75 (≥ 75% improvement in PASI), PASI 90 (≥ 90% improvement in PASI), Physician’s Global Assessment (PGA) of 0/1, and Dermatology Quality of Life Index minimal important difference (DLQI MID) (≥ 4 points improvement) at 2 and 3 months. Covariate balancing propensity score (CBPS) weighting was applied to balance baseline covariates, and odds ratios (ORs) with 95% confidence intervals (CIs) were estimated. Interaction analyses evaluated potential factors that may stratify treatment response.
Results: In the 3-month analysis of 1411 patients, the cooling group showed significantly lower odds of achieving PASI 75 (adjusted OR 0.70, 95% CI 0.61–0.80, P <.001), PASI 90 (adjusted OR 0.68, 95% CI 0.59–0.79, P <.001), PGA 0/1 (adjusted OR 0.65, 95% CI 0.57–0.75, P <.001), and DLQI MID (adjusted OR 0.86, 95% CI 0.75–0.99, P = .032) compared to the warming group. The transition group showed intermediate outcomes. Body mass index (BMI) significantly modified treatment effectiveness, with higher BMI associated with poorer responses, whereas treatment type did not alter the seasonal effect. Findings were largely consistent at 2 months.
Conclusions: Cooling trends are associated with reduced treatment efficacy independently of static temperature, humidity, and ultraviolet levels. This BMI-modified effect underscores the importance of personalized management strategies addressing both environmental and patient-specific factors.
Highlights
● Psoriasis severity is widely recognized, with evidence showing it exhibits seasonal variation.
● Evidence comparing the effectiveness of systemic therapies in psoriasis patients across different seasons is lacking.
● It remains unclear whether the influence of seasons on psoriasis is driven by static meteorological levels or dynamic trends.
● This study introduced a novel classification of seasons based on temperature trends, categorizing the treatment period into warming, transition, and cooling groups.
● Patients in the cooling group exhibited reduced treatment effectiveness, independent of temperature, humidity, and ultraviolet levels during treatment.
● Patients with higher body mass index (BMI) showed a poorer response to the cooling season relative to the warming season, compared to patients with lower BMI.
Introduction
Psoriasis is a chronic, recurrent inflammatory skin disease affecting 2% to 4% of the global population, with prevalence varying significantly across regions and countries (1). While the pathogenesis of psoriasis remains unclear, environmental factors play a substantial role in triggering and exacerbating the disease (2, 3). These factors include infections (4), lifestyle (5), medications (6), and seasonality (7). Investigating these environmental risk factors and their influence on disease severity, progression, and treatment outcomes is crucial for guiding patient-centered, individualized care and advancing understanding of psoriasis pathogenesis.
Seasonality is widely believed to influence psoriasis. In the United States, dermatology visits for psoriasis increase by 50% in winter compared to summer (8). Similarly, a New England study observed symptom improvement in summer and worsening in winter (9). Globally, internet searches for psoriasis peak in late winter or early spring and decline by late summer (10). However, this seasonal pattern is not consistently supported across studies (11, 12). Most existing research is descriptive, and longitudinal data on the impact of seasonality on systemic therapy effectiveness for psoriasis remain scarce.
The lack of standardized season definitions complicates the interpretation of seasonal effects on psoriasis. Calendar-based methods tied to fixed dates often fail to reflect actual climatic changes or regional variability. To accurately assess the impact of seasonality on treatment outcomes in psoriasis patients, seasons must be precisely defined. Additionally, it remains unclear whether seasons represent static meteorological factors, such as average temperature, ultraviolet (UV) radiation and humidity, or dynamic trends over time. While static measures offer snapshots of conditions, they may overlook the impact of changes influencing disease progression, whereas dynamic trends better capture the environmental stressors affecting patients.
The Shanghai Psoriasis Effectiveness Evaluation CoHort (SPEECH) is a prospective, multicentre, observational registry designed to evaluate the clinical outcomes and safety of phototherapy, conventional systemic therapies, and biologics in patients with psoriasis (13). Using data from SPEECH, this study introduces a novel method of defining seasonality based on annual temperature variation trends. By categorizing treatment windows into warming, transition, and cooling groups, we aim to evaluate the influence of temperature trend-defined seasonality on treatment outcomes in psoriasis patients.
Methods
Data source
The design and follow-up protocol of the Shanghai Psoriasis Effectiveness Evaluation CoHort (SPEECH) have been previously described (13). SPEECH is a prospective, multicentre registry established in 2020 to evaluate the comparative effectiveness of systemic therapies and phototherapy in patients with chronic plaque psoriasis. Ethical approval was obtained from the Institutional Review Boards of all participating sites, and all participants provided written informed consent.
Study population and design
Patients enrolled in the SPEECH registry between November 2020 and June 2023 were included. Eligible participants were ≥ 18 years old, had chronic plaque psoriasis with PASI ≥ 5, and were receiving monotherapy with acitretin, methotrexate, phototherapy, adalimumab, ustekinumab, guselkumab, secukinumab, or ixekizumab. Treatment allocation was not randomized; therapy selection reflected real−world clinical practice, based on disease severity, comorbidities, guideline recommendations, and patient preference.
To ensure treatment−naïve conditions, patients with conventional systemic therapy or phototherapy within the previous 4 weeks or biologic therapy within the previous 12 weeks were excluded. Only patients with a minimum follow−up of 2 or 3 months were included in the analysis, ensuring ≥ 1 month of active treatment exposure.
Patients were enrolled at treatment initiation and followed prospectively according to the registry protocol across seven dermatology centers in Shanghai, China. Standard follow−up visits occurred at 4, 8, 12, 20, 28, 36, 44, and 52 weeks after enrollment. PASI, PGA, and DLQI were assessed at each visit, and PASI scoring was conducted by a dedicated assessment group composed of trained psoriasis specialists at each site, ensuring consistency and reliability across centers.
Each patient was enrolled once per treatment episode. Patients who switched systemic therapy could be re−enrolled as a new treatment episode, with the registry using unique enrollment IDs linked to national ID numbers to prevent duplicate enrollment. For this analysis, switching to a new therapy during follow−up did not result in a separate analytic entry, ensuring that no patient was analyzed multiple times.
The primary endpoint of this cohort study was the proportion of patients achieving PASI 75 (≥ 75% improvement from baseline) at 12 weeks (3 months). Secondary endpoints included PASI 90, PGA 0/1 (clear or almost clear skin), and DLQI minimal important difference (MID, ≥ 4−point reduction), evaluated at 12 and 52 weeks. Absolute PASI < 3 was analyzed as a post hoc exploratory endpoint, as absolute thresholds provide complementary insight into disease control in heterogeneous real−world populations.
If treatment goals were not achieved, clinicians could adjust therapy according to real−world clinical judgment, including dose optimization or interval shortening, switching to a biologic with a different mechanism of action, or initiating combination therapy (e.g., adding phototherapy or a conventional systemic agent). These strategies ensured that treatment was personalized and responsive to individual patient outcomes.
Temperature data collection
The periodic temperature variations during the SPEECH study (2020–2023) were sourced from the National Meteorological Information Center (https://data.cma.cn/), providing monthly ambient temperature records for Shanghai (31°12’N, 121°30’E). These data were utilized to analyze temperature trends throughout the treatment period. Figure 1A presents a schematic diagram of monthly temperature trends, illustrating how the year can be broadly divided into a temperature-increasing and a temperature-decreasing season based on annual variation patterns.
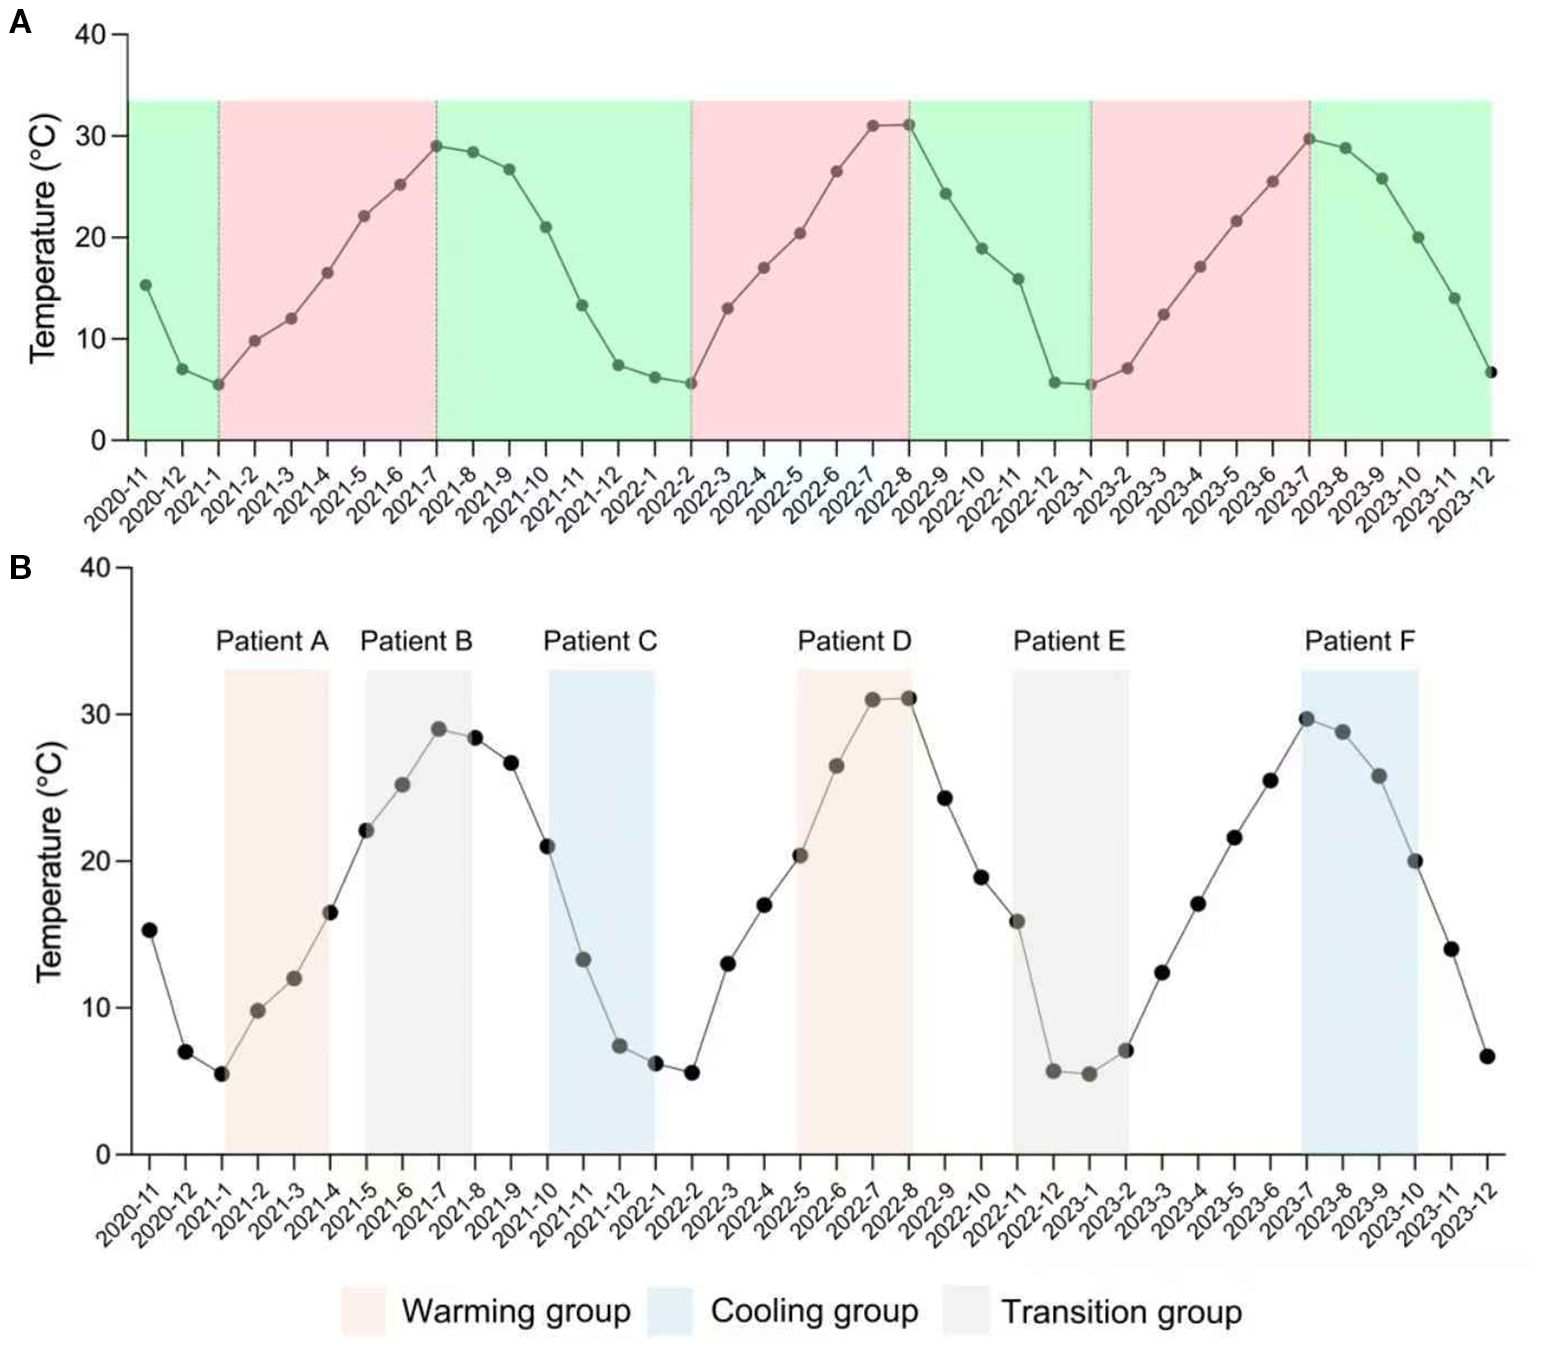
Figure 1. Definition of warming, cooling, and transition groups. (A) Monthly mean temperature during the actual study period (November 2020 – December 2023). (B) Example of patient assignment to exposure groups using a 12−week analysis window. Only patients with both a defined baseline and 12−week follow−up date were included. Each patient’s treatment period was mapped to the temperature curve to determine the exposure group: Patients A and D fall into the warming group, Patients C and F into the cooling group, and Patients B and E into the transition group.
Exposure
Patients were categorized into warming, transition, and cooling groups based on temperature trends during the 2- and 3-month treatment windows. The warming group included patients whose treatment windows showed strictly monotonic increases in monthly mean temperature across consecutive months. The cooling group included those with strictly monotonic decreases over the same period. The transition group comprised patients whose windows exhibited any non-monotonic pattern, such as an increase followed by a decrease or vice versa. Because treatment start and end dates could be directly matched to the corresponding meteorological data, each patient’s exposure window was manually assigned to the appropriate category to ensure accurate classification (Figure 1B).
Outcomes
Clinical outcomes were assessed using PASI, the Physician’s Global Assessment (PGA, scored 0 to 4), and the Dermatology Life Quality Index (DLQI), a 10-item patient-reported questionnaire with a total score range of 0 to 30. Key measures included PASI 75 (≥ 75% improvement in PASI), PASI 90 (≥ 90% improvement in PASI), a PGA score of 0 or 1 (indicating clear or almost clear skin), and a DLQI minimal important difference (MID), defined as a reduction of ≥ 4 points. These outcomes were evaluated at 2- and 3-month visits to determine treatment effectiveness and quality of life improvements. In addition, absolute PASI < 3 was evaluated as an exploratory endpoint, as absolute thresholds are particularly informative in real−world registry studies with heterogeneous baseline severity and variable treatment histories.
Covariates
We considered a broad range of potential confounders, including age at treatment initiation, sex, body mass index (BMI), disease duration (calculated from treatment initiation), treatment history, such as prior use of biologics, non-biologic systemic therapies, and phototherapy, smoking status, family history of psoriasis, psoriatic arthritis, comorbidities including cardiovascular disease, diabetes, non-alcoholic fatty liver disease (NAFLD), hypertension, hyperlipidemia, and hyperuricemia, baseline PASI, PGA, DLQI scores, as well as mean temperature, mean UV index, and mean humidity during treatment.
Statistical analysis
Baseline patient and meteorological characteristics were compared across exposure groups using absolute standardized differences, with a threshold of > 0.1 indicating imbalance. Covariate balancing propensity score (CBPS) weighting, implemented via the “CBPS” R package (14, 15), was applied to address baseline imbalances. The CBPS model included covariates such as age, sex, BMI, disease duration, treatment history (prior use of biologics, non-biologic systemic therapies, phototherapy), smoking status, family history of psoriasis, psoriatic arthritis, comorbidities (e.g., cardiovascular disease, diabetes, NAFLD, hypertension, hyperlipidemia, hyperuricemia), baseline PASI, PGA, and DLQI scores, as well as mean temperature, mean UV index, and mean humidity during treatment. Mean temperature and mean UV index were not included simultaneously as independent variables in the CBPS model due to multicollinearity. After weighting, standardized differences were reassessed to confirm covariate balance.
Generalized linear models with a logit link were used, incorporating CBPS weighting, to estimate odds ratios (ORs) with 95% confidence intervals (CIs). To further interpret effect sizes, risk differences (RDs) and numbers needed to treat (NNTs) were calculated for PASI 75, PASI 90, PGA 0/1, and DLQI MID outcomes at 2 and 3 months (16). RDs and their 95% CIs were derived using generalized linear models with an identity link function, with NNTs calculated as the reciprocal of the RDs.
Sensitivity analyses
A series of sensitivity analyses were performed for PASI 75, PASI 90, PGA 0/1, and DLQI MID outcomes at 2 and 3 months to ensure robustness: (1) Replacing mean temperature with mean UV index in the CBPS model; (2) Truncating CBPS weights at the 5th and 95th percentiles; (3) Excluding patients undergoing phototherapy; (4) Excluding patients exposed to mean temperatures ≤ 10th percentile; and (5) Excluding patients with baseline PASI scores in the ≥ 90th percentile.
E-value
To evaluate the robustness of findings against potential unmeasured confounders, we calculated the E-value, representing the minimum strength of association, on the risk ratio scale, that an unmeasured confounder would require with both the exposure and outcome to fully explain the observed results after adjusting for covariates (17). For context, the E-value was compared to the strength of associations for select observed covariates. Calculations were performed using the ‘EValue’ package (Version 4.1.3) in R.
Interaction analysis
Interactions between temperature trend (the cooling group vs. the warming group) and other covariates for PASI 75 at 2 and 3 months were analyzed to assess potential effect modification. Effect modification was assessed on the multiplicative scale using the ratio of ORs and on the additive scale using differences in RDs. All analyses were conducted using multivariable regression analysis with explicit adjustment for all covariates to ensure robust and unbiased estimates.
Multiple imputation
To address missing data, multiple imputation by chained equations (MICE) was applied to generate 20 imputed datasets, including missing outcomes (PGA 0/1 and DLQI MID) and baseline covariates (18). Each imputed dataset was independently analyzed using the CBPS approach. The results from all 20 imputed datasets were then pooled using Rubin’s rules to produce a single set of adjusted OR estimates, standard errors, and 95% CIs, ensuring robustness and reliability despite incomplete data. The multiple imputation analysis was carried out using the 'mice' package (Version 3.16.0) and 'mitools' (Version 2.4) in R.
All statistical analyses were conducted with R (version 4.4.1, R Foundation for Statistical Computing, Vienna, Austria). A P-value of less than 0.05 was regarded as statistically significant. To control the family-wise type I error rate at the 5% level, the Hommel method was applied to adjust the P-values for the outcomes assessed at 3 months (19).
Results
Baseline characteristics
In the 3-month analysis, a total of 1411 psoriasis patients were included (Figure 2), distributed into warming (n = 313), transition (n = 548), and cooling (n = 550) groups based on temperature trends. Before CBPS adjustment, notable imbalances were observed in meteorological metrics, including mean temperature, UV index, and humidity during treatment. Other variables, such as exacerbation seasons and biologic treatment types, showed moderate imbalances. After CBPS weighting, all covariates achieved precise balance, with absolute standardized differences reduced to less than 0.001, ensuring comparability across groups (Table 1). Baseline characteristics of patients included in the 2-month analysis are provided in Supplementary Table S1 (see Supplementary Material). Missing data for baseline covariates were below 10%, and there was no missing data for PASI 75 and PASI 90 outcomes (Supplementary Table S2; see Supplementary Material).
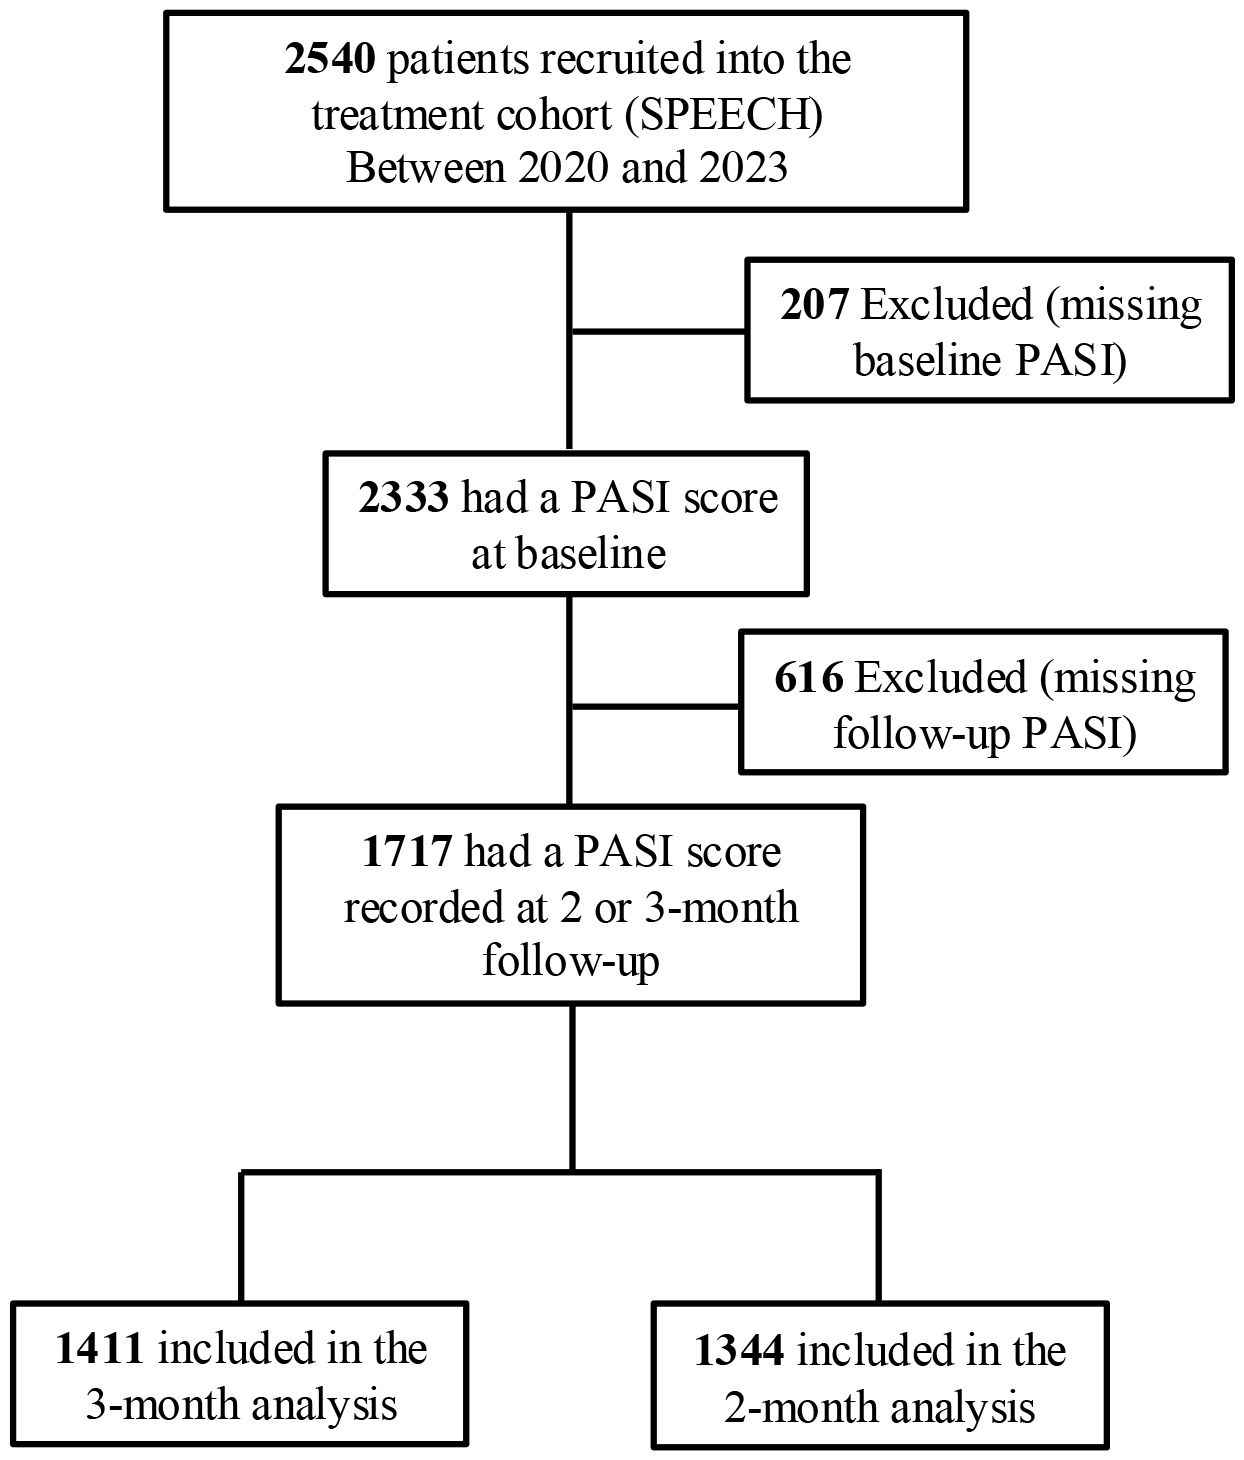
Figure 2. Identification of eligible patients and development of cohorts in the study. SPEECH, Shanghai Psoriasis Effectiveness Evaluation CoHort; PASI, Psoriasis Area and Severity Index.
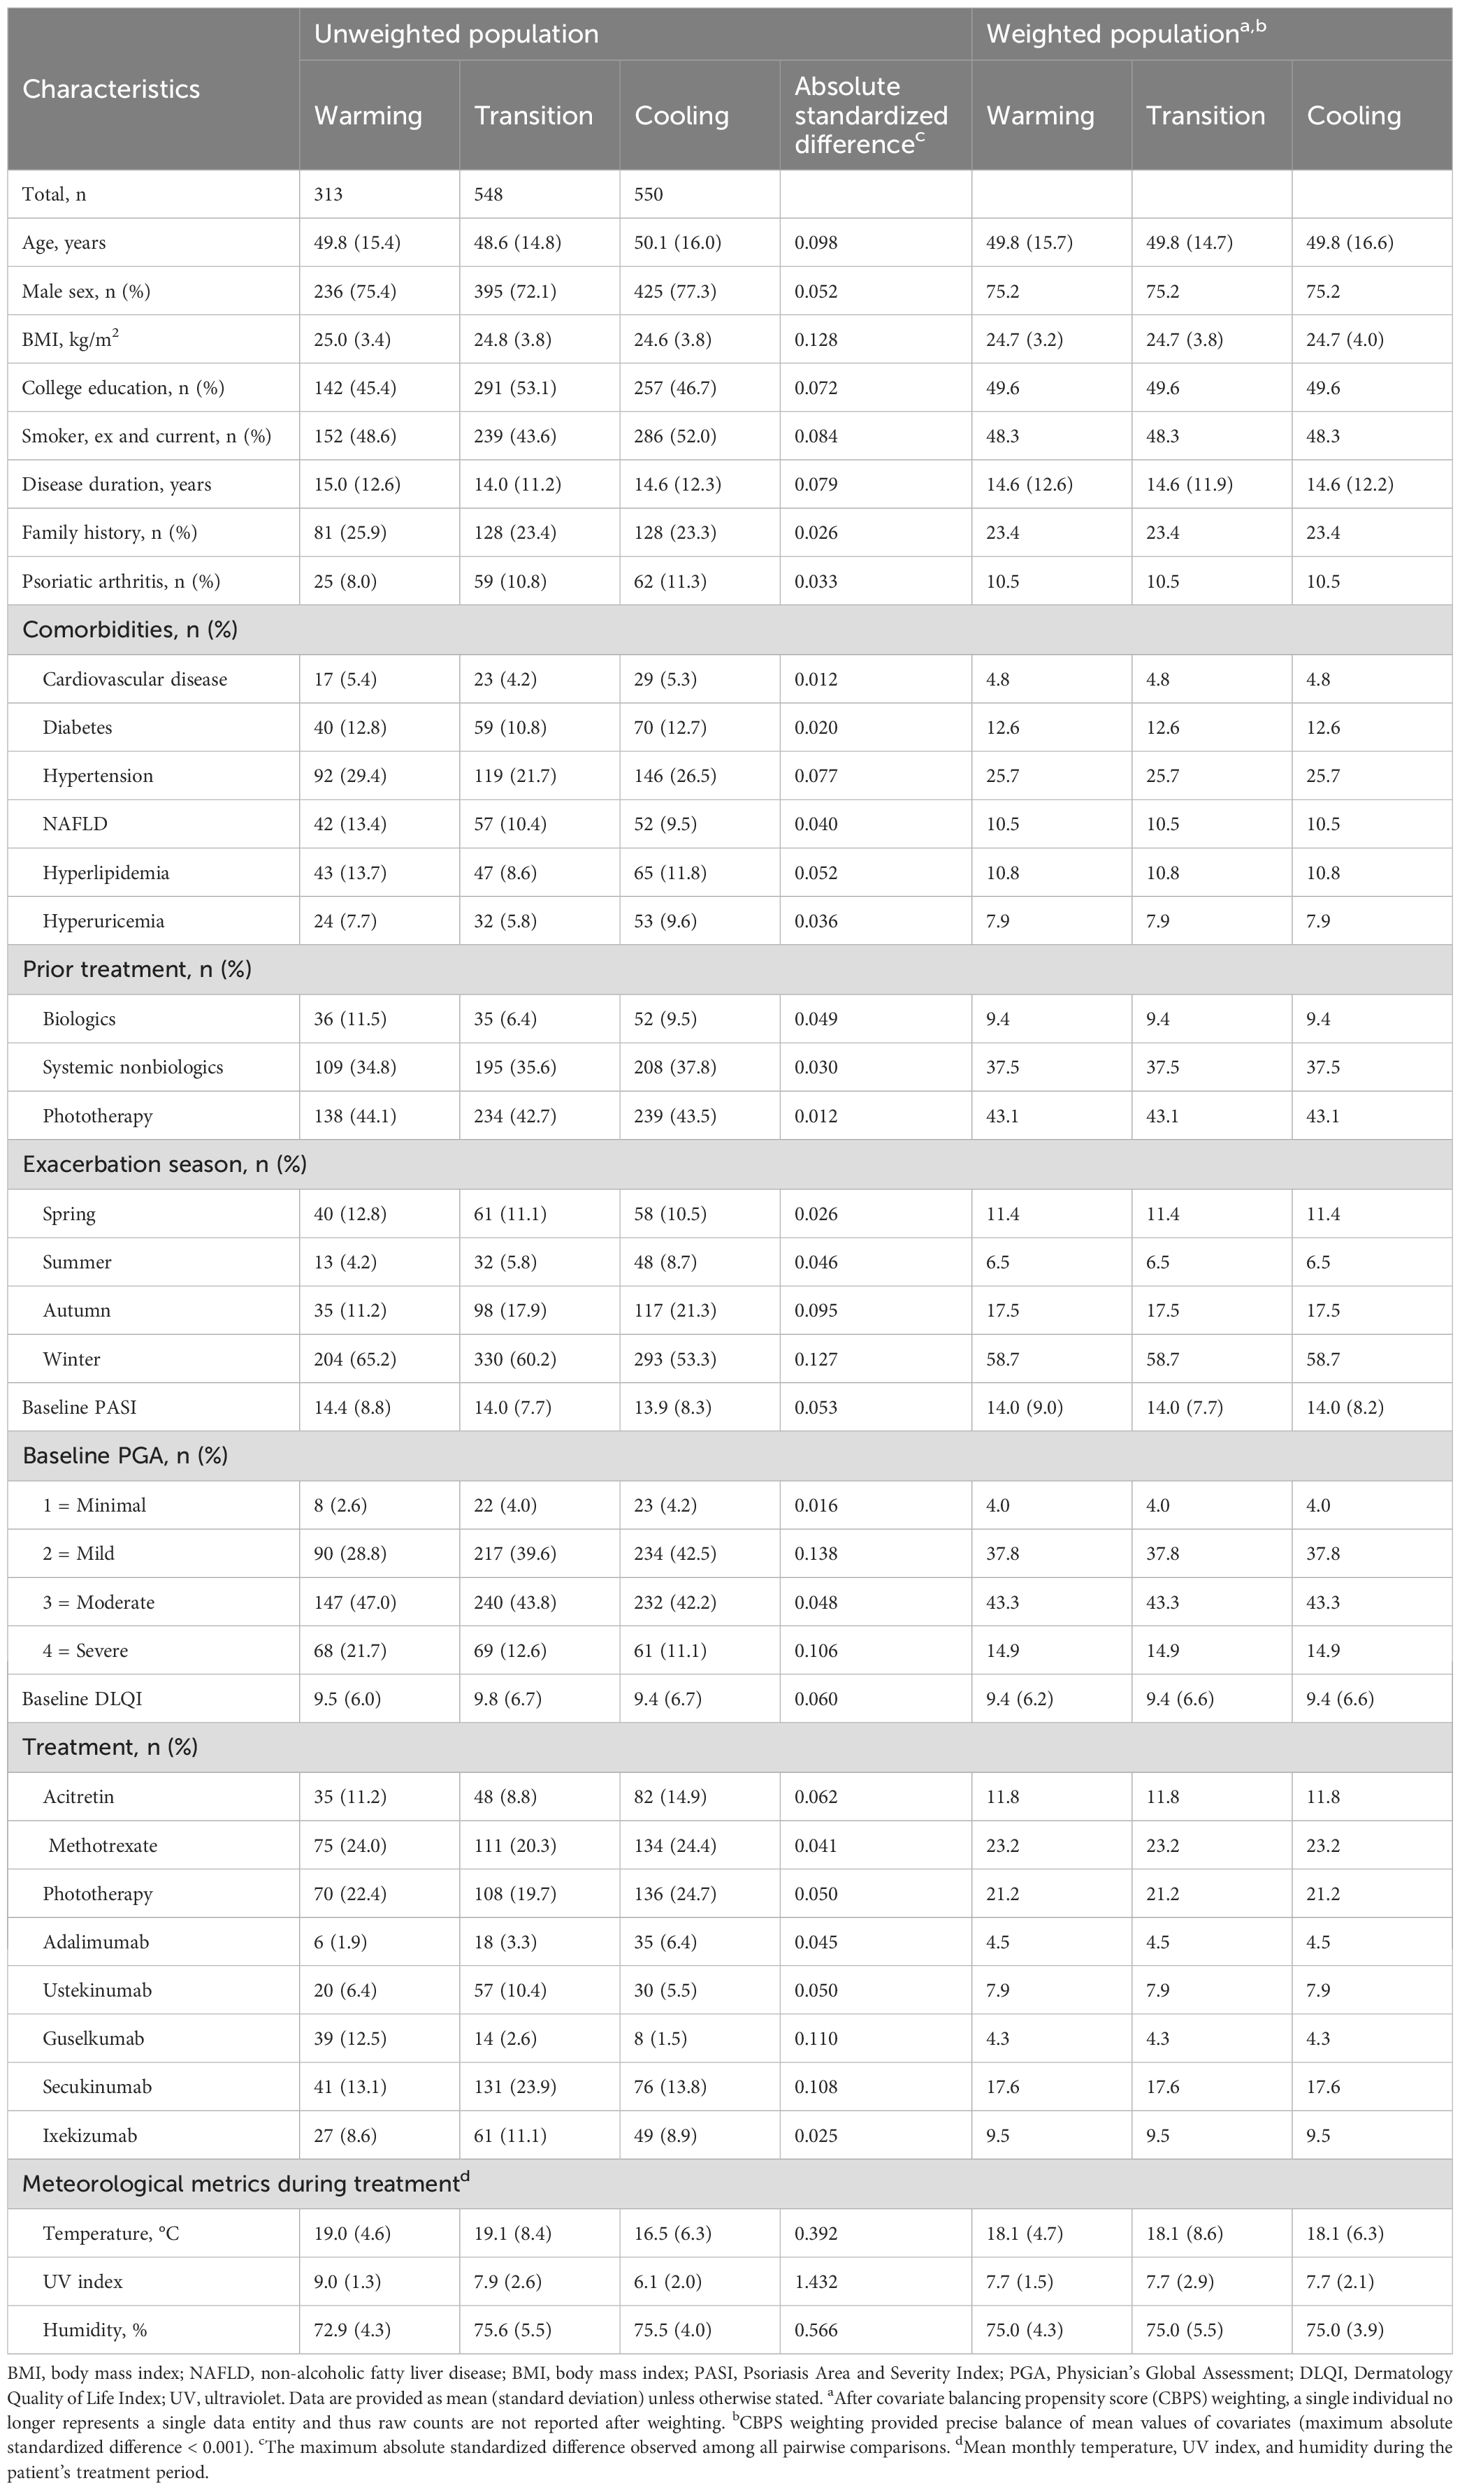
Table 1. Patient demographic and clinical characteristics at baseline.
Outcomes
Unadjusted and adjusted analyses assessed response rates and ORs for PASI 75, PASI 90, PGA 0/1, and DLQI MID across warming, transition, and cooling groups at 3 months (Table 2). Response rates for PASI 75 were 58.0%, 57.3%, and 49.2% for warming, transition, and cooling groups, respectively. Adjusted analyses revealed significantly lower odds for the cooling group compared to the warming group (adjusted OR 0.70, 95% CI 0.61–0.80, P <.001), while the transition group showed no significant difference (adjusted OR 0.97, 95% CI 0.84–1.11, P = .671). For PASI 90, response rates were 37.4%, 34.7%, and 28.9%, respectively, with the cooling group showing reduced odds (adjusted OR 0.68, 95% CI 0.59–0.79, P <.001) compared to the warming group, while the transition group again showed no significant difference (adjusted OR 0.89, 95% CI 0.77–1.02, P = .100). For absolute PASI < 3, response rates were 47.2%, 44.1%, and 38.5% in the warming, transition, and cooling groups, respectively. Patients in the cooling group had significantly reduced odds of achieving PASI < 3 (adjusted OR 0.69, 95% CI 0.57–0.76; P < .001), whereas the transition group showed no significant difference compared with the warming group (adjusted OR 0.92, 95% CI 0.74–1.01; P = .733). PGA 0/1 response rates were 64.3%, 60.4%, and 54.0%, with the cooling group demonstrating significantly lower odds (adjusted OR 0.65, 95% CI 0.57–0.75, P <.001) compared to the warming group, and the transition group showing slightly reduced odds (adjusted OR 0.85, 95% CI 0.74–0.98, P = .023). For DLQI MID, response rates were 54.2%, 54.7%, and 50.5%, with the cooling group showing significantly lower odds (adjusted OR 0.86, 95% CI 0.75–0.99, P = .032), and no significant difference for the transition group (adjusted OR 1.02, 95% CI 0.89–1.17, P = .786). After multiplicity adjustment, the results for PASI 75, PASI 90, and PGA 0/1 remained statistically significant (Hommel-adjusted P <.001). Additionally, a linear trend was observed across the warming, transition, and cooling groups, with treatment effectiveness progressively decreasing from the warming to the cooling group. Consistent patterns were observed in the 2-month analysis (Supplementary Table S3; see Supplementary Material).
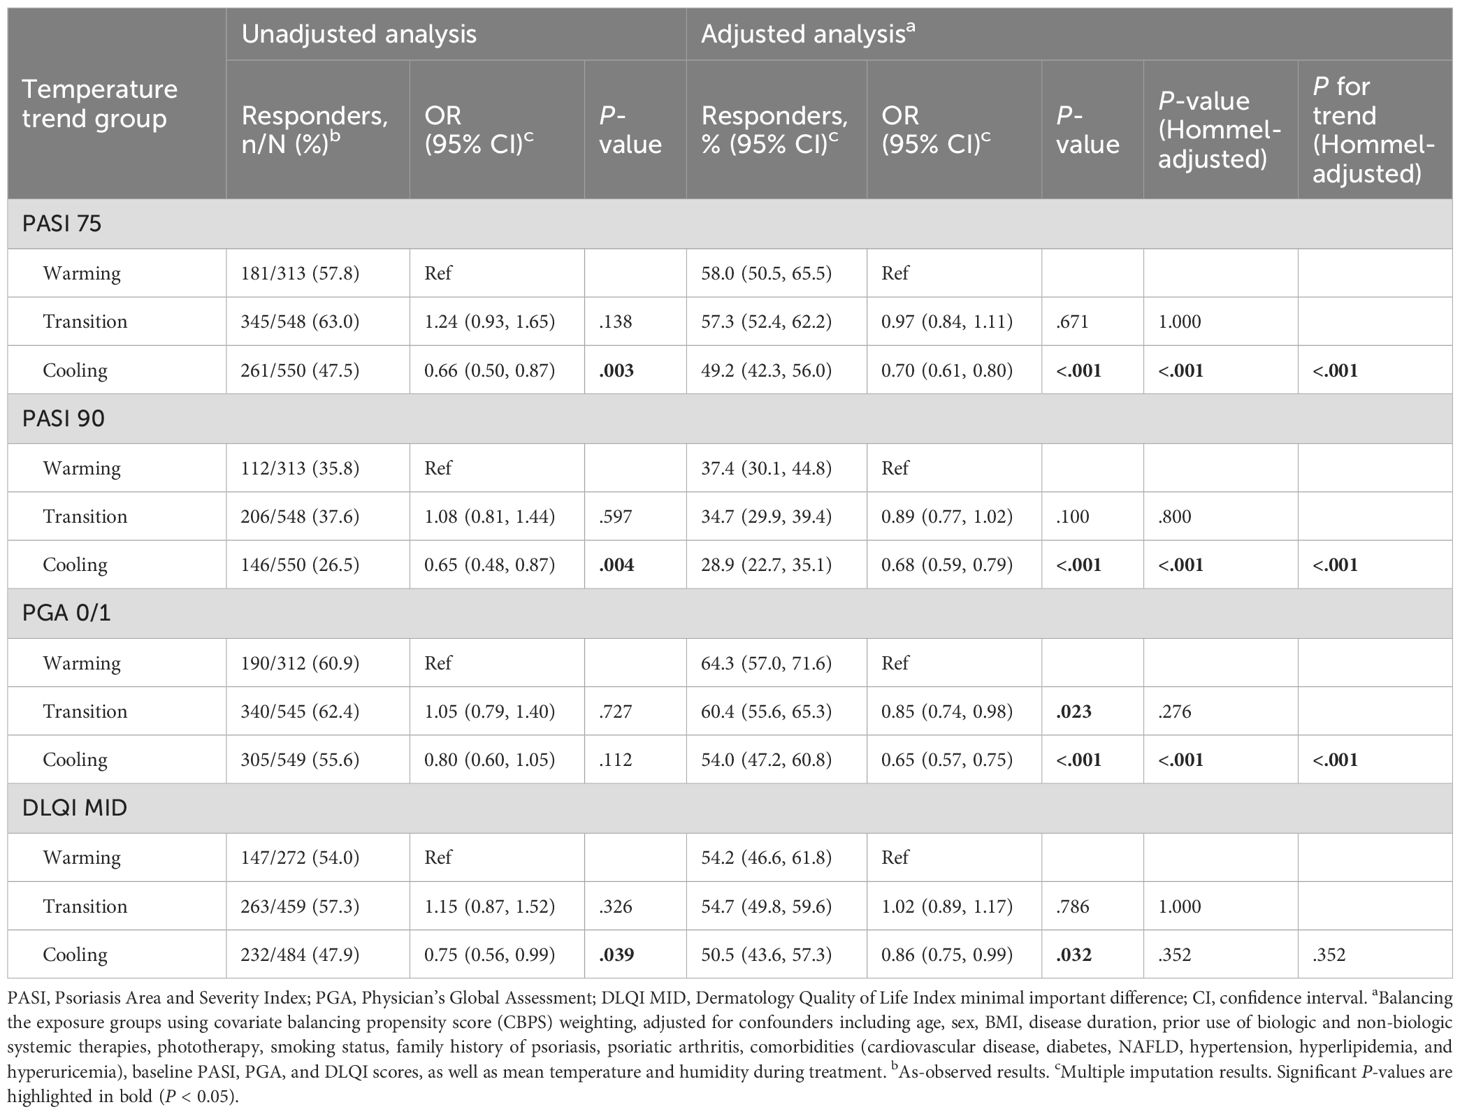
Table 2. Response rates and odds ratios (ORs) for PASI 75, PASI 90, PGA 0/1, and DLQI MID at 3 months post-treatment.
RDs and NNTs were calculated to assess the impact of temperature trend-defined seasonality on achieving PASI 75, PASI 90, PGA 0/1, and DLQI MID at 3 and 2 months, offering insights into their clinical significance (Table 3, Supplementary Table S4; see Supplementary Material). For example, for PASI 75 at 3 months, the adjusted NNT is -11.4, meaning that treating about 11 patients in the warming group would lead to 1 additional patient achieving PASI 75 at 3 months compared to the cooling group.
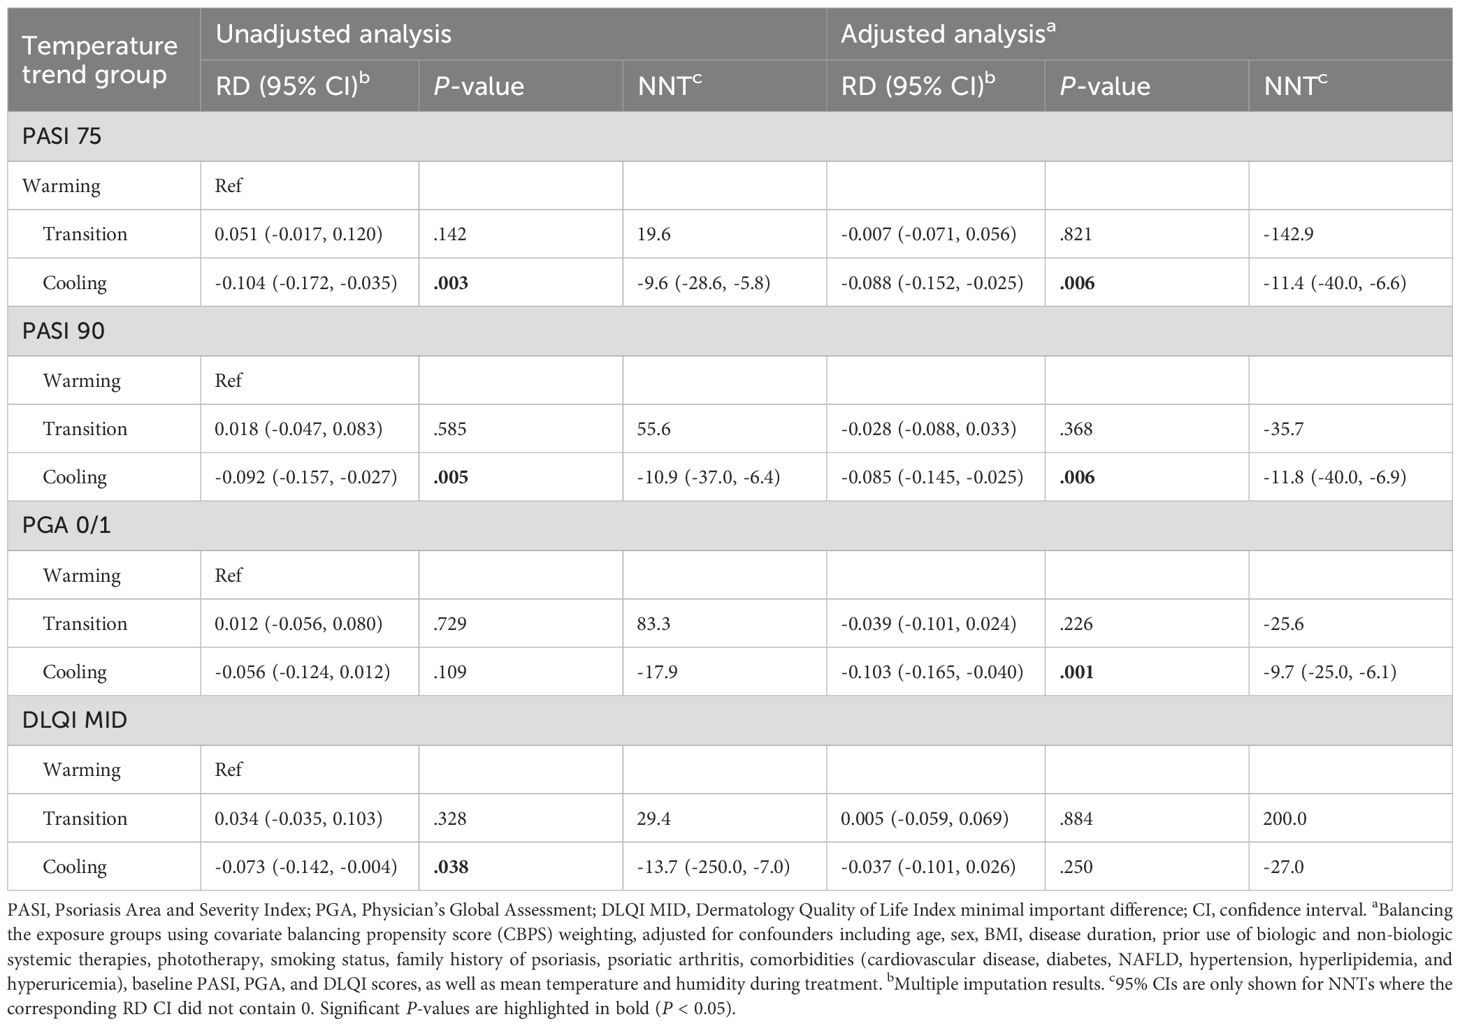
Table 3. Risk differences (RDs) and numbers needed to treat (NNTs) for PASI 75, PASI 90, PGA 0/1, and DLQI MID at 3 months post-treatment.
Sensitivity analyses
A series of sensitivity analyses were conducted to validate the robustness of findings for the 3-month analysis (Table 4). Across all analyses, the cooling group consistently exhibited significantly lower odds of achieving PASI 75 (ORs 0.60–0.75), PASI 90 (ORs 0.63–0.78), and PGA 0/1 (ORs 0.58–0.82) compared to the warming group. For DLQI MID, odds were also reduced but showed less consistency, with some analyses yielding marginal significance (e.g., OR 0.75–0.88). The transition group demonstrated intermediate effects, with no significant differences observed in most scenarios. Similar results were observed in the 2-month analysis (Supplementary Table S5; see Supplementary Material).
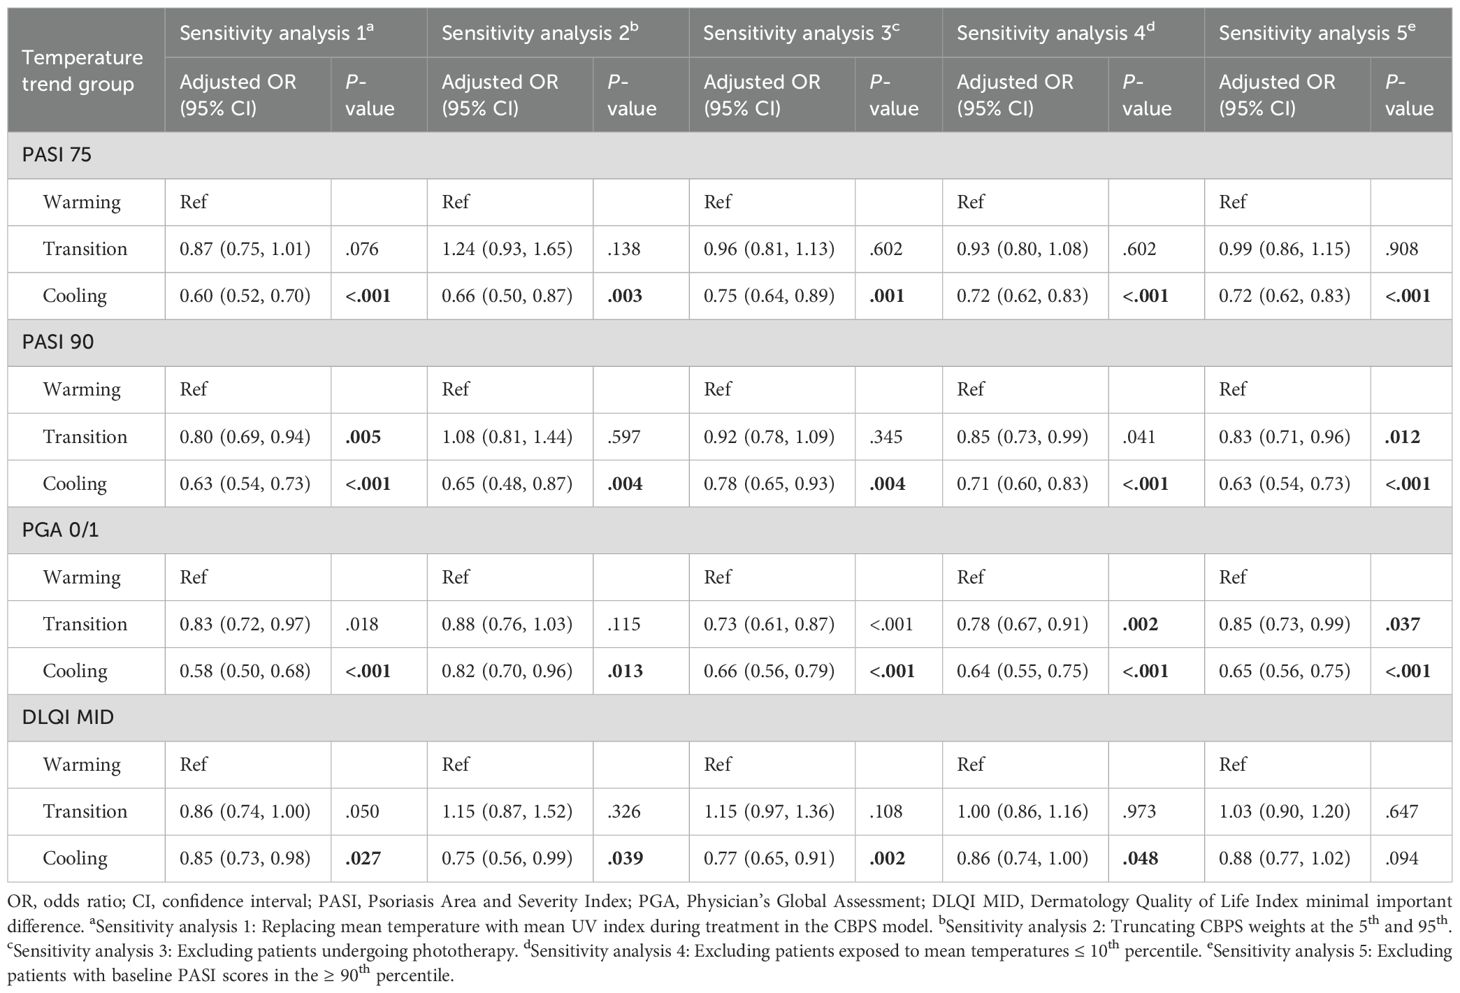
Table 4. Effectiveness in the sensitivity analyses at 3 months post-treatment.
E-value
The E-value for PASI 75 at 3 months comparing the cooling group vs. the warming group was 1.63, with an E-value of 1.36 for the upper confidence limit of the point estimate. These values, when compared to the risk ratios of known factors such as sex, age, BMI, baseline PASI, treatment type, mean temperature, and humidity during treatment, suggest it is highly unlikely that an unmeasured confounder could fully negate the observed association (Figure 3). Similar findings were observed in the 2-month analysis (Supplementary Figure S1; see Supplementary Material).
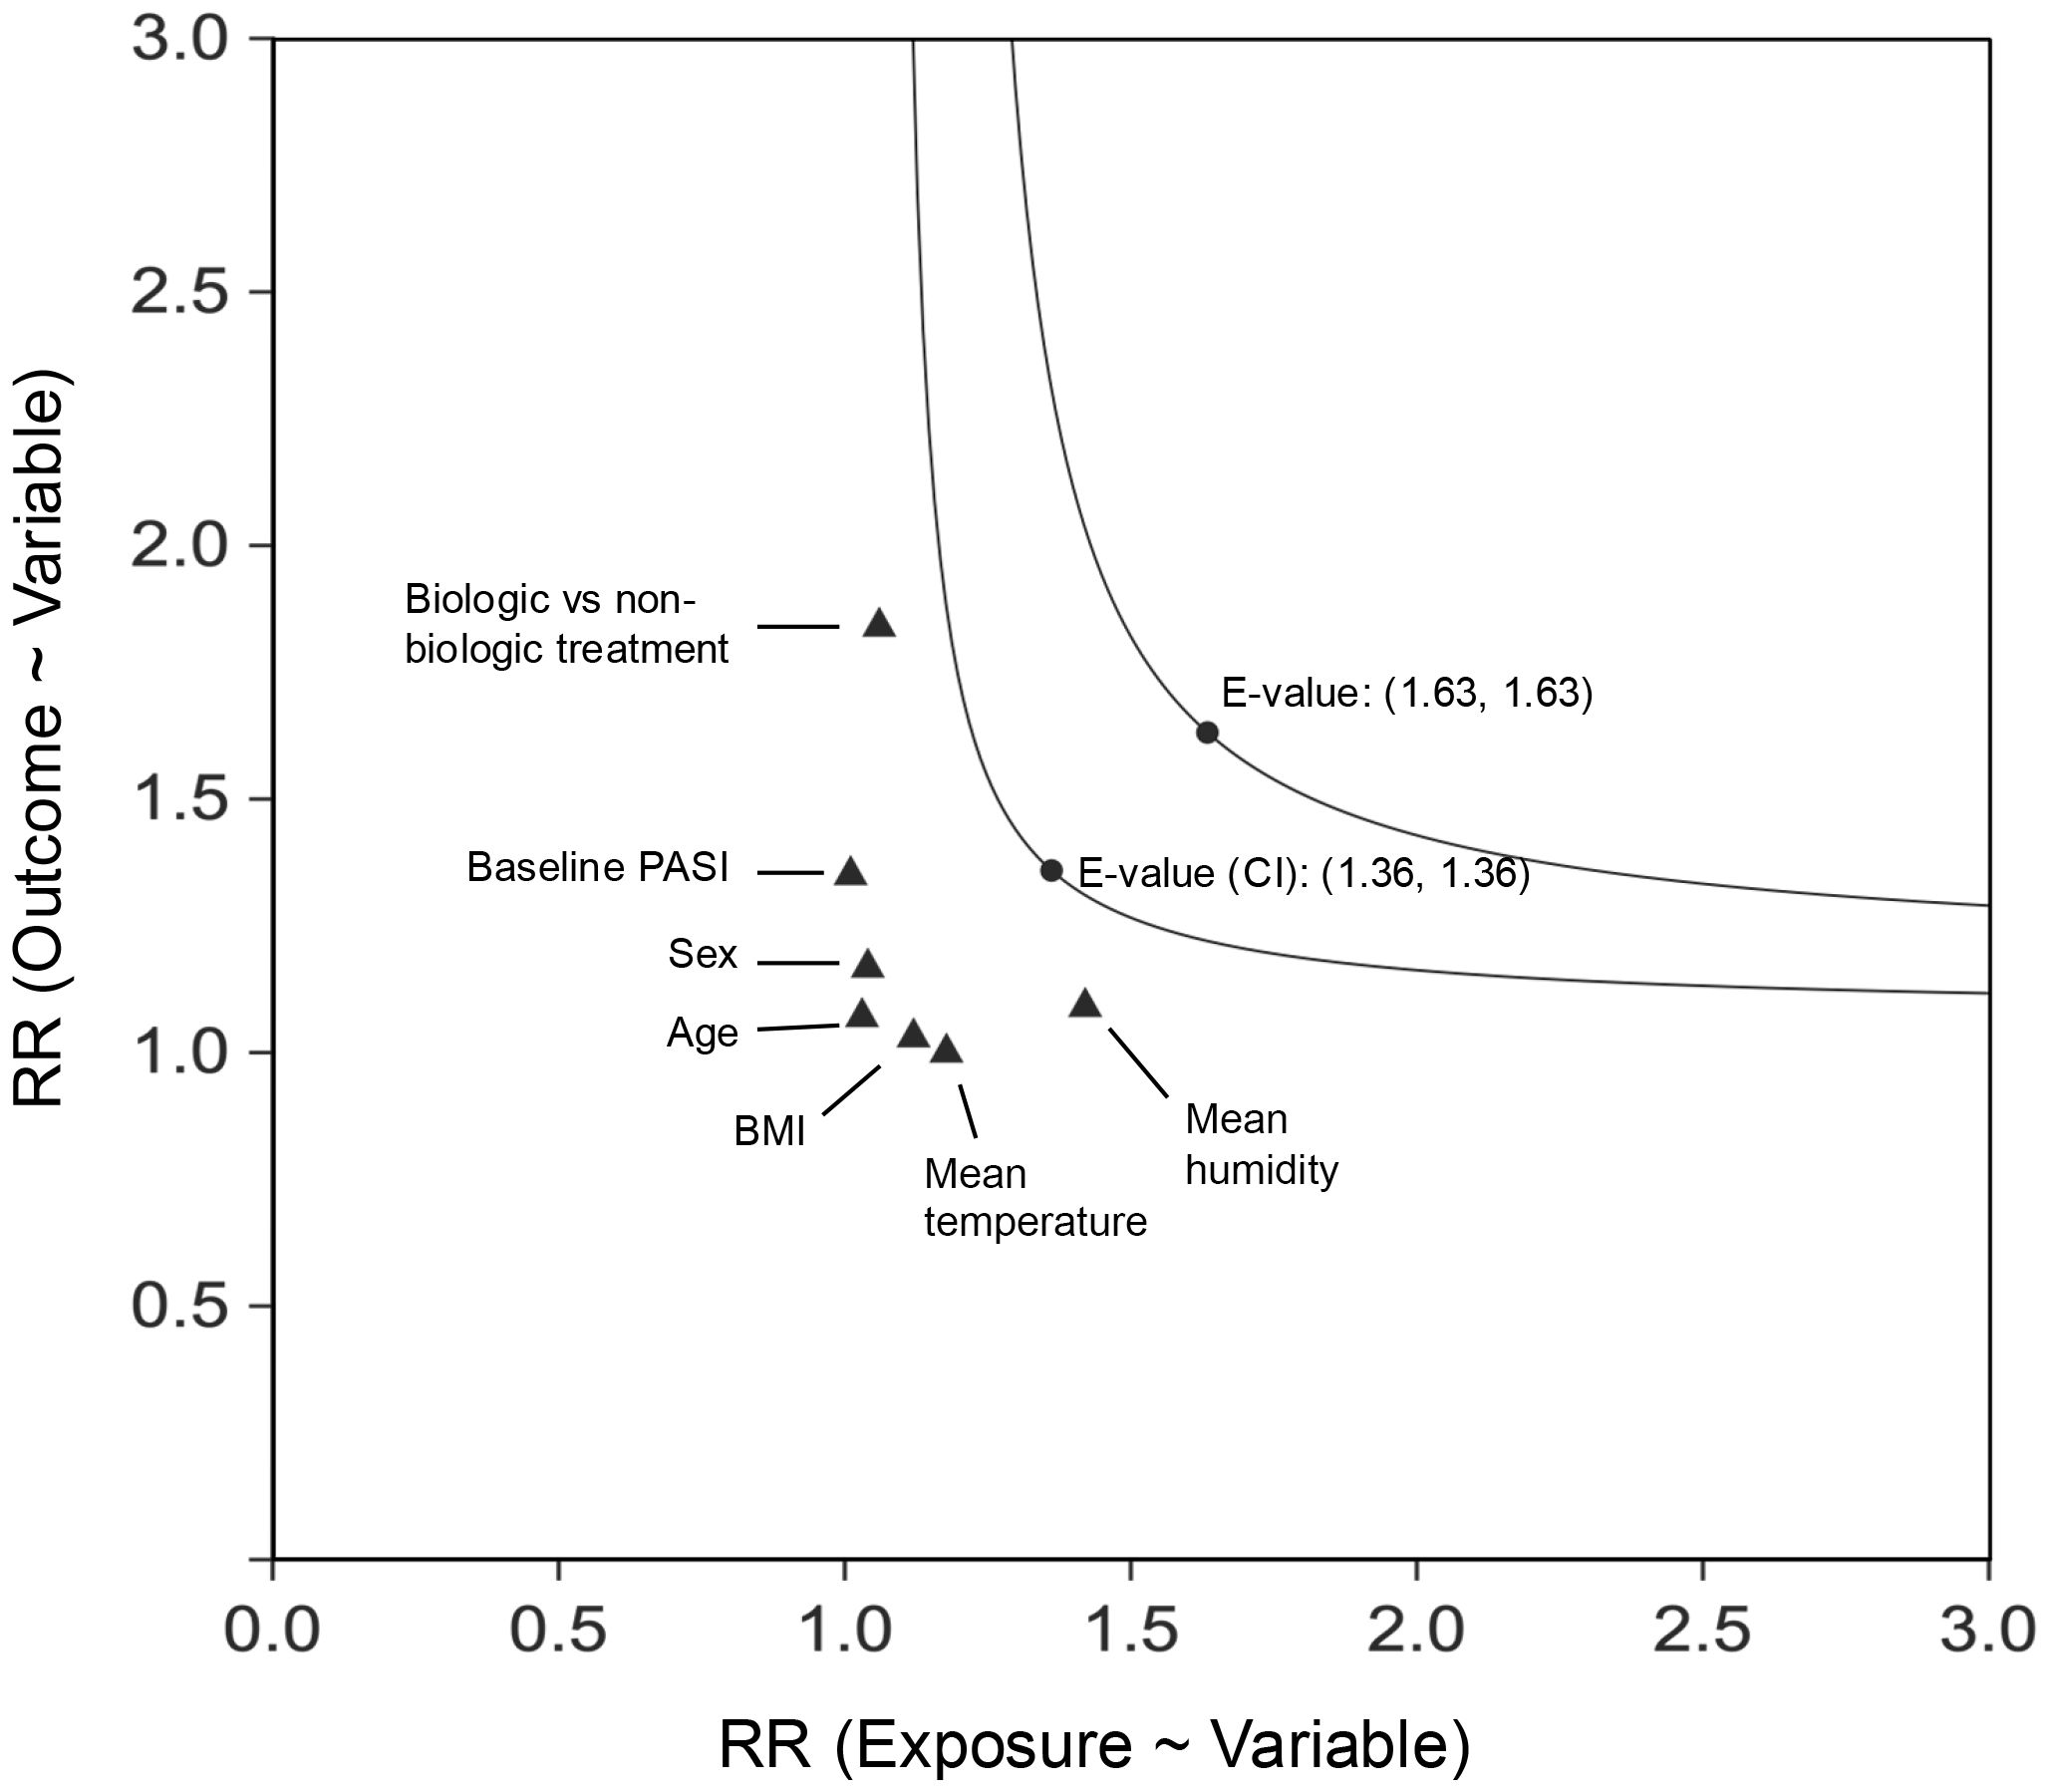
Figure 3. E-Value for PASI 75 at 3 months (multiple imputation), the cooling group vs. the warming group. CI, confidence interval; RR, relative risk. The E-value was calculated based on the RR for the cooling group compared to the warming group, with a separate E-value derived from the upper limit of the RR’s confidence interval. The x-axis represents the extent of imbalance in the prevalence of the unmeasured confounder between the two exposure cohorts, while the y-axis denotes the strength of the association between the unmeasured confounder and the outcome (PASI 75 at 3 months). For comparison, the effects of established confounders, with continuous variables dichotomized at the median, have been included.
Interaction analyses
Interaction analyses assessed differential effects of temperature trends (cooling group vs warming group) on PASI 75 attainment at 3 and 2 months. In the 3−month analysis, most predictors showed no significant interactions. BMI demonstrated a significant interaction on both the multiplicative scale (OR 0.45, 95% CI 0.24–0.86, P = .016) and additive scale (RD -0.150, 95% CI -0.275 to -0.025, P = .019), indicating worse responses to cooling trends in patients with higher BMI (Table 5). Subgroup analyses showed that the estimated OR for cooling vs warming was 0.42 (95% CI 0.26–0.70) in the high−BMI group (BMI ≥ 24.5) and 1.26 (95% CI 0.71–1.99) in the low−BMI group (BMI < 24.5), highlighting that the seasonal effect was most pronounced in high−BMI patients. Interestingly, treatment type did not modify the seasonal effect on PASI 75 outcomes. Similar findings were observed in the 2−month analysis (Supplementary Table S6; see Supplementary Material).
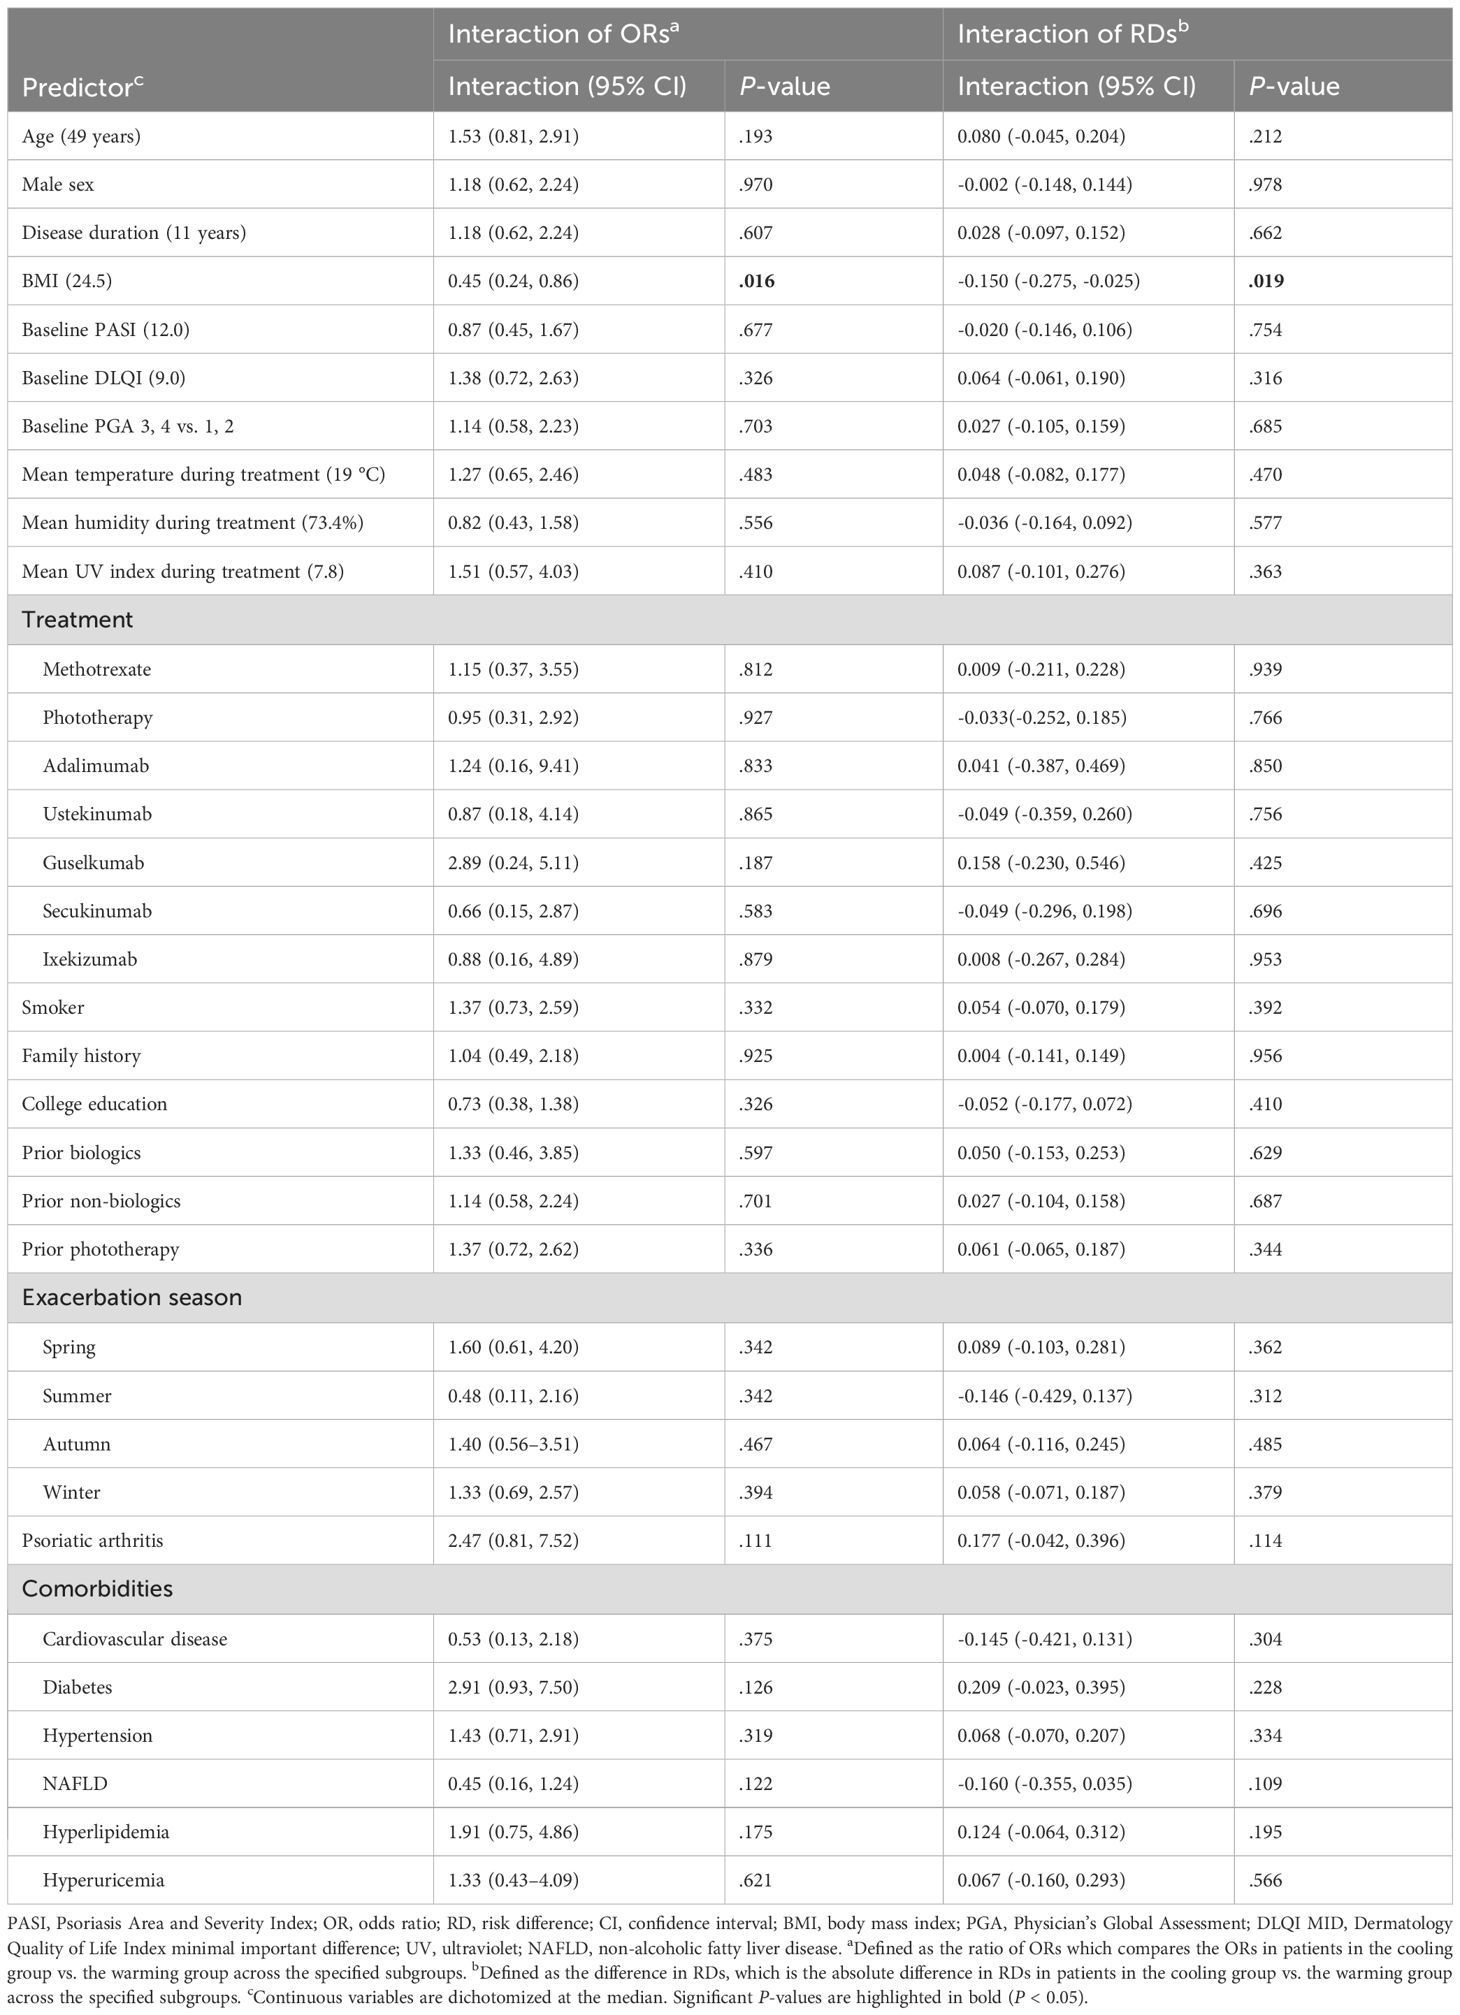
Table 5. Interaction analyses of temperature trends (the cooling group vs. the warming group) with predictors for PASI 75 at 3 months.
Discussion
This study highlights the impact of temperature trend-defined seasonality on the effectiveness of systemic therapies for psoriasis. Cooling trends are linked to lower odds of achieving PASI 75, PASI 90, and PGA 0/1, while the effect on DLQI MID is weaker and less consistent. This suggests that seasonal influences primarily impair clinical response, with only a modest impact on patient-reported quality of life. Clinically relevant associations are quantified using RDs and NNTs. Interaction analyses reveal that BMI significantly influences outcomes, with higher BMI patients responding less favorably to cooling trends than those with lower BMI.
It is widely believed that psoriasis exhibits a pronounced seasonal pattern, influencing lesion severity, symptoms, flare-ups and remissions, as well as treatment initiation and discontinuation (20–24). While many studies report that skin lesions in psoriasis patients improve during warmer seasons, this observation is not consistently supported across all research (12, 25). To achieve more consistent research outcomes, it is essential to clearly define the primary exposure, seasonality. In prior studies, two commonly recognized methods have been used to define seasons (8). The first, based on astronomical criteria, designates spring as March 22-June 21, summer as June 22-September 21, autumn as September 22-December 21, and winter as December 22-March 21. The second, based on meteorological criteria, defines spring as March 1-May 31, summer as June 1-August 31, autumn as September 1-November 30, and winter as December 1-February 28. Both methods have notable limitations. Astronomical definitions rely on fixed dates misaligned with climatic changes and lack adaptability to regional variations, especially in tropical and subtropical areas. Meteorological definitions, dividing the year into fixed three-month intervals, ignore real-world climate variability and gradual environmental transitions. In contrast, temperature-trend defined seasonality aligns with actual climatic changes, accommodates regional differences, and captures transitional periods, offering a more dynamic and nuanced understanding of environmental impacts.
Previous studies have shown that sunlight, UV radiation, temperature, and humidity influence the onset, severity, and treatment outcomes of psoriasis through various immune mechanisms (26–31). In our findings, temperature trend-defined seasonality impacts treatment outcomes independently of average levels of temperature, UV, and humidity. While this does not rule out the role of static meteorological factors, we identified a novel influence—meteorological trends, exemplified by temperature trends, which may act as a “stressor” that modifies the intrinsic disease activity in patients. This observation aligns with the concept of dynamic psoriasis disease activity proposed by Mrowietz et al., emphasizing the role of environmental triggers such as temperature variation (32). The Mrowietz’s study reported that approximately 30% of patients had “winter−type” psoriasis, suggesting that seasonal effects may be most pronounced in certain subgroups. In our Shanghai cohort, cooling trends reduced treatment response at the group level but were most evident in high−BMI patients, reflecting variable individual susceptibility. Overall, these findings are consistent with ACTIPSO, although the magnitude of seasonal effects may differ according to patient characteristics.
This study’s strengths include leveraging a large, multicentre cohort with comprehensive patient and environmental data, enabling robust evaluation of seasonal effects on treatment outcomes. Methodologically, the application of CBPS weighting effectively minimized baseline confounding, ensuring that observed associations reliably reflected causal relationships. Additionally, using interaction analyses, the research identifies specific subgroups, such as those defined by BMI, that experience differential responses to seasonal variations. These findings emphasize the importance of considering individual patient characteristics when evaluating therapeutic responses. Clinically interpretable effect sizes, including RDs and NNTs, further enhanced the practical applicability of the findings.
These findings have important implications for clinical study design and reporting. Seasonal effects may act as confounders, especially in trials of biologic efficacy or dose reduction. To enhance validity, future studies should report environmental conditions (temperature trends, UV exposure, humidity) and apply seasonal stratification or balancing. In real−world studies, sensitivity analyses can help distinguish true drug effects from seasonal influences.
These findings highlight the clinical importance of considering seasonality in psoriasis management. Cooling seasons may require more proactive, individualized strategies, particularly for high−BMI patients, who showed up to a 15% lower PASI 75 response rate. For these patients, clinicians should avoid dose tapering or interval extension, ensure closer monitoring, and consider dose optimization or early combination therapy if responses are suboptimal. Incorporating seasonal awareness with patient−specific risk factors supports a personalized approach. Moreover, future clinical trials should account for temperature trend−defined seasonality as a potential confounder and use participant stratification or balancing to ensure validity across different climate zones.
Several limitations should be acknowledged. First, the study’s observational design precludes definitive causal inferences. Although we applied robust CBPS to minimize baseline confounding, unmeasured factors—such as patient stress, therapy adherence, or physician prescribing habits—may have influenced treatment selection and outcomes. For example, the higher proportion of biologics in the warming period and the greater use of acitretin in the cooling period likely reflect complex clinical decision-making influenced by seasonality, patient characteristics, and drug availability. Second, reliance on regional climate data may not fully capture individual exposure, especially for patients living in microclimates or spending substantial time indoors. Third, while the results suggest a mechanistic link between seasonality and therapeutic outcomes, direct biological evidence (e.g., inflammatory biomarkers or skin barrier function) was not assessed. Future studies will incorporate longitudinal biological data, including serum inflammatory markers and skin transcriptomics, to better elucidate the immunologic and molecular basis of seasonal effects. Fourth, our findings from Shanghai’s subtropical monsoon climate may not generalize to other regions, as seasonal effects could be weaker in tropical areas, amplified in arid climates, or more pronounced in continental and polar regions. Multicenter studies across diverse climates are needed to validate and refine region-specific recommendations. Finally, the focus on short-term outcomes (2–3 months) limits the scope of this study; longer follow-up may reduce seasonal disparities due to increasing exposure to transitional conditions between warming and cooling periods.
In conclusion, this study highlights the significant impact of temperature trend-defined seasonality on psoriasis treatment outcomes, with cooling trends linked to reduced effectiveness. By introducing a novel seasonality framework based on temperature variation, we offer fresh insights into the environmental factors shaping therapeutic responses. The observed BMI-modified effect underscores the importance of developing tailored management strategies that integrate environmental factors with individual patient characteristics.
Data availability statement
The original contributions presented in the study are included in the article/Supplementary Material. Further inquiries can be directed to the corresponding author.
Ethics statement
The registry (Chinese Clinical Trial Registry, #ChiCTR2000036186) was performed following the principles of the Declaration of Helsinki. The research was approved by the Institutional Review Boards at all sites: Shanghai Skin Disease Hospital (#2020-36); Shanghai Tenth People’s Hospital (#20KT110); Ruijin Hospital (#2020821); Huashan Hospital (#KY2021-733); Changhai Hospital (#2020-27); Shanghai Jiao Tong University Affiliated Sixth People’s Hospital (#2020-KY-047); Yueyang Hospital of Integrated Traditional Chinese and Western Medicine (#2021-129). All patients provided written informed consent before treatment initiation. The studies were conducted in accordance with the local legislation and institutional requirements. The participants provided their written informed consent to participate in this study.
Author contributions
XS: Writing – original draft, Writing – review & editing. QY: Methodology, Conceptualization, Formal Analysis, Investigation, Writing – review & editing. YW: Writing – review & editing, Formal Analysis, Methodology, Investigation, Conceptualization. NY: Resources, Funding acquisition, Writing – review & editing, Writing – original draft, Supervision.
Funding
The author(s) declare financial support was received for the research and/or publication of this article. Funding sources: This study was supported by fundings from National Natural Science Foundation of China (82273515).
Conflict of interest
The authors declare that the research was conducted in the absence of any commercial or financial relationships that could be construed as a potential conflict of interest.
Generative AI statement
The author(s) declare that no Generative AI was used in the creation of this manuscript.
Any alternative text (alt text) provided alongside figures in this article has been generated by Frontiers with the support of artificial intelligence and reasonable efforts have been made to ensure accuracy, including review by the authors wherever possible. If you identify any issues, please contact us.
Publisher’s note
All claims expressed in this article are solely those of the authors and do not necessarily represent those of their affiliated organizations, or those of the publisher, the editors and the reviewers. Any product that may be evaluated in this article, or claim that may be made by its manufacturer, is not guaranteed or endorsed by the publisher.
Supplementary material
The Supplementary Material for this article can be found online at: https://www.frontiersin.org/articles/10.3389/fimmu.2025.1641225/full#supplementary-material
Supplementary Figure 1 | E-Value for PASI 75 at 2 months (multiple imputation), the cooling group vs. the warming group. CI, confidence interval; RR, relative risk. The E-value was calculated based on the RR for the cooling group compared to the warming group, with a separate E-value derived from the upper limit of the RR’s confidence interval. The x-axis represents the extent of imbalance in the prevalence of the unmeasured confounder between the two exposure cohorts, while the y-axis denotes the strength of the association between the unmeasured confounder and the outcome (PASI 75 at 2 months). For comparison, the effects of established confounders, with continuous variables dichotomized at the median, have been included.
References
1. Griffiths CEM, Armstrong AW, Gudjonsson JE, and Barker J. Psoriasis. Lancet (London England). (2021) 397:1301–15. doi: 10.1016/s0140-6736(20)32549-6
2. Dand N, Mahil SK, Capon F, Smith CH, Simpson MA, and Barker JN. Psoriasis and genetics. Acta dermato-venereologica. (2020) 100:adv00030. doi: 10.2340/00015555-3384
3. Dika E, Bardazzi F, Balestri R, and Maibach HI. Environmental factors and psoriasis. Curr problems Dermatol. (2007) 35:118–35. doi: 10.1159/000106419
4. Teng Y, Xie W, Tao X, Liu N, Yu Y, Huang Y, et al. Infection-provoked psoriasis: induced or aggravated (Review). Exp Ther Med. (2021) 21:567. doi: 10.3892/etm.2021.9999
5. Madden SK, Flanagan KL, and Jones G. How lifestyle factors and their associated pathogenetic mechanisms impact psoriasis. Clin Nutr (Edinburgh Scotland). (2020) 39:1026–40. doi: 10.1016/j.clnu.2019.05.006
6. Balak DM and Hajdarbegovic E. Drug-induced psoriasis: clinical perspectives. Psoriasis (Auckland NZ). (2017) 7:87–94. doi: 10.2147/ptt.S126727
7. Jensen KK, Serup J, and Alsing KK. Psoriasis and seasonal variation: A systematic review on reports from northern and central europe-little overall variation but distinctive subsets with improvement in summer or wintertime. Skin Res technology: Off J Int Soc Bioengineering Skin (ISBS) [and] Int Soc Digital Imaging Skin (ISDIS) [and] Int Soc Skin Imaging (ISSI). (2022) 28:180–6. doi: 10.1111/srt.13102
8. Hancox JG, Sheridan SC, Feldman SR, and Fleischer AB Jr. Seasonal variation of dermatologic disease in the USA: A study of office visits from 1990 to 1998. Int J Dermatol. (2004) 43:6–11. doi: 10.1111/j.1365-4632.2004.01828.x
9. Pascoe VL and Kimball AB. Seasonal variation of acne and psoriasis: A 3-year study using the physician global assessment severity scale. J Am Acad Dermatol. (2015) 73:523–5. doi: 10.1016/j.jaad.2015.06.001
10. Muddasani S and Fleischer AB Jr. Common skin diseases reveal seasonal variation in internet search interest. Skinmed. (2022) 20:233–4.
11. Brito LAR, Nascimento A, Marque C, and Miot HA. Seasonality of the hospitalizations at a dermatologic ward (2007-2017). Anais brasileiros dermatologia. (2018) 93:755–8. doi: 10.1590/abd1806-4841.20187309
12. Kubota K, Kamijima Y, Sato T, Ooba N, Koide D, Iizuka H, et al. Epidemiology of psoriasis and palmoplantar pustulosis: A nationwide study using the Japanese national claims database. BMJ Open. (2015) 5:e006450. doi: 10.1136/bmjopen-2014-006450
13. Yu N, Peng C, Zhou J, Gu J, Xu J, Li X, et al. Measurement properties of the patient global assessment numerical rating scale in moderate-to-severe psoriasis. Br J Dermatol. (2023) 189:437–46. doi: 10.1093/bjd/ljad188
14. Imai K and Ratkovic M. Covariate balancing propensity score. J R Stat Soc Ser B-Statistical Method. (2014) 76:243–63. doi: 10.1111/rssb.12027
15. Fan JQ, Imai K, Lee I, Liu H, Ning Y, and Yang XL. Optimal covariate balancing conditions in propensity score estimation. J Business Economic Stat. (2022) 41:97–110. doi: 10.1080/07350015.2021.2002159
16. Laupacis A, Sackett DL, and Roberts RS. An assessment of clinically useful measures of the consequences of treatment. New Engl J Med. (1988) 318:1728–33. doi: 10.1056/nejm198806303182605
17. VanderWeele TJ and Ding P. Sensitivity analysis in observational research: introducing the E-value. Ann Internal Med. (2017) 167:268–74. doi: 10.7326/m16-2607
18. Austin PC, White IR, Lee DS, and van Buuren S. Missing data in clinical research: A tutorial on multiple imputation. Can J Cardiol. (2021) 37:1322–31. doi: 10.1016/j.cjca.2020.11.010
19. Hommel G. A stagewise rejective multiple test procedure based on a modified bonferroni test. Biometrika. (1988) 75:383–6. doi: 10.2307/2336190
20. Watad A, Azrielant S, Bragazzi NL, Sharif K, David P, Katz I, et al. Seasonality and autoimmune diseases: the contribution of the four seasons to the mosaic of autoimmunity. J Autoimmun. (2017) 82:13–30. doi: 10.1016/j.jaut.2017.06.001
21. Bedi TR. Psoriasis in north India. Geographical Variations. Dermatologica. (1977) 155:310–4. doi: 10.1159/000250983
22. Ferguson FJ, Lada G, Hunter HJA, Bundy C, Henry AL, Griffiths CEM, et al. Diurnal and seasonal variation in psoriasis symptoms. J Eur Acad Dermatol Venereology: JEADV. (2021) 35:e45–e7. doi: 10.1111/jdv.16791
23. Park BS and Youn JI. Factors influencing psoriasis: an analysis based upon the extent of involvement and clinical type. J Dermatol. (1998) 25:97–102. doi: 10.1111/j.1346-8138.1998.tb02357.x
24. Niedźwiedź M, Skibińska M, Ciążyńska M, Noweta M, Czerwińska A, Krzyścin J, et al. Psoriasis and seasonality: exploring the genetic and epigenetic interactions. Int J Mol Sci. (2024) 25:11670. doi: 10.3390/ijms252111670
25. Harvell JD and Selig DJ. Seasonal variations in dermatologic and dermatopathologic diagnoses: A retrospective 15-year analysis of dermatopathologic data. Int J Dermatol. (2016) 55:1115–8. doi: 10.1111/ijd.13229
26. Green C, Diffey BL, and Hawk JL. Ultraviolet radiation in the treatment of skin disease. Phys Med Biol. (1992) 37:1–20. doi: 10.1088/0031-9155/37/1/001
27. Bulat V, Situm M, Dediol I, Ljubicić I, and Bradić L. The mechanisms of action of phototherapy in the treatment of the most common dermatoses. Collegium antropologicum. (2011) 35 Suppl 2:147–51.
28. Jacobson CC, Kumar S, and Kimball AB. Latitude and psoriasis prevalence. J Am Acad Dermatol. (2011) 65:870–3. doi: 10.1016/j.jaad.2009.05.047
29. Wan MJ, Su XY, Zheng Y, Gong ZJ, Yi JL, Zhao Y, et al. Seasonal variability in the biophysical properties of forehead skin in women in guangzhou city, China. Int J Dermatol. (2015) 54:1319–24. doi: 10.1111/ijd.12741
30. Egawa M and Tagami H. Comparison of the depth profiles of water and water-binding substances in the stratum corneum determined in vivo by raman spectroscopy between the cheek and volar forearm skin: effects of age, seasonal changes and artificial forced hydration. Br J Dermatol. (2008) 158:251–60. doi: 10.1111/j.1365-2133.2007.08311.x
31. Shinohara K and Hara-Chikuma M. Low humidity altered the gene expression profile of keratinocytes in a three-dimensional skin model. Mol Biol Rep. (2022) 49:7465–74. doi: 10.1007/s11033-022-07549-0
Keywords: psoriasis, epidemiology, temperature, treatment, outcome
Citation: Song X, Yang Q, Wang Y and Yu N (2025) Impact of temperature trend-defined seasonality on psoriasis treatment outcomes: a multicenter longitudinal study. Front. Immunol. 16:1641225. doi: 10.3389/fimmu.2025.1641225
Received: 04 June 2025; Accepted: 31 August 2025;
Published: 17 September 2025.
Edited by:
Chris Wincup, King’s College Hospital NHS Foundation Trust, United KingdomReviewed by:
Albert Duvetorp, University of Copenhagen, DenmarkFrancois Rosset, University of Turin, Italy
Copyright © 2025 Song, Yang, Wang and Yu. This is an open-access article distributed under the terms of the Creative Commons Attribution License (CC BY). The use, distribution or reproduction in other forums is permitted, provided the original author(s) and the copyright owner(s) are credited and that the original publication in this journal is cited, in accordance with accepted academic practice. No use, distribution or reproduction is permitted which does not comply with these terms.
*Correspondence: Ning Yu, bmluZ195dUBmdWRhbi5lZHUuY24=
†These authors have contributed equally to this work and share first authorship