 Zhiqiang Zhang1,2†Xin Zhong1,2†Qunlong Jin1,2†Zhumei Chen3†Yanming Yang1Youheng Jiang1Huaixiang Zhou1Caiyan An4Junjing Zhang5
 Yulong He2*Zhang Fu1,6*Kaiming Wu2*
 Ningning Li1,4*
- 1Tomas Lindahl Nobel Laureate Laboratory, The Seventh Affiliated Hospital, Sun Yat-sen University, Shenzhen, China
- 2Digestive Diseases Center, Guangdong Provincial Key Laboratory of Digestive Cancer Research, The Seventh Affiliated Hospital, Sun Yat-sen University, Shenzhen, China
- 3Department of Anesthesiology, The Seventh Affiliated Hospital, Sun Yat-Sen University, Shenzhen, China
- 4Inner Mongolia Key Laboratory of Allergic Diseases, Foundational and Translational Medical Research Center, Hohhot First Hospital, Hohhot, China
- 5Department of Hepato-Biliary Surgery, Department of Surgery, Hohhot First Hospital, Hohhot, China
- 6Department of Geriatrics, The Seventh Affiliated Hospital, Sun Yat-Sen University, Shenzhen, China
Background: Despite a global decline in gastric cancer (GC) incidence, nondistal GC (NDGC) is increasingly prevalent among younger patients, necessitating targeted investigation of early-onset NDGC (EONDGC) to identify prognostic determinants for enhanced risk stratification.
Methods: EONDGC patients were identified from multiple datasets, including the Surveillance, Epidemiology, and End Results (SEER) database, the Cancer Genome Atlas (TCGA) Stomach Adenocarcinoma cohort, and the Affiliated Hospitals of Sun Yat-sen University (SYSU) as an external validation cohort. Propensity score matching was performed to reduce baseline differences between groups. A prognostic model was developed using univariate and multivariate Cox regression and LASSO analysis in a 7:3 training–validation split. The prognostic model was applied to TCGA patients to generate risk scores, and high-risk patients were selected for differentially expressed genes (DEGs) analysis. The identified genes were then analyzed using Cox regression and Kaplan-Meier methods to determine prognostic relevance. In parallel, MGC-803 and AGS cells were transiently transfected to overexpress ARSB; RT-qPCR verification, scratch and transwell migration assays quantified motility.
Results: A total of 535 EONDGC patients from SEER and 171 from SYSU were included. The prognostic model, incorporating seven clinical variables (race, pathological grade, T, N, and M stage, lymph node ratio, and chemotherapy), achieved robust performance with concordance index values of 0.758 (training), 0.718 (validation), and 0.762 (SYSU), with all AUCs > 0.75. In the TCGA patients, 73 upregulated genes were identified from high-risk patients through DEGs analysis. Among these, ARSB and PDCD1 were determined to be independent prognostic markers based on Cox and Kaplan-Meier analyses. Furthermore, a higher ARSB/PDCD1 ratio (APR) was associated with poorer overall survival (P = 0.041). In vitro, ARSB overexpression increased scratch migration area and transwell-migrated cell counts versus empty vector.
Conclusion: This study developed a clinical prognostic model for EONDGC and therefore identified ARSB and PDCD1 as key molecular markers. The APR value enhances survival stratification, offering valuable insights into personalized prognosis and potential immunotherapy strategies.
1 Introduction
Gastric cancer (GC) remains a significant global health challenge. According to the World Health Organization in 2022, GC ranks fifth worldwide in both incidence and cancer-related mortality, accounting for 4.9% of all new cancer cases and 6.8% of cancer deaths (1).
Anatomically, GC is classified into distal GC (DGC), affecting the antrum and pylorus, or nondistal GC (NDGC), involving the cardia, fundus, and body of the stomach (2, 3). Different anatomical locations of GC influence its clinical presentation. DGC frequently presents with noticeable symptoms such as postprandial fullness, nausea, and vomiting caused by pyloric obstruction, making it more likely to be detected early (4, 5). In contrast, NDGC is often asymptomatic in its early stages or presents with mild symptoms like upper abdominal discomfort or dyspepsia, which are easily overlooked, complicating timely diagnosis.
Etiologically, DGC often arises from chronic multifocal atrophic gastritis of the antrum (6) and is strongly associated with Helicobacter pylori infection (7). In contrast, NDGC has a more complex etiology, including gastroesophageal reflux disease, obesity, and smoking (8–11). NDGC’s complex etiology poses challenges for prevention and management. Although the mortality rates of DGC and NDGC are comparable, recent epidemiological data indicate a rising incidence of NDGC, particularly in developed countries and among younger populations (12).
Notably, within NDGC, the incidence of early-onset gastric cancer (EOGC), defined as GC diagnosed before the age of 50 years (13, 14), has been increasing in recent years (15–17). This trend underscores the urgency of studying early-onset nondistal gastric cancer (EONDGC), a specific subtype of NDGC. In this study, our objective was to elucidate factors influencing survival outcomes in EONDGC. To achieve this, we performed a refined prognostic assessment of patients with EONDGC, identifying key clinical and molecular determinants that may better guide clinical decision-making and inform the development of individualized treatment strategies.
2 Methods
2.1 Data sources
This study utilized comprehensive datasets from three sources. Firstly, data from the Surveillance, Epidemiology, and End Results (SEER) Program (https://seer.cancer.gov/) provided population-based information on cancer incidence, mortality, and clinical outcomes from 17 U.S. registries spanning 2000 to 2019, extracted via SEER*Stat software (version 8.4.4). Secondly, HTSeq gene expression data from The Cancer Genome Atlas Stomach Adenocarcinoma (TCGA-STAD) cohort (https://www.cancer.gov/tcga), including 412 tumor samples and 36 normal controls, were downloaded via the TCGAbiolinks package for molecular analyses. Lastly, clinical data from 171 patients diagnosed and treated at the Affiliated Hospitals of Sun Yat-sen University (SYSU) between 2000 and 2024 served as an external validation cohort. Ethical approval for SEER and SYSU data usage was obtained as required; full ethical details are provided in the Ethics Statement section.
2.2 Inclusion criteria
Eligible patients met the following six conditions: (1) aged between 19 and 85 years; (2) confirmed diagnosis of GC; (3) survival months ≥ 1 month; (4) primary tumors located in the cardia, fundus, body, antrum, and pylorus (ICD-O-3 codes 16.0–16.4); (5) histological subtype of adenocarcinoma or signet ring cell carcinoma; and (6) disease-specific death attributed to GC.
2.3 Exclusion criteria
Patients were excluded on the basis of the following seven conditions: (1) age ≤ 18 years or > 86 years; (2) diagnosed with gastrointestinal stromal tumors, late-onset distal gastric cancer or neuroendocrine tumors; (3) survival months < 1 month; (4) incomplete pathological information, including TNM stage, tumor differentiation, tumor size, or number of positive lymph nodes; (5) missing demographic data such as marital status, race, or household income; (6) nongastrectomy or unknown treatment modalities; and (7) incomplete follow-up information.
2.4 Statistical analysis
All the statistical analyses and visualizations were conducted via R software (18) (version 4.4.1; R Foundation for Statistical Computing, Vienna, Austria). The following R packages were used: survminer, MatchIt, survival, rms, compareGroups, foreign, dcurves, survivalROC, pROC, DynNom, tidyverse, DESeq2 (19), pheatmap, and clusterProfiler. All tests were two-tailed, and a P value < 0.05 was considered to indicate statistical significance.
Propensity score matching (PSM) was performed via a logistic regression model (20). A 1:1 nearest-neighbor matching method was applied, and matching quality was evaluated via standardized differences. Three patient groups were derived: EONDGC, early-onset DGC (EODGC), and late-onset NDGC (LONDGC). Baseline characteristics were compared before and after PSM. Subgroup analyses were performed within the EONDGC group.
Continuous variables are presented as means ± standard deviations or medians with interquartile ranges, depending on distribution. Categorical variables are summarized as counts and percentages. Group comparisons were performed using the t-test, Wilcoxon rank-sum test, or chi-square test as appropriate (21).
2.5 Prognostic modeling
2.5.1 Model construction and validation
EONDGC patients were randomly assigned to SEER-training and SEER-validation sets in a 7:3 ratio. In the training set, variables with P < 0.1 in univariate Cox regression were included in multivariate analysis, and the model with the lowest Akaike Information Criterion (AIC) was selected (22). The final prognostic model was constructed by integrating the multivariate Cox regression results with least absolute shrinkage and selection operator (LASSO) regression (23).
Discrimination was evaluated using Harrell’s concordance index (C-index), and time-dependent predictive performance was evaluated by the receiver operating characteristic (ROC) curves and corresponding the area under the curves (AUC) (24). Calibration was assessed via calibration curves. Clinical utility was evaluated using decision curve analysis (DCA) (25).
2.5.2 Visualization and stratification
A prognostic nomogram was constructed in the training set, assigning scores to each prognostic variable based on its relative contribution to survival outcomes. The total score was derived by summing individual scores and converting them into predicted survival probabilities. Patients in the top 30% of total scores were defined as high risk. To facilitate individualized survival prediction for different patients, an interactive web-based dynamic nomogram was constructed.
2.5.3 Differential gene analysis
Using the same inclusion criteria, EONDGC patients from the TCGA dataset were identified and scored via the nomogram. Patients were then classified into high- and low-risk groups. Differentially expressed genes (DEGs) analysis was performed between these groups to identify genes significantly upregulated in the high-risk group.
2.5.4 Prognostic gene analysis
Genes with P < 0.1 in univariate Cox regression were included in multivariate analysis, and the model with the lowest AIC was selected. Genes with significant prognostic value were dichotomized into high- and low-expression groups according to the median transcripts per million (TPM) value or multi-gene expression ratio for Kaplan–Meier survival analysis. For immunophenoscore (IPS) analysis, immune checkpoint-related genes, including PDCD1 and CTLA4, were included. IPS was calculated based on the gene expression profile using the method established in prior studies, reflecting the immune microenvironment’s response to immune checkpoint inhibition. The log2-transformed multi-gene TPM ratio was ultimately used as a molecular indicator.
2.6 In vitro validation
2.6.1 Cell culture and transfection
Human gastric cancer cell lines MGC-803 and AGS were maintained at 37 °C with 5% CO2 in RPMI-1640 supplemented with 10% fetal bovine serum and penicillin–streptomycin. When cells reached 60–80% confluence, a transient transfection was performed using an ARSB overexpression plasmid; blank and empty-vector groups served as controls. Medium was replaced 6–8 h after transfection, and assays were initiated 24–48 h post-transfection.
2.6.2 RT-qPCR
Total RNA was extracted and reverse-transcribed to cDNA. Quantitative PCR (SYBR Green) targeted ARSB, with GAPDH as the internal control. Relative mRNA levels were calculated using the 2^−ΔΔCt method, and melt-curve analysis was used to verify specificity. Effective ARSB upregulation at the mRNA level was confirmed prior to functional assays.
2.6.3 Wound-healing assay
Cells were seeded in 6-well plates and grown to ~90–100% confluence. A linear scratch was created with a sterile 200 µL tip, debris was removed with PBS, and serum-free RPMI-1640 was added. Images were captured at 0, 24, and 48 h under an inverted microscope, using the same fields when possible. Migration area (%) was quantified as (A0 − A_t)/A0 × 100, where A0 and A_t denote the scratch area at 0 h and time t, respectively (measured in ImageJ). Each condition included at least three independent experiments, with ≥3–5 random fields per well.
2.6.4 Transwell migration assay
Migration was assessed using 24-well Transwell inserts (8-µm pores; uncoated, no Matrigel). Cells suspended in serum-free medium were added to the upper chamber, and complete medium containing 10% FBS was placed in the lower chamber as a chemoattractant. After ~24 h at 37 °C, non-migrated cells on the upper surface were removed; migrated cells on the lower surface were fixed with methanol and stained with 0.1% crystal violet, then counted under an inverted microscope in ≥5 random fields per well. Experiments were independently repeated three times.
3 Results
3.1 The prognosis is impacted by age in GC, not anatomical subsite
The study was conducted according to the workflow illustrated in Figure 1. After screening and excluding 124,244 patients from the SEER database, 4,810 eligible cases were included: 535 with EONDGC, 3,312 with LONDGC, and 963 with EODGC.
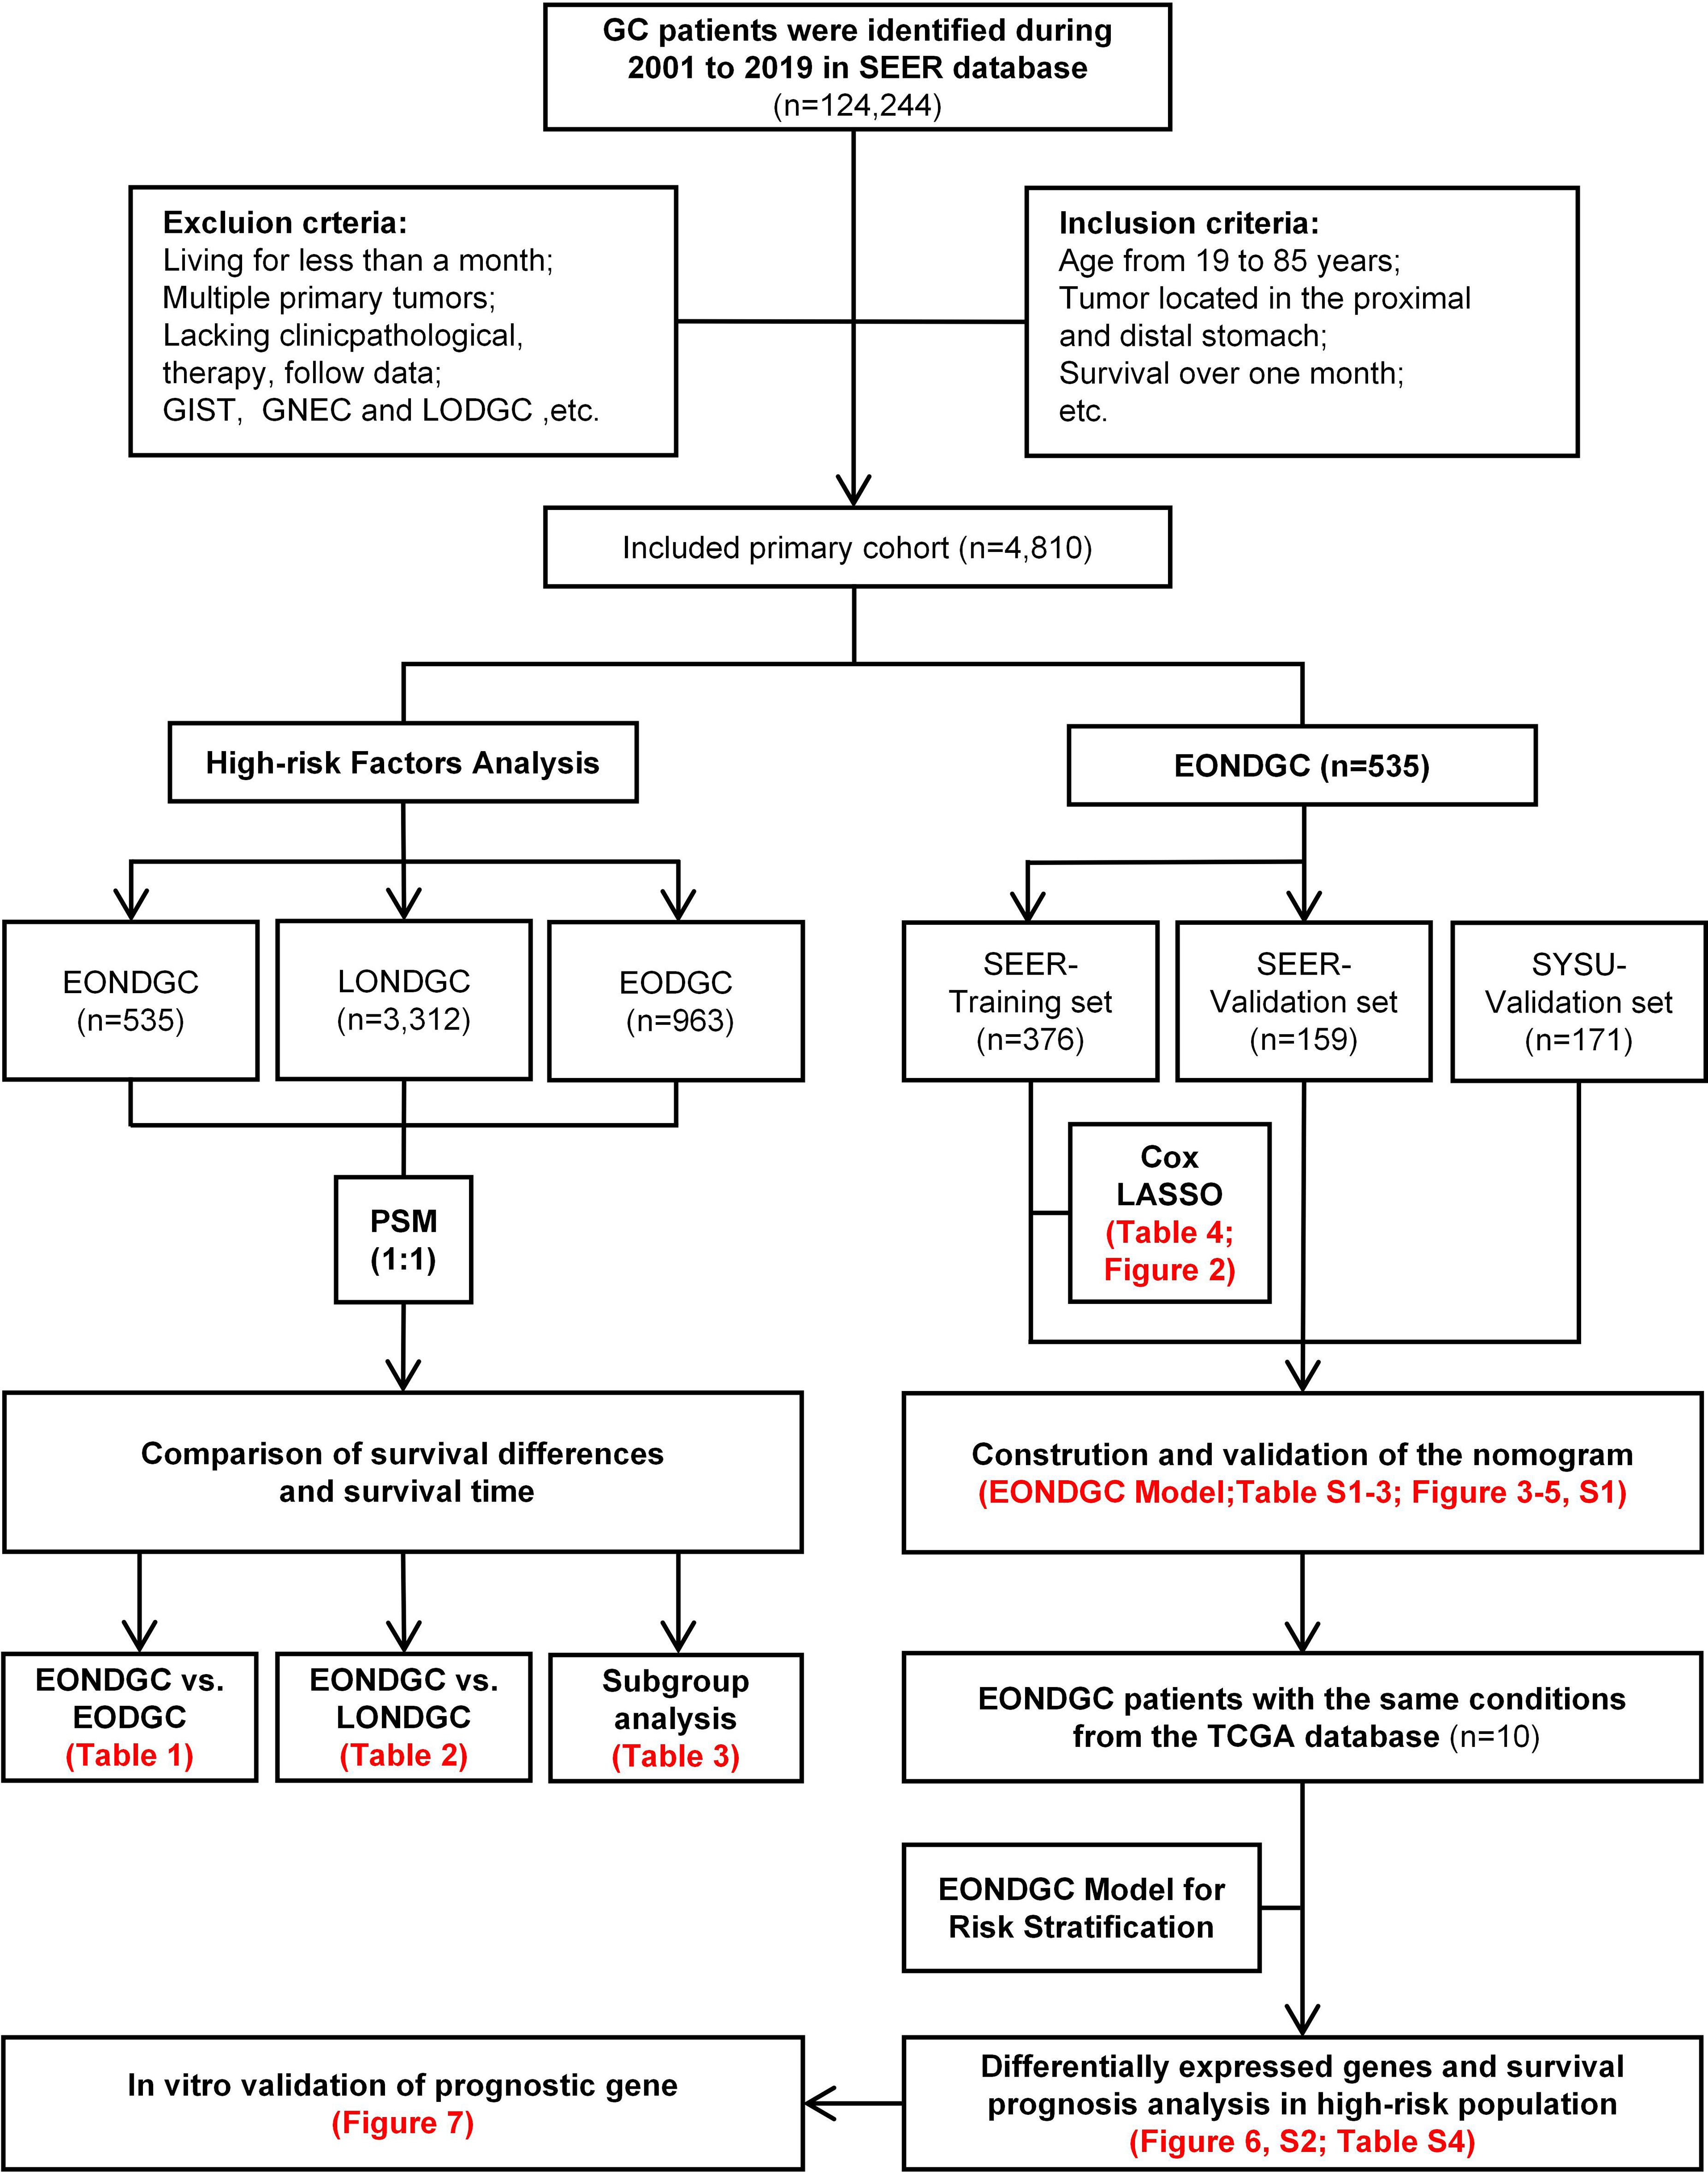
Figure 1. Flowchart of EONDGC prognostic model development, high-risk gene analysis, and in-vitro validation of ARSB.
Following PSM (Table 1), 264 patients remained in both the EONDGC and EODGC groups. Most baseline variables were well balanced, except for primary site (P < 0.001) and type of operation (P < 0.001), which remained significantly different. No significant differences were observed in vital status (14.4% vs. 16.3%, P = 0.618) or survival months (40.5 vs. 51.0, P = 0.629) after matching.
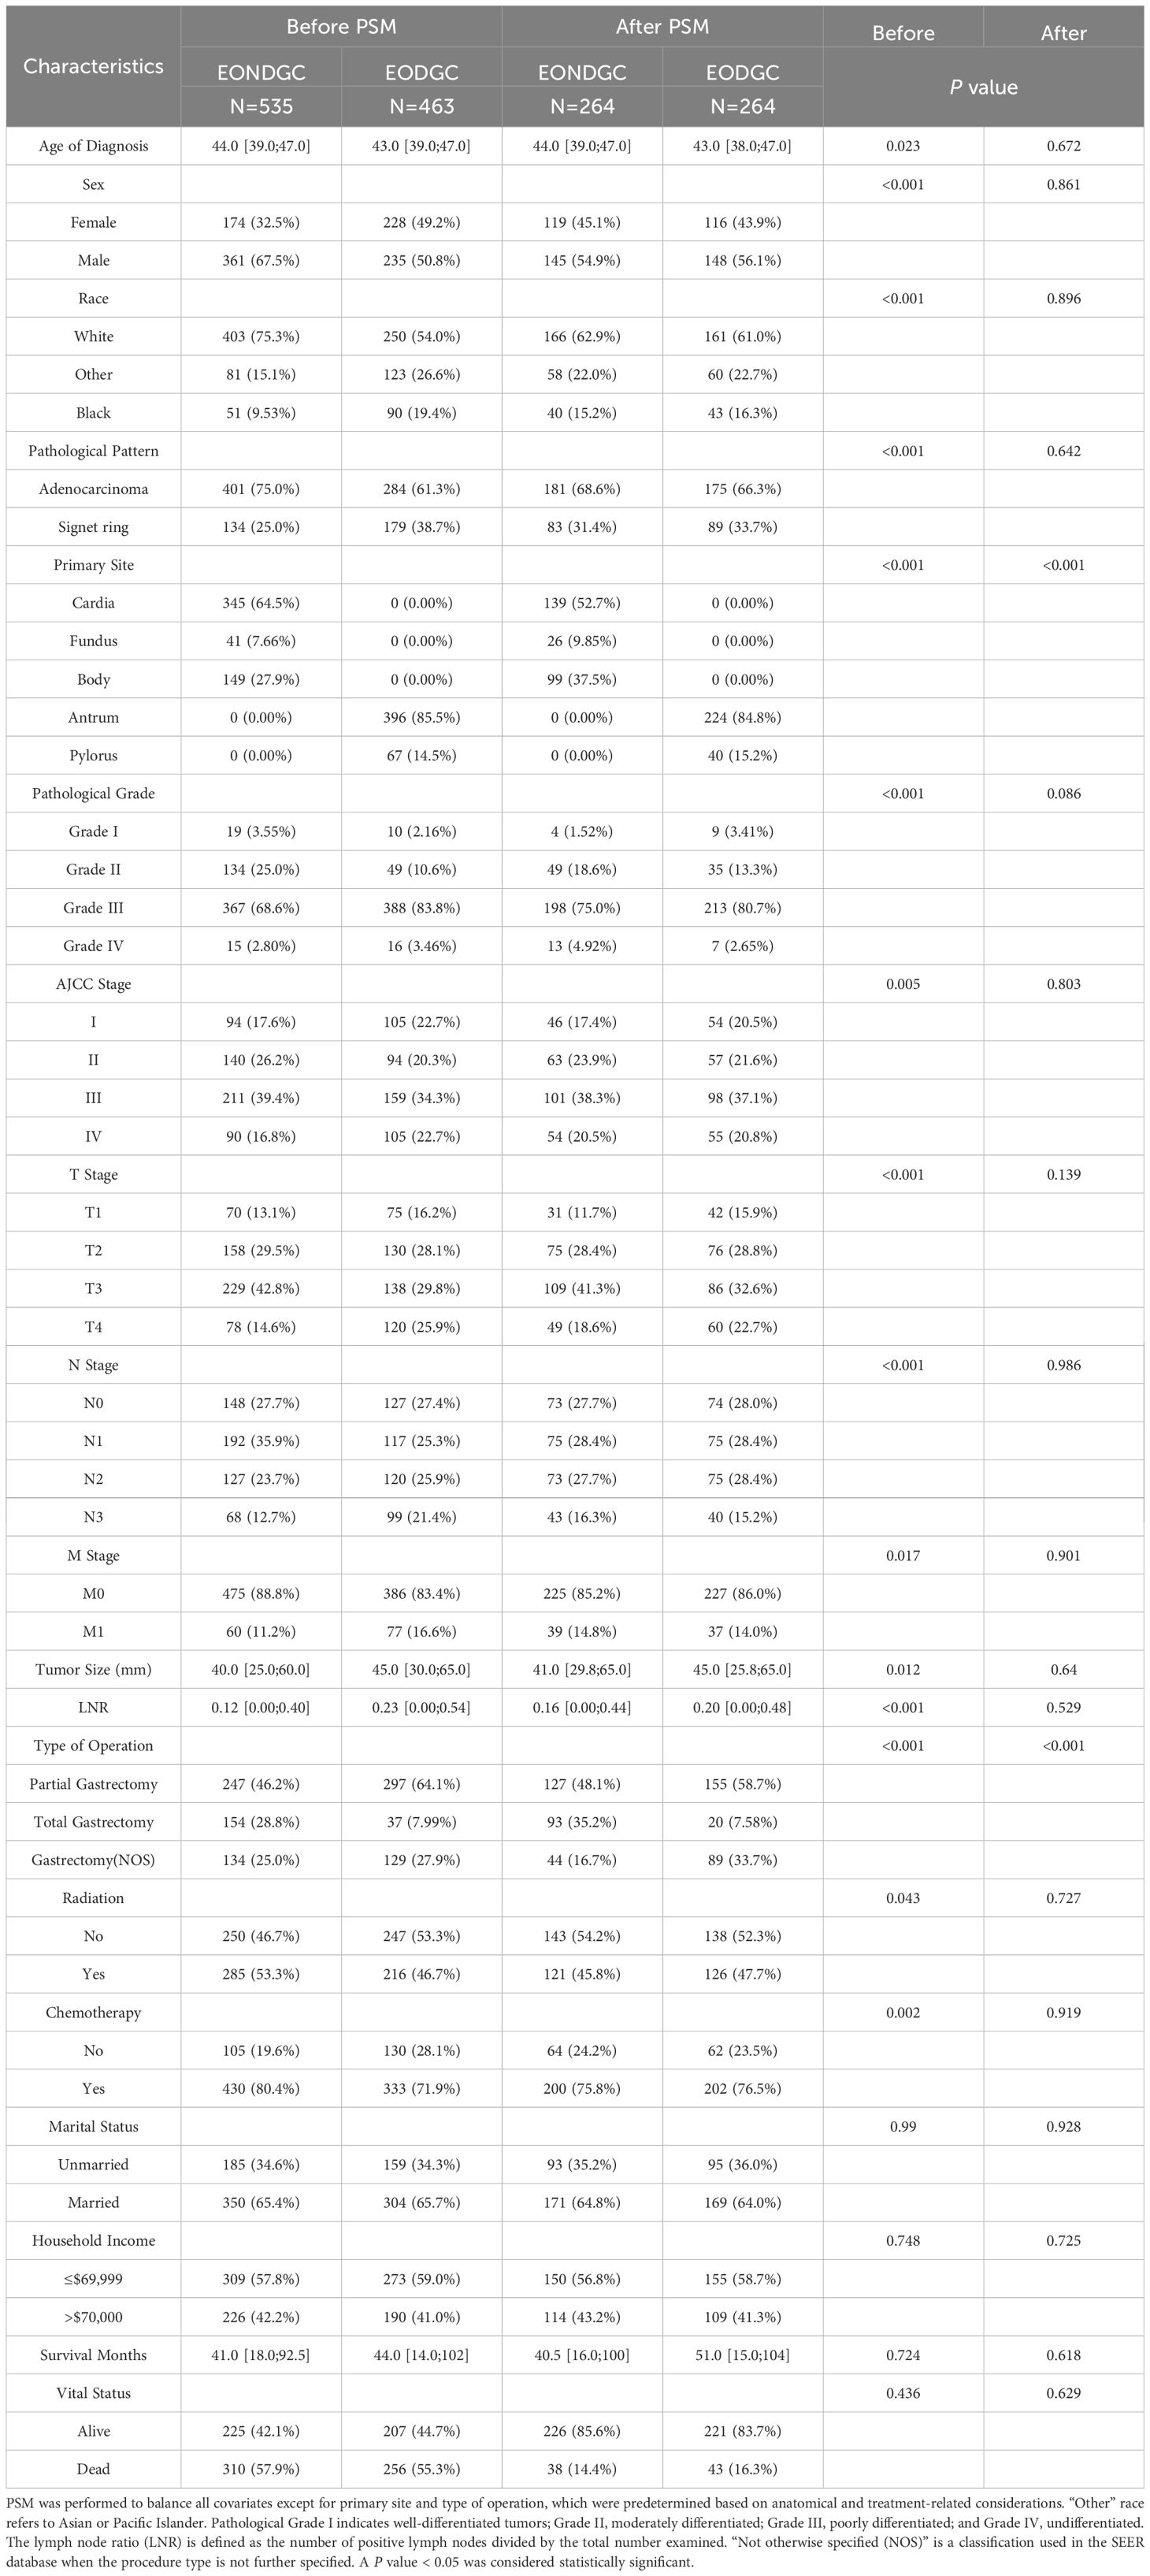
Table 1. Baseline characteristics of EONDGC and EODGC patients before and after PSM.
GC cases were identified from the SEER database (2001-2019) under predefined inclusion/exclusion criteria, yielding a primary cohort (n=4,810). The left branch presents high-risk factor analyses: EONDGC (n=535) was propensity-matched 1:1 to LONDGC and to EODGC, followed by survival comparisons and subgroup analyses within EONDGC. The right branch shows model development within EONDGC: SEER cases were split into training (n=376) and internal-validation (n=159) sets, with an external SYSU cohort (n=171) for validation; variables were selected by Cox and LASSO and integrated into a prognostic nomogram. Using TCGA cases meeting the same conditions (n=10), risk scores were calculated to define a high-risk group, from which differentially expressed genes were identified and evaluated for prognostic value. ARSB, a candidate from this screen, underwent in-vitro validation by RT-qPCR, scratch (migration area at 24/48 h), and Transwell migration assays.
In the comparison between the EONDGC and LONDGC groups (Table 2), each group included 506 matched patients. There were significant differences in survival months (41.0 vs. 30.0, P < 0.001) and vital status (57.9% vs. 65.8%, P = 0.001). These findings underscore the prognostic distinctions between early- and late-onset, as well as distal and nondistal gastric cancer. To further explore the heterogeneity within EONDGC, we next performed subgroup analyses based on anatomical subsites.
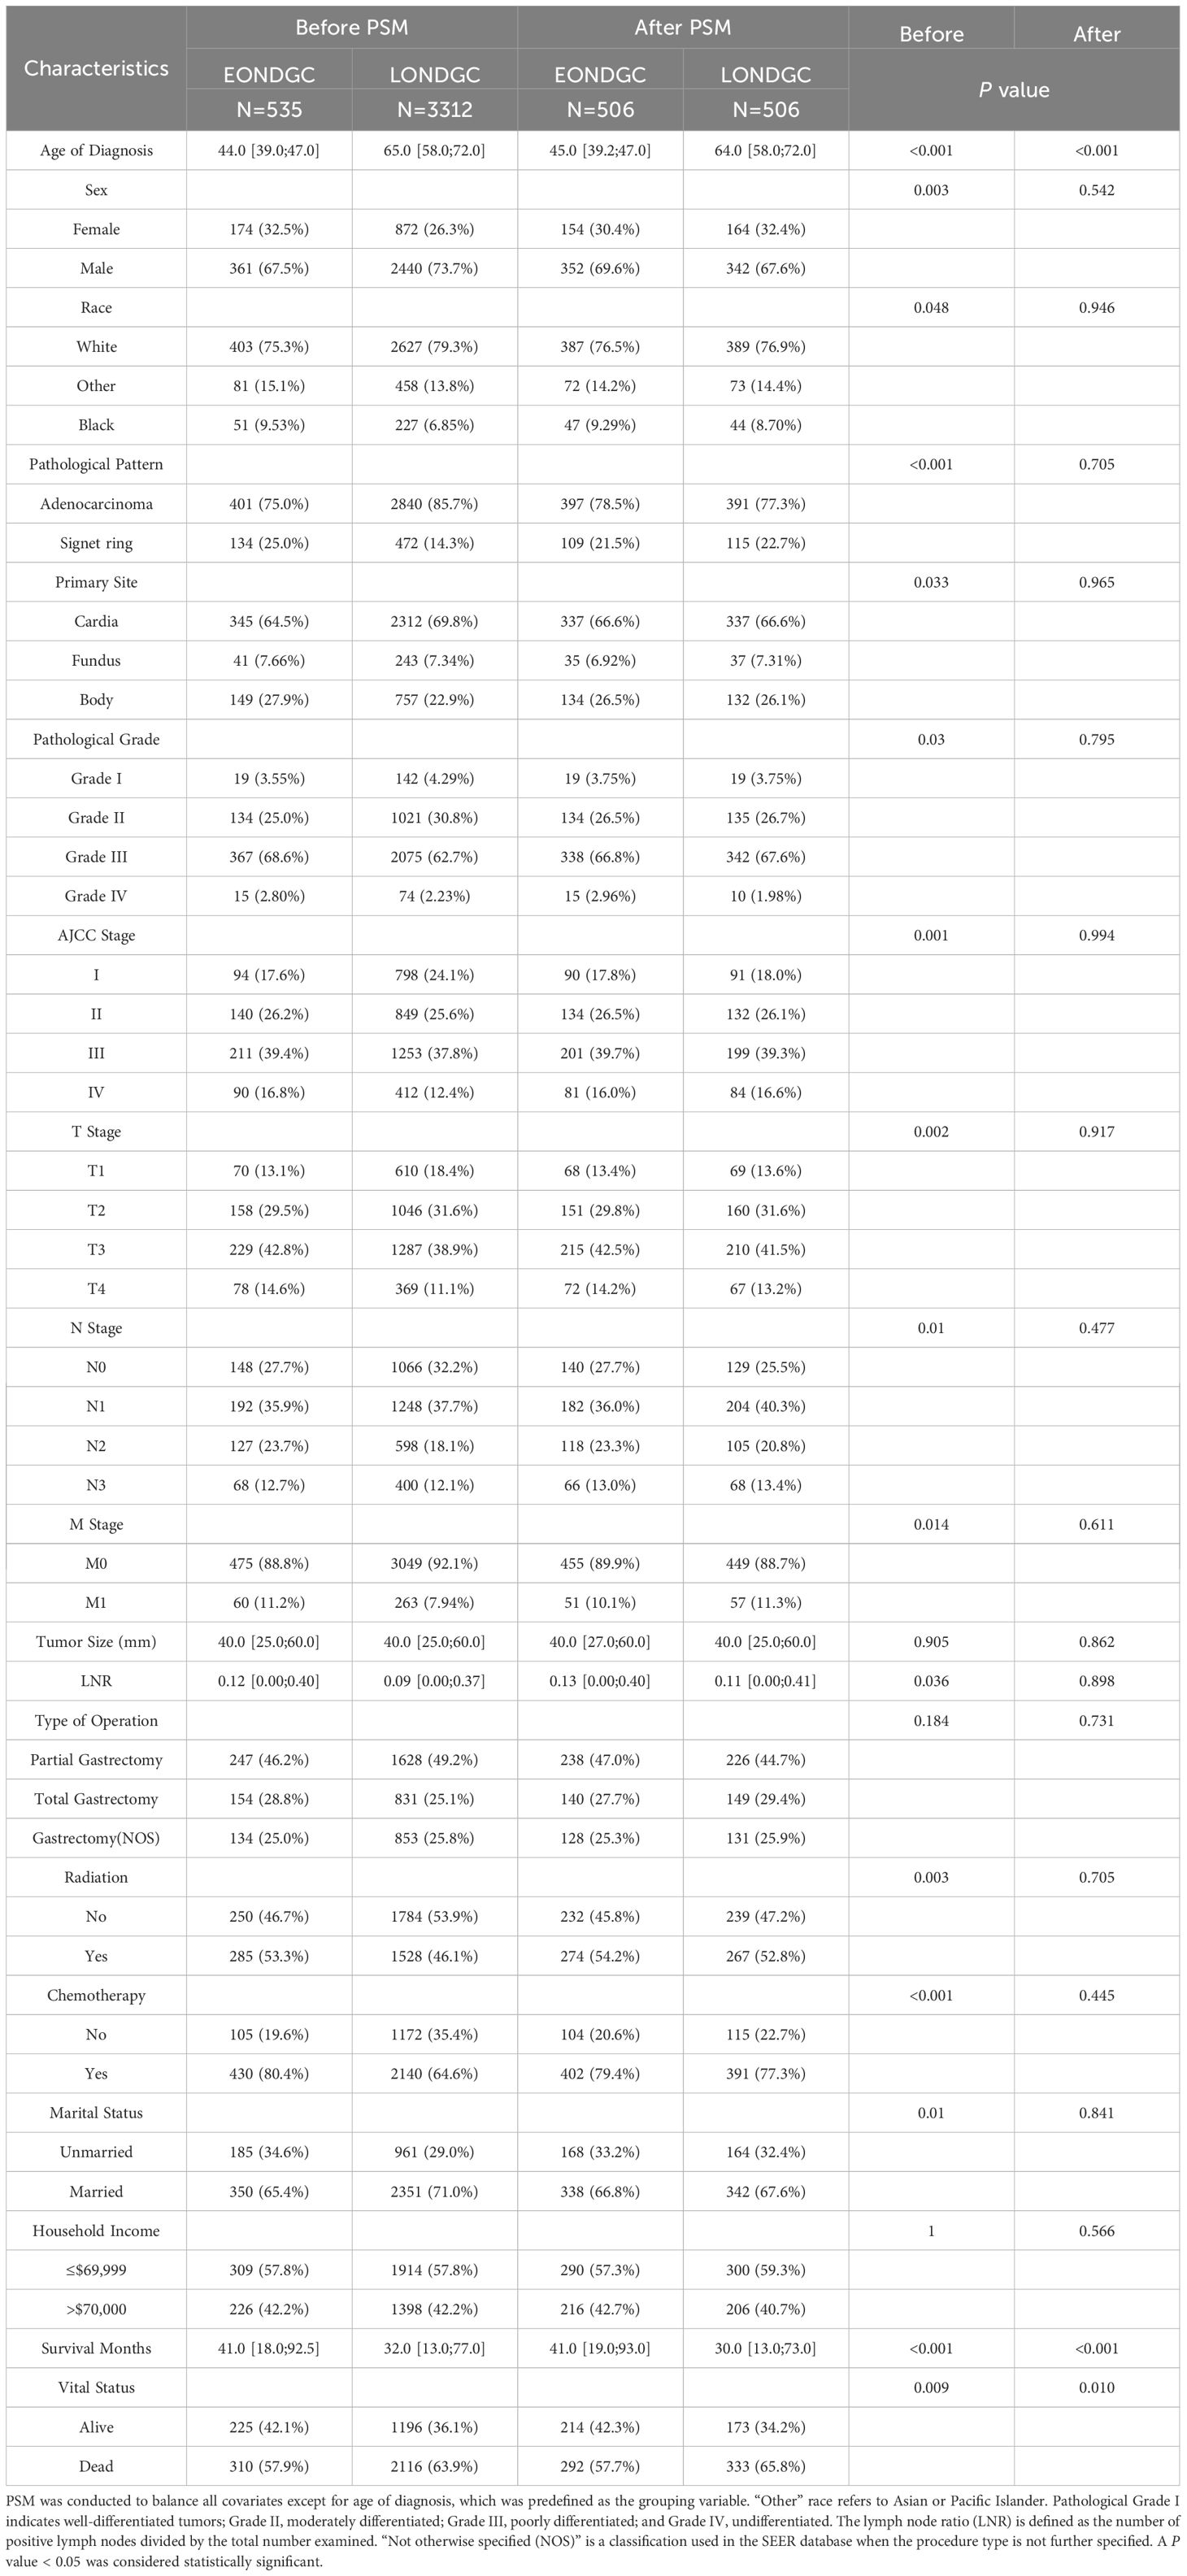
Table 2. Baseline characteristics of EONDGC and LONDGC patients before and after PSM.
In the subgroup analyses (Table 3), significant differences remained in the pathological pattern (P = 0.012), pathological grade (P < 0.001), and American Joint Committee on Cancer (AJCC) stage (P = 0.020) after matching. However, the prognostic differences were not statistically significant: the median survival months were 40.0 and 43.0 (P = 0.909), with mortality rates of 59.4% and 51.9% (P = 0.333), respectively.
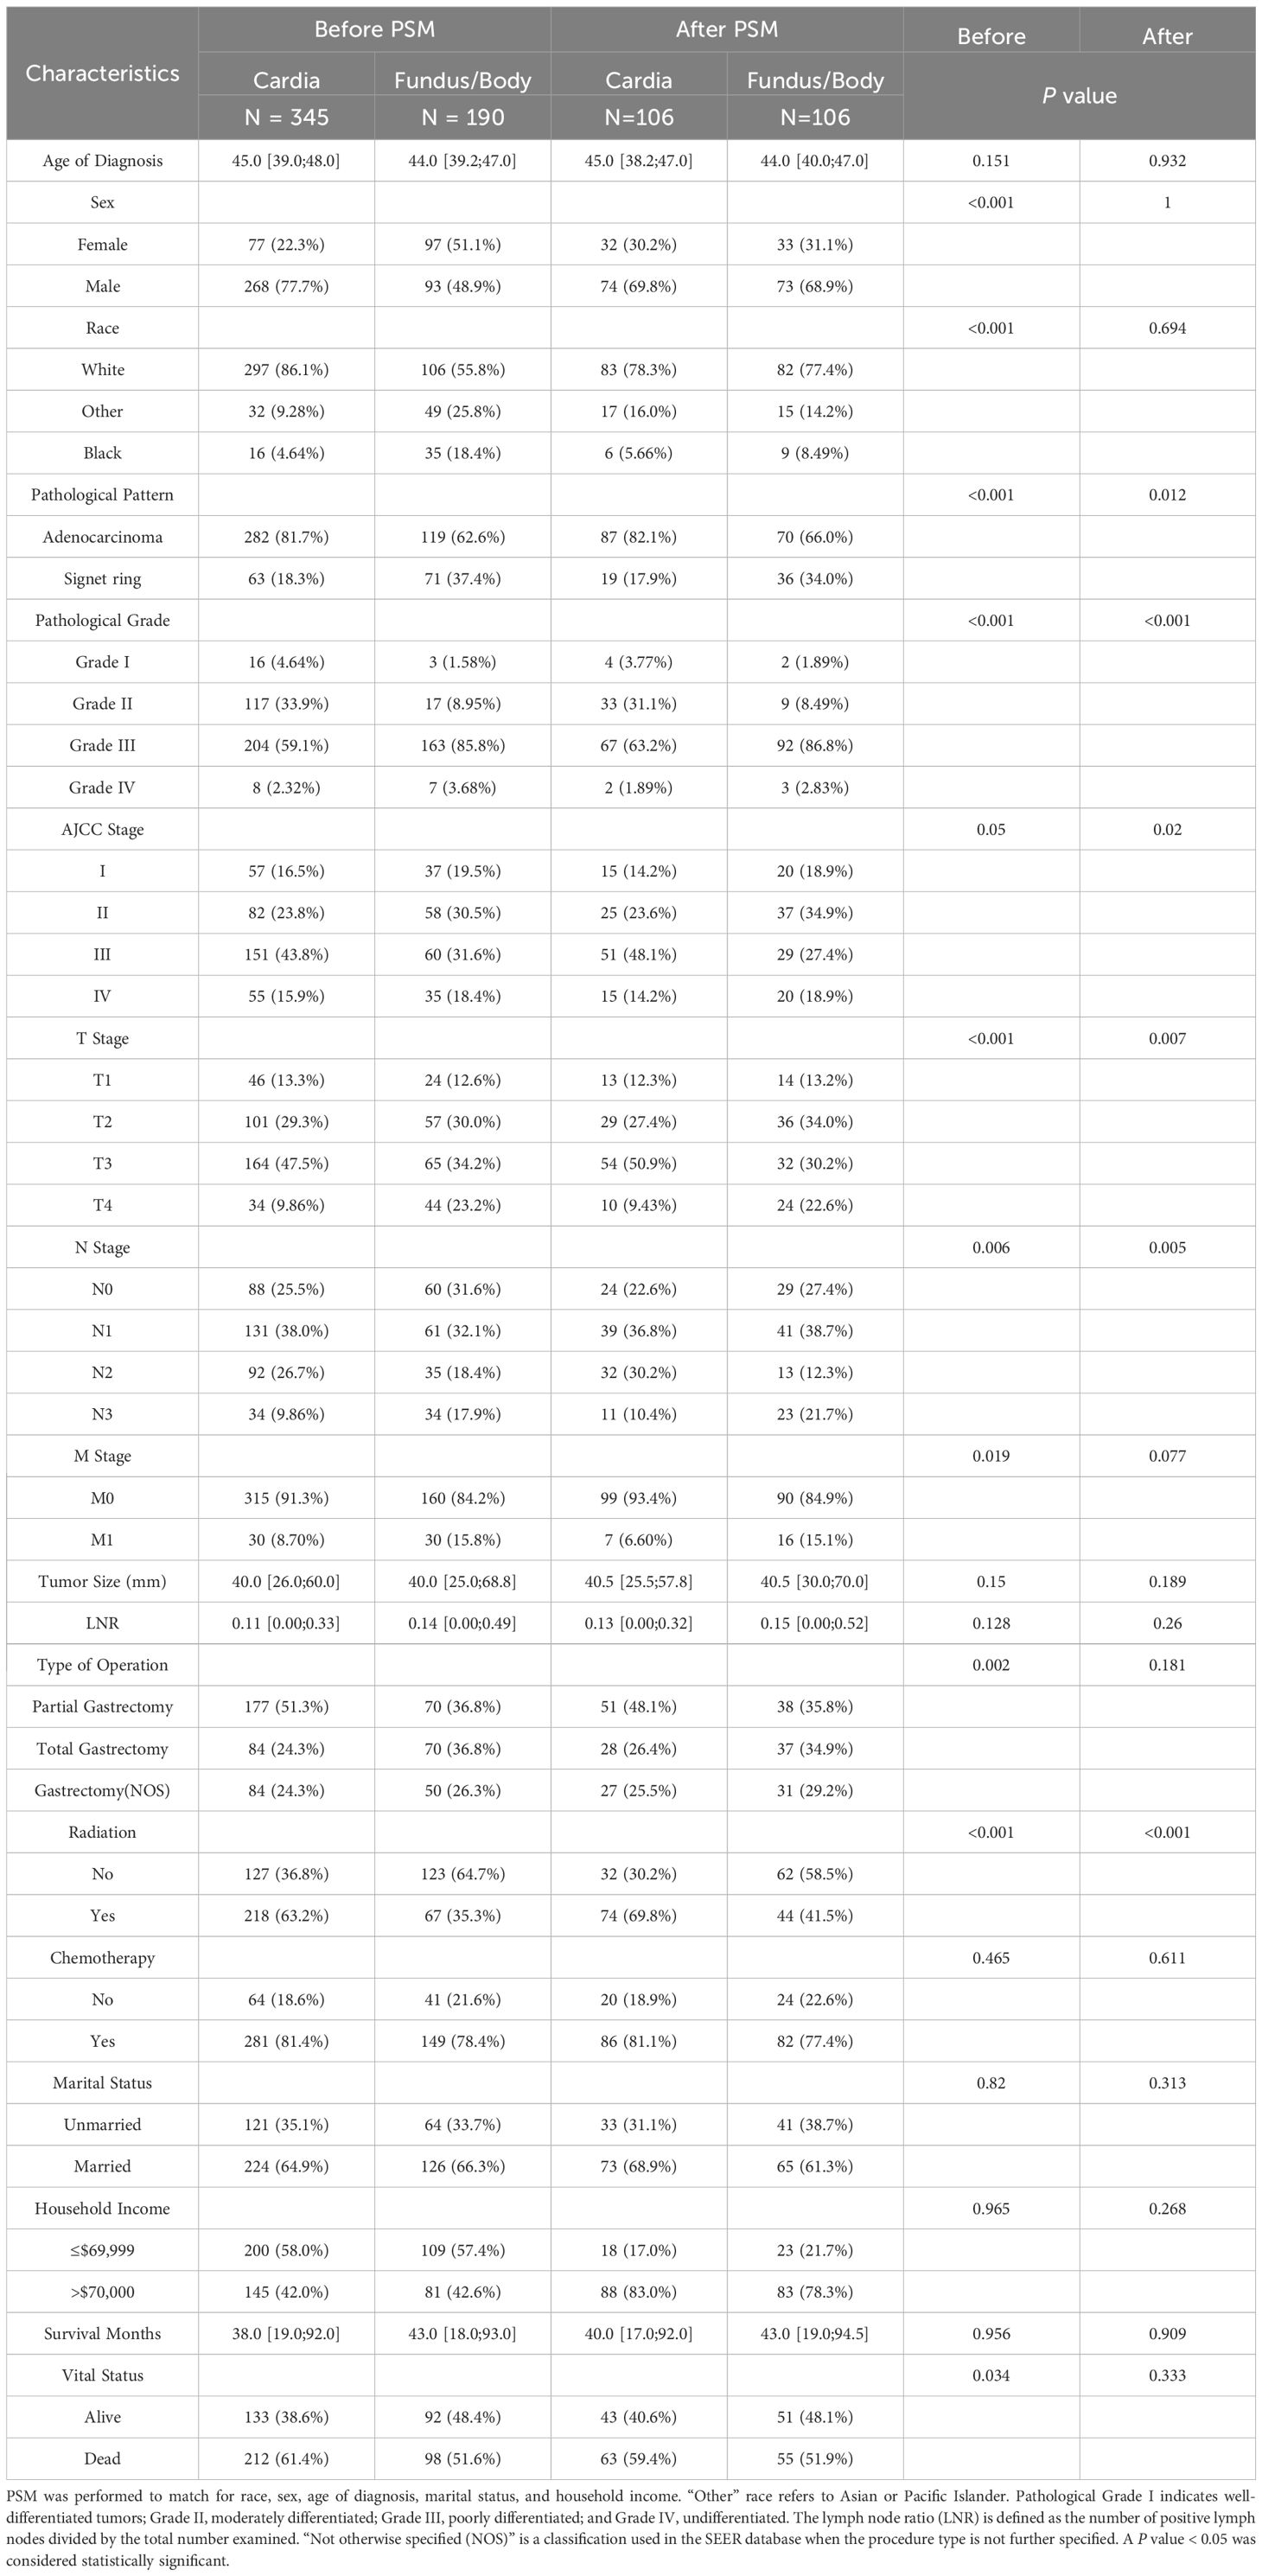
Table 3. Subgroup analysis of EONDGC patients with tumors located in the Cardia versus Fundus/Body, before and after PSM.
After confirming that anatomical subsites within the EONDGC did not significantly influence prognosis, we proceeded with model development. A statistical comparison of the baseline variables between the SEER-training set (n = 376) and SEER-validation set (n = 159) was conducted (Supplementary Table S1), confirming that their distributions were not significantly different. Baseline characteristics of the SEER-training cohort and the SYSU-validation cohort were summarized in Supplementary Table S2.
3.2 The EONDGC prognostic model is composed of seven key factors
Univariate and multivariate Cox proportional hazards regression analyses were conducted to identify prognostic factors associated with overall survival (OS) in patients with EONDGC (Table 4).
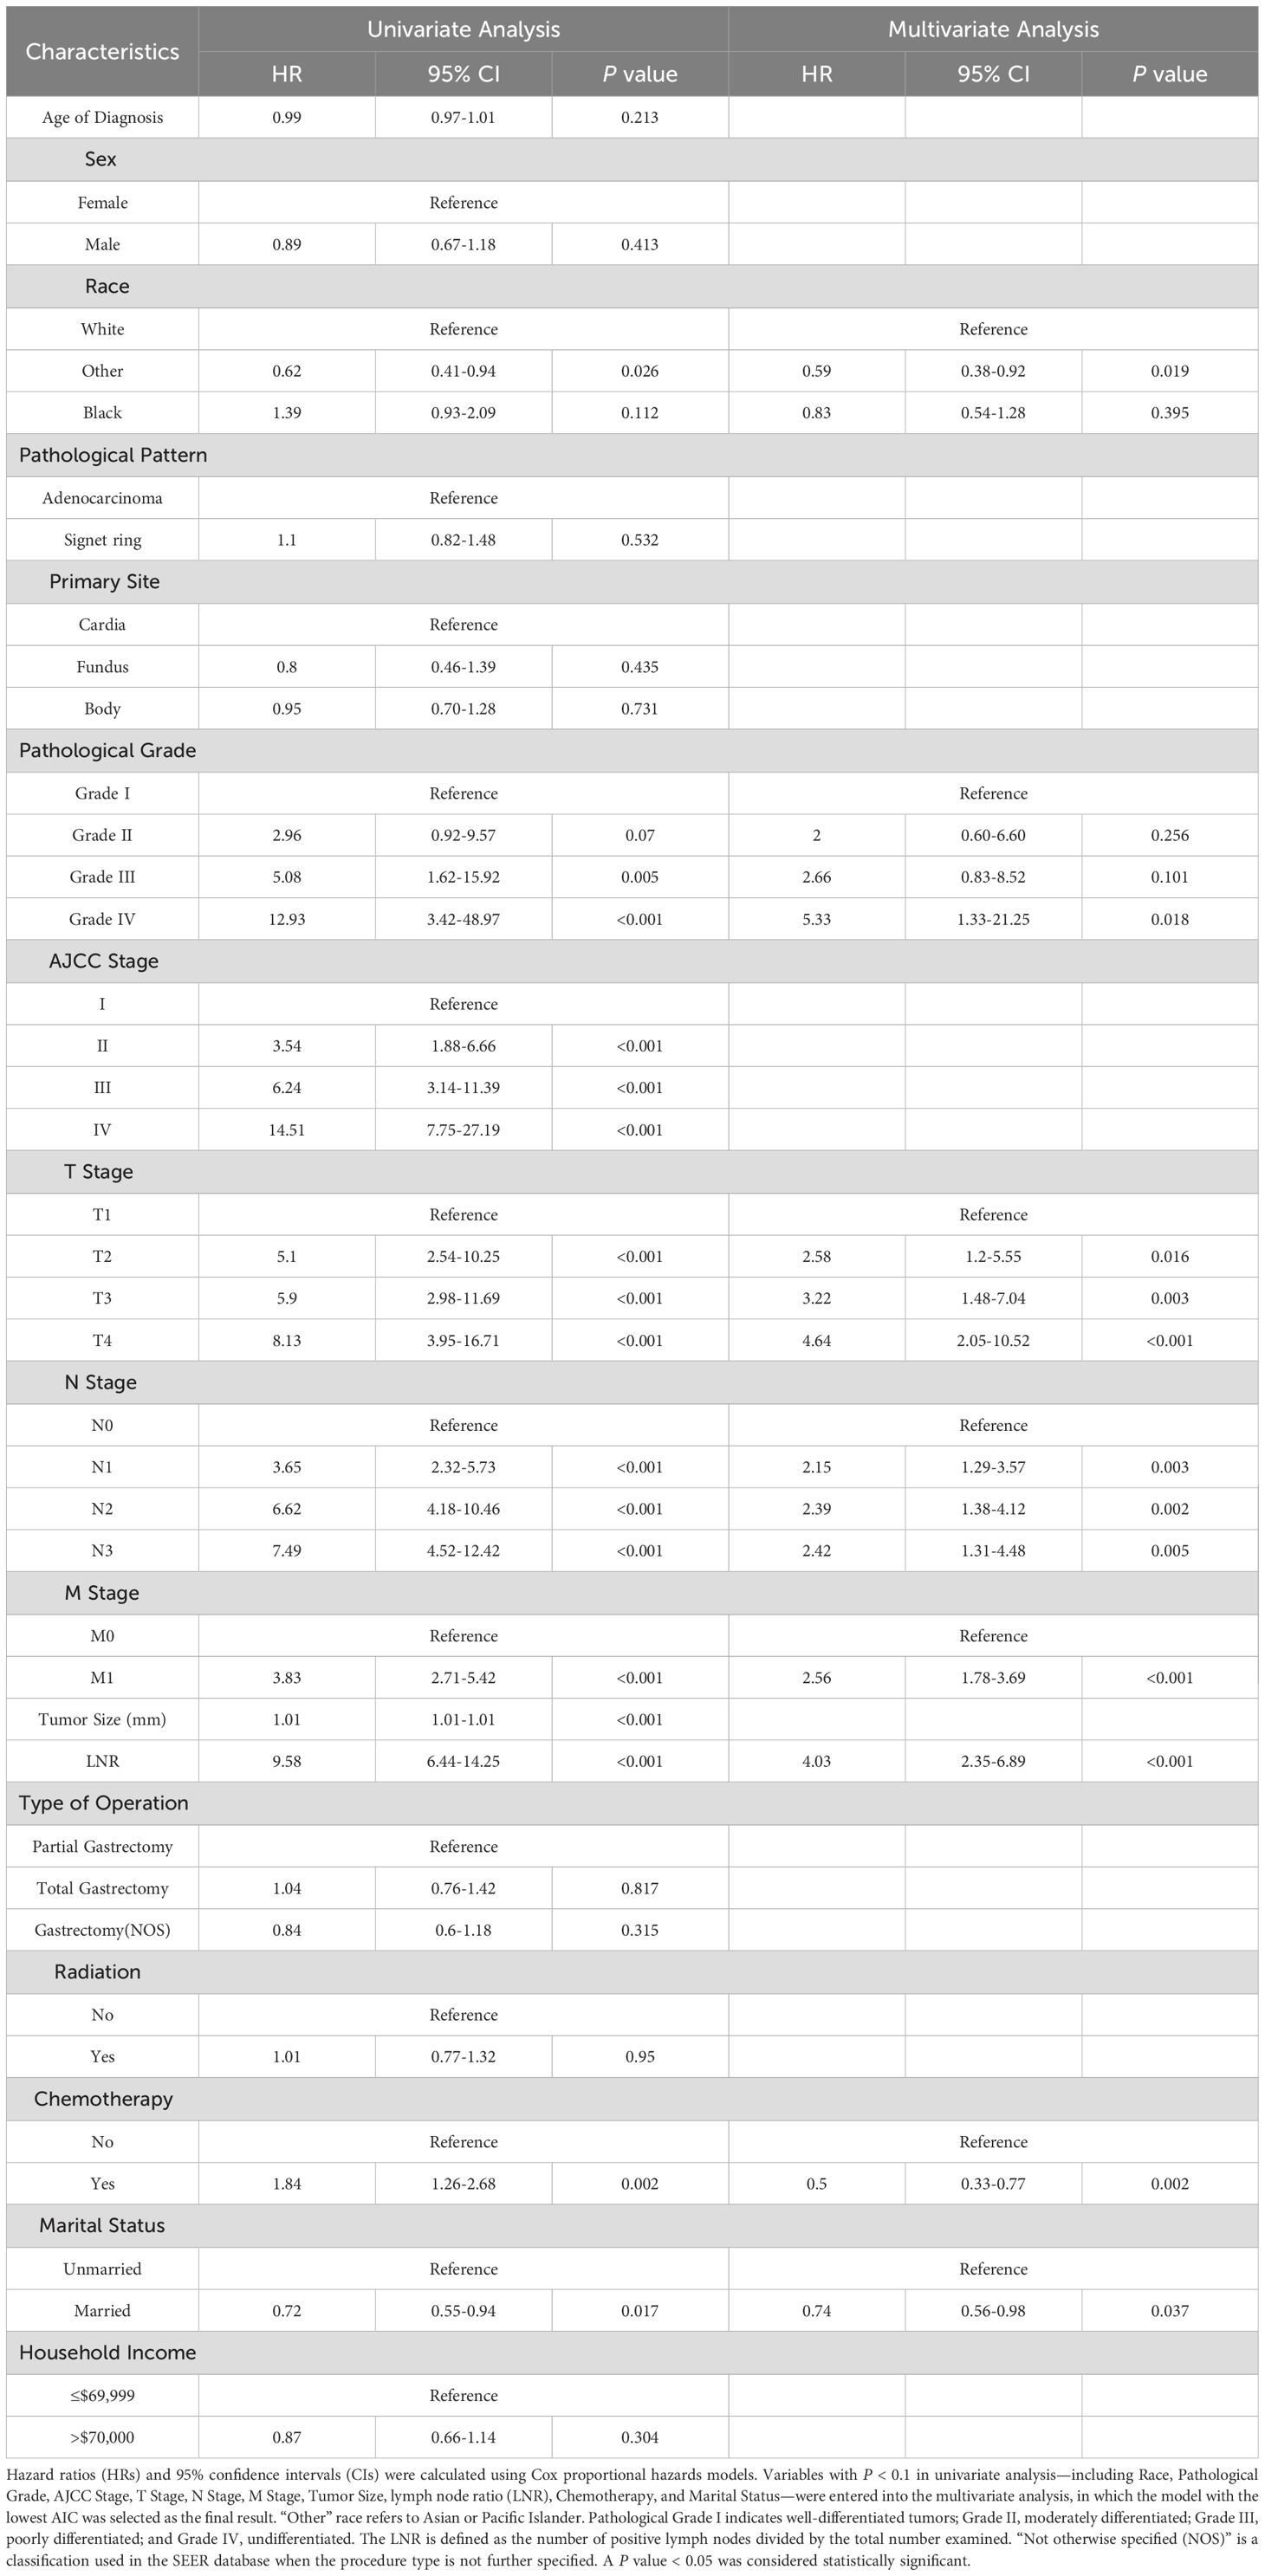
Table 4. Univariate and multivariate Cox regression analysis of overall survival in the SEER-training set.
In the univariate analysis, poor pathological grade (Grade IV: hazard ratio [HR] = 12.93, 95% confidence interval [CI]: 3.42–48.97, P < 0.001), AJCC stage IV (HR = 14.51, 95% CI: 7.75–27.19, P < 0.001), T4 stage (HR = 8.13, 95% CI: 3.95–16.71, P < 0.001), N3 stage (HR = 7.49, 95% CI: 4.52–12.42, P < 0.001), M1 stage (HR = 3.83, 95% CI: 2.71–5.42, P < 0.001), and a high lymph node ratio (LNR; HR = 9.58, 95% CI: 6.44–14.25, P < 0.001) were all significantly associated with worse prognosis. Additionally, larger tumor size (HR = 1.01, 95% CI: 1.01–1.01, P < 0.001) and receipt of chemotherapy (HR = 1.84, 95% CI: 1.26–2.68, P = 0.002) were also linked to increased mortality. Conversely, being of “Other” racial background (HR = 0.62, 95% CI: 0.41–0.93, P = 0.026) and being married (HR = 0.72, 95% CI: 0.55–0.94, P = 0.017) were associated with reduced mortality risk.
In the multivariate analysis, independent predictors of poor survival included T4 stage (HR = 4.64, 95% CI: 2.05–10.52, P < 0.001), N3 stage (HR = 2.42, 95% CI: 1.31–4.48, P = 0.005), M1 stage (HR = 2.56, 95% CI: 1.78–3.69, P < 0.001), and LNR (HR = 4.03, 95% CI: 2.35–6.89, P < 0.001). Meanwhile, chemotherapy was independently associated with improved survival (HR = 0.50, 95% CI: 0.33–0.77, P = 0.002), as were “Other” racial background (HR = 0.59, 95% CI: 0.38–0.92, P = 0.019) and married status (HR = 0.74, 95% CI: 0.56–0.98, P = 0.037).
Given the large number of prognostic factors identified by Cox regression, we applied LASSO regression to reduce variable dimensionality and enhance the model’s predictive efficiency. LASSO regression showed a variable selection range of 2 to 28 predictors (Figure 2). Seven variables were ultimately retained on the basis of their prognostic significance: race, pathological grade, T stage, N stage, M stage, LNR, and chemotherapy.
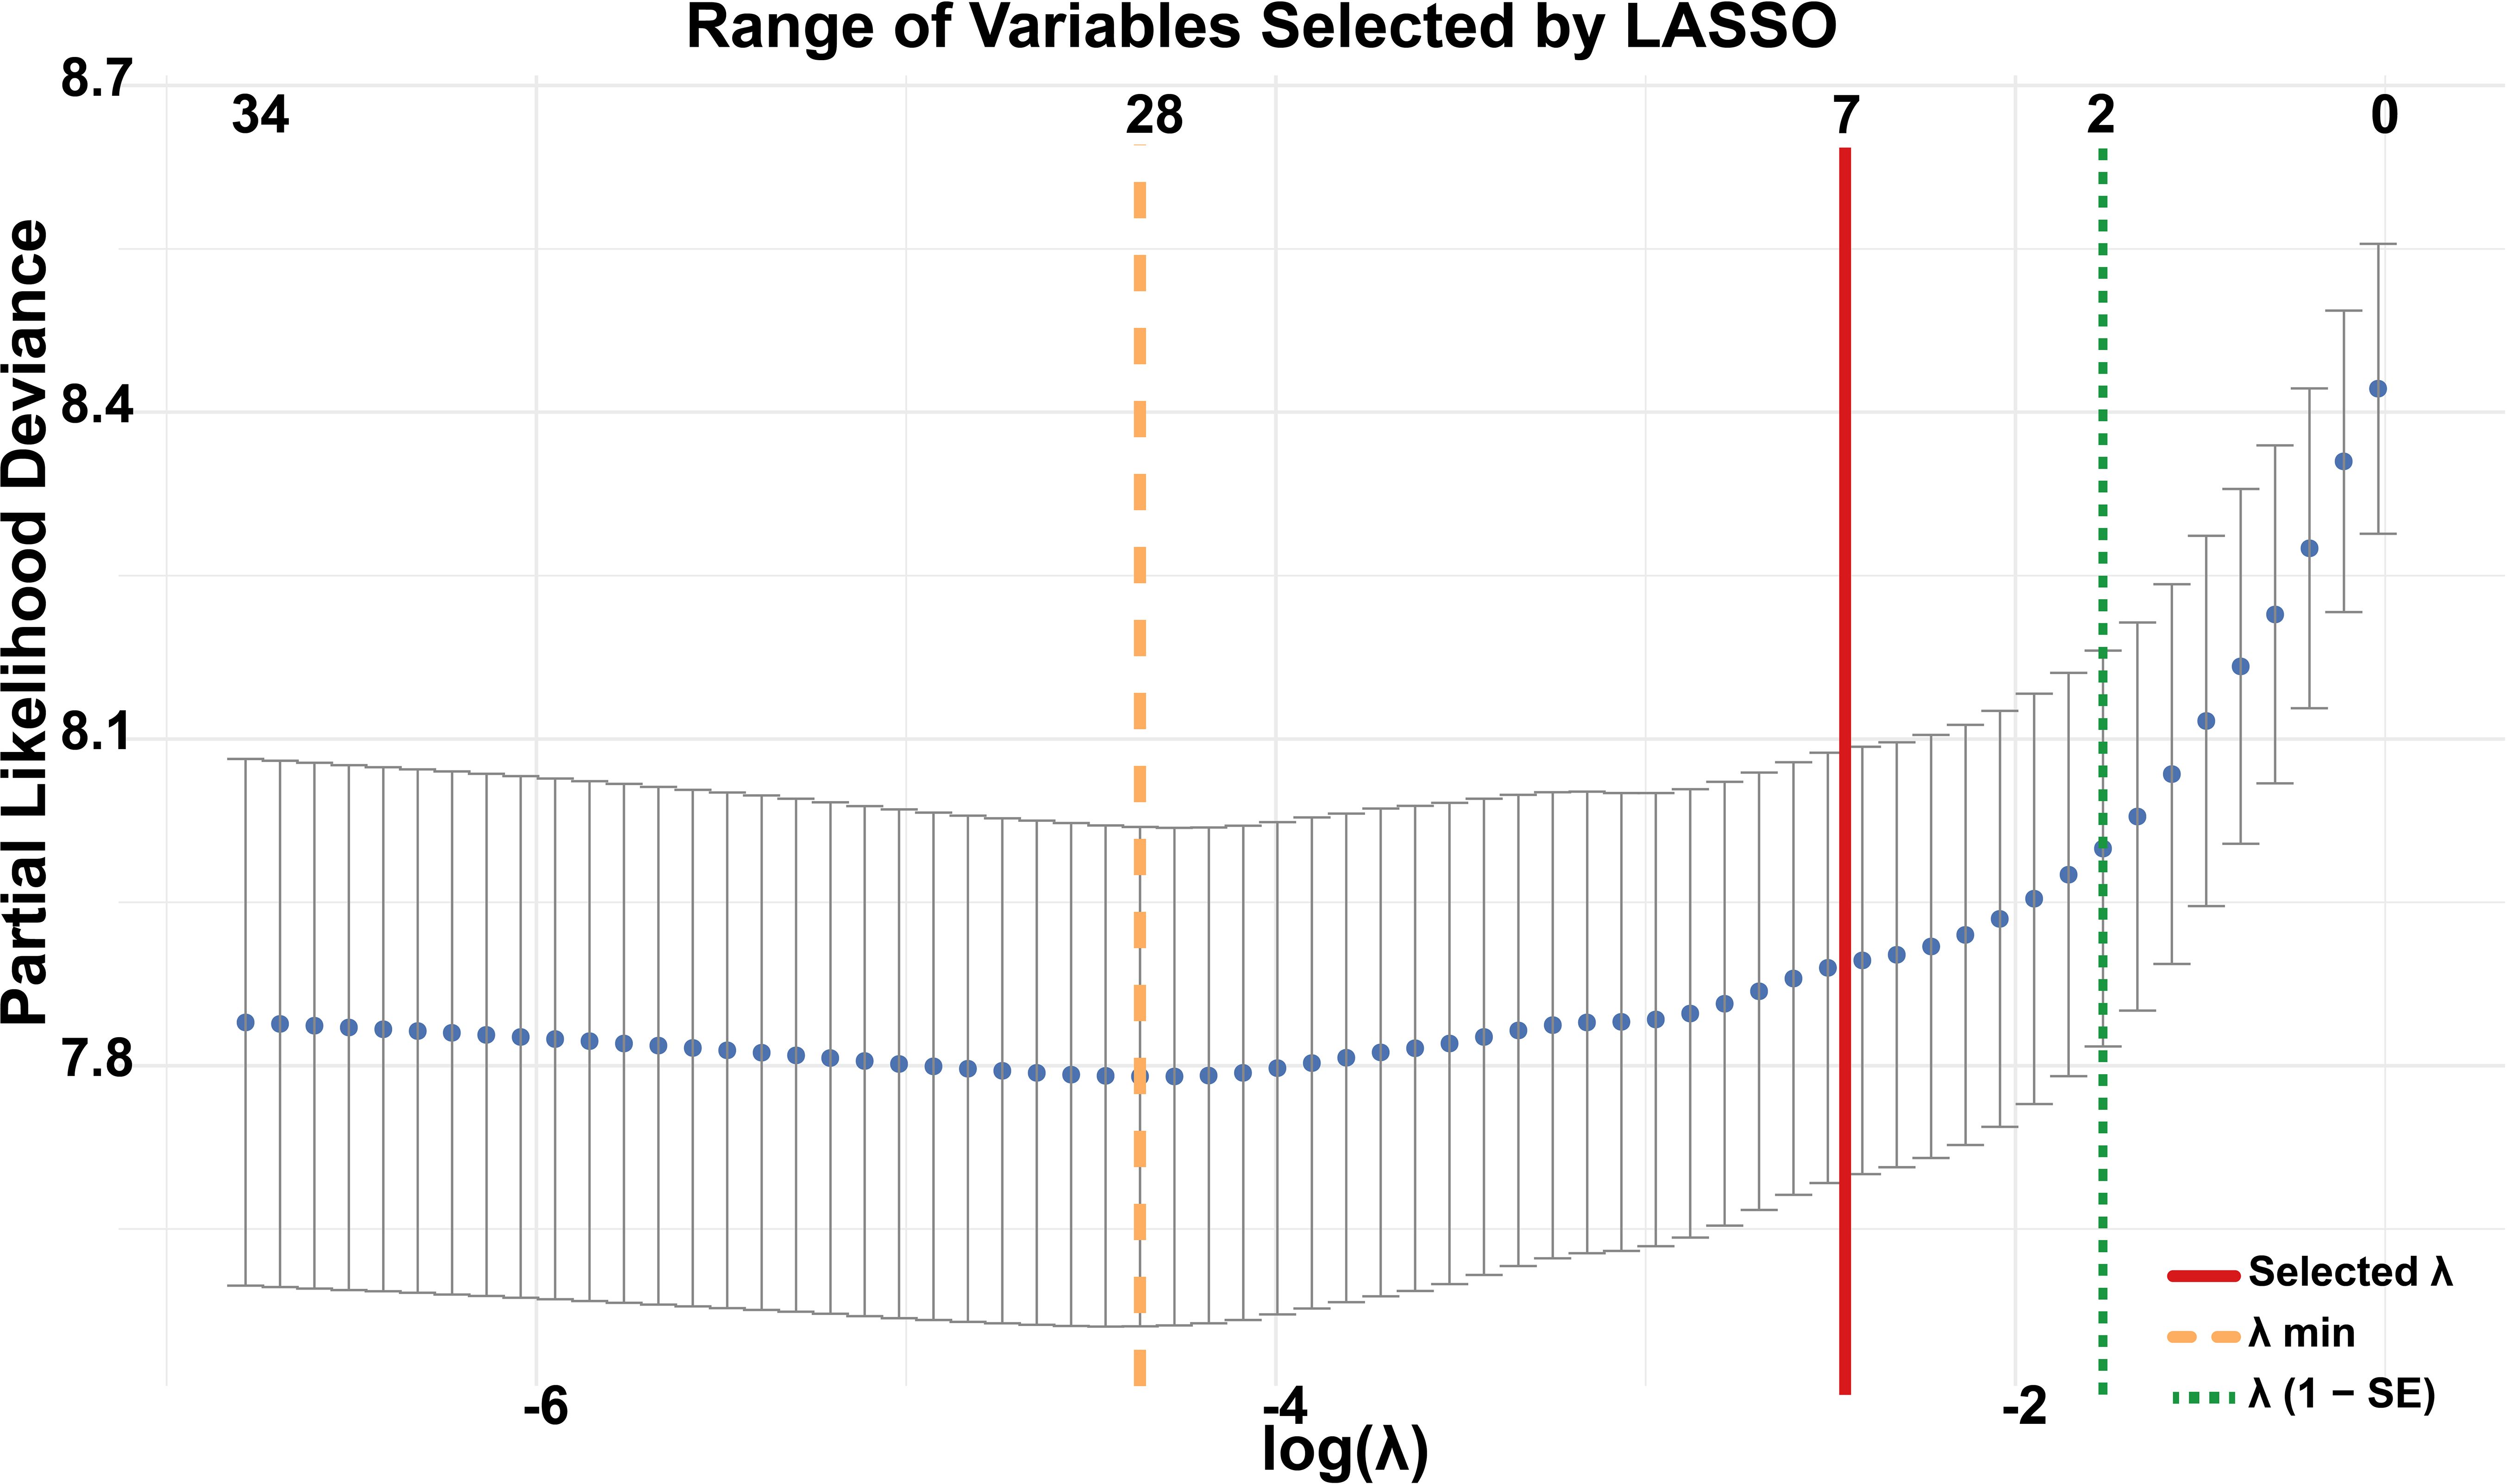
Figure 2. Variable selection using LASSO regression. The y-axis represents partial likelihood deviance from the Cox model, with each dot corresponding to a different log(λ) value in 10-fold cross-validation. The orange dashed line indicates the λ that minimizes the cross-validated error (λ min), selecting 28 variables. The green dotted line marks the largest λ within one standard error of the minimum (λ 1-SE), resulting in a parsimonious model with 2 variables. The red solid line represents the λ value ultimately chosen in this study, which identified 7 variables as the optimal trade-off between model performance and simplicity.
These variables were integrated into a nomogram to visualize the EONDGC prognostic model (Figure 3A). In the nomogram, each variable was assigned a point value (Supplementary Table S3), and the total score was calculated by summing across variables. This total risk score was then mapped to predict 1-, 3-, and 5-year OS probabilities. Furthermore, an interactive web-based dynamic nomogram was developed, allowing users to input specific clinical information and to obtain individualized survival predictions (https://zhangzhq79sysu.shinyapps.io/EONDGC/, Figure 3B).
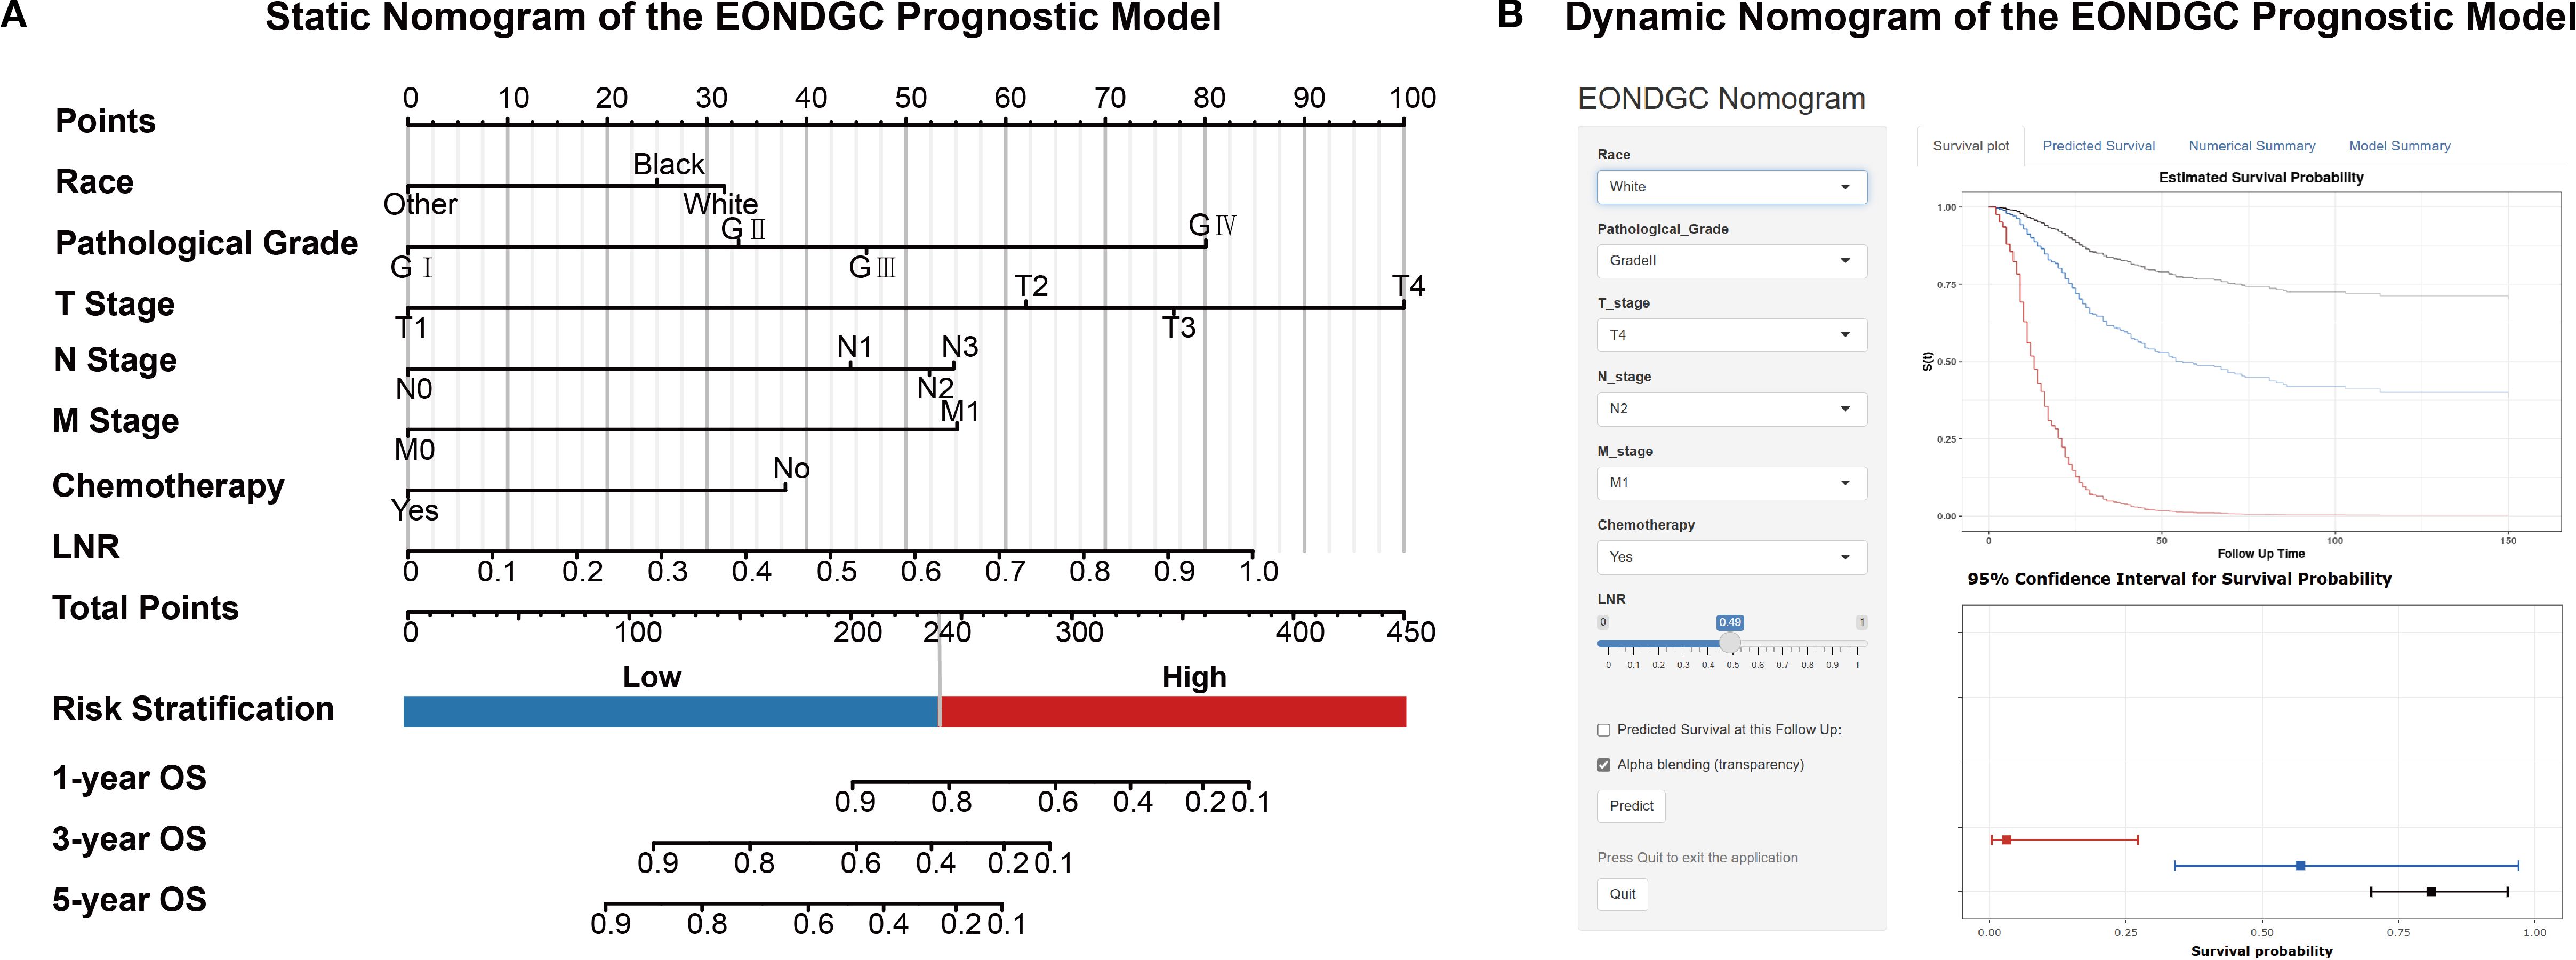
Figure 3. Static and dynamic nomograms for the EONDGC prognostic model. (A) Static nomogram constructed based on multivariable Cox and LASSO regression. Each variable contributes a specific point value reflecting its prognostic weight. The total point score is used to estimate 1-, 3-, and 5-year OS probabilities. A risk stratification threshold of 240 points is used to divide patients into high- and low-risk groups, supporting individualized prognostic evaluation. (B) Interactive dynamic nomogram interface. Users can freely select combinations of seven prognostic variables from the input panel on the left. Upon clicking the “Predict” button, individualized survival predictions are displayed, including Kaplan–Meier survival curves and corresponding 95% CI, enabling real-time visualization of personalized survival probability (https://zhangzhq79sysu.shinyapps.io/EONDGC/).
3.3 The model performance outperforms TNM staging system
The C-index was 0.758 (95% CI: 0.725–0.791) in the SEER-training set, 0.718 (95% CI: 0.663–0.773) in the SEER-validation set, and 0.762 (95% CI: 0.719–0.805) in the SYSU-validation set. In the SEER-training set (Figure 4A), the AUCs at 1, 3, and 5 years were 0.802 (95% CI: 0.738–0.866), 0.817 (95% CI: 0.769–0.854), and 0.837 (95% CI: 0.784–0.866), respectively. In the SEER-validation set (Figure 4B), the corresponding AUCs were 0.760 (95% CI: 0.632–0.877), 0.768 (95% CI: 0.682–0.834), and 0.756 (95% CI: 0.668–0.821). In the SYSU-validation set (Figure 4C), the model achieved AUCs of 0.812 (95% CI: 0.760–0.890) at 1 year, 0.819 (95% CI: 0.757–0.885) at 3 years, and 0.836 (95% CI: 0.761–0.886) at 5 years.
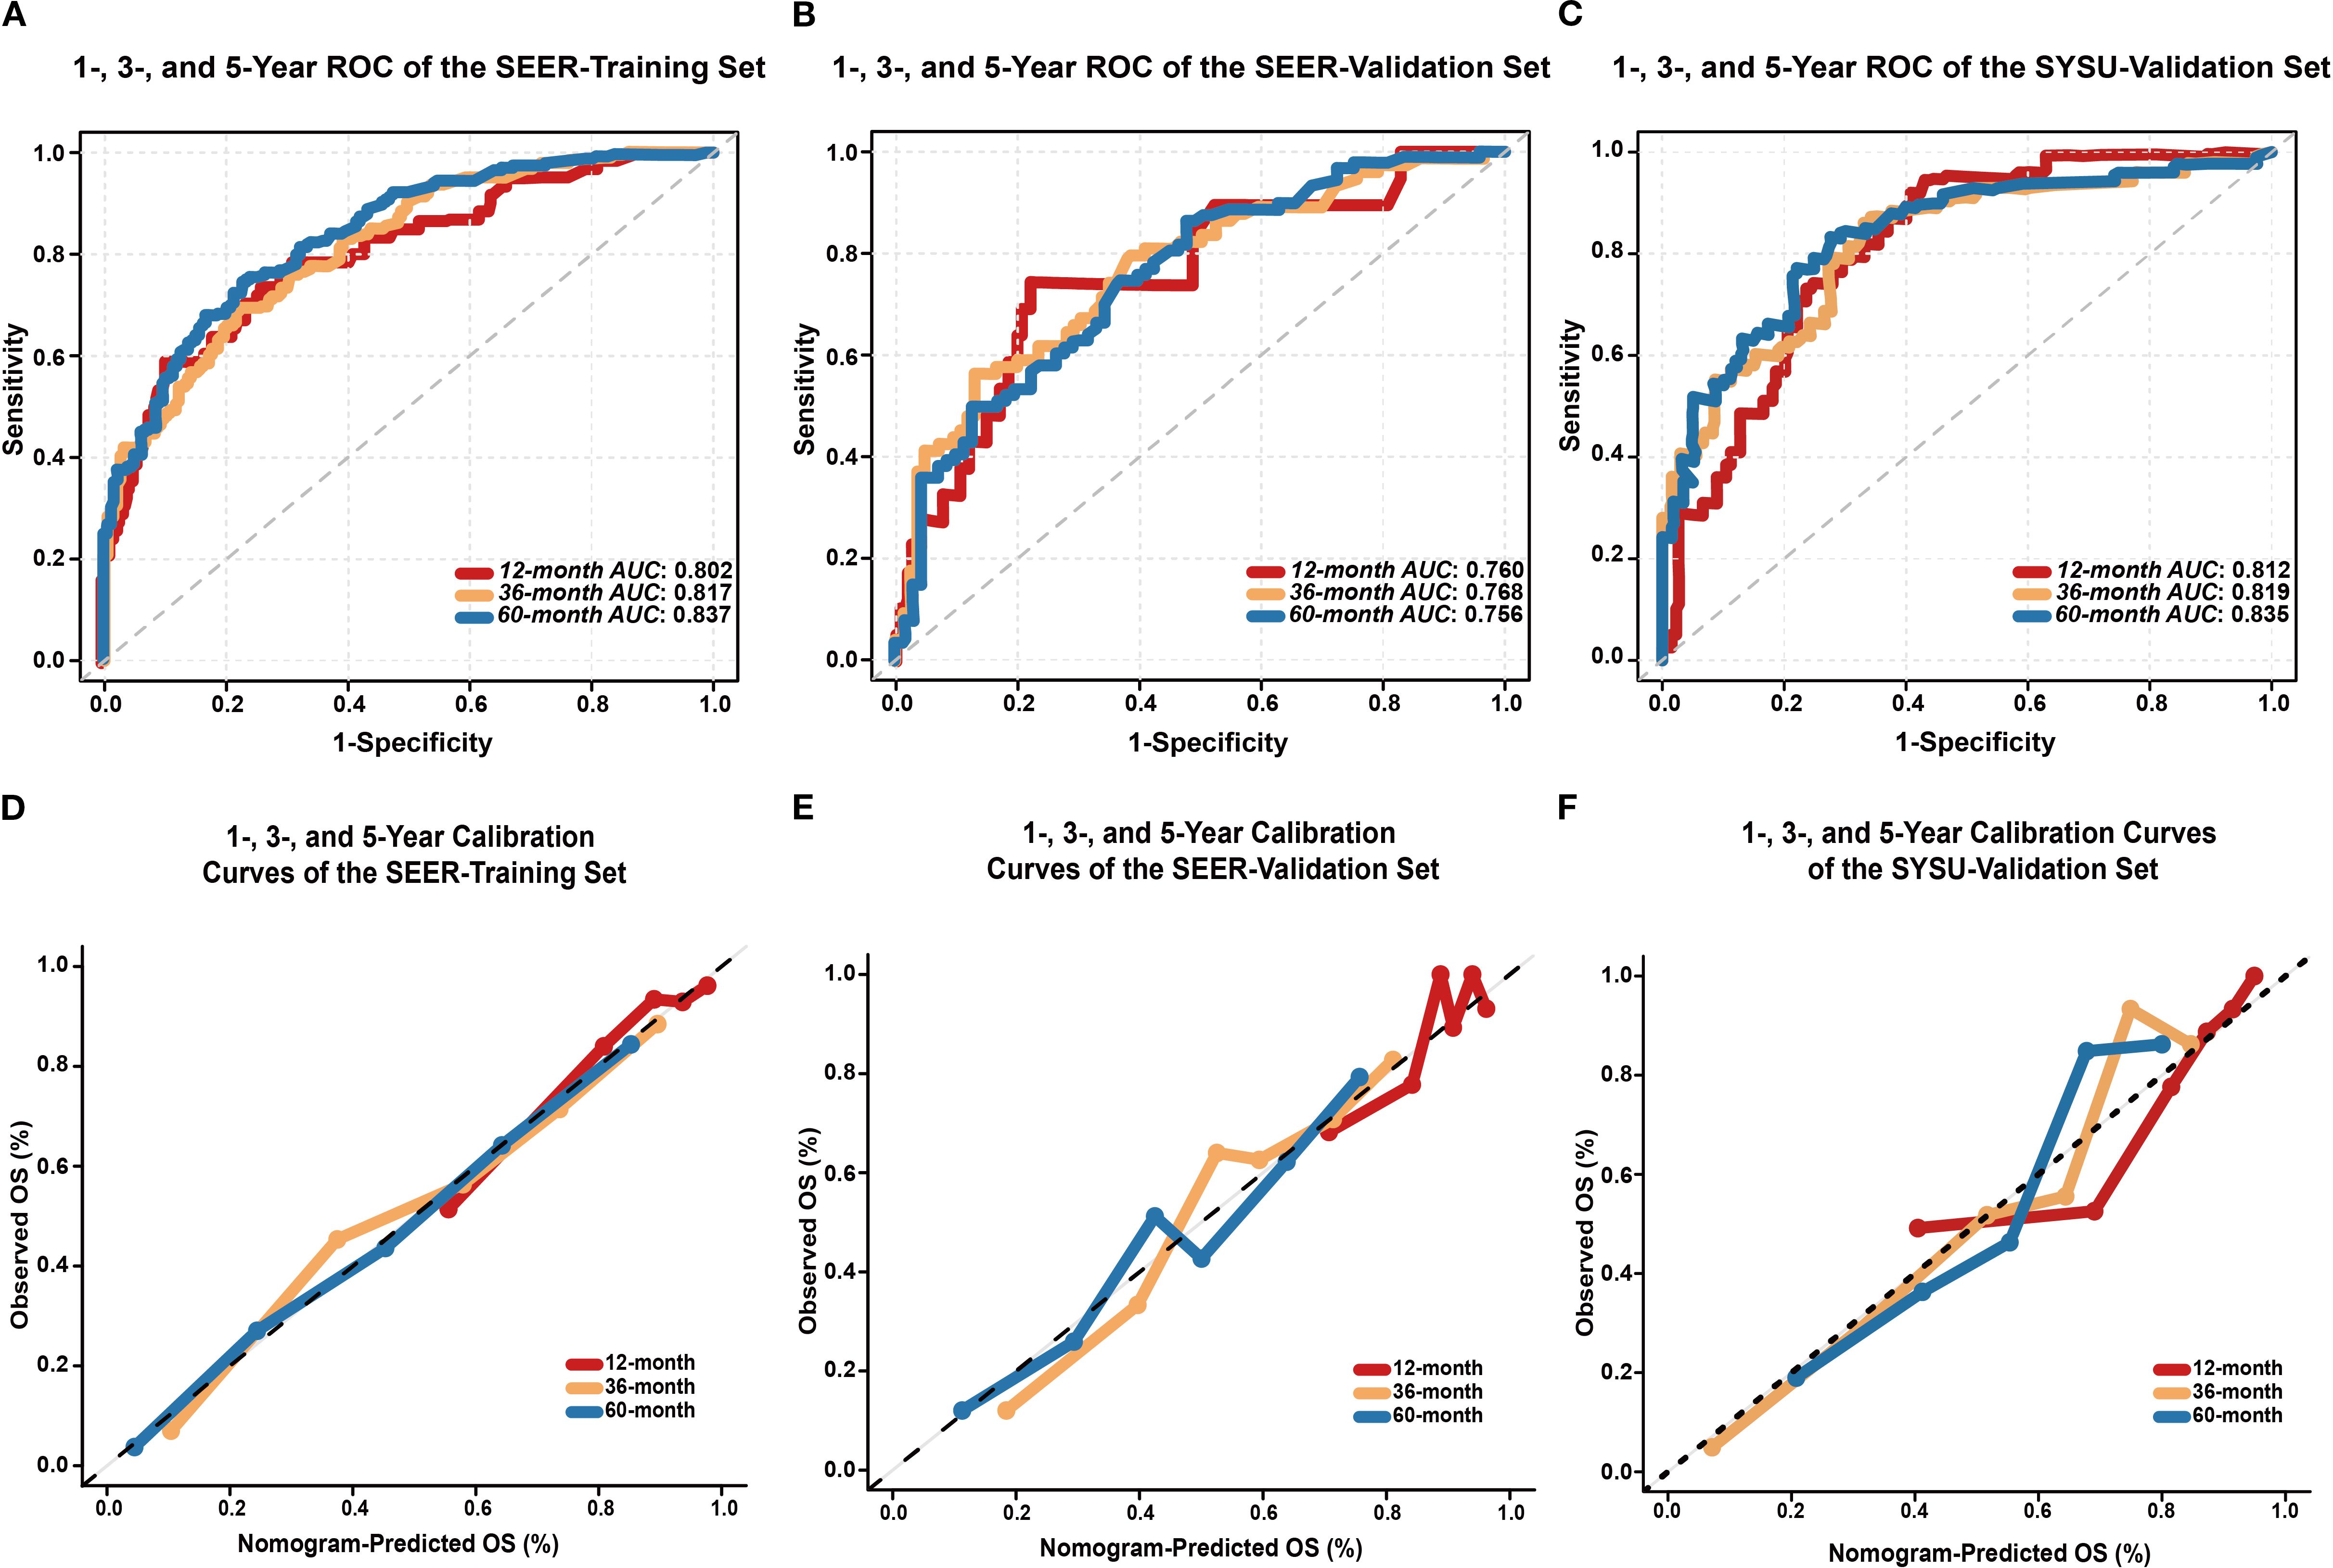
Figure 4. Performance evaluation of the EONDGC prognostic nomogram. (A) Time-dependent ROC curves of the SEER-training set. The model demonstrated strong discriminatory power with AUC values of 0.802, 0.817, and 0.837 for 1-, 3-, and 5-year OS, respectively. AUC values greater than 0.75 generally indicate good discriminative ability of the model. (B) ROC curves of the SEER-validation set. The model maintained satisfactory predictive performance in the external cohort, with AUCs of 0.760, 0.768, and 0.756 at 1, 3, and 5 years, respectively. (C) In the external validation cohort from SYSU, the model exhibited excellent predictive ability, with AUCs of 0.812, 0.819, and 0.836 at 1, 3, and 5 years, respectively. (D) Calibration curves of the SEER-training set at 12, 36, and 60 months show excellent agreement between nomogram-predicted and observed OS probabilities. (E) Calibration curves of the SEER-validation set also demonstrate good consistency. (F) In the external validation cohort from SYSU, calibration curves at 1, 3, and 5 years similarly showed good concordance between predicted and actual OS. In all sets, the curves closely follow the 45° diagonal line, indicating accurate survival prediction and good model calibration. A curve that aligns with the diagonal reflects a minimal deviation between predicted and actual outcomes, which supports the reliability of the model.
In both the SEER-training (Figure 4D) and SEER-validation sets (Figure 4E), the curves at all time points closely aligned with the ideal 45-degree reference line. In the SYSU-validation set (Figure 4F), the 1-, 3-, and 5-year calibration curves showed moderate deviation at intermediate predicted probabilities but remained close to the ideal line in the high-probability range.
To further evaluate the clinical decision-making value of the EONDGC model, we compared its net benefit with that of the traditional TNM staging system using DCA. As shown in Supplementary Figures S1A-C for the SEER-training set and Supplementary Figures S1D-F for the SEER-validation set, the EONDGC model consistently provided a wider range of clinical net benefit than did the traditional Tumor-Node-Metastasis (TNM) staging system across all time points. In the SYSU-validation set (Supplementary Figures S1G-I), the model exhibited higher net benefit than the TNM staging system at 1-, 3-, and 5-year time points across a wide range of threshold probabilities.
3.4 The model effectively differentiates high- and low-risk groups
Significant differences in OS were observed between the high- and low-risk groups in the SEER-training (Figure 5A), SEER-validation (Figure 5B), and SYSU-validation set (Figure 5C; P < 0.0001), indicating consistent and reproducible stratification performance of the model across internal and external datasets.
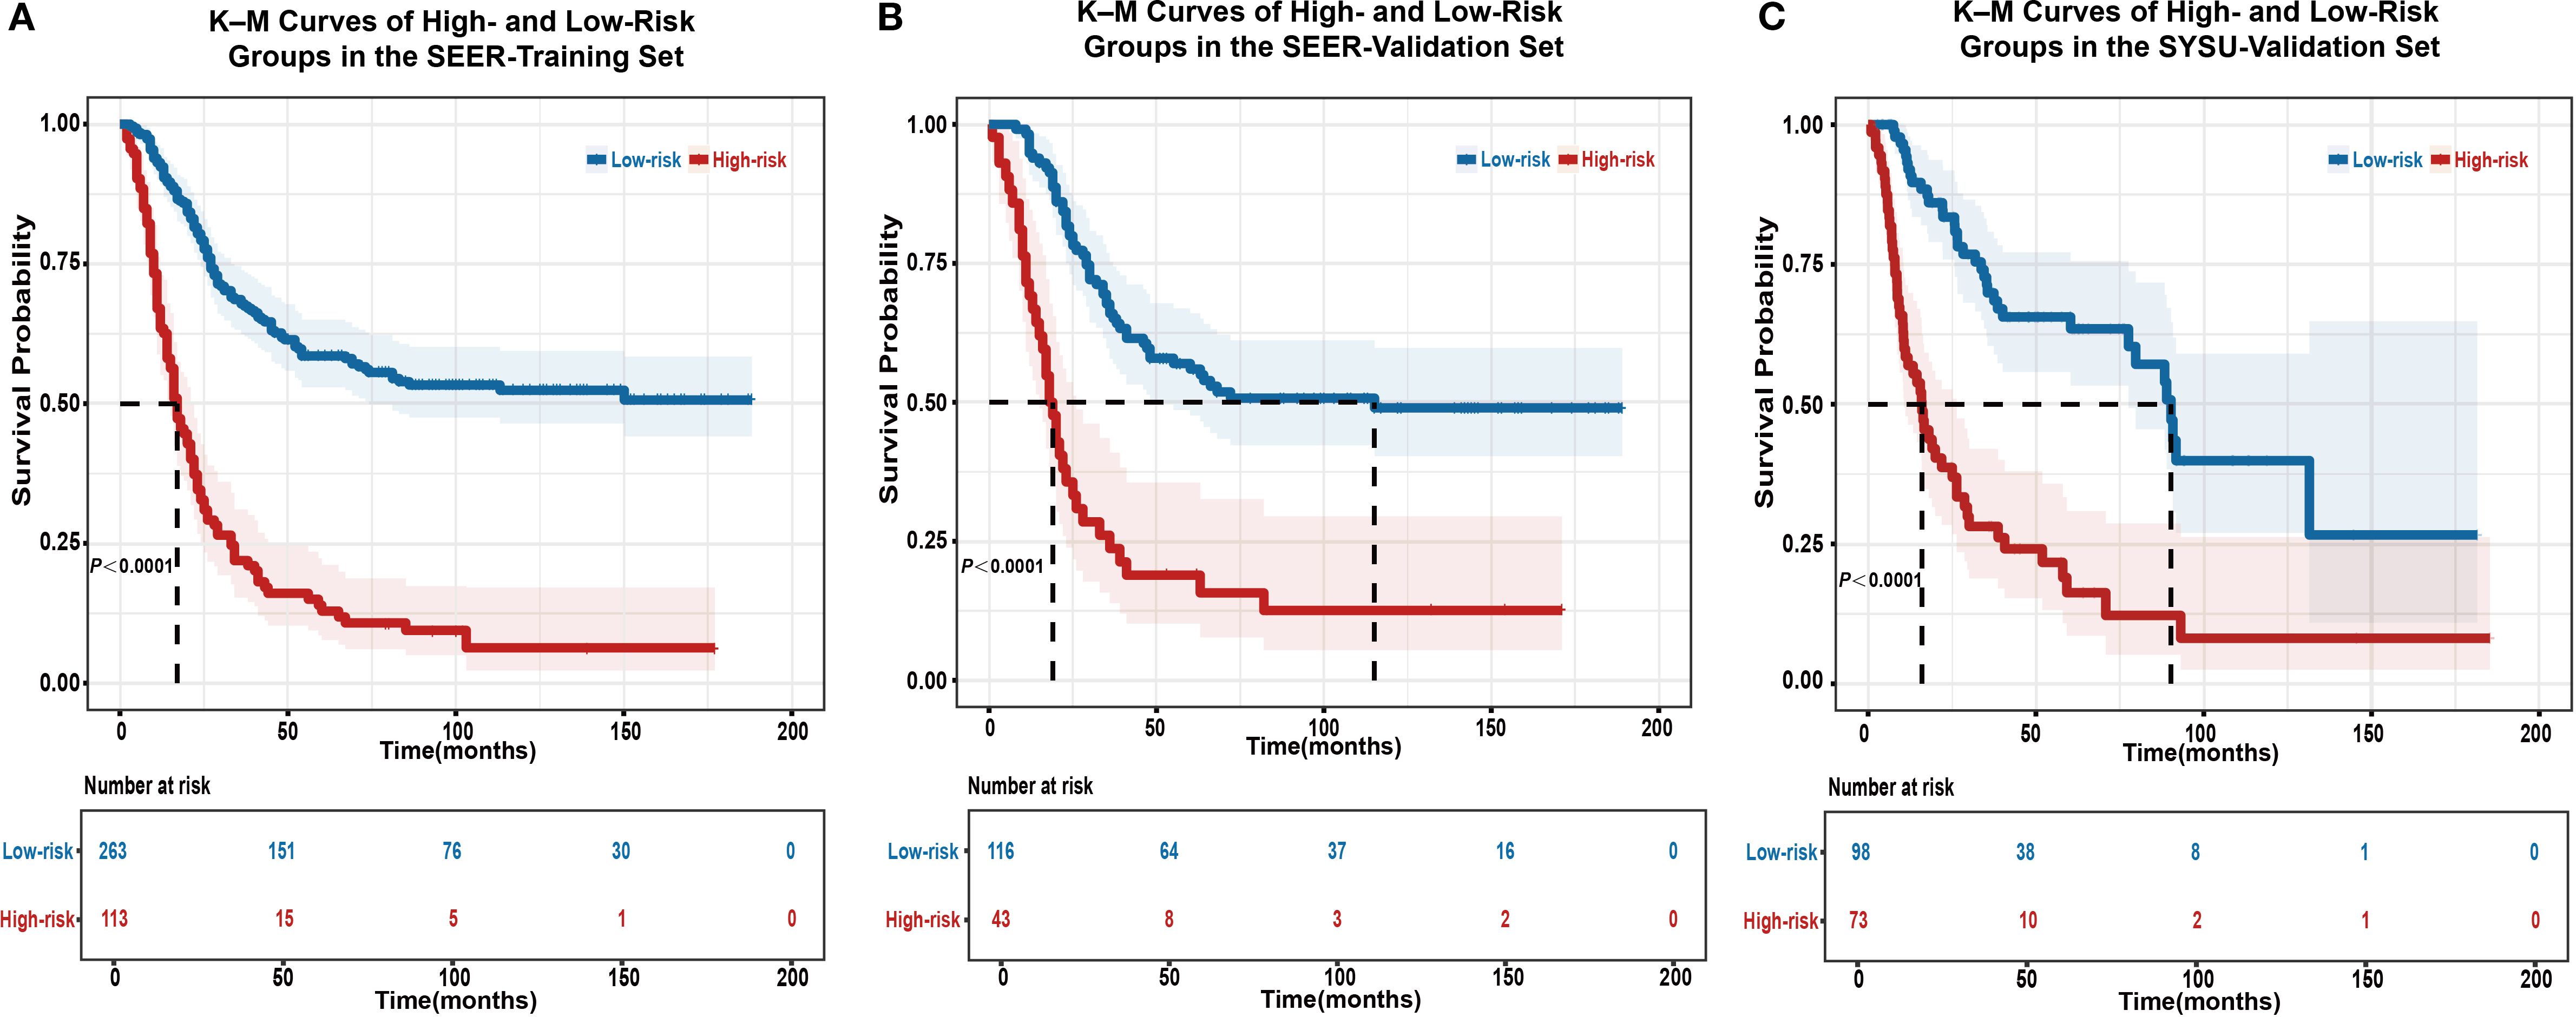
Figure 5. Kaplan–Meier survival analysis for risk stratification using the EONDGC model in the training and validation sets. (A) Kaplan–Meier curve of the SEER-training set shows that patients classified into the high-risk group had significantly worse OS than those in the low-risk group (P < 0.0001). (B) In the SEER-validation set, the model’s risk stratification was successfully reproduced, with a clear separation in survival curves between the two groups (P < 0.0001). (C) In the external validation cohort from SYSU, the high-risk group also showed significantly worse OS compared to the low-risk group (P < 0.0001), confirming the model’s prognostic stratification performance in a real-world clinical setting. Patients were divided based on a risk score cut-off derived from the nomogram. Shaded areas indicate 95% CI, and the number of patients at risk at each follow-up point is listed below the plots. These results highlight the model’s robust ability to distinguish prognosis and support its clinical applicability for individualized survival prediction. A P value < 0.05 was considered statistically significant.
3.5 The ARSB-PDCD1 ratio stratifies immune-related prognostic risk in EONDGC
A total of 10 EONDGC patients from the TCGA cohort were included. Using the EONDGC model, we calculated risk scores for each patient and identified those in the high-risk group for further molecular characterization. DEGs analysis in high-risk patients was visualized using a volcano plot (Figure 6A), identifying 73 significantly upregulated genes. These genes were subsequently subjected to KEGG pathway enrichment analysis (Figure 6B), and their expression profiles are displayed in a heatmap (Figure 6C). A global comparison of DEGs analysis between early-onset and late-onset NDGC was presented in Supplementary Figures S2A, B. Based on the upregulated genes (Supplementary Table S4), univariate and multivariate Cox regression analyses were performed in the TCGA-NDGC cohort to evaluate their prognostic significance.
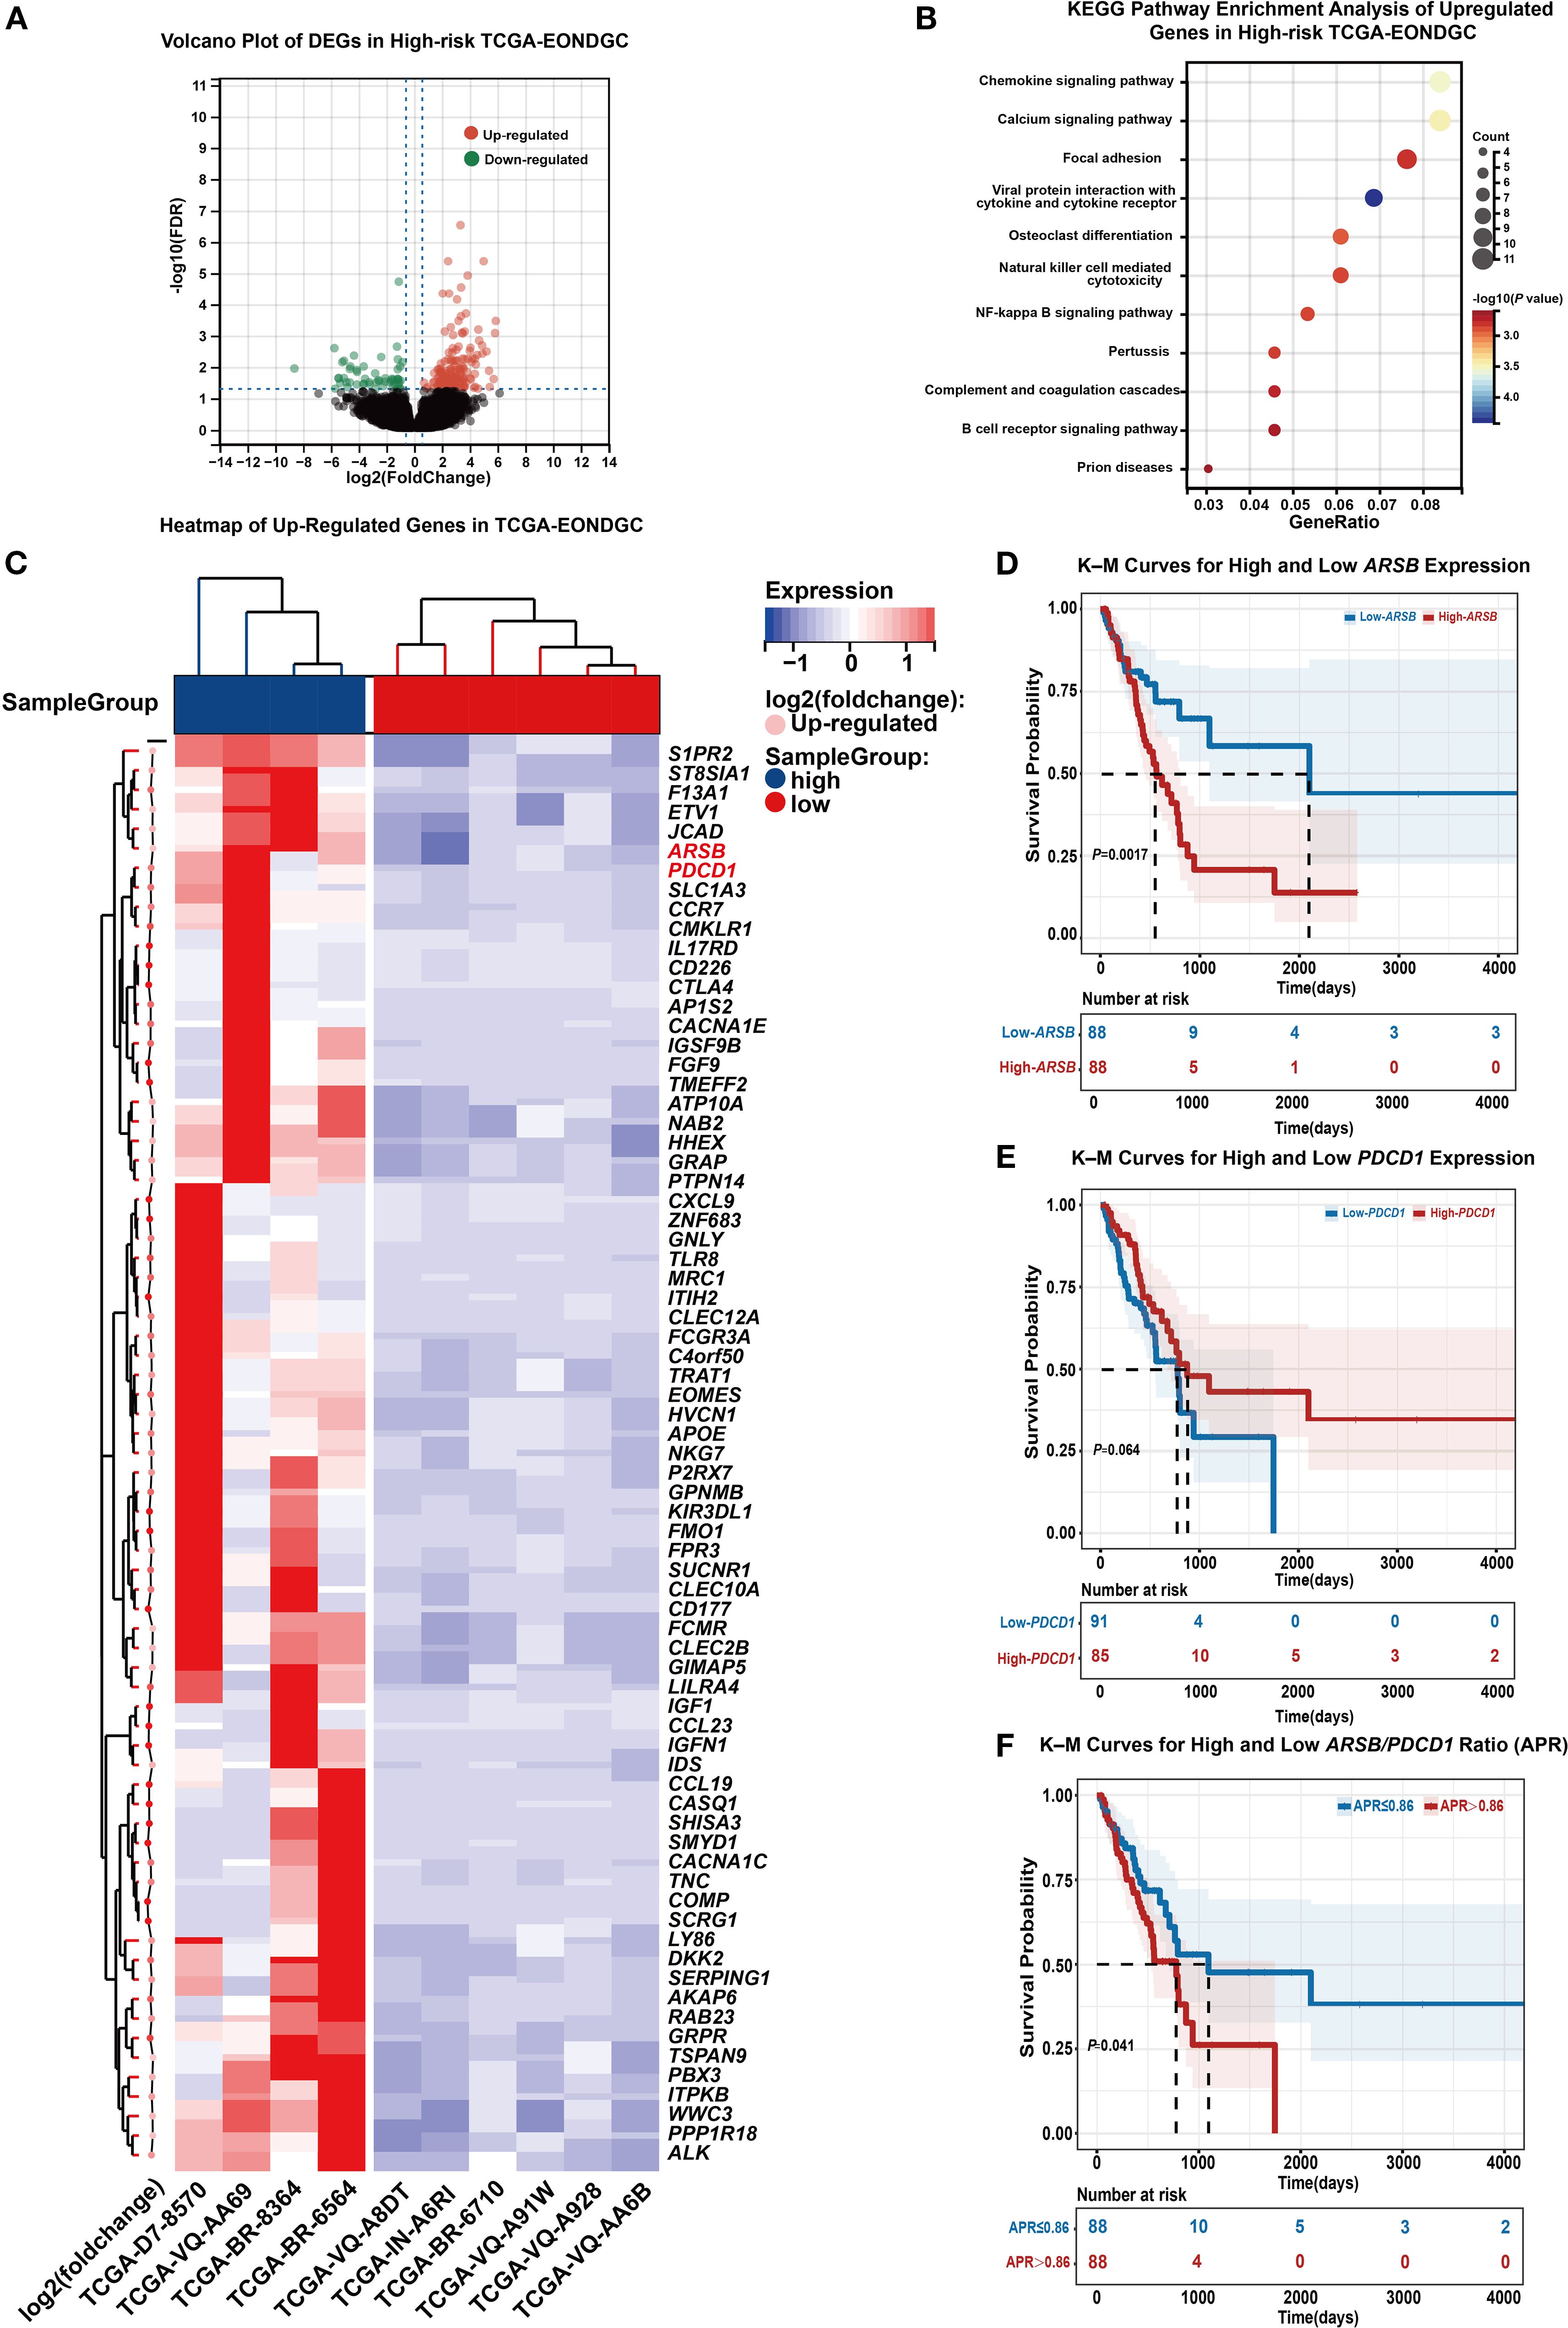
Figure 6. Integrated transcriptomic and survival analysis in high-risk EONDGC. (A) Volcano plot of DEGs between high- and low-risk EONDGC patients, defined by nomogram-derived risk scores in the TCGA cohort. Red dots indicate significantly upregulated genes, green dots indicate significantly downregulated genes, and black dots denote non-significant genes. (B) KEGG pathway enrichment analysis of upregulated genes in the high-risk group. Each bubble represents an enriched pathway; bubble size reflects the number of genes, and color indicates statistical significance (–log10P), with warmer colors corresponding to higher significance. Enriched pathways were mainly related to immune regulation and intracellular signaling. (C) Heatmap showing expression patterns of upregulated DEGs between high- and low-risk EONDGC samples. Rows represent individual genes, and columns represent patient samples. Red and blue indicate higher or lower expression relative to row-wise mean values. Hierarchical clustering reveals distinct expression profiles between risk groups. (D-F) Kaplan–Meier survival curves stratified by expression of ARSB (D), PDCD1 (E), and the APR (F). Patients were divided into high and low groups using the median value for each marker. High ARSB expression and elevated APR were significantly associated with worse overall survival (P = 0.0017 and P = 0.041, respectively), while PDCD1 showed a non-significant trend toward improved prognosis (P = 0.064). Shaded areas represent 95% CI. Numbers at risk are shown below each time point. A P value < 0.05 was considered statistically significant.
In the univariate analysis, genes such as JCAD (HR = 2.02, 95% CI: 1.21–3.37, P = 0.007), WWC3 (HR = 1.88, 95% CI: 1.14–3.12, P = 0.014), TNC (HR = 1.7, 95% CI: 1.04–2.79, P = 0.034), and ARSB (HR = 2.23, 95% CI: 1.33–3.72, P = 0.002) were associated with a greater risk of death. In the multivariate analysis, ARSB (HR = 2.40, 95% CI: 1.38–4.17, P = 0.002) and PDCD1 (HR = 0.50, 95% CI: 0.27–0.91, P = 0.024) remained statistically significant. To further validate their prognostic stratification potential and explore their combined impact, we conducted Kaplan-Meier survival analyses based on ARSB, PDCD1, and their expression ratio.
As shown in Figure 6D, patients with high ARSB expression had significantly worse OS than those with low expression (18.7 vs. 70.0 months, P < 0.05). In Figure 6E, higher PDCD1 expression was associated with a better prognosis, although the difference did not reach statistical significance (21.9 vs. 25.9 months, P = 0.064). Figure 6F showed that patients with an ARSB/PDCD1 ratio (APR) >0.86 had significantly worse survival than those with an APR ≤ 0.86 (25.9 vs. 36.5 months, P = 0.041). In addition, APR was inversely correlated with the IPS (Supplementary Figure S2C). ROC analysis further showed that APR discriminated IPS status with an AUC of 0.729 (Supplementary Figure S2D).
3.6 ARSB overexpression enhances migratory capacity of GC cells
To enable gain-of-function testing, an ARSB overexpression plasmid was constructed (Figure 7A) and transiently introduced into MGC-803 and AGS cells. RT-qPCR confirmed robust ARSB mRNA upregulation relative to empty-vector controls (Figures 7B, C). In wound-healing assays, representative images at 0/24/48 h are shown (Figures 7D, F), and quantification demonstrated significantly greater wound closure at 24 and 48 h in ARSB-overexpressing cells versus controls in both lines (Figures 7E, G). In Transwell migration assays using uncoated inserts, representative micrographs revealed more migrated cells upon ARSB overexpression (Figure 7H), with corresponding counts significantly increased for both MGC-803 and AGS (Figures 7I, J). Collectively, these results indicate that forced ARSB expression enhances the migratory capacity of GC cells in vitro.
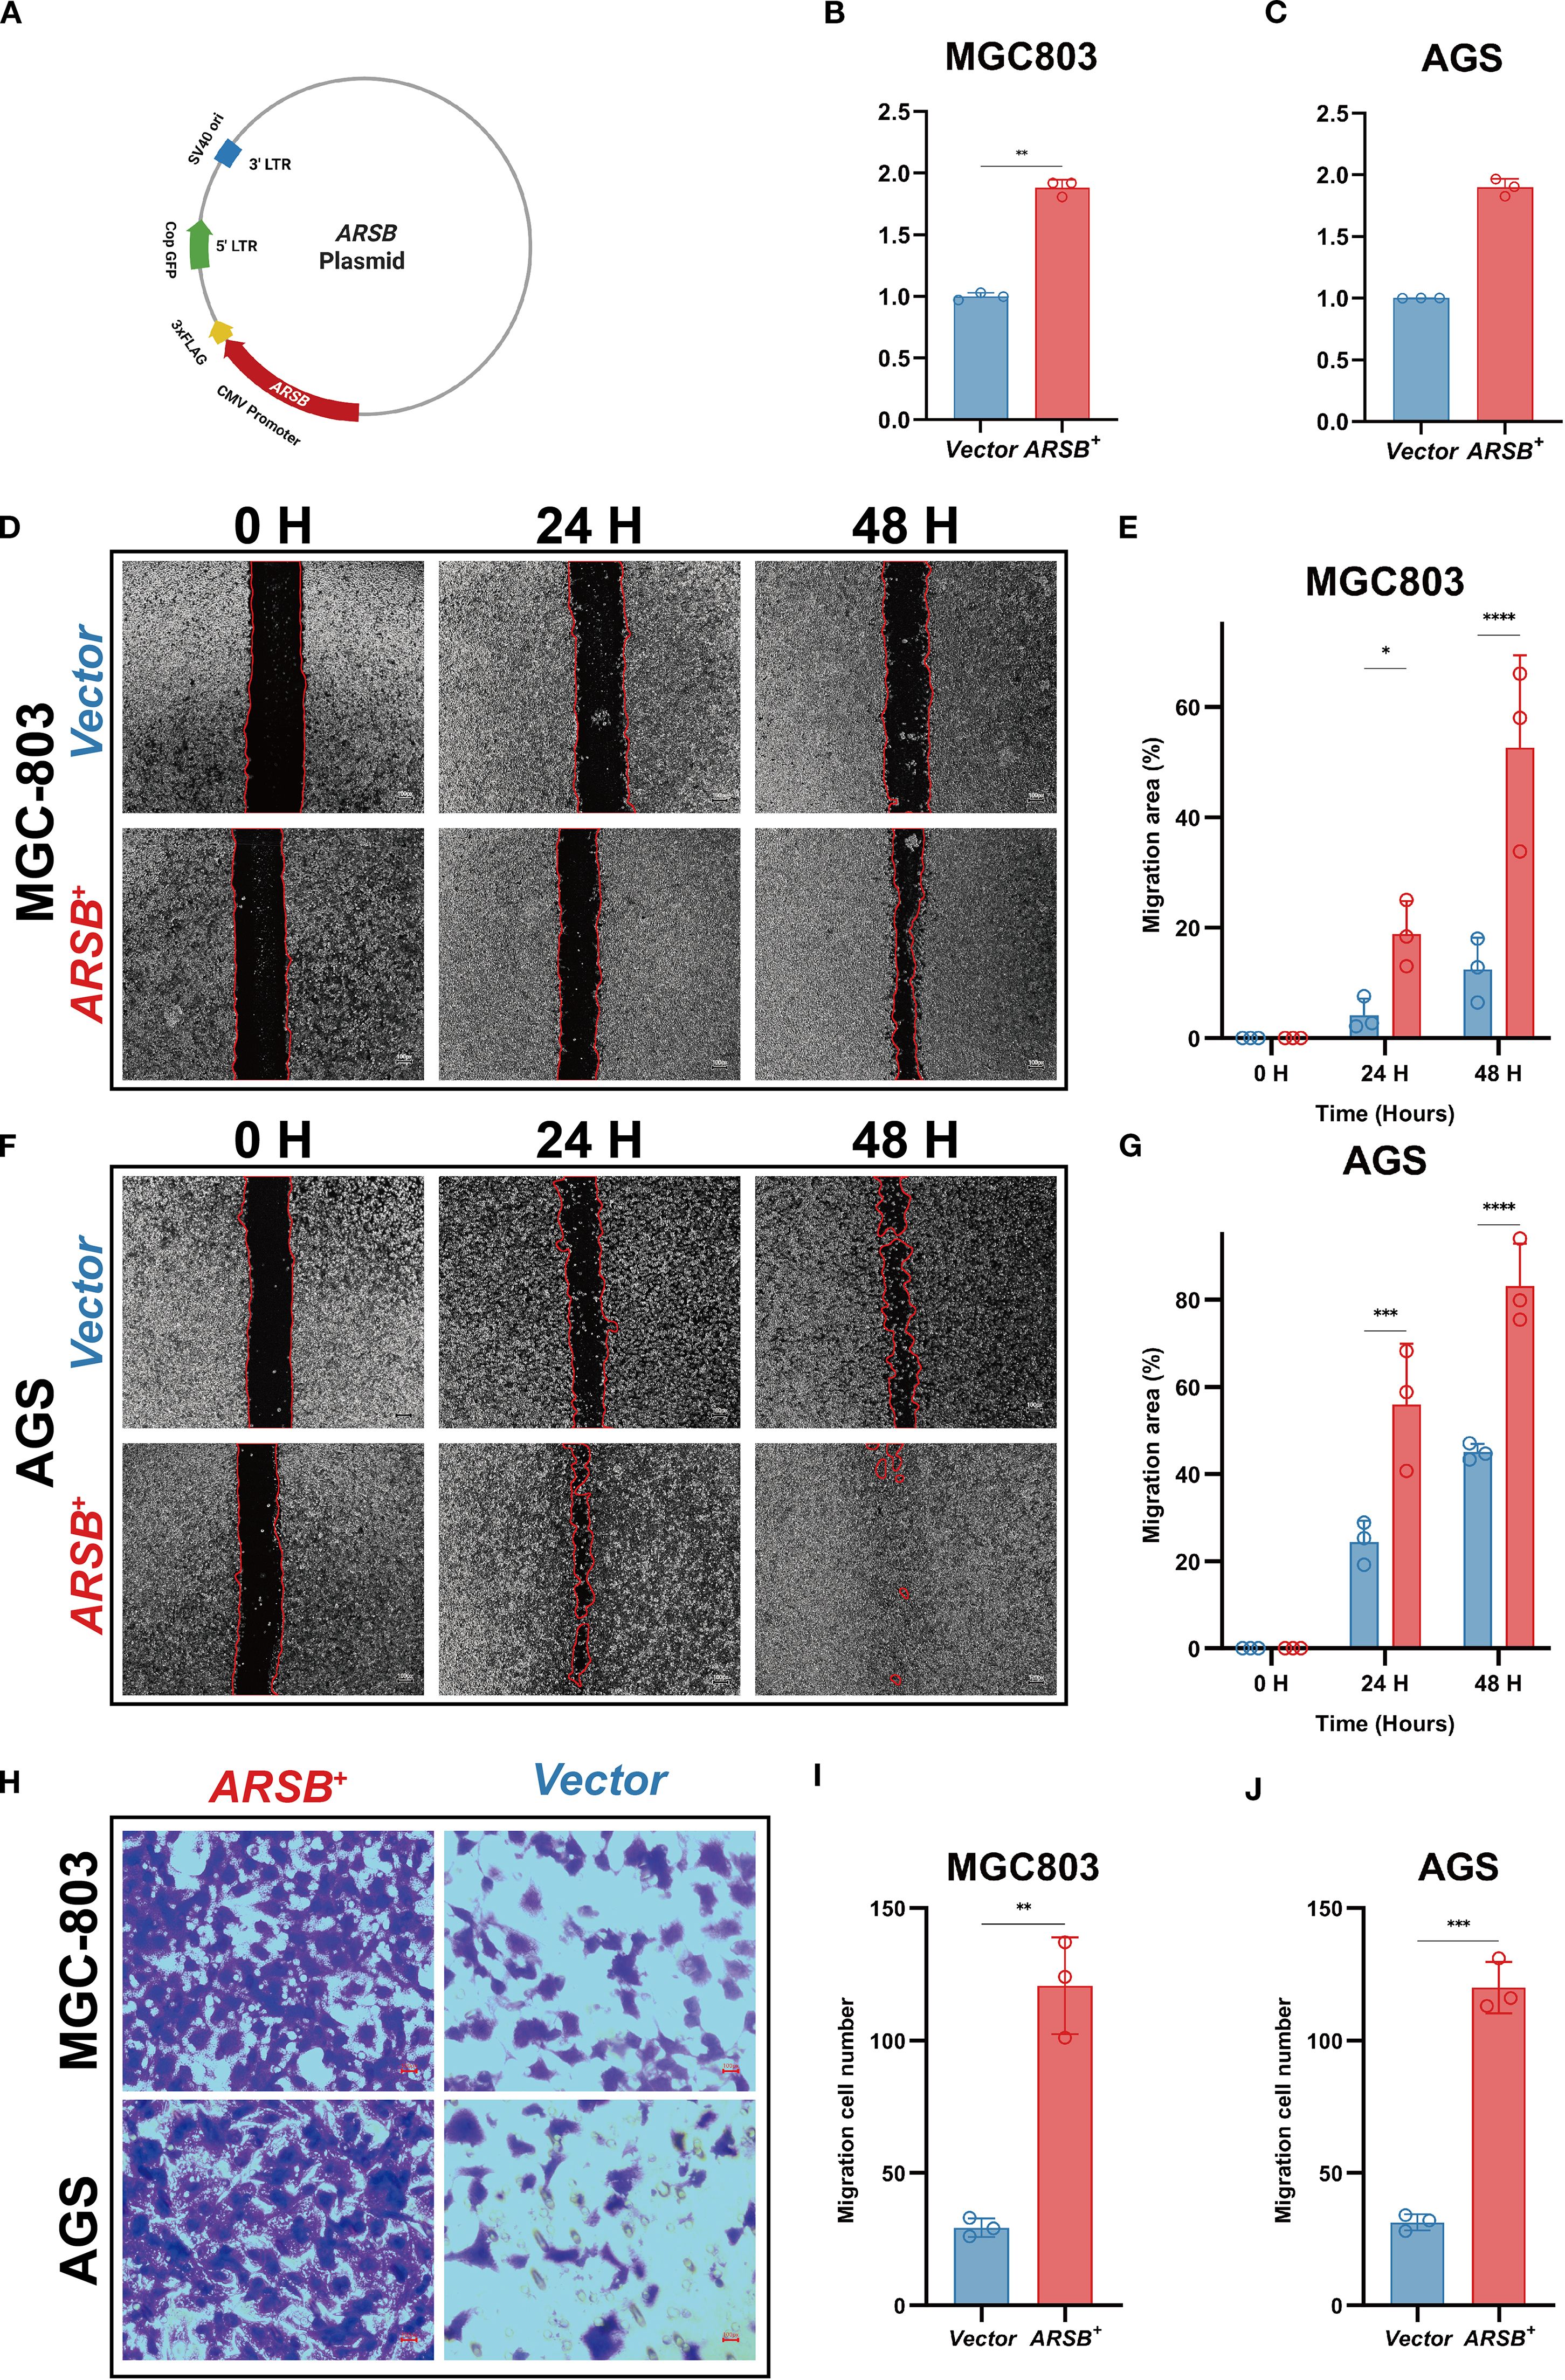
Figure 7. In-vitro validation of ARSB in GC cells. (A) Schematic of the ARSB overexpression plasmid. (B, C) RT-qPCR verifying ARSB mRNA upregulation (GAPDH as reference). (D, E) Representative images (D) and quantification (E) of the wound-healing assays in MGC803 cells at 0, 24, and 48 hours. (F, G) Representative images (F) and quantification (G) of the wound-healing assays in AGS cells at 0, 24, and 48 hours. (H-J) Representative images of Transwell migration assays (H) and quantification (I-J) of migrated cells per field in MGC803 (I) and AGS (J) cells. Data are mean ± SD; n = 3; two-sided tests; *P < 0.05, **P < 0.01, ***P < 0.001; scale bar = 100 μm.
4 Discussion
4.1 Study overview and significance
This study analyzed EONDGC using the SEER database, comparing it with LONDGC and EODGC, alongside subgroup analyses within EONDGC. We found that tumor location did not significantly affect survival in early-onset cases, whereas age was a key prognostic factor, suggesting location influences clinical presentation more than survival. By integrating clinical and molecular factors, this study pioneers a prognostic model for EONDGC, introducing the novel APR index to enhance risk stratification.
4.2 Clinical prognostic model
Unlike most previous models for young or early-onset GC, which were primarily based on TNM staging, tumor size, or location (26, 27), our EONDGC model incorporates seven clinically relevant variables, including LNR, race, and chemotherapy. LNR has been shown to outperform conventional N staging, with reported C-index improvements from 0.665 to 0.773 when included (28). Although a previous model included external validation, our study was specifically designed as a prognosis-oriented comparative analysis, ensuring clear clinical relevance and methodological rigor (26). This prognosis-driven approach, together with the inclusion of LNR, treatment factors, and multi-cohort validation, enhances the model’s methodological robustness and clinical applicability.
4.3 Molecular prognostic factors and APR index
To explore molecular mechanisms, we identified ARSB and PDCD1 as independent prognostic biomarkers. PDCD1, a key immune checkpoint receptor, has been reported to correlate with favorable outcomes in immune-active GC, particularly when expressed on CD8+ T cells. However, such studies primarily reflect immune status without addressing tumor-intrinsic biology (29–31). In contrast, ARSB is a tumor-derived enzyme linked to Wnt/β-catenin signaling, upregulated in EONDGC and associated with poor prognosis (32, 33). To integrate these opposing effects, we proposed the APR, which effectively stratified survival risk. Unlike existing signatures that focus solely on immune or metabolic markers, APR provides a concise, biologically interpretable index reflecting tumor–immune interaction. To complement these clinical findings, we performed in-vitro gain-of-function assays in AGS and MGC-803 cells: transient ARSB overexpression accelerated wound closure at 24/48 h and increased Transwell migration counts, indicating that ARSB enhances gastric cancer cell motility and providing experimental support for its association with poorer survival in EONDGC.
4.4 Innovations and clinical implications
To the best of our knowledge, this study is the first to specifically investigate EONDGC, an understudied GC subtype with distinct clinical features. By separating this population, we identified prognostic patterns that enabled the development of a site-specific model outperforming conventional TNM staging. Furthermore, we propose the APR as a novel molecular biomarker. As the first index combining ARSB and PDCD1 expression, APR shows promise for individualized treatment, particularly in immunotherapy, due to its relevance to the PD-1/PD-L1 axis (30, 34). The concordant increase in migration readouts with ARSB overexpression suggests that APR may partly capture motility-associated risk, supporting its potential utility for refined surveillance and treatment planning.
4.5 Limitations and future directions
Despite these advances, several limitations should be acknowledged. First, as a retrospective study, our analysis is inherently subject to selection bias and potential misclassification resulting from incomplete clinical information—such as insufficient lymph node harvest—although PSM was applied to reduce observable confounding and approximate the conditions of a randomized controlled trial. Second, due to the limited number of EONDGC cases in TCGA (n = 10), NDGC cases (n = 176) were used for validation. This small sample size resulted from strict inclusion criteria and the requirement for complete clinical and transcriptomic data. While this substitution was necessary, we demonstrated comparable ARSB/PDCD1 expression patterns between EONDGC and NDGC, supporting the feasibility of this approach. Nevertheless, potential biological heterogeneity cannot be ruled out (35, 36). Third, limited follow-up in the SYSU cohort (n = 171) may affect long-term metrics, yet 1-, 3-, and 5-year predictions remained robust. To address these limitations, future studies should incorporate broader datasets—such as Gene Expression Omnibus and institutional cohorts (e.g., SYSU)–and adopt prospective, multi-center designs to validate the APR and explore its immunotherapeutic potential. Our wet-lab validation was intentionally minimal—transient overexpression in two cell lines with qPCR confirmation only, scratch and Transwell migration assays, and no reciprocal knockdown/rescue or protein-level assays—so future work should incorporate loss-of-function/rescue experiments, protein validation, and pathway readouts to strengthen causal inference.
In summary, this study provides a comprehensive prognostic evaluation of EONDGC by integrating large-scale clinical data with molecular analysis. These findings contribute to the growing understanding of age-specific tumor biology and underscore the need for prospective, multicenter studies to further validate the APR index and explore its implications in personalized therapy and immuno-oncology.
5 Conclusion
This study pioneers the investigation of EONDGC by leveraging multiple datasets to develop a clinical prognostic model and identify ARSB and PDCD1 as prognostic biomarkers. The ARSB-PDCD1 ratio, a novel composite risk indicator, integrates these biomarkers to enhance risk stratification. These findings advance EONDGC molecular classification and support individualized prognosis.
Data availability statement
The original contributions presented in the study are included in the article/Supplementary Material. Further inquiries can be directed to the corresponding authors.
Ethics statement
The studies involving humans were approved by the Ethics Committee of the Seventh Affiliated Hospital of Sun Yat-sen University (Approval No. KY-2025-351-01). The studies were conducted in accordance with the local legislation and institutional requirements. The ethics committee/institutional review board waived the requirement of written informed consent for participation from the participants or the participants’ legal guardians/next of kin due to the retrospective nature of the study and the use of de-identified data.
Author contributions
ZZ: Validation, Conceptualization, Writing – review & editing, Data curation, Software, Writing – original draft, Visualization. XZ: Methodology, Writing – review & editing, Formal analysis, Writing – original draft. QJ: Writing – review & editing. ZC: Writing – original draft. YY: Writing – original draft. YJ: Writing – original draft. HZ: Writing – original draft. CA: Supervision, Writing – review & editing. JZ: Supervision, Writing – review & editing. YH: Supervision, Writing – review & editing. ZF: Supervision, Writing – review & editing. KW: Supervision, Writing – review & editing. NL: Conceptualization, Supervision, Resources, Writing – review & editing, Project administration.
Funding
The author(s) declare financial support was received for the research and/or publication of this article. This work was supported by the Shenzhen Clinical Research Center for Gastroenterology (Gastrointestinal Surgery) (Grant No. LCYSSQ20220823091203008) and the Shenzhen Medical Research Fund (Grant No. A2402008).
Acknowledgments
The authors sincerely thank all the patients and their families for their understanding and support. They also acknowledge the SEER Program for providing the cancer incidence and survival data, as well as the financial support from the Shenzhen Clinical Research Center for Gastroenterology and the Shenzhen Medical Research Fund.
Conflict of interest
The authors declare that the research was conducted in the absence of any commercial or financial relationships that could be construed as a potential conflict of interest.
Generative AI statement
The author(s) declare that no Generative AI was used in the creation of this manuscript.
Any alternative text (alt text) provided alongside figures in this article has been generated by Frontiers with the support of artificial intelligence and reasonable efforts have been made to ensure accuracy, including review by the authors wherever possible. If you identify any issues, please contact us.
Publisher’s note
All claims expressed in this article are solely those of the authors and do not necessarily represent those of their affiliated organizations, or those of the publisher, the editors and the reviewers. Any product that may be evaluated in this article, or claim that may be made by its manufacturer, is not guaranteed or endorsed by the publisher.
Supplementary material
The Supplementary Material for this article can be found online at: https://www.frontiersin.org/articles/10.3389/fimmu.2025.1655106/full#supplementary-material
References
1. Bray F, Laversanne M, Sung H, Ferlay J, Siegel RL, Soerjomataram I, et al. Global cancer statistics 2022: globocan estimates of incidence and mortality worldwide for 36 cancers in 185 countries. CA Cancer J Clin. (2024) 74:229–63. doi: 10.3322/caac.21834
2. Japanese Research Society for Gastric Cancer. The general rules for the gastric cancer study in surgery ad pathology. Part ii. Histological classification of gastric cancer. Jpn J Surg. (1981) 11:140–5. doi: 10.1007/BF02468884
3. Kajitani T. The general rules for the gastric cancer study in surgery and pathology. Part I. Clinical classification. Jpn J Surg. (1981) 11:127–39. doi: 10.1007/bf02468883
4. Chen J-H, Wu C-W, Lo S-S, Li A-Y, Hsieh M-C, Shen K-H, et al. Outcome of distal gastric cancer with pyloric stenosis after curative resection. Eur J Surg Oncol (EJSO). (2007) 33:556–60. doi: 10.1016/j.ejso.2007.01.020
5. Watanabe A, Maehara Y, Okuyama T, Kakeji Y, Korenaga D, and Sugimachi K. Gastric carcinoma with pyloric stenosis. Surgery. (1998) 123:330–4. doi: 10.1016/S0039-6060(98)70187-4
6. Chang AH and Parsonnet J. Role of bacteria in oncogenesis. Clin Microbiol Rev. (2010) 23:837–57. doi: 10.1128/cmr.00012-10
7. Hansson LR, Engstrand L, Nyrén O, and Lindgren A. Prevalence of helicobacter pylori infection in subtypes of gastric cancer. Gastroenterology. (1995) 109:885–8. doi: 10.1016/0016-5085(95)90398-4
8. Smolka AJ and Schubert ML. Helicobacter pylori-induced changes in gastric acid secretion and upper gastrointestinal disease. Mol pathogenesis Signal transduction by helicobacter pylori. (2017), 227–52. doi: 10.1007/978-3-319-50520-6_10
9. Chen Y, Liu L, Wang X, Wang J, Yan Z, Cheng J, et al. Body mass index and risk of gastric cancer: A meta-analysis of a population with more than ten million from 24 prospective studies. Cancer epidemiology Biomarkers Prev. (2013) 22:1395–408. doi: 10.1158/1055-9965.EPI-13-0042
10. Karimi P, Islami F, Anandasabapathy S, Freedman ND, and Kamangar F. Gastric cancer: descriptive epidemiology, risk factors, screening, and prevention. Cancer epidemiology Biomarkers Prev. (2014) 23:700–13. doi: 10.1158/1055-9965.EPI-13-1057
11. Zhang C, Tang R, Zhu H, Ge X, Wang Y, Wang X, et al. Comparison of treatment strategies and survival of early-onset gastric cancer: A population-based study. Sci Rep. (2022) 12:6288. doi: 10.1038/s41598-022-10156-5
12. Inoue M. Epidemiology of gastric cancer-changing trends and global disparities. Cancers (Basel). (2024) 16:2948. doi: 10.3390/cancers16172948
13. Ugai T, Sasamoto N, Lee HY, Ando M, Song M, Tamimi RM, et al. Is early-onset cancer an emerging global epidemic? Current evidence and future implications. Nat Rev Clin Oncol. (2022) 19:656–73. doi: 10.1038/s41571-022-00672-8
14. Wang X, Gao X, Yu J, Zhang X, and Nie Y. Emerging trends in early-onset gastric cancer. Chin Med J (Engl). (2024) 137:2146–56. doi: 10.1097/cm9.0000000000003259
15. Arnold M, Park JY, Camargo MC, Lunet N, Forman D, and Soerjomataram I. Is gastric cancer becoming a rare disease? A global assessment of predicted incidence trends to 2035. Gut. (2020) 69:823–9. doi: 10.1136/gutjnl-2019-320234
16. Lin Y, Zheng Y, Wang HL, and Wu J. Global patterns and trends in gastric cancer incidence rates (1988-2012) and predictions to 2030. Gastroenterology. (2021) 161:116–27.e8. doi: 10.1053/j.gastro.2021.03.023
17. Tan N, Wu H, Cao M, Yang F, Yan X, He S, et al. Global, regional, and national burden of early-onset gastric cancer. Cancer Biol Med. (2024) 21:667–78. doi: 10.20892/j.issn.2095-3941.2024.0159
18. Team RC. R: A Language and Environment for Statistical Computing. Vienna, Austria: R Foundation for Statistical Computing (2024).
19. Love MI, Huber W, and Anders S. Moderated estimation of fold change and dispersion for rna-seq data with deseq2. Genome Biol. (2014) 15:550. doi: 10.1186/s13059-014-0550-8
20. Austin PC. An introduction to propensity score methods for reducing the effects of confounding in observational studies. Multivariate Behav Res. (2011) 46:399–424. doi: 10.1080/00273171.2011.568786
21. Peacock J and Peacock P. Oxford Handbook of Medical Statistics. Oxford: Oxford University Press (2010).
22. Therneau TM and Grambsch PM. Modeling Survival Data: Extending the Cox Model. New York, NY: Springer (2000).
23. Musoro JZ, Zwinderman AH, Puhan MA, ter Riet G, and Geskus RB. Validation of prediction models based on lasso regression with multiply imputed data. BMC Med Res Method. (2014) 14:116. doi: 10.1186/1471-2288-14-116
24. Bansal A and Heagerty PJ. A comparison of landmark methods and time-dependent roc methods to evaluate the time-varying performance of prognostic markers for survival outcomes. Diagn Prognostic Res. (2019) 3:14. doi: 10.1186/s41512-019-0057-6
25. Steyerberg EW, Vickers AJ, Cook NR, Gerds T, Gonen M, Obuchowski N, et al. Assessing the performance of prediction models: A framework for traditional and novel measures. Epidemiology. (2010) 21:128–38. doi: 10.1097/EDE.0b013e3181c30fb2
26. Liu H, Li Z, Zhang Q, Li Q, Zhong H, Wang Y, et al. Multi−Institutional development and validation of a nomogram to predict prognosis of early-onset gastric cancer patients. Front Immunol. (2022) 13:1007176. doi: 10.3389/fimmu.2022.1007176
27. Liao F, Guo X, Lu X, and Dong W. A validated survival nomogram for early-onset diffuse gastric cancer. Aging (Albany NY). (2020) 12:13160–71. doi: 10.18632/aging.103406
28. Chen YR, Tian ZY, Wang MQ, Sun ML, Wu JZ, and Wang XY. Development and validation of prognostic nomograms based on lymph node ratio for young patients with gastric cancer: A seer-based study. Technol Cancer Res Treat. (2023) 22:15330338231157923. doi: 10.1177/15330338231157923
29. Xing X, Guo J, Ding G, Li B, Dong B, Feng Q, et al. Analysis of pd1, pdl1, pdl2 expression and T cells infiltration in 1014 gastric cancer patients. Oncoimmunology. (2018) 7:e1356144. doi: 10.1080/2162402X.2017.1356144
30. Kim ST, Cristescu R, Bass AJ, Kim K-M, Odegaard JI, Kim K, et al. Comprehensive molecular characterization of clinical responses to pd-1 inhibition in metastatic gastric cancer. Nat Med. (2018) 24:1449–58. doi: 10.1038/s41591-018-0101-z
31. Choo J, Kua LF, Soe MY, Asuncion BR, Tan BKJ, Teo CB, et al. Clinical relevance of pd-1 positive cd8 T-cells in gastric cancer. Gastric Cancer. (2023) 26:393–404. doi: 10.1007/s10120-023-01364-7
32. Tobacman JK and Bhattacharyya S. Profound impact of decline in N-acetylgalactosamine-4-sulfatase (Arylsulfatase B) on molecular pathophysiology and human diseases. Int J Mol Sci. (2022) 23:13146. doi: 10.3390/ijms232113146
33. Bi C. The role of arsb in regulating proliferation, migration, and apoptosis of gastric cancer cells through the wnt/B-catenin signaling pathway. (2023). doi: 10.27114/d.cnki.ghnau.2023.000439
34. Strati A, Adamopoulos C, Kotsantis I, Psyrri A, Lianidou E, and Papavassiliou AG. Targeting the pd-1/pd-L1 signaling pathway for cancer therapy: focus on biomarkers. Int J Mol Sci. (2025) 26:1235. doi: 10.3390/ijms26031235
35. Serdar CC, Cihan M, Yücel D, and Serdar MA. Sample size, power and effect size revisited: simplified and practical approaches in pre-clinical, clinical and laboratory studies. Biochem Med (Zagreb). (2021) 31:10502. doi: 10.11613/bm.2021.010502
Keywords: early-onset gastric cancer, nondistal gastric cancer, ARSB, PDCD1, prognostic model
Citation: Zhang Z, Zhong X, Jin Q, Chen Z, Yang Y, Jiang Y, Zhou H, An C, Zhang J, He Y, Fu Z, Wu K and Li N (2025) Prognostic modeling of early-onset nondistal gastric cancer identifies ARSB–PDCD1 ratio as an immune-related survival stratifier. Front. Immunol. 16:1655106. doi: 10.3389/fimmu.2025.1655106
Received: 27 June 2025; Accepted: 15 September 2025;
Published: 29 September 2025.
Edited by:
Chunjing Wang, University College London, United KingdomReviewed by:
Shisan (Bob) Bao, The University of Sydney, AustraliaXiaofei Zhi, Affiliated Hospital of Nantong University, China
Li Fu, Shenzhen University, China
Copyright © 2025 Zhang, Zhong, Jin, Chen, Yang, Jiang, Zhou, An, Zhang, He, Fu, Wu and Li. This is an open-access article distributed under the terms of the Creative Commons Attribution License (CC BY). The use, distribution or reproduction in other forums is permitted, provided the original author(s) and the copyright owner(s) are credited and that the original publication in this journal is cited, in accordance with accepted academic practice. No use, distribution or reproduction is permitted which does not comply with these terms.
*Correspondence: Yulong He, aGV5dWxvbmdAbWFpbC5zeXN1LmVkdS5jbg==; Zhang Fu, ZnV6aGFuZzFAc3lzdXNoLmNvbQ==; Kaiming Wu, d3VrYWltaW5nQHN5c3VzaC5jb20=; Ningning Li, bGlubjI5QG1haWwuc3lzdS5lZHUuY24=
†These authors have contributed equally to this work and share first authorship