 Xin Liu1,2†
 Ke Su3,4†
 Shanshan Du1†
 Yanze Li1Peiping Sun1,5Shucheng Shen1,6Benzhe Liang1Jian Chen1,7
 Rui Liu1,6Rui Zhang8
 Heran Wang9Huadong Wang1
 Yong Yin1*
 Zhenjiang Li1*
- 1Department of Radiation Physics, Shandong Cancer Hospital and Institute, Shandong First Medical University and Shandong Academy of Medical Sciences, Jinan, China
- 2Department of Gynecological Radiotherapy, Harbin Medical University Cancer Hospital, Harbin, China
- 3Department of Radiation Oncology, National Cancer Center/National Clinical Research Center for Cancer/Cancer Hospital, Chinese Academy of Medical Sciences and Peking Union Medical College, Beijing, China
- 4Department of Oncology, The Affiliated Hospital of Southwest Medical University, Luzhou, China
- 5School of Physics and Electronic Science, Shandong Normal University, Jinan, China
- 6Department of Graduate, Shandong First Medical University, Shandong Academy of Medical Sciences, Jinan, China
- 7School of Nuclear Science and Technology, University of South China, Hengyang, China
- 8Department of Emergency Medicine, Nanjing Drum Tower Hospital, Nanjing Drum Tower Hospital Clinical College of Nanjing University Of Chinese Medicine, Nanjing, China
- 9Department of Orthopedics, Shengjing Hospital of China Medical University, Shenyang, Liaoning, China
Objective: This study was designed to explore the value of machine learning-based radiology in predicting overall survival (OS) among patients with inoperable pancreatic cancer (PC) who are undergoing concurrent chemoradiotherapy (CCRT).
Methods: This multicenter study enrolled 342 patients with inoperable PC. Firstly, radiomic features were pre-screened by univariate Cox regression and subsequently used to develop 101 machine-learning–based imaging models. An optimized selection algorithm was applied to these models to derive each patient’s radiomic signature (Rad-score). Secondly, key clinical predictors of OS were identified via LASSO–Cox regression and incorporated into clinical nomogram. Finally, the Rad-score was combined with the independent clinical risk factors to construct clinical–radiomics nomogram.
Results: LASSO–Cox regression identified age, clinical stage, tumor size, and albumin level as independent prognostic factors for OS. Based on these four variables, we constructed a clinical nomogram in the training cohort, which achieved a C-index of 0.71. In the internal validation cohort, the areas under the receiver operating characteristic curve (AUC-ROC) for predicting 1-, 2-, and 3-year OS were 0.577, 0.721, and 0.730, respectively; in the external validation cohort, the corresponding AUC-ROCs were 0.841, 0.757, and 0.598. Subsequently, each patient’s Rad-score was integrated with these clinical predictors to develop a clinical–radiomics nomogram, which demonstrated a C-index of 0.892. The AUC-ROCs for predicting 1-, 2-, and 3-year OS were 0.791, 0.846, and 0.840 in the internal validation cohort, and 0.863, 0.830, and 0.734 in the external validation cohort.
Conclusion: The clinical–radiomics nomogram demonstrated superior predictive performance for OS compared to the clinical nomogram in inoperable PC patients undergoing CCRT.
Introduction
Pancreatic cancer (PC) is one of the most prevalent malignancies and constitutes a leading cause of cancer-related mortality, thereby representing a significant threat to human health (1). When permitted, surgical resection is the primary treatment modality for primary pancreatic tumors. However, the majority of PC patients present with advanced-stage disease at diagnosis, and only a minority are eligible for curative resection (2). This leads to an extremely poor prognosis for patients with PC, with a 5-year survival rate of < 5% following diagnosis (3). Continued treatment of PC is important at this time, because the progression of primary tumors leads to morbidity and mortality through invasion of nearby organs and blood vessels. This process is identified as the leading cause of mortality in at least 30% of patients with PC (4, 5). Concurrent chemoradiotherapy (CCRT) provides an option for local disease control (6).
Over the past few decades, there has been a gradual improvement in the clinical outcomes of patients with PC have gradually, largely attributable to the widespread adoption and standardization of radiotherapy, as well as advances in multimodal treatment strategies (7). Prior research have indicated that patients with locally advanced PC who undergo CCRT achieve a significantly higher 1-year survival rate than those treated with chemotherapy alone (8). Additionally, the overall survival (OS) of patients treated with radiotherapy (RT) in combination with gemcitabine increased from 9.2 to 11.1 months compared with that of patients receiving gemcitabine alone (9). Furthermore, dose-response analysis revealed that patients receiving an RT prescription dose of 61 Gy achieved significantly better outcomes than those receiving <61 Gy, with 1-year OS rates of 74.7% versus 60.6%, and 1-year progression-free survival rates of 46.2% versus 30.9%, respectively (10). CCRT improves the prognosis of patients with advanced PC. However, several problems associated with CCRT still remain, such as a high risk of recurrence rate, high mortality rate, and unsatisfactory accuracy of prognosis prediction. These limitations are further compounded by the inability to rapidly and dynamically monitor the tumor properties and changes, as well as unsatisfactory treatment outcomes (11). Therefore, improved efficacy prediction models are required. These current situations show that, in the era of personalized and precision medicine, using more powerful auxiliary models to further optimize the clinical workflow of PC is greatly significance.
A recent proposal has introduced a deep learning methods for synthetic medical image generation, with the objective of enhancing the efficiency of convolutional neural networks in cancer image classification (12). Traditional diagnostic functions of medical imaging can be taken one step forward with the introduction of radiology (13). Radiomics converts medical images into high-throughput, mineable data and automatically extracts quantitative features to augment the estimation of clinical indicators in various malignancies (14). Radiomic analysis is emerging as a promising strategy for predicting cancer risk and cancer recurrence (15, 16). This technology enables the revelation of unique insights into tumor behavior through the integration of multimodal data with clinical, pathological, and genomic information, facilitating the decoding of diverse tissue biology (17, 18). However, limited research has been conducted on risk prediction after chemoradiotherapy for advanced inoperable PC.
Accordingly, our study aimed to apply machine learning strategies to identify a new prognostic model and explore its potential for predicting the efficacy of chemoradiotherapy in patients with unresectable PC, with the goal of minimizing diagnostic errors and improving patient treatment. Personalized precision has considerable potential for improving medical procedures.
Methods
Patient selection
The study cohort included patients from two hospitals between 2018 and 2024. The first dataset was obtained from Shandong Province Cancer Hospital (Hospital 1) and divided into training (n=187, 70%) and internal verification (n=85, 30%) datasets. The second dataset was obtained from Chongqing City People’s Hospital (Hospital 2) and served as an external verification set (n=70) (Figure 1). The study was approved by the Ethical Review Committees of Shandong Province Cancer Hospital (SDTHEC2024007030) and Chongqing City People’s Hospital (KY S2024-030-01). All patients gave informed consent.
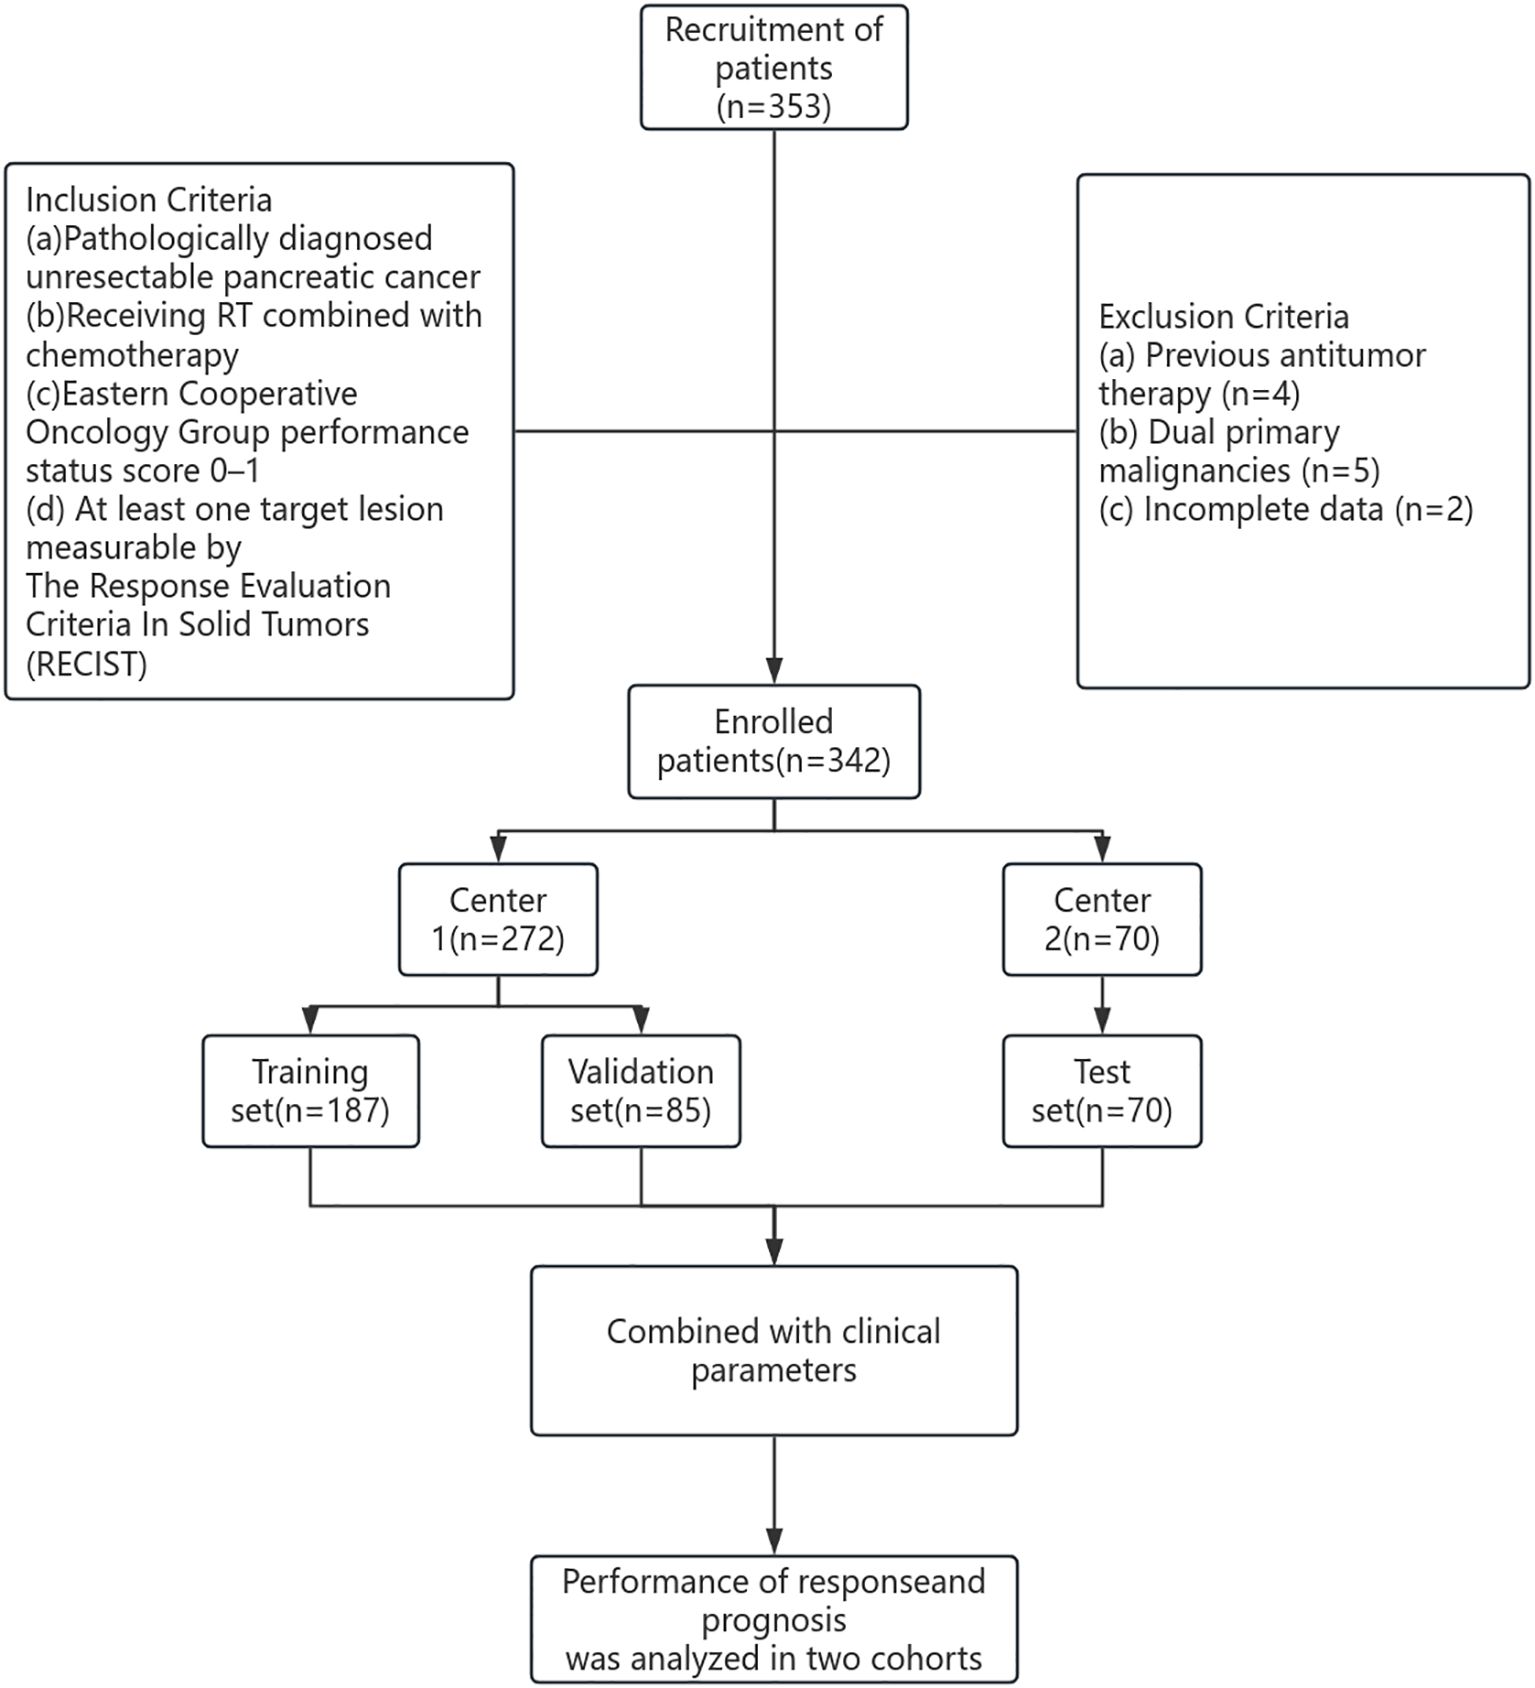
Figure 1. Patient selection flowchart.
The inclusion criteria were as follows: a) pathologically diagnosed unresectable PC; b) receiving RT combined with chemotherapy; c) Eastern Cooperative Oncology Group performance status score 0–1; d) at least one target lesion measurable by The Response Evaluation Criteria In Solid Tumors (RECIST). Patients exhibiting the following characteristics were excluded: a) previous antitumor therapy; b) dual primary malignancies; or c) incomplete data.
Treatment and follow-up
All patients received concurrent chemoradiotherapy. Target volumes and critical organs were delineated by at least two senior physicians and medical physicists on contrast-enhanced CT simulation images, with reference to other imaging data such as contrast-enhanced pancreatic MRI. CT scans were performed in the venous phase (60–70 seconds after contrast injection), and the slice thickness was ≤3 mm. Radiotherapy was delivered using volumetric modulated arc therapy (VMAT) and intensity modulated radiation therapy (IMRT). The gross tumor volume (GTV) included radiologically visible pancreatic tumors and metastatic lymph nodes on CT/MRI. The clinical target volume (CTV) encompassed the primary lesion, lymph nodes and perineural invasion sites within approximately 5–10 mm around the pancreatic vasculature, along with lymphatic drainage areas. The planning target volume (PTV) was defined as a 5–10 mm expansion of the CTV. The dose constraints for organs at risk (OARs) followed the RTOG guidelines: Duodenum Dmax ≤55 Gy, V50 ≤10 cm³; Stomach: Dmax ≤55 Gy, V45 ≤75 cm³; Small bowel: Dmax ≤55 Gy, V50 ≤10 cm³; Liver: Dmean ≤25 Gy; Kidneys: Dmean ≤18 Gy, V20 ≤32%; Spinal cord: D1 (dose to 1% volume) ≤45 Gy.
Subsequent patients were generally subjected to regular follow-ups every 3 months during the first year to undergo computed tomography/magnetic resonance imaging (CT/MRI) scans to monitor the effects of RT. Follow-ups were conducted every 6 months in the second year and then annually. Tumor remission was measured using imaging studies in accordance with the RECIST V.1.1 The primary clinical endpoint was OS, defined as the time from the date of initial radiation therapy until mortality or last follow-up.
Radiomics feature extraction and model construction
A comprehensive set of 1130 radiomic features were extracted from the gross tumor volume in the contrast-enhanced CT scan of each patient with PC using 3D-slicer software. The regions of interest (ROIs) were selected from the primary tumor sites, and the ROI was drawn strictly within the tumor boundaries (Figure 2). First, a univariate Cox regression model was used in the training set to select the optimized feature imaging parameters. A total of 272 patients were randomly divided into a training cohort (n = 187) and an internal validation cohort (n = 85) at a 7:3 ratio. In the training cohort, univariate Cox regression was applied to identify optimized imaging features associated with survival. These selected features were subsequently incorporated into the development of 101 different machine-learning radiomics models. These models were constructed by combining 12 different algorithms: StepCox[forward], Ridge, Enet, Random Survival Forest (RSF), StepCox[both], StepCox[backward], CoxBoost, LASSO, Gradient Boosting Machine, plsRcox, SuperPC, and Support Vector Machine. The concordance index (C-index) of each model was calculated in the training, internal validation, and external validation cohorts (n = 70, Chongqing General Hospital). The model with the highest C-index in the training cohort was chosen as the final model, and the corresponding radiomics score (Rad-score) was calculated for each patient based on this model. The codes used in this study are shown in Supplementary Data Sheet 1.
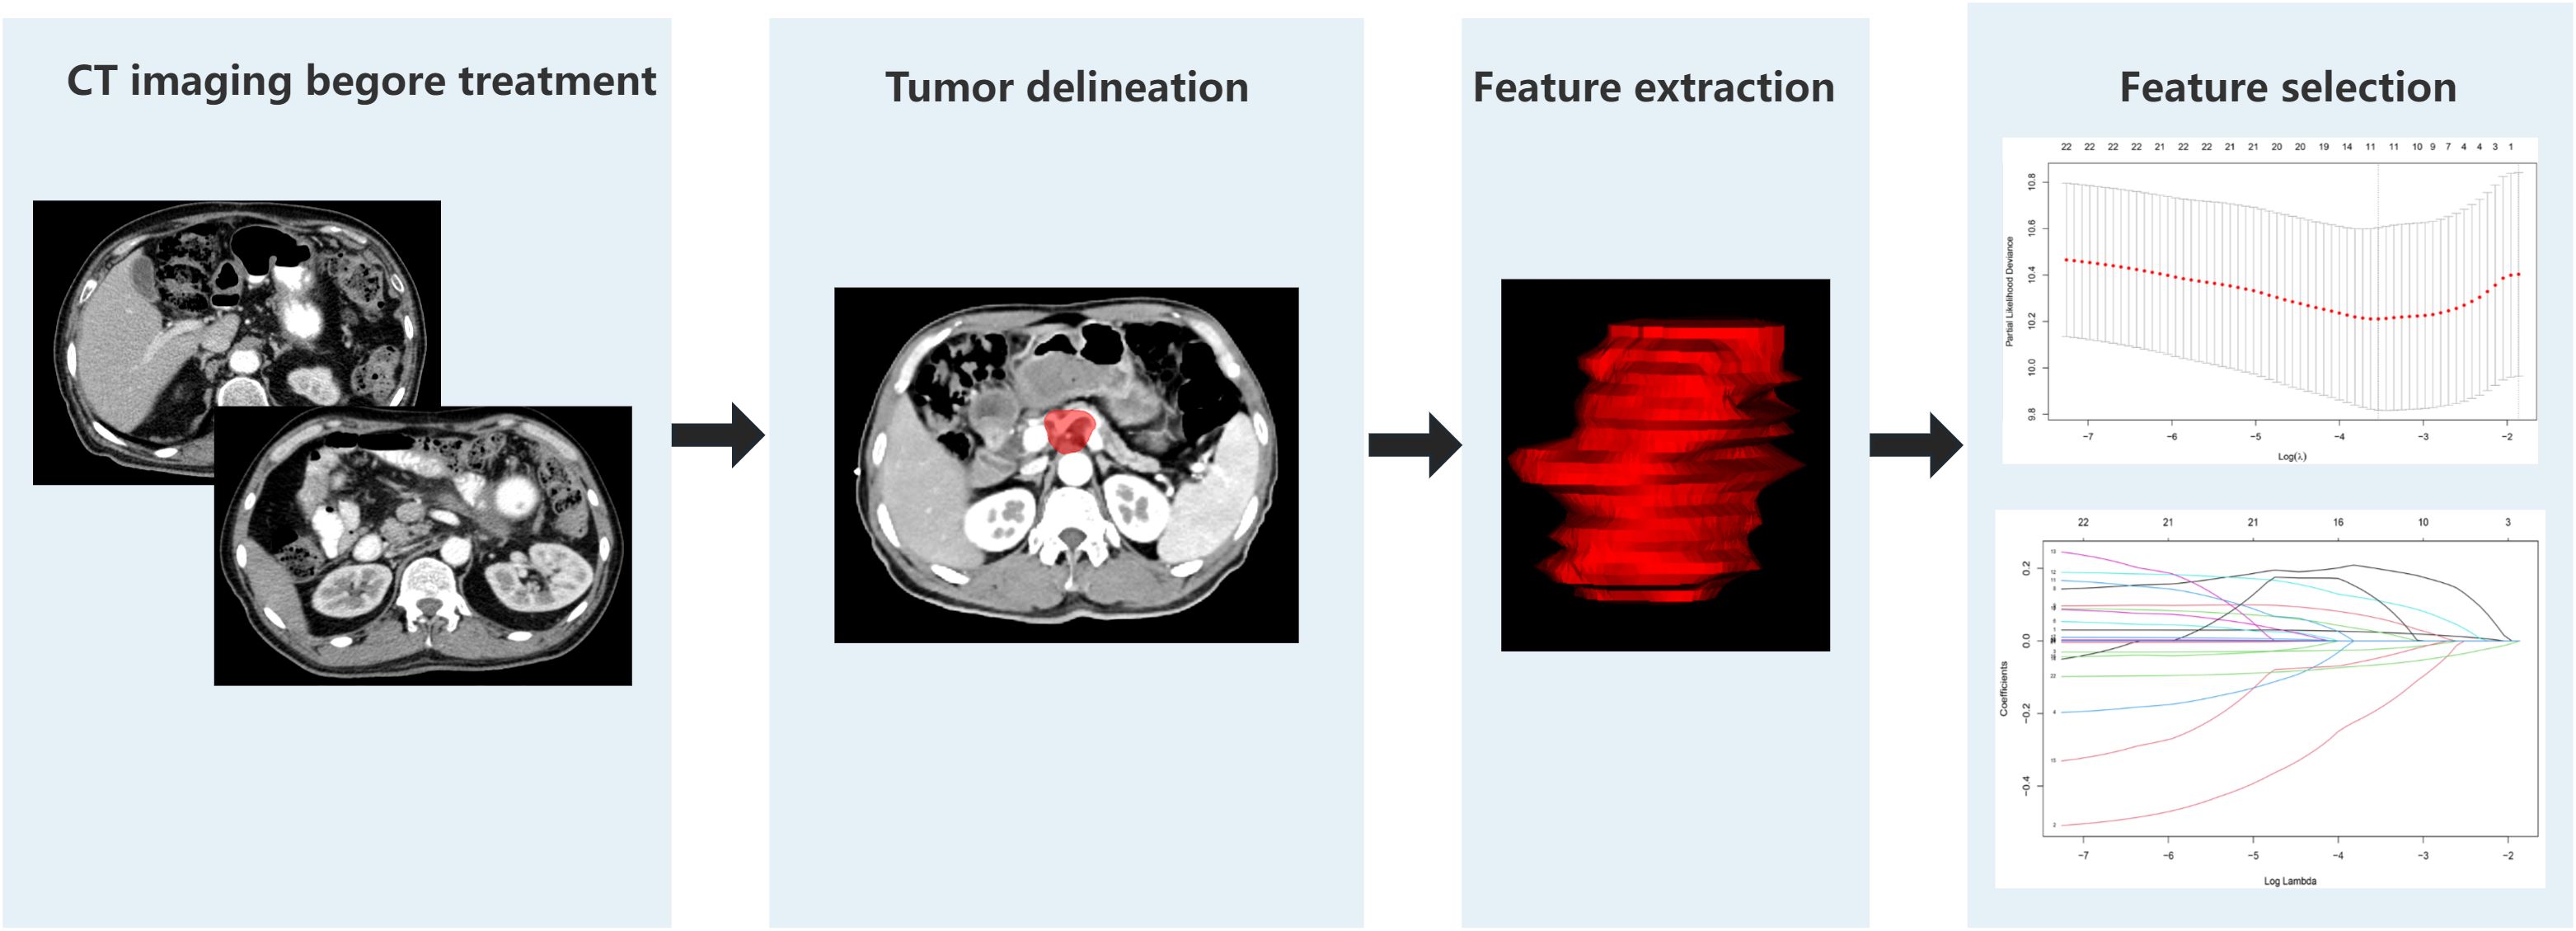
Figure 2. Radiomics pipeline for predicting OS in patients with pancreatic cancer.
Nomogram construction
In the training cohort, Least Absolute Shrinkage and Selection Operator (LASSO) regression was applied to screen prognostic factors associated with OS. The factors selected by LASSO were then entered into univariate and multivariate Cox proportional-hazards models to identify independent predictors of OS, which were used to construct Nomogram 1 (clinical nomogram). Next, each patient’s Rad-score was combined with the independent clinical predictors to build Nomogram 2 (clinical–radiomics nomogram). Finally, in both the internal and external validation cohorts, we evaluated the predictive performance of these two models by plotting receiver operating characteristic (ROC) curves, calibration curves, and decision curve analysis (DCA) curves. The online dynamic nomogram uses DynNom (v5.1), shiny (v. 1.11.1), rms (v. 8.0 - 0), survivminer (v. 0.5.0), survival (v3.8 - 3), and an rsconnect (v1.5.1). The website platform is hosted using https://docs.posit.co/shinyapps.io/.
Statistical analysis
For categorical variables, the chi-square test was used for assessment. For continuous baseline variables, the Shapiro–Wilk test was first applied to examine the normality of data distribution. compared using one-way analysis of variance (ANOVA), whereas non-normally using the Kruskal–Wallis test. Additionally, the Kaplan-Meier method was employed to estimate the survival rate, with the log-rank test subsequently utilized to compare survival curves. All analyses were conducted using R software version 3.3.2. A two-sided P value of less than 0.05 was considered to indicate statistically significant.
Result
Patient characteristics
This study included a total of 342 patients with PC. The analysis of baseline characteristics is shown in Table 1. No significant baseline differences were observed among the training set (n = 187), internal validation group (n = 85), and external validation group (n = 70).
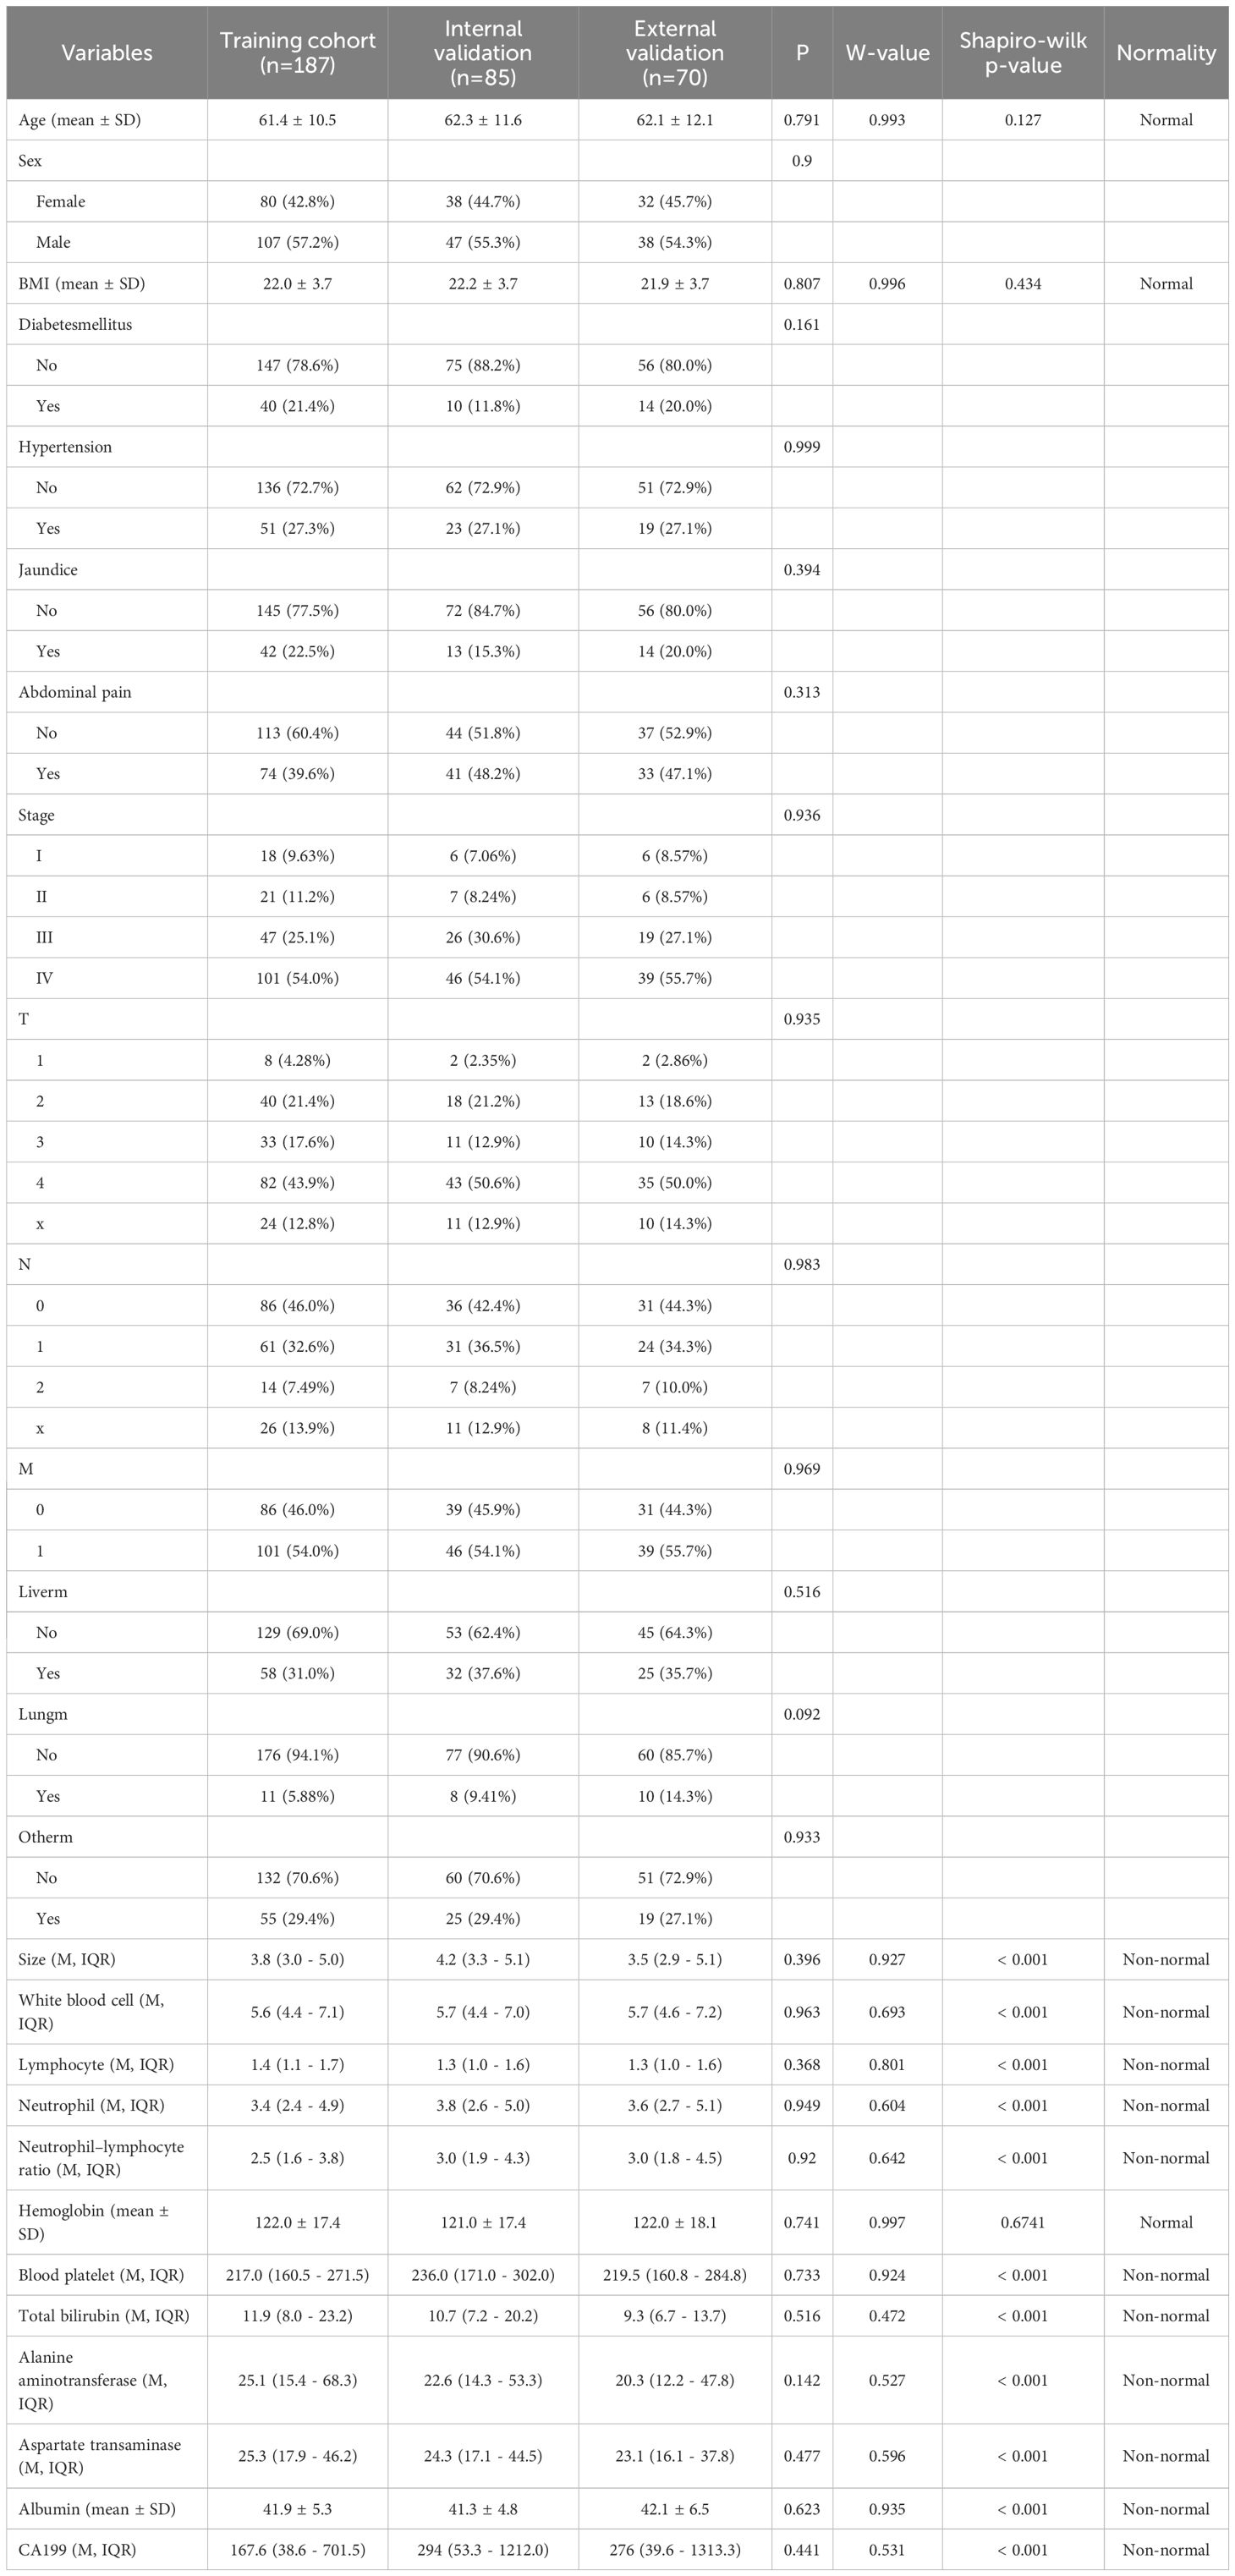
Table 1. Patient baseline data analysis table.
OS
In the training set, internal validation group, and external validation groups, the median OS was 20.3, 22.2, and 21.5 months respectively, while the 3-year survival rates were 36.9%, 30.4%, and 28.7%, respectively (P = 0.9, Supplementary Figure 1).
Radiomics models
Nine risk indicators were screened from 1,130 data using single-factor Cox. The selected characteristics were as follows:
wavelet.LHL.firstorder.Range
wavelet.LHL.glszm.SizeZoneNonUniformityNormalized
wavelet.HLH.glszm.GrayLevelNonUniformity
wavelet.HHH.gldm.LowGrayLevelEmphasis
wavelet.HHH.glrlm.LowGrayLevelRunEmphasis
wavelet.HHH.glrlm.ShortRunLowGrayLevelEmphasis
wavelet.HHH.glszm.GrayLevelNonUniformity
wavelet.HHH.glszm.SmallAreaEmphasis
wavelet.HHH.glszm.ZoneEntropy
Based on these nine risk indicators, 101 machine learning models were constructed by combining 12 models: StepCox[forward], Ridge, Enet, random survival forest (RSF), StepCox[both], StepCox[backward], CoxBoost, LASSO, gradient boosting machine, plsRcox, SuperPC, and survival support vector machine (Figure 3). The results revealed that StepCox[forward]+ RSF had the highest C-index of 0.89 (Supplementary Figure 2). The Rad-score for each patient was determined by means of calculation using the model. As shown in Supplementary Figure 3, three sets of survival curves are presented based on the cutoff value of the median risk score. These results indicate that the image model demonstrates a satisfactory predictive capacity.
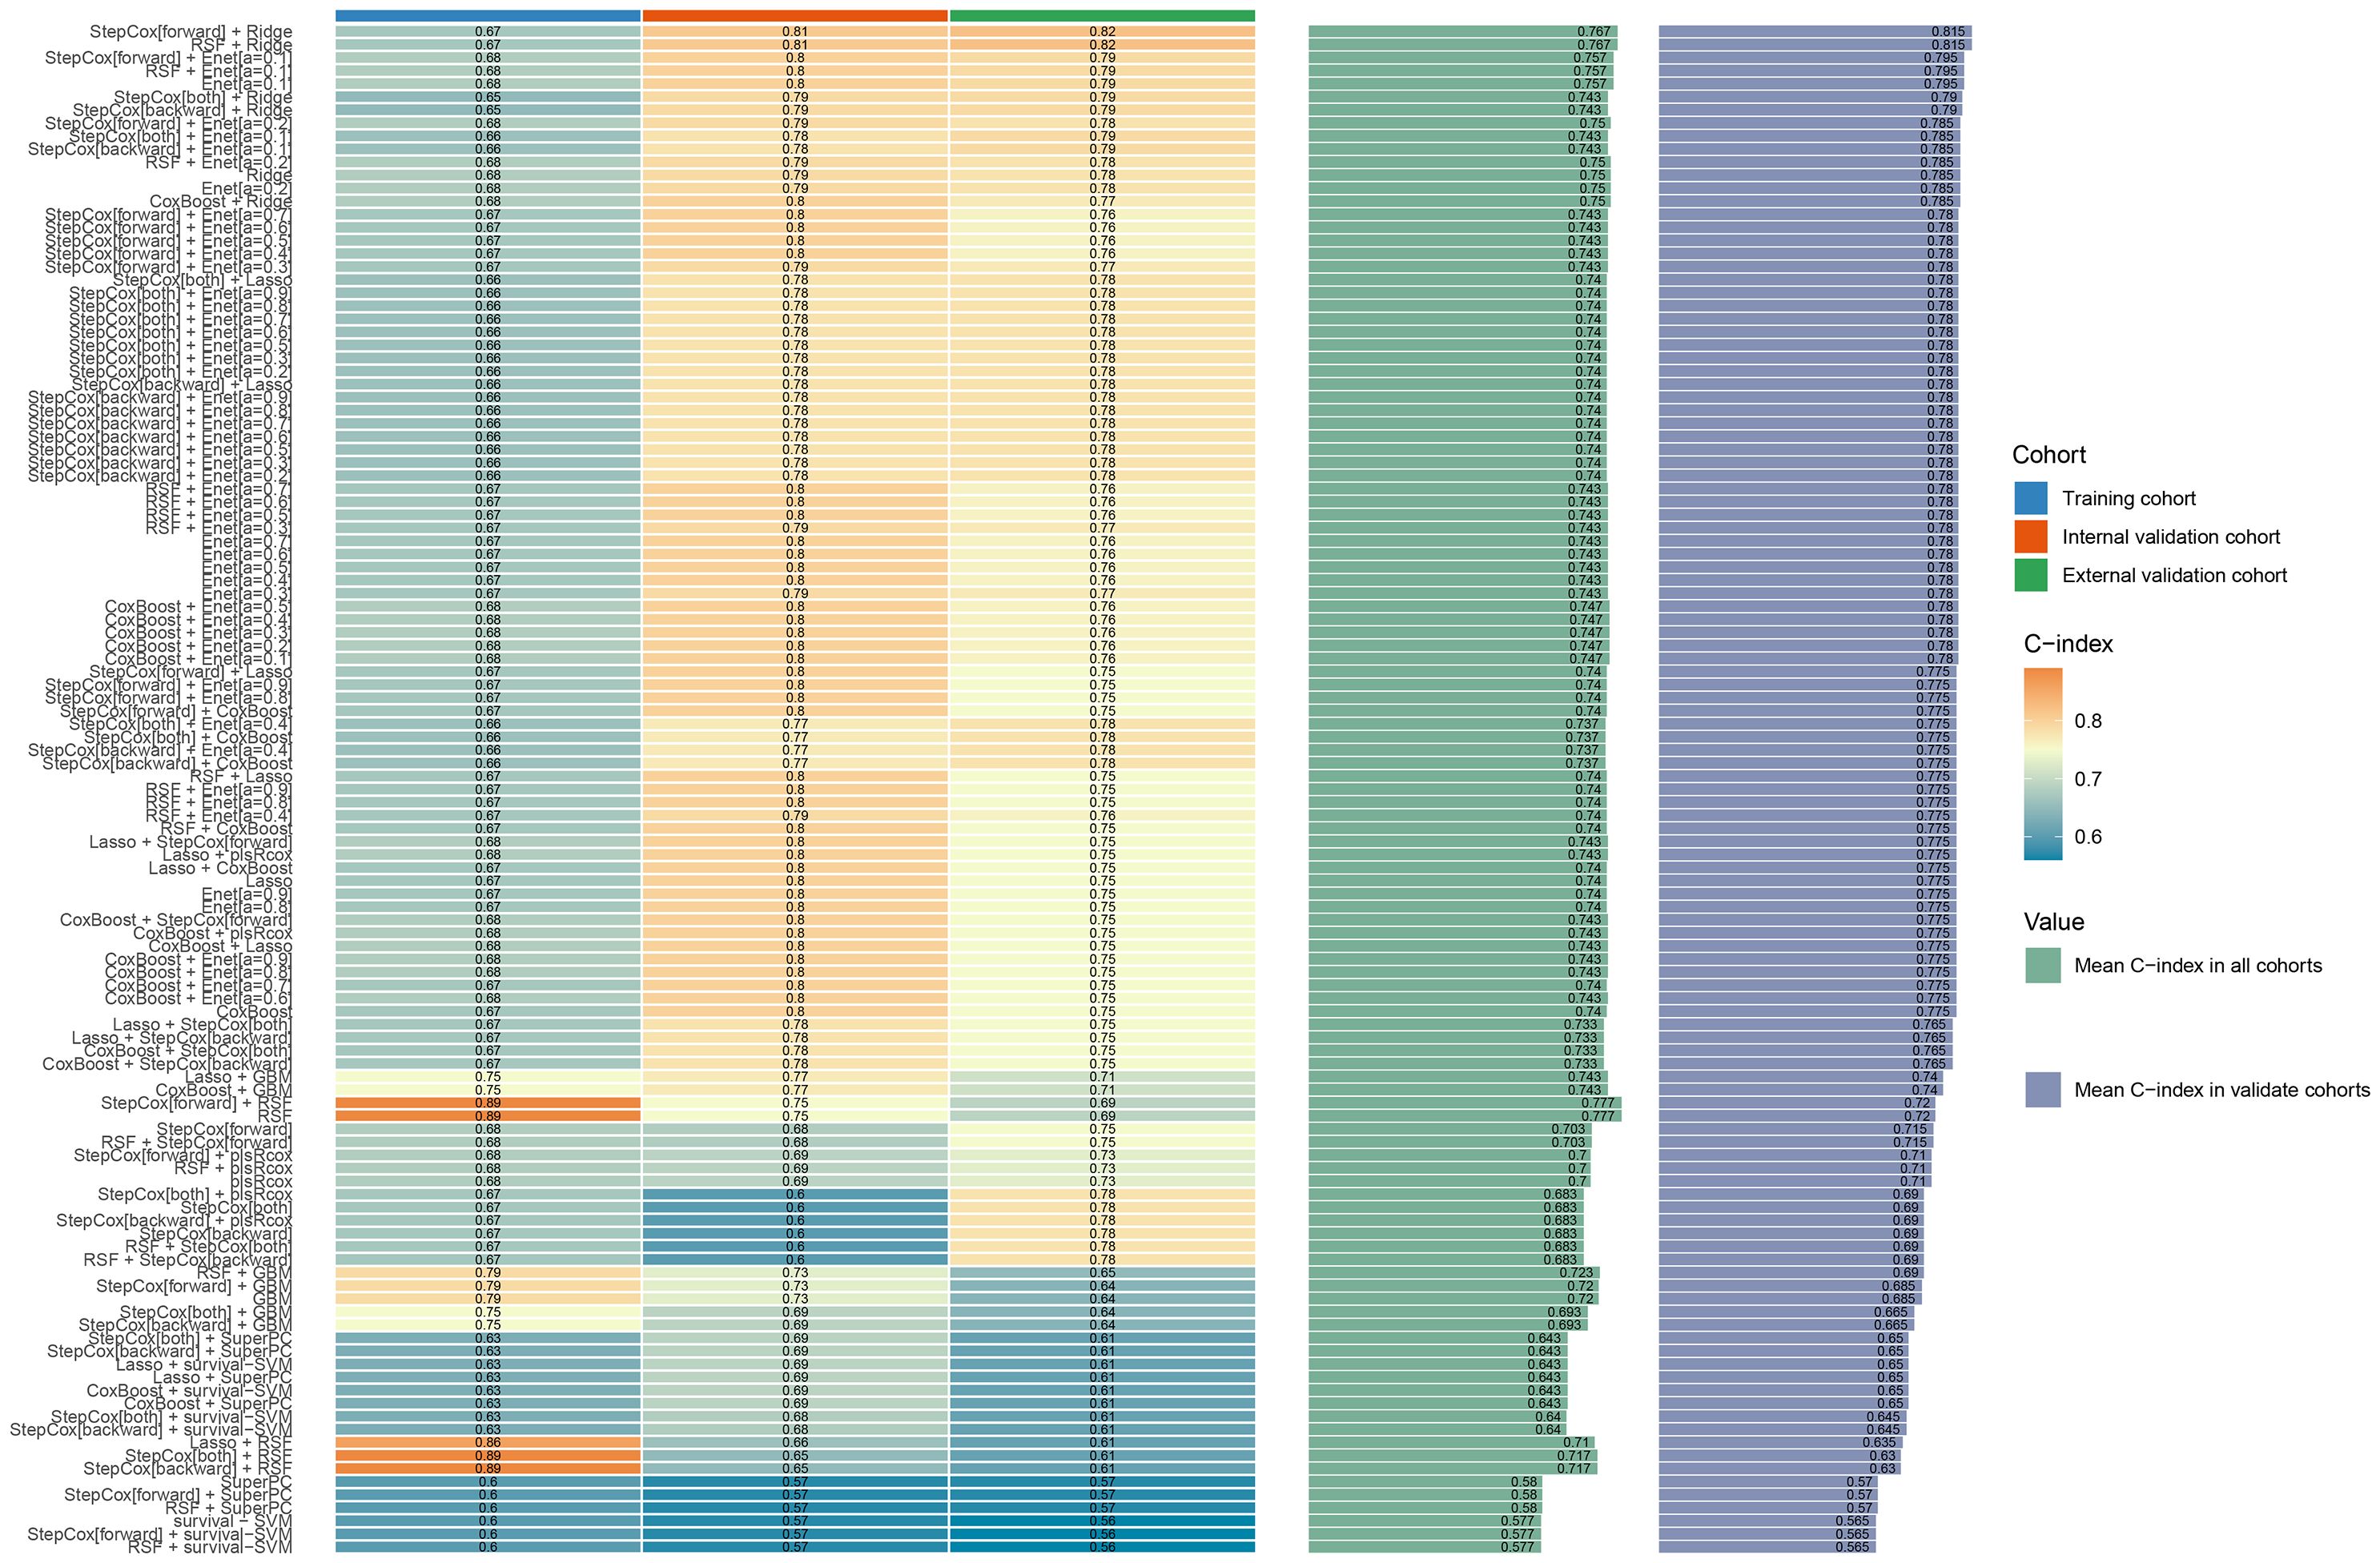
Figure 3. Machine learning model evaluation and correlation curve analysis: The consistency index (C index) for different machine learning models.
Clinical prognostic factor selection: LASSO + Cox
In the training set, LASSO regression selected the following 11 variables associated with OS: Age, body mass index (BMI), sex, T stage, N stage, lymphocyte count, neutrophil count, CA19–9 level, clinical stage, tumor size, and serum albumin (Supplementary Figures 4A, B). Subsequently, the 11 prognostic factors were entered into univariate and multivariate Cox regression analyses, which confirmed that age, clinical stage, tumor size, and albumin level were independent prognostic factors (Table 2).
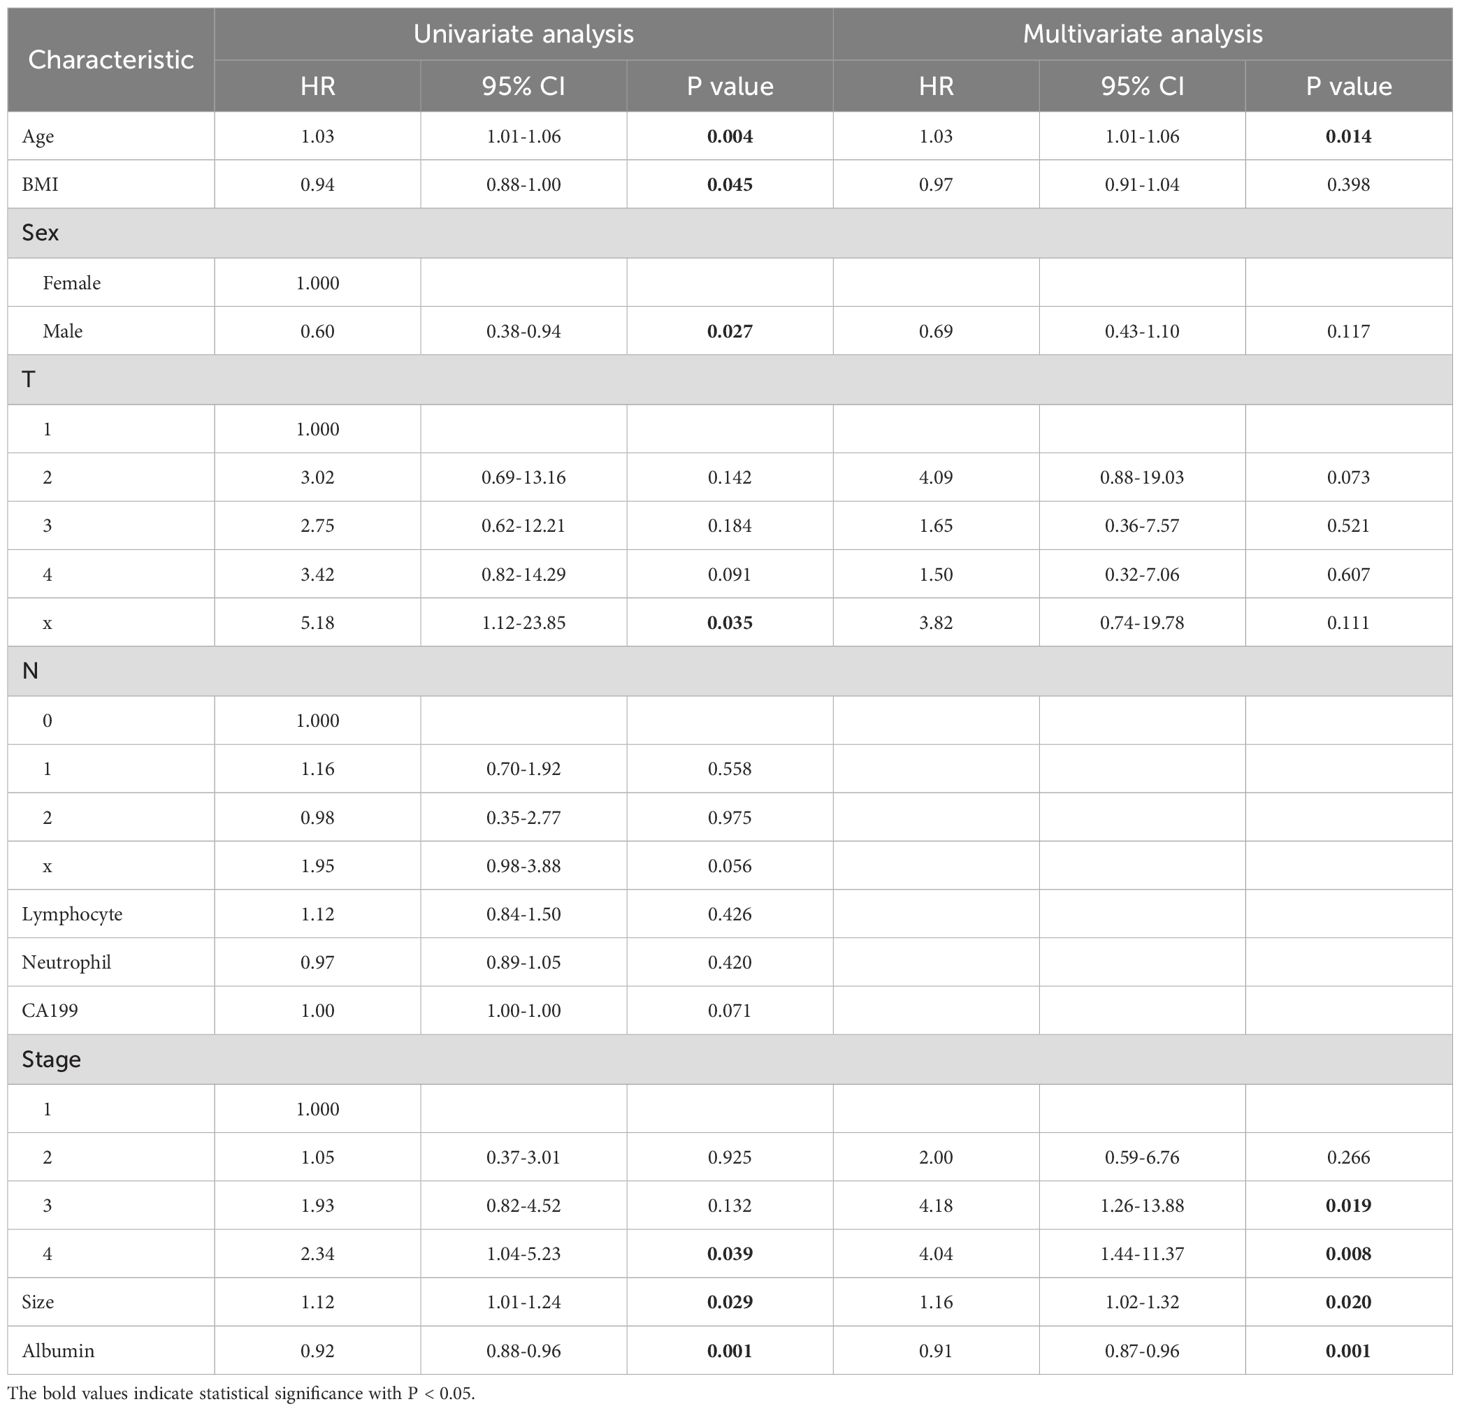
Table 2. Univariate and multivariate Cox regression models for overall survival.
Clinical nomogram and clinical–radiomics nomogram
In the training cohort, a clinical nomogram was first developed based on independent clinical prognostic factors identified by multivariate Cox analysis (Figure 4A). Subsequently, each patient’s radiomics signature (Rad-score) was integrated with these independent clinical predictors to construct a clinical–radiomics nomogram (Figure 4B). At the same time, we have developed online dynamic nomograms for real-time use by clinicians. One of them is an online nomogram for clinical model (https://yanzeli95.shinyapps.io/DynNomapp_no_risk_score/). The other is an online nomogram for clinical-radiomics model (https://yanzeli95.shinyapps.io/DynNomapp_risk_score/).
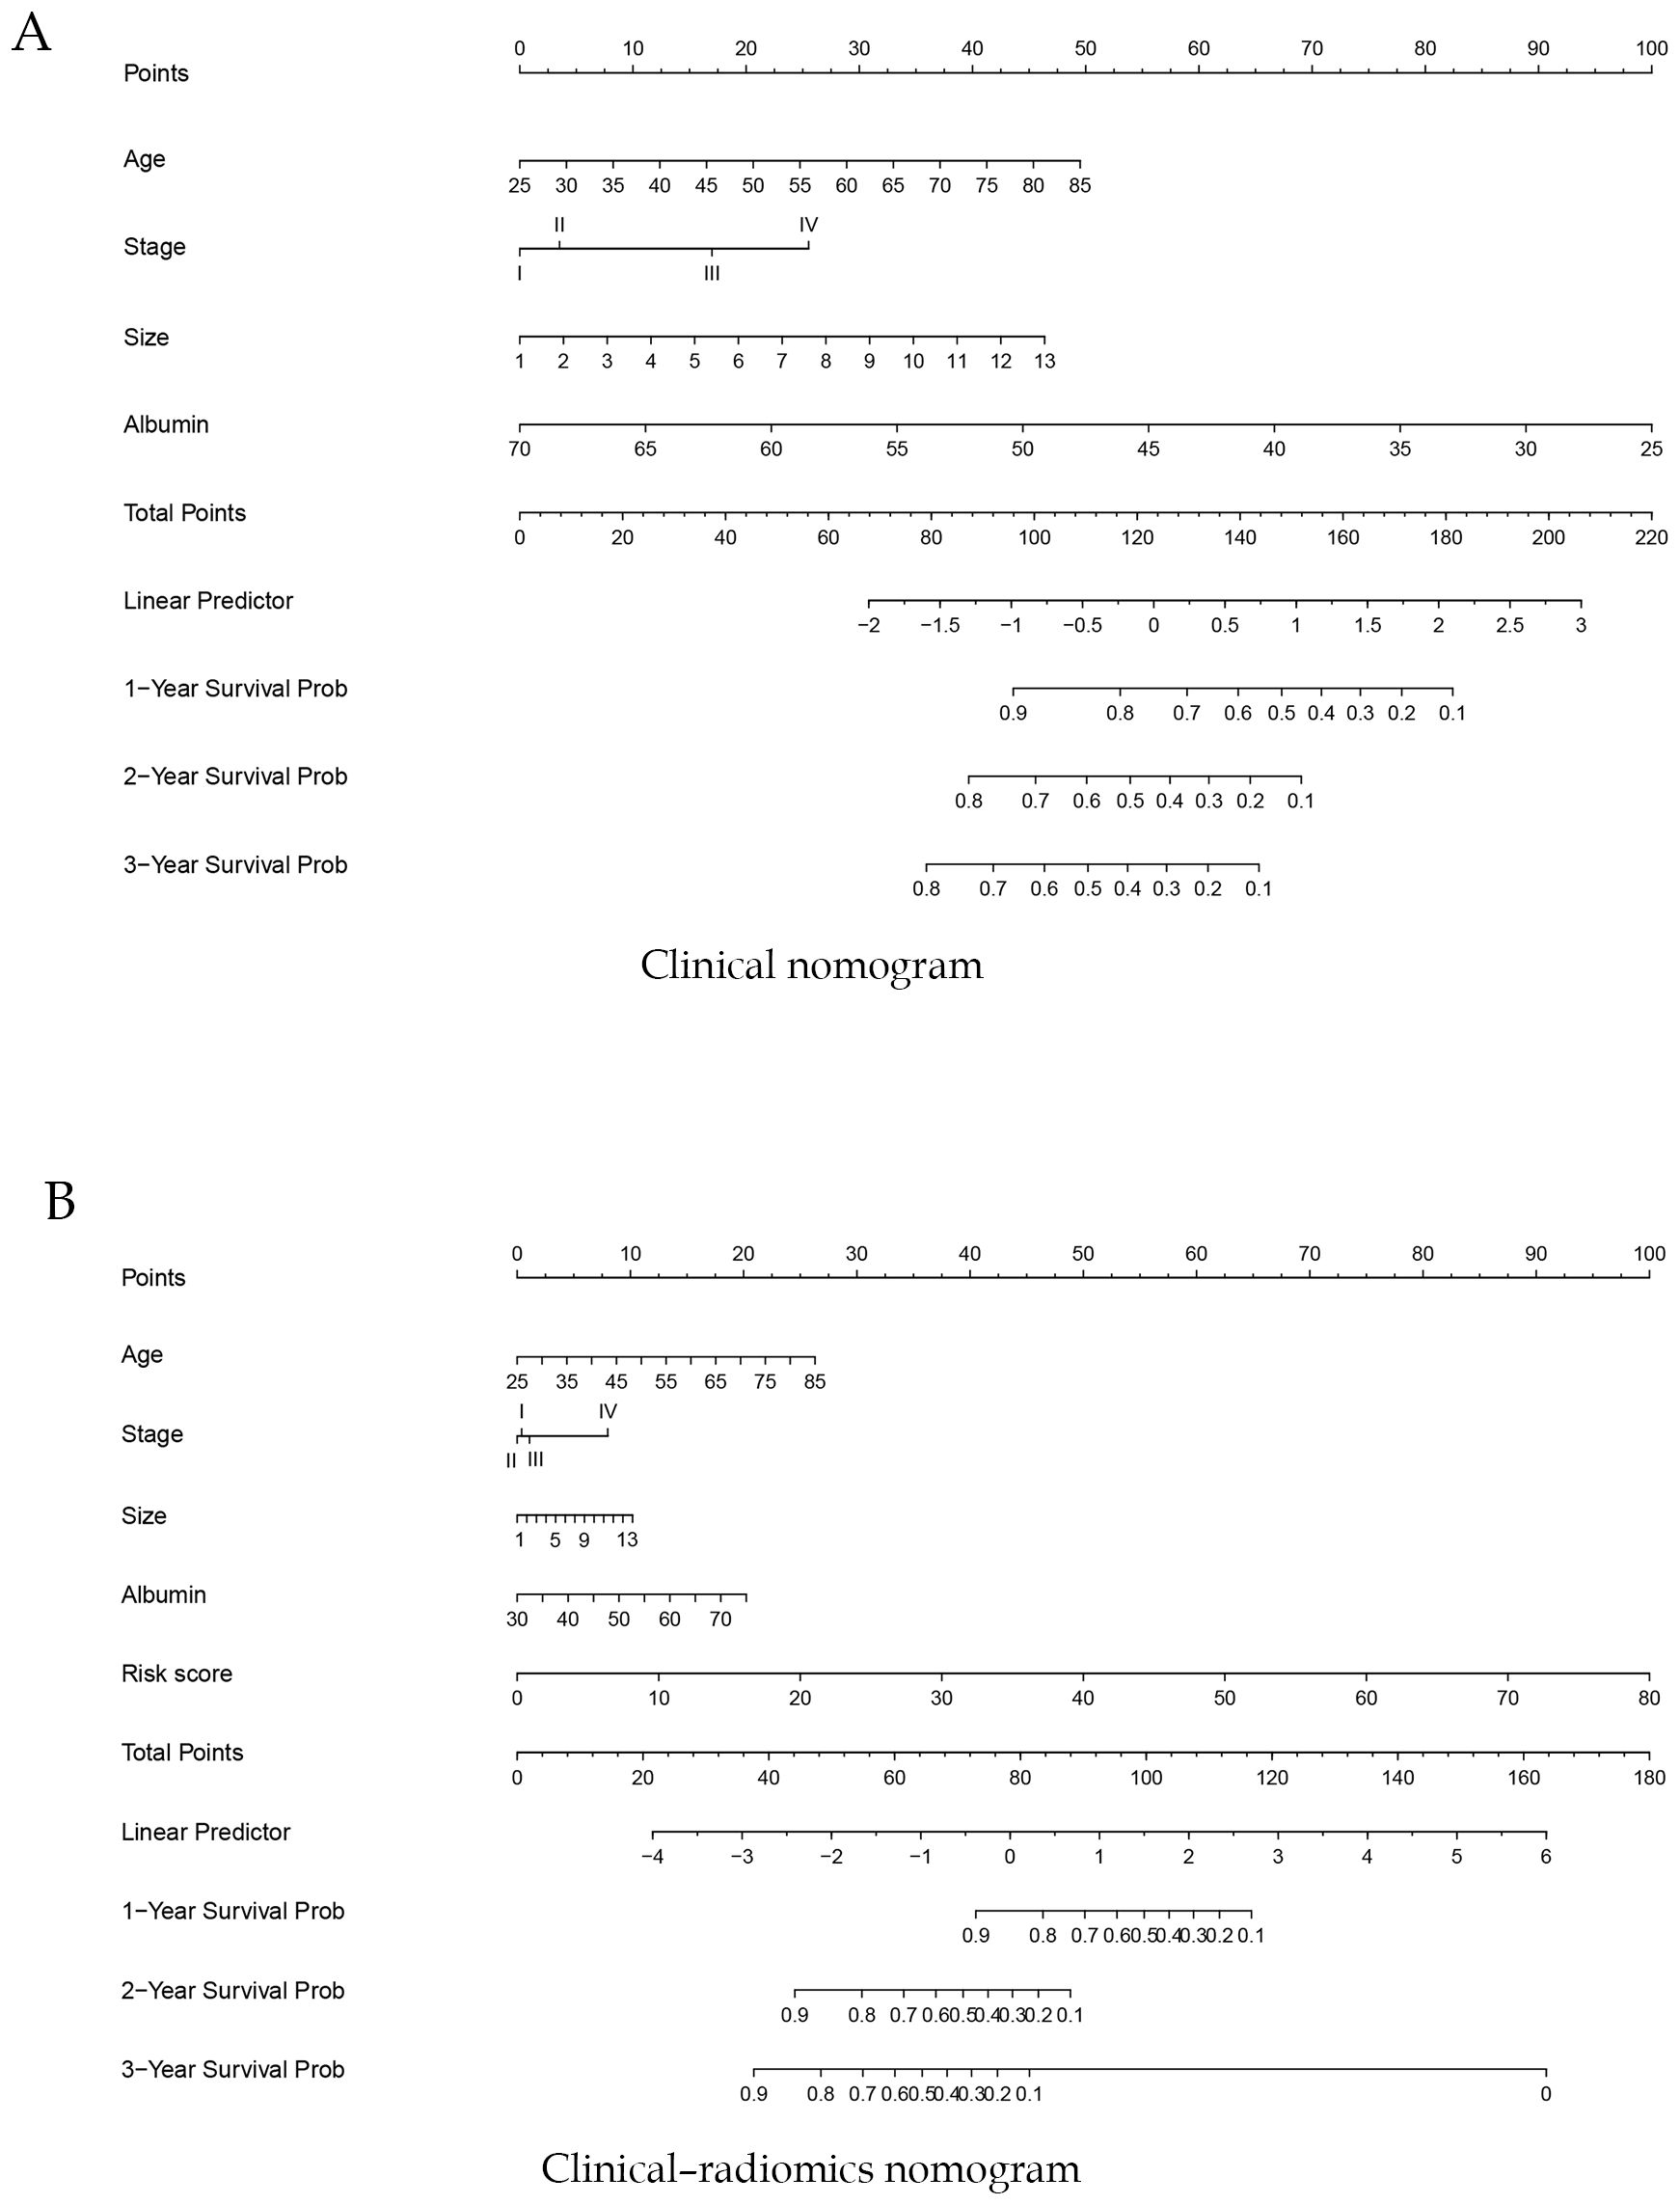
Figure 4. Construction of a clinical nomogram (A) and a clinical–radiomics nomogram (B) for predicting the prognosis of pancreatic cancer based on clinical characteristics in the training cohort.
For the clinical nomogram, the area under the ROC curves (AUC-ROC) for predicting 1-, 2-, and 3-year OS were 0.577, 0.721, and 0.730 in the internal validation cohort (Figure 5A), and 0.841, 0.757, and 0.598 in the external validation cohort (Figure 5B). DCA showed that the clinical nomogram provided greater net benefit than treat-all or treat-none strategies across a range of threshold probabilities in both validation cohorts (Figures 5C, D). Calibration plots demonstrated close agreement between predicted and observed survival, confirming the model’s stability (Figures 5E, F). The C-index of the nomogram was 0.71.
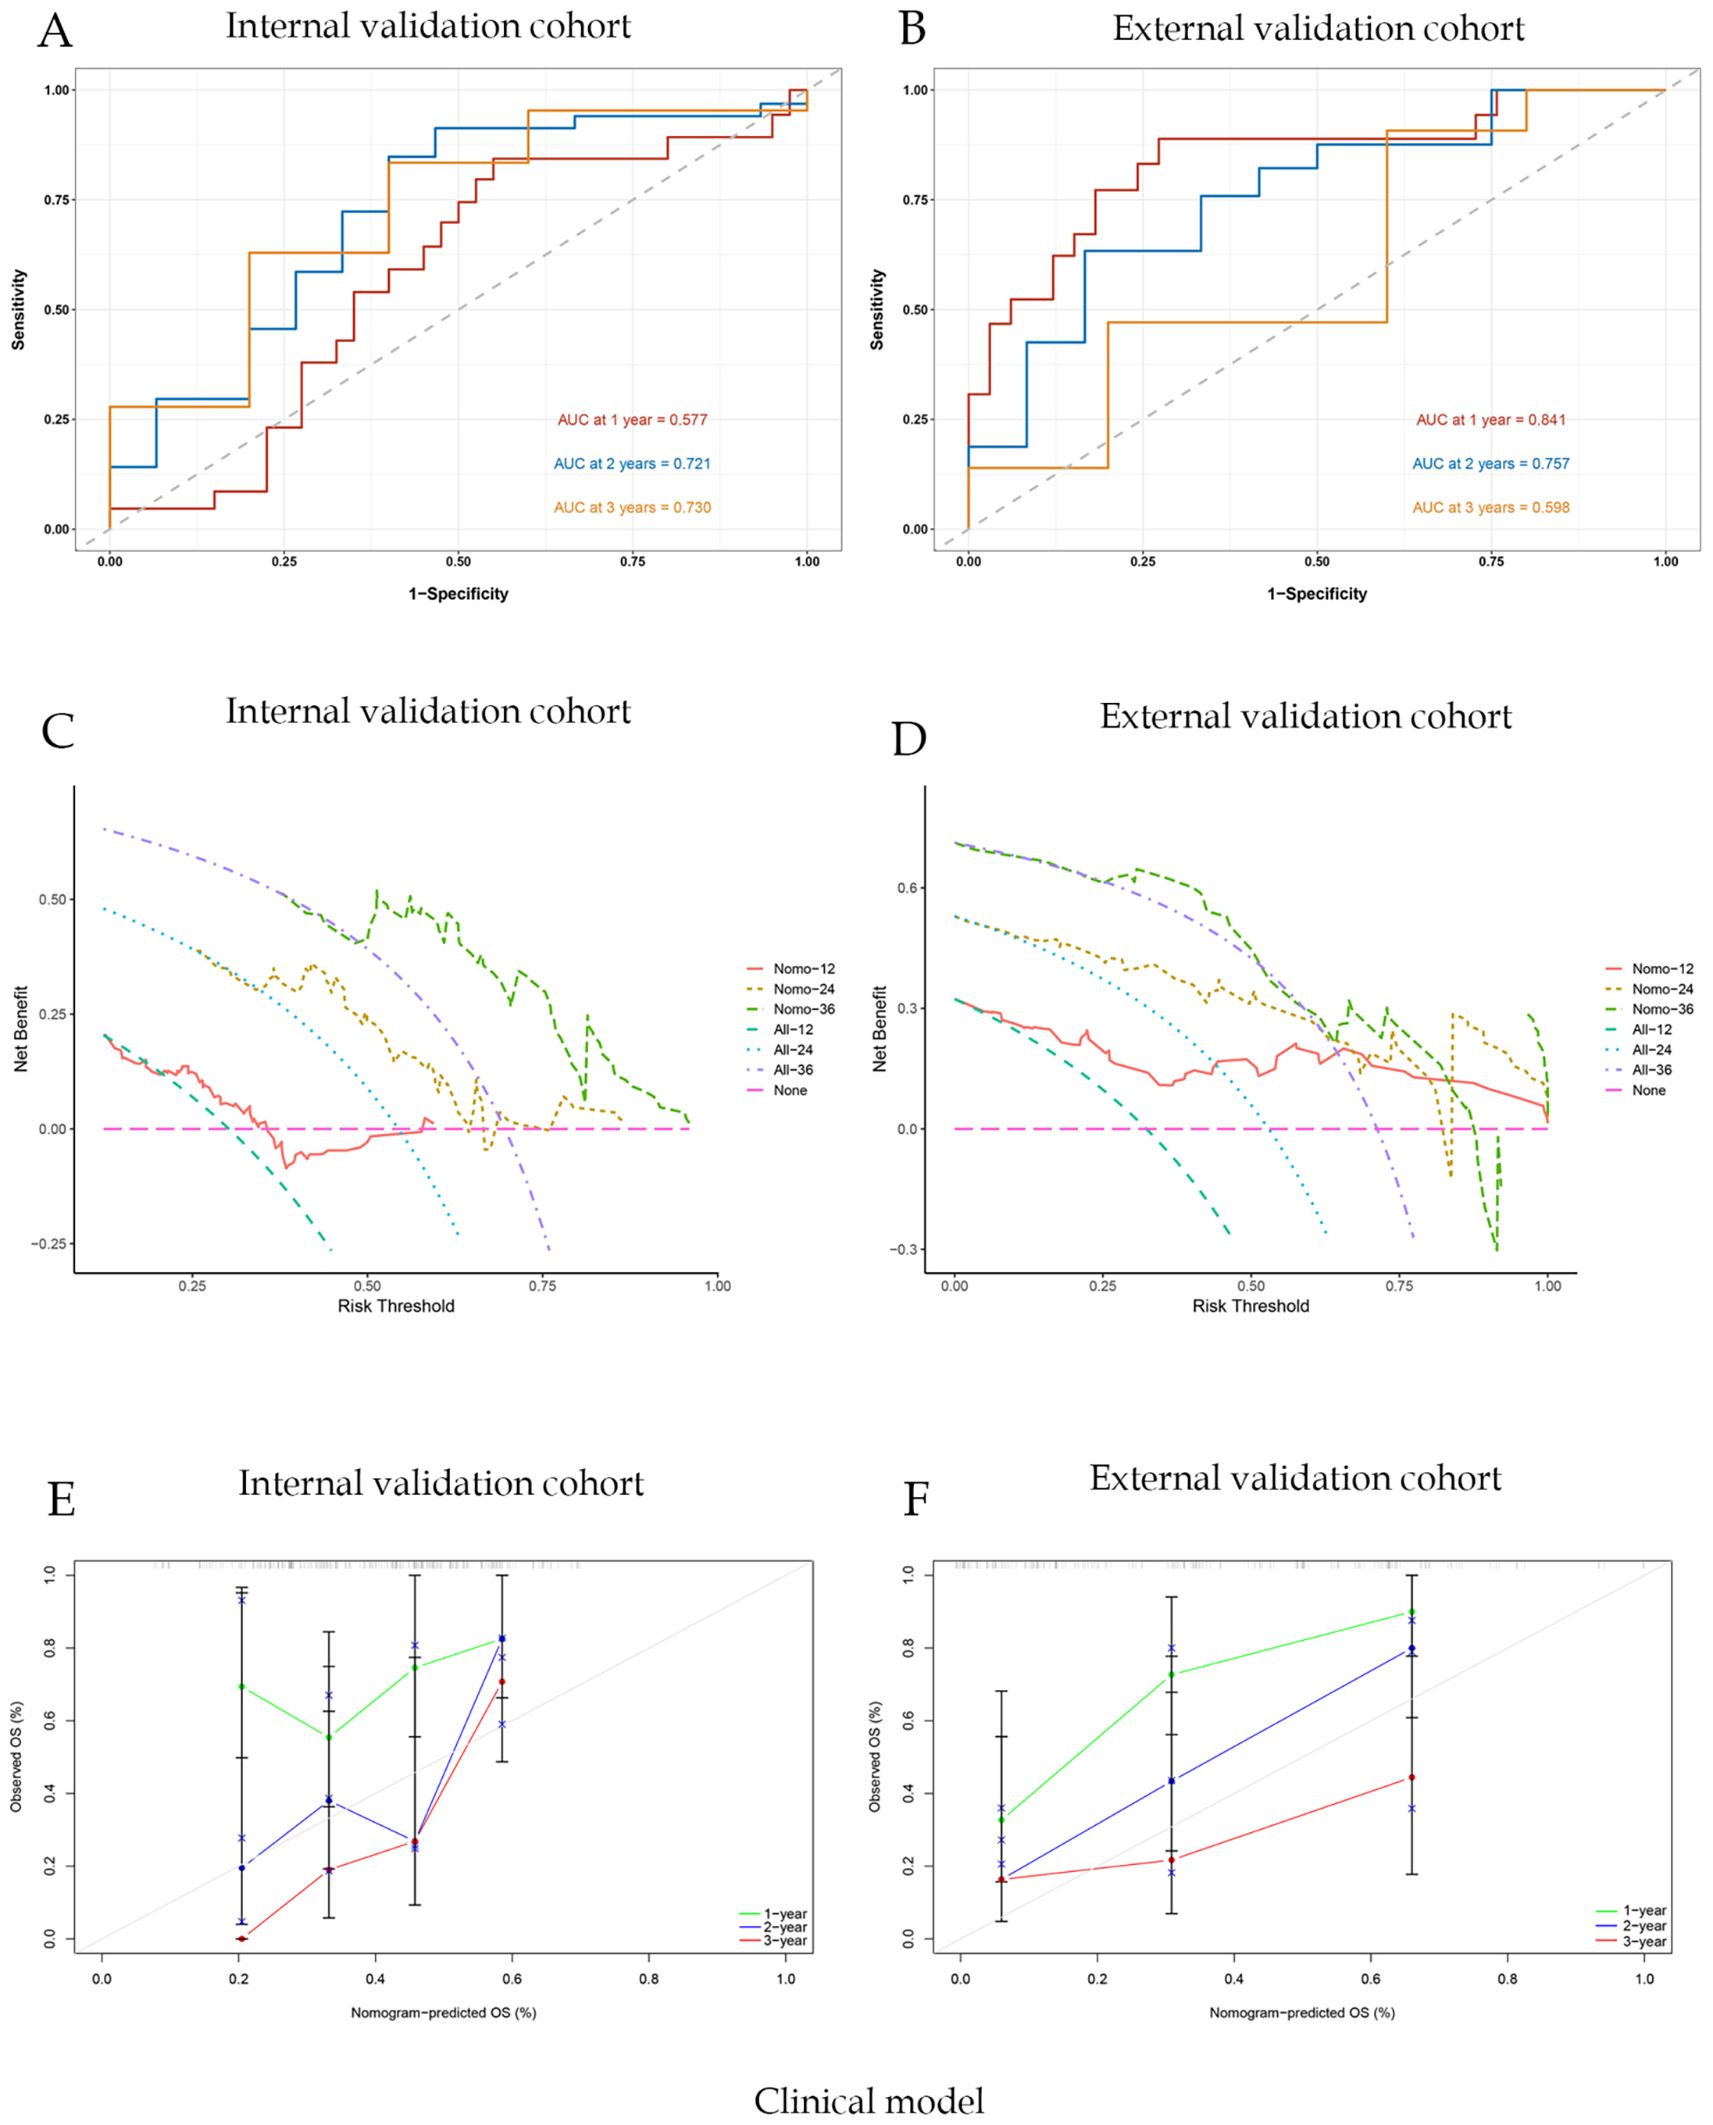
Figure 5. Clinical model evaluation and analysis of correlation curves; (A) ROC curve of nomogram model with AUC of internal validation cohort; (B) ROC curve of nomogram model with AUC of external validation cohort; (C)Nomogram model clinical decision curve (DCA) of internal validation cohort; (D) Nomogram model clinical decision curve (DCA) of external validation cohort; (E) Calibration curves of internal validation cohort; (F) Calibration curves of external validation cohort.
For the clinical-radiomics nomogram, the AUC-ROC for predicting 1-, 2-, and 3-year OS were 0.791, 0.846, and 0.840 in the internal validation cohort (Figure 6A), and 0.863, 0.830, and 0.734 in the external validation cohort (Figure 6B). DCA showed net benefit over treat-all/none strategies across thresholds (Figures 6B, E), and calibration plots confirmed close agreement between predicted and observed survival (Figures 6C, F). The C-index of the nomogram was 0.892. And the briefer scores of the two models are shown in Table 3.
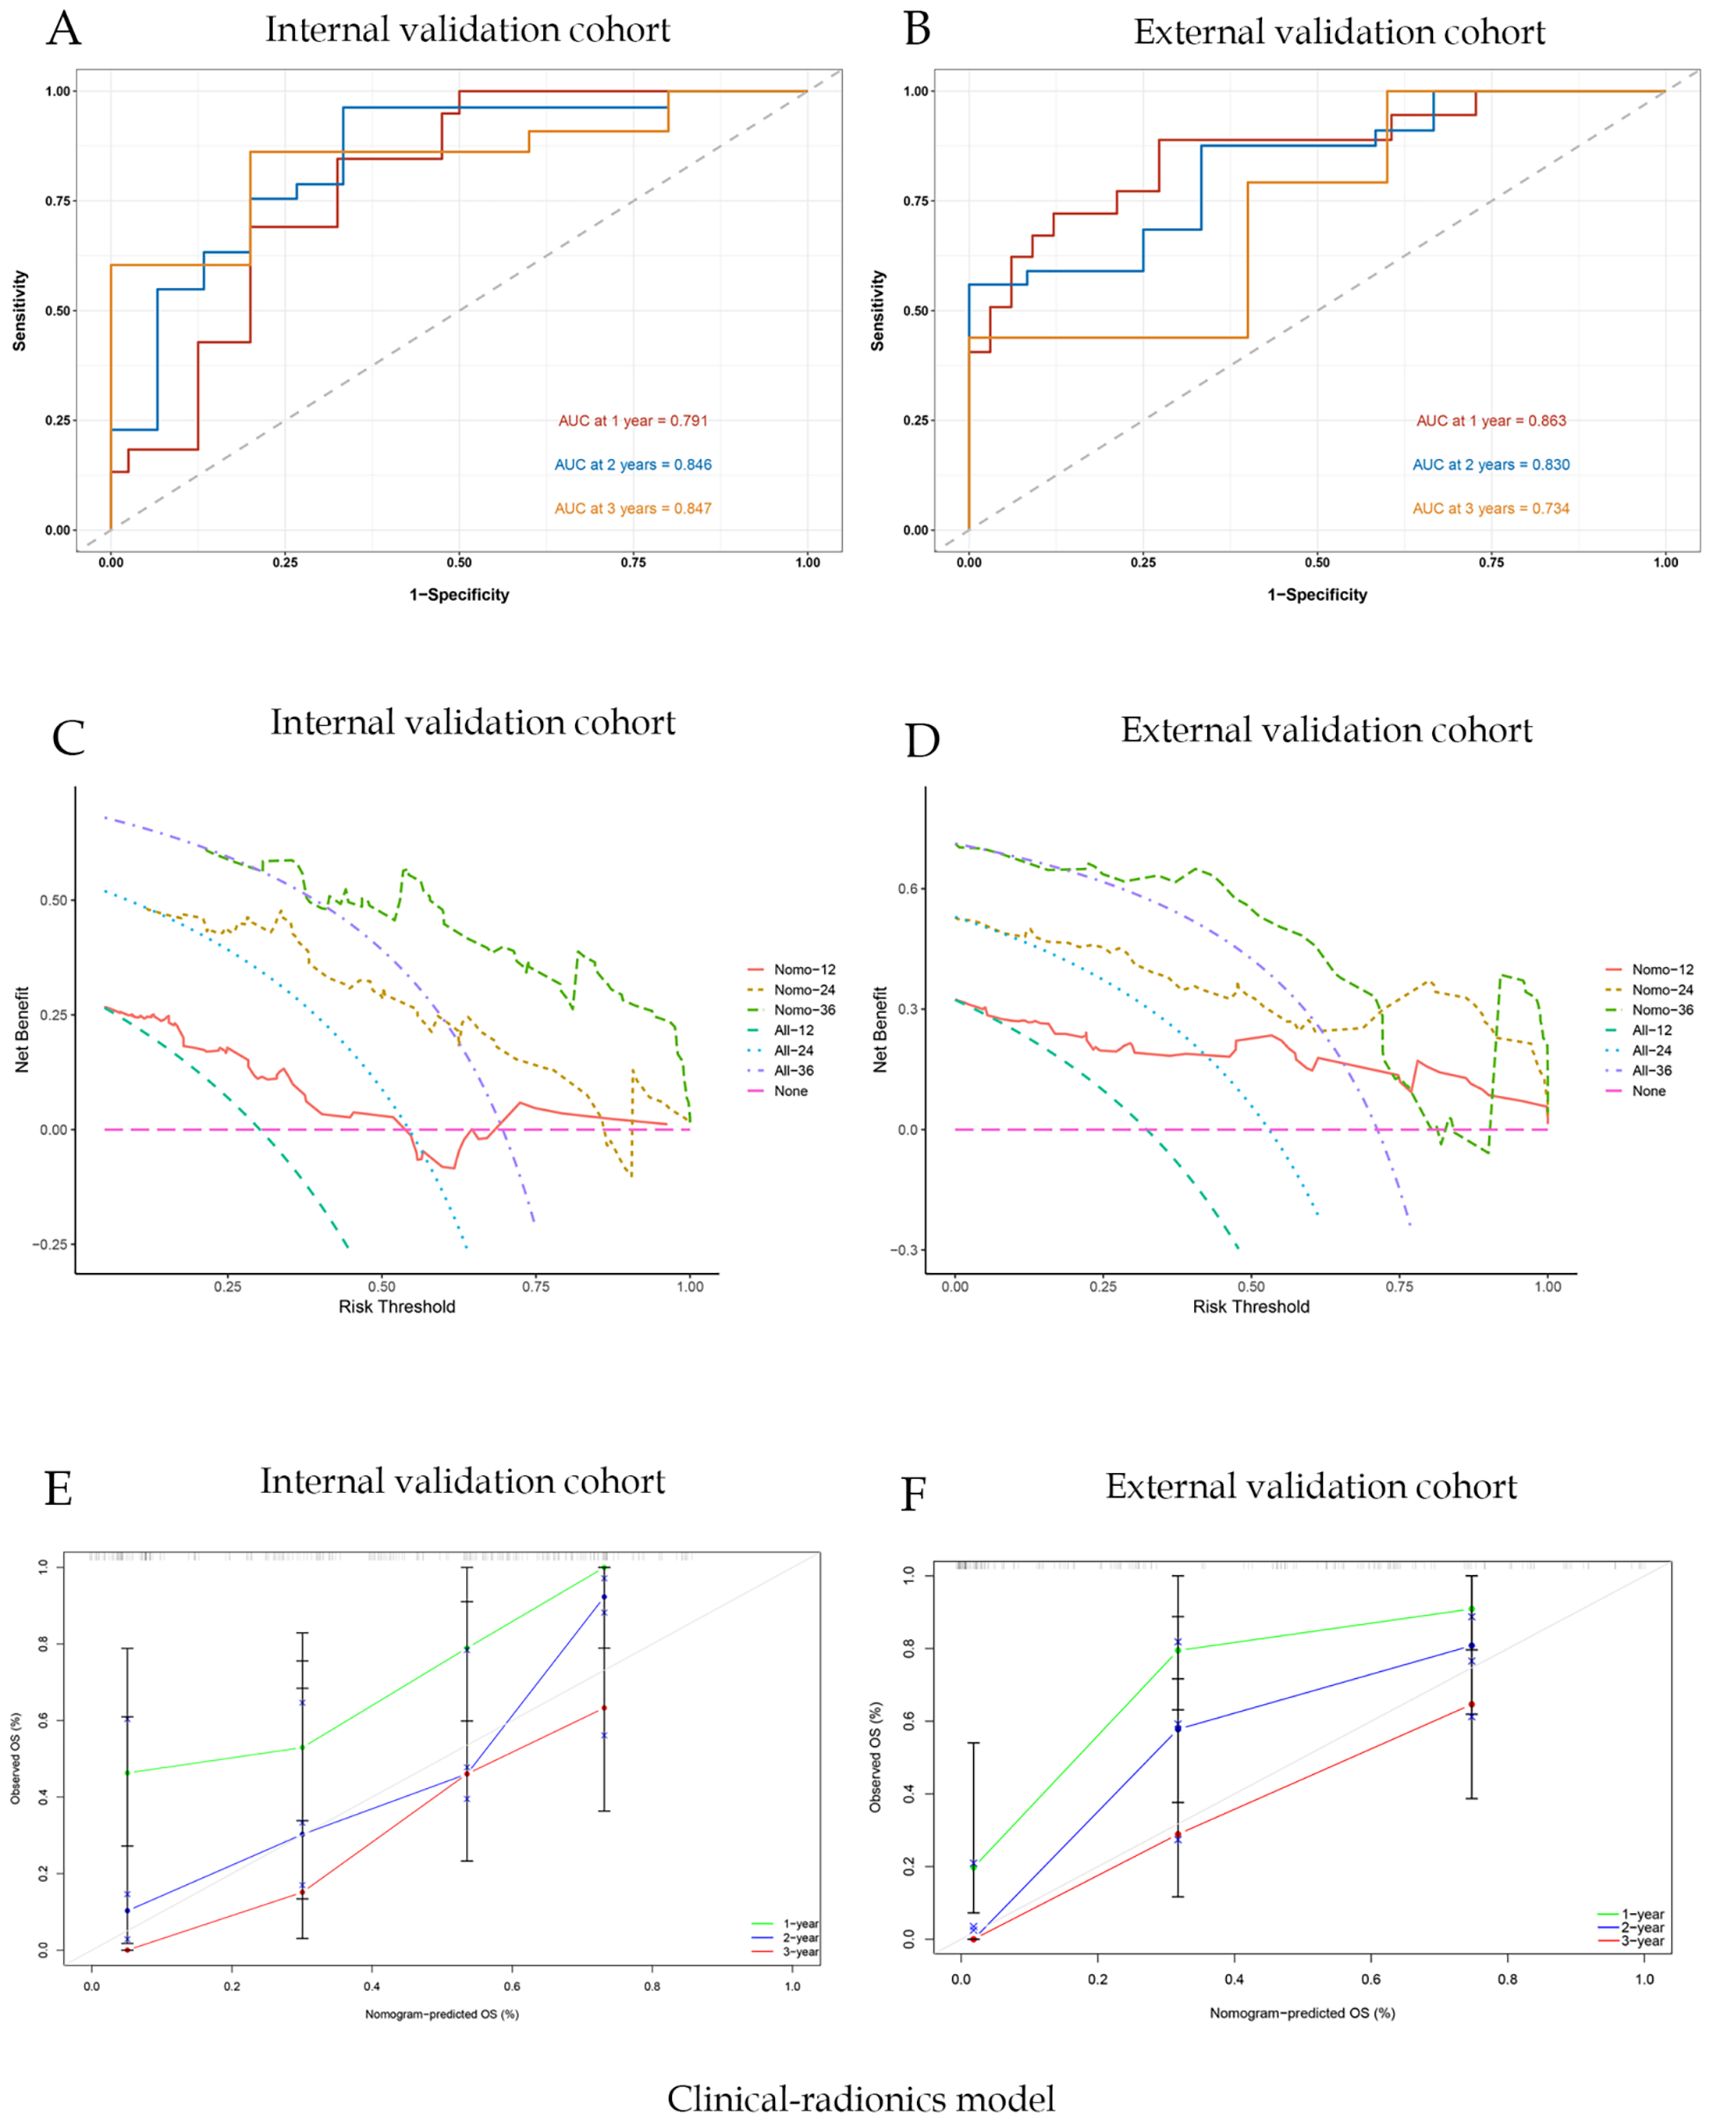
Figure 6. Joint clinic-radionics model evaluation and correlation curve analysis; (A) ROC curve of nomogram model with AUC of internal validation cohort; (B) ROC curve of nomogram model with AUC of external validation cohort; (C) Nomogram model clinical decision curve (DCA) of internal validation cohort; (D) Nomogram model clinical decision curve (DCA) of external validation cohort; (E) Calibration curves of internal validation cohort; (F) Calibration curves of external validation cohort.
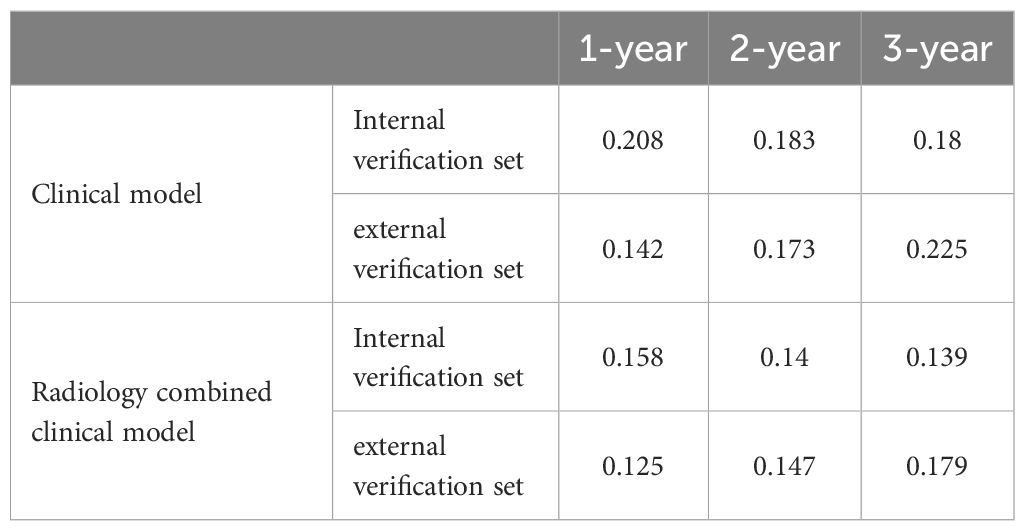
Table 3. The brifer scores of the two models.
Discussion
To our knowledge, this is the first clinical-radiomic prognostic risk model of survival to chemoradiotherapy in patients with inoperable PC, which may be a new prognostic imaging biomarker for PC. PC has the highest mortality rate among all malignant tumors worldwide (19). Despite significant advances in medical technology, the prognosis of PC has improved significantly (20). However, the overall prognosis for patients diagnosed with PC continues to be unfavorable, representing a significant threat to their survival (21, 22). We combined clinical and radiomics features, optimizing the screening and combination of radiomics parameters related to the prognosis of PC using a variety of machine learning methods, which improved the accuracy of the prediction results. Additionally, a significant machine learning radiomics prognostic model was developed to predict the OS to chemoradiotherapy in patients diagnosed with inoperable PC.
Chemoradiotherapy improves the prognosis of patients diagnosed with inoperable PC (23). Therefore, predicting the efficacy of chemoradiotherapy has become a top priority. Previous studies have demonstrated that factors such as patients’ age, tumor differentiation, tumor size, serum alkaline phosphatase, albumin level, and CA 19–9 can serve as independent predictors of PC prognosis (24). Several predictive models have been developed for PC. A retrospective study leveraging both the Surveillance, Epidemiology, and End Results(SEER) database and a Chinese cohort developed a prognostic nomogram for PC based on clinical characteristics. This nomogram demonstrated AUC for 1-, 3-, and 5-year survival rates of 0.71, 0.82, and 0.81, respectively (25). Based on an analysis of clinical parameters and DNA methylation risk scores, Deng et al. established and validated a nomogram with 1-, 2-, and 3-year AUCs of 0.899, 0.765, and 0.766, respectively (26). Our findings that the 1-, 2-, and 3-year AUCs of the clinical model constructed to predict inoperable PC survival were 0.577, 0.721, and 0.730, respectively. Although the predictive power of clinical models is acceptable, these indicators cannot identify patients with a high probability of recurrence or a poor prognosis after treatment through subtle heterogeneous changes within tumors (27, 28).
However, few studies have used machine learning for prognostic analysis of PC. Some researchers have constructed a prognostic model to evaluate the prognosis the outcomes of patients with PC liver metastases who are undergoing chemoimmunotherapy based on magnetic resonance features and clinical data. The nomogram generated from this model achieved an AUC of 0.770 for predicting 1-year OS (29). Although this analysis demonstrated the usefulness of clinical and other models in the diagnosis of PC, it did not explore the ability of radiomics to predict prognosis. A recent retrospective case-control research using radiomics data from CT scans to evaluate PC health indicated the merits of radiomics. However, this study did not combine survival benefit outcomes (30).
In this study, we tested a wide range of machine learning algorithms to construct radiomics-based prognostic models for hepatocellular carcinoma. The rationale for employing multiple algorithms lies in the distinct strengths and limitations of each approach (31). For example, Cox-based models offer strong interpretability and clinical relevance but may oversimplify complex nonlinear relationships. Tree-based ensemble methods, such as random survival forests, are capable of capturing high-order interactions and nonlinear effects, yet may lack transparency. Gradient boosting algorithms, such as XGBoost and LightGBM, often demonstrate superior predictive accuracy and robustness in high-dimensional data but require careful tuning to avoid overfitting. Similarly, support vector machines (SVM) and neural network–based models can handle complex feature spaces but may be less intuitive for clinical translation. By systematically comparing these algorithms across training, internal, and external validation cohorts using the concordance index, we ensured that the final selected model achieved both optimal performance and generalizability. This comparative approach not only highlights the variability in algorithmic performance but also strengthens confidence in the robustness of the chosen model. Ultimately, the use of diverse machine learning strategies allowed us to balance predictive accuracy with interpretability, ensuring the proposed radiomics score is both scientifically sound and clinically applicable. And we employed both stepwise Cox and RSF to build and evaluate prognostic models for PC. Stepwise Cox was chosen for its strong clinical interpretability and ability to identify key prognostic variables while maintaining a parsimonious model structure. In contrast, RSF offers distinct advantages in capturing complex, nonlinear relationships and interactions among variables without relying on the proportional hazards assumption (32). By combining these two approaches, we were able to leverage the complementary strengths of interpretability and predictive accuracy. This dual strategy not only provides robust survival prediction but also ensures that the results remain clinically meaningful and applicable to individualized treatment planning.
Patients with carcinoma of pancreatic head undergoing radical resection were analyzed with respect to the ability of radiomics and clinical data to predict OS, demonstrating that CT scans revealed shorter disease-free survival for portal vein-stage hypodense PC (33). Study has used purely clinical variables to establish clinical nomograms for pancreatic cancer or other types of cancer. For example, there are studies that focus on clinical data from patients with pancreatic cancer, using clinical variables (such as tumor stage, CA19–9 levels, albumin levels, etc.) to predict patients ‘OS. These studies have generally shown that pure clinical nomograms can provide some predictive power, but their predictive accuracy is often limited by clinical variables (34). Parr et al. performed a retrospective study involving 74 patients with marginally resectable PC who received stereotactic RT. They compared the performances of clinical, radiomic, and combination models in predicting outcomes. The mean AUC of the three models were 0.66, 0.78, and 0.77, respectively. Their findings indicated that the radiomics feature-based model could better predict the OS and recurrence rate of PC than the clinical feature-based model (35). This study aligns with ours in indicating the ability of single and combined models to provide critical information about pancreatic tissues. In this study, the C-index of the clinical model was 0.71, while the C-index of the combined model increased to 0.892, indicating a significant improvement in the accuracy of the combined model in predicting OS. This result suggests that the combined model can better integrate clinical variables and radiologic characteristics, thereby providing more accurate prognostic assessment. Although these predictive models can assess patient survival, their predictive performance remains suboptimal. In our study, the 1-, 2-, and 3-year AUCs of the clinical-radiomics model were 0.791, 0.846, and 0.847, respectively. Our newly constructed joint model had better predictive performance for prognosis than the models in other studies. In addition, using Cox regression models for variable screening (such as LASSO) is also an effective method to suppress overfitting. It reduces the complexity of the model by selecting variables and avoids overfitting problems. Future research can further verify the application effect of this model in different populations and clinical settings by increasing the sample size and conducting more extensive external validation. It can effectively reduce the possibility of over-fitting and improve the stability of the model.
The clinical–radiomics nomogram exhibited a higher C-index and AUC–ROC compared with the clinical nomogram. This indicates that the combined model had stronger predictive stability and validity than the single models, and the clinical radiomics combined model had a better prognosis in this study. This may be due to the ability of imaging features to capture microcarcinomas that are not visible to the naked eye and tumor cells that are missing from the margins of the target. The radiomics model in this study predicted a lower proportion of cancer mortality in low-risk patients than in high-risk patients, which was difficult to predict using clinical laboratory data.
The joint nomogram constructed in this study has the capacity to accurately predict the prognostic status of PC by integrating factors, such as physiological indicators, medical history, biochemical indicators, tumor stage, and imaging characteristics. Clinicians can perform a preliminary assessment of the patient’s prognosis before treatment based on predicted results of the nomogram, provide patients with more accurate disease information and treatment recommendations, and enhance their confidence and compliance with the treatment plan. Thus, a more personalized treatment plan can be developed, which can effectively enhance both the survival rate and the quality of life of patients. Radiomic characteristics have great potential in revealing the tumor microenvironment, cellular heterogeneity, and tumor invasiveness. Combining these biological characteristics with clinical prognostic variables can help us understand tumor behavior more comprehensively and further enhance the clinical application value of prognostic models. In addition, with the continuous development of artificial intelligence and machine learning technology, the application of radiology will play an increasingly important role in cancer diagnosis, staging and treatment decisions.
Radiomics data has the potential to facilitate a more profound comprehension of tumor behavior, thereby enabling the creation of enhanced predictive models (36). In this study, a combined clinical radiomics prediction model was compared with a traditional clinical prediction model in order to evaluate their abilities to predict PC prognosis. This study has several advantages. Due to the large sample size and internal and external validation, our study ensured credibility and authenticity. However, this study has some limitations. Firstly, the use of retrospective data may have introduced data bias. Secondly, because this study included only Chinese patients, the generalizability of the results to other countries is limited. However, despite these issues, the machine learning-based prognostic models were specifically developed to predict the survival prognostic survival in patients with inoperable PC. All parameters necessary for this model were derived from routine clinical practice and are readily applicable by clinicians to inform comprehensive treatment plans for patients with inoperable PC. This enables early intervention to prevent and address potential adverse clinical events.
Conclusion
The clinical–radiomics nomogram demonstrated superior predictive performance for OS compared to the clinical nomogram in inoperable PC patients undergoing CCRT.
Data availability statement
The raw data supporting the conclusions of this article will be made available by the authors, without undue reservation.
Ethics statement
This study was approved by the ethics committees of Shandong Cancer Hospital and Chongqing General Hospital, and informed consent was obtained from each subject. The studies were conducted in accordance with the local legislation and institutional requirements. The participants provided their written informed consent to participate in this study. Written informed consent was obtained from the individual(s) for the publication of any potentially identifiable images or data included in this article.
Author contributions
XL: Investigation, Methodology, Writing – original draft. KS: Investigation, Validation, Writing – review & editing. SD: Investigation, Validation, Writing – review & editing. YL: Data curation, Formal analysis, Visualization, Methodology, Writing – review & editing. PS: Data curation, Project administration, Writing – review & editing. SS: Data curation, Project administration, Writing – review & editing. BL: Data curation, Project administration, Writing – review & editing. JC: Data curation, Project administration, Writing – review & editing. RL: Software, Validation, Writing – review & editing. RZ: Software, Validation, Writing – review & editing. HW: Software, Validation, Writing – review & editing. HdW: Software, Validation, Writing – review & editing. YY: Funding acquisition, Writing – review & editing. ZL: Funding acquisition, Resources, Supervision, Writing – review & editing.
Funding
The author(s) declare financial support was received for the research and/or publication of this article. The study has been funded by National Natural Science Foundation of China under Grants (12475343) (12275162) (82072094). Taishan Scholars Program of Shandong Province, China (Grant NO. ts20120505). Collaborative Academic Innovation Project of Shandong Cancer Hospital (TS004) and by Taishan Scholars Program of Shandong Province, China (Grant NO. ts202408375). Natural Science Foundation of Shandong Province, China (Grant No.ZR2025QB37).
Acknowledgments
We thank all the patients and investigators.
Conflict of interest
The authors declare that the research was conducted in the absence of any commercial or financial relationships that could be construed as a potential conflict of interest.
Generative AI statement
The author(s) declare that no Generative AI was used in the creation of this manuscript.
Any alternative text (alt text) provided alongside figures in this article has been generated by Frontiers with the support of artificial intelligence and reasonable efforts have been made to ensure accuracy, including review by the authors wherever possible. If you identify any issues, please contact us.
Publisher’s note
All claims expressed in this article are solely those of the authors and do not necessarily represent those of their affiliated organizations, or those of the publisher, the editors and the reviewers. Any product that may be evaluated in this article, or claim that may be made by its manufacturer, is not guaranteed or endorsed by the publisher.
Supplementary material
The Supplementary Material for this article can be found online at: https://www.frontiersin.org/articles/10.3389/fimmu.2025.1655803/full#supplementary-material
References
1. Rahib L, Smith BD, Aizenberg R, Rosenzweig AB, Fleshman JM, and Matrisian LM. Projecting cancer incidence and deaths to 2030: the unexpected burden of thyroid, liver, and pancreas cancers in the United States. Cancer Res. (2014) 74:2913–21. doi: 10.1158/0008-5472.CAN-14-0155
2. Konstantinidis IT, Warshaw AL, Allen JN, Blaszkowsky LS, Castillo CF, Deshpande V, et al. Pancreatic ductal adenocarcinoma: is there a survival difference for R1 resections versus locally advanced unresectable tumors? What is a “true” R0 resection? Ann Surg. (2013) 257:731–6. doi: 10.1097/SLA.0b013e318263da2f
3. Siegel RL, Miller KD, Wagle NS, and Jemal A. Cancer statistics, 2023. CA Cancer J Clin. (2023) 73:17–48. doi: 10.3322/caac.21763
4. Liu GF, Li GJ, and Zhao H. Efficacy and toxicity of different chemotherapy regimens in the treatment of advanced or metastatic pancreatic cancer: A network meta-analysis. J Cell Biochem. (2018) 119:511–23. doi: 10.1002/jcb.26210
5. Raut CP, Tseng JF, Sun CC, Wang H, Wolff RA, Crane CH, et al. Impact of resection status on pattern of failure and survival after pancreaticoduodenectomy for pancreatic adenocarcinoma. Ann Surg. (2007) 246:52–60. doi: 10.1097/01.sla.0000259391.84304.2b
6. Grossberg AJ, Chu LC, Deig CR, Fishman EK, Hwang WL, Maitra A, et al. Multidisciplinary standards of care and recent progress in pancreatic ductal adenocarcinoma. CA Cancer J Clin. (2020) 70:375–403. doi: 10.3322/caac.21626
7. Petrelli F, Comito T, Ghidini A, Torri V, Scorsetti M, and Barni S. Stereotactic body radiation therapy for locally advanced pancreatic cancer: A systematic review and pooled analysis of 19 trials. Int J Radiat Oncol Biol Phys. (2017) 97:313–22. doi: 10.1016/j.ijrobp.2016.10.030
8. Chang JS, Chiu YF, Yu JC, Chen LT, and Ch’ang HJ. The role of consolidation chemoradiotherapy in locally advanced pancreatic cancer receiving chemotherapy: an updated systematic review and meta-analysis. Cancer Res Treat. (2018) 50:562–74. doi: 10.4143/crt.2017.105
9. Loehrer PJ Sr, Feng Y, Cardenes H, Wagner L, Brell JM, Cella D, et al. Gemcitabine alone versus gemcitabine plus radiotherapy in patients with locally advanced pancreatic cancer: an Eastern Cooperative Oncology Group trial. J Clin Oncol. (2011) 29:4105–12. doi: 10.1200/JCO.2011.34.8904
10. Chung SY, Chang JS, Lee BM, Kim KH, Lee KJ, and Seong J. Dose escalation in locally advanced pancreatic cancer patients receiving chemoradiotherapy. Radiother Oncol. (2017) 123:438–45. doi: 10.1016/j.radonc.2017.04.010
11. Krishnan S, Chadha AS, Suh Y, Chen HC, Rao A, Das P, et al. Focal radiation therapy dose escalation improves overall survival in locally advanced pancreatic cancer patients receiving induction chemotherapy and consolidative chemoradiation. Int J Radiat Oncol Biol Phys. (2016) 94:755–65. doi: 10.1016/j.ijrobp.2015.12.003
12. Swanson K, Wu E, Zhang A, Alizadeh AA, and Zou J. From patterns to patients: Advances in clinical machine learning for cancer diagnosis, prognosis, and treatment. Cell. (2023) 186:1772–91. doi: 10.1016/j.cell.2023.01.035
13. Tran KA, Kondrashova O, Bradley A, Williams ED, Pearson JV, and Waddell N. Deep learning in cancer diagnosis, prognosis and treatment selection. Genome Med. (2021) 13:152. doi: 10.1186/s13073-021-00968-x
14. Kummar S and Lu R. Using radiomics in cancer management. JCO Precis Oncol. (2024) 8:e2400155. doi: 10.1200/PO.24.00155
15. Ferro A, Bottosso M, Dieci MV, Scagliori E, Miglietta F, Aldegheri V, et al. Clinical applications of radiomics and deep learning in breast and lung cancer: A narrative literature review on current evidence and future perspectives. Crit Rev Oncol Hematol. (2024) 203:104479. doi: 10.1016/j.critrevonc.2024.104479
16. Su K, Liu X, Zeng YC, Xu J, Li H, Wang H, et al. Machine learning radiomics for predicting response to MR-guided radiotherapy in unresectable hepatocellular carcinoma: A multicenter cohort study. J Hepatocell Carcinoma. (2025) 12:933–47. doi: 10.2147/JHC.S521378
17. Wang Q, Lin Y, Ding C, Guan W, Zhang X, Jia J, et al. Multi-modality radiomics model predicts axillary lymph node metastasis of breast cancer using MRI and mammography. Eur Radiol. (2024) 34:6121–31. doi: 10.1007/s00330-024-10638-2
18. Song S, Song S, Zhao H, Huang S, Xiao X, Lv X, et al. Using machine learning methods to investigate the impact of age on the causes of death in patients with early intrahepatic cholangiocarcinoma who underwent surgery. Clin Transl Oncol. (2025) 27:1623–31. doi: 10.1007/s12094-024-03716-w
19. Chen W, Zheng R, Baade PD, Zhang S, Zeng H, Bray F, et al. Cancer statistics in China, 2015. CA Cancer J Clin. (2016) 66:115–32. doi: 10.3322/caac.21338
20. Stoop TF, Javed AA, Oba A, Koerkamp BG, Seufferlein T, Wilmink JW, et al. Advancing on pancreatic cancer. Nat Rev Gastroenterol Hepatol. (2021) 18:447. doi: 10.1038/s41575-021-00479-5
21. Jiang Z, Zheng X, Li M, and Liu M. Improving the prognosis of pancreatic cancer: insights from epidemiology, genomic alterations, and therapeutic challenges. Front Med. (2023) 17:1135–69. doi: 10.1007/s11684-023-1050-6
22. Sabater L, Muñoz E, Roselló S, Dorcaratto D, Garcés-Albir M, Huerta M, et al. Borderline resectable pancreatic cancer. Challenges and controversies. Cancer Treat Rev. (2018) 68:124–35. doi: 10.1016/j.ctrv.2018.06.006
23. Mukherjee S, Qi C, Shaw R, Jones CM, Bridgewater JA, Radhakrishna G, et al. Standard or high dose chemoradiotherapy, with or without the protease inhibitor nelfinavir, in patients with locally advanced pancreatic cancer: The phase 1/randomised phase 2 SCALOP-2 trial. Eur J Cancer. (2024) 209:114236. doi: 10.1016/j.ejca.2024.114236
24. Fiore M, Petrianni GM, Trecca P, D’Ercole G, Coppola A, La Vaccara V, et al. The impact of intensified staging and combined therapies in locally advanced pancreatic cancer: a secondary analysis of prospective studies. Int J Surg. (2024) 110:6081–91. doi: 10.1097/JS9.0000000000000755
25. Dong X, Wang K, Yang H, Cheng R, Li Y, Hou Y, et al. The Nomogram predicting the overall survival of patients with pancreatic cancer treated with radiotherapy: a study based on the SEER database and a Chinese cohort. Front Endocrinol (Lausanne). (2023) 14:1266318. doi: 10.3389/fendo.2023.1266318
26. Deng GC, Sun DC, Zhou Q, Lv Y, Yan H, Han QL, et al. Identification of DNA methylation-driven genes and construction of a nomogram to predict overall survival in pancreatic cancer. BMC Genomics. (2021) 22:791. doi: 10.1186/s12864-021-08097-w
27. Collarino A, Feudo V, Pasciuto T, Florit A, Pfaehler E, de Summa M, et al. Is PET radiomics useful to predict pathologic tumor response and prognosis in locally advanced cervical cancer? J Nucl Med. (2024) 65:962–70. doi: 10.2967/jnumed.123.267044
28. Xie PY, Zeng ZM, Li ZH, Niu KX, Xia T, Ma DC, et al. MRI-based radiomics for stratifying recurrence risk of early-onset rectal cancer: a multicenter study. ESMO Open. (2024) 9:103735. doi: 10.1016/j.esmoop.2024.103735
29. Lu W, Wu G, Miao X, Ma J, Wang Y, Xu H, et al. The radiomics nomogram predicts the prognosis of pancreatic cancer patients with hepatic metastasis after chemoimmunotherapy. Cancer Immunol Immunother. (2024) 73:87. doi: 10.1007/s00262-024-03644-2
30. Parr E, Du Q, Zhang C, Lin C, Kamal A, McAlister J, et al. Radiomics-based outcome prediction for pancreatic cancer following stereotactic body radiotherapy. Cancers (Basel). (2020) 12:1051. doi: 10.3390/cancers12041051
31. Greener JG, Kandathil SM, Moffat L, and Jones DT. A guide to machine learning for biologists. Nat Rev Mol Cell Biol. (2022) 23:40–55. doi: 10.1038/s41580-021-00407-0
32. Germer S, Rudolph C, Labohm L, Katalinic A, Rath N, Rausch K, et al. Survival analysis for lung cancer patients: A comparison of Cox regression and machine learning models. Int J Med Inform. (2024) 191:105607. doi: 10.1016/j.ijmedinf.2024.105607
33. Cozzi L, Comito T, Fogliata A, Franzese C, Franceschini D, Bonifacio C, et al. Computed tomography based radiomic signature as predictive of survival and local control after stereotactic body radiation therapy in pancreatic carcinoma. PLoS One. (2019) 14:e0210758. doi: 10.1371/journal.pone.0210758
34. Zhu X, Liu W, Cao Y, Su T, Zhu X, Wang Y, et al. Development and validation of multicenter predictive nomograms for locally advanced pancreatic cancer after chemoradiotherapy. Front Oncol. (2021) 11:688576. doi: 10.3389/fonc.2021.688576
35. Yun G, Kim YH, Lee YJ, Kim B, Hwang JH, and Choi DJ. Tumor heterogeneity of pancreas head cancer assessed by CT texture analysis: association with survival outcomes after curative resection. Sci Rep. (2018) 8:7226. doi: 10.1038/s41598-018-25627-x
Keywords: pancreatic cancer, machine learning, prognosis, radiology, survival
Citation: Liu X, Su K, Du S, Li Y, Sun P, Shen S, Liang B, Chen J, Liu R, Zhang R, Wang H, Wang H, Yin Y and Li Z (2025) A nomogram-based radiomics for predicting survival to concurrent chemoradiotherapy in inoperable pancreatic cancer: a dual-center cohort study. Front. Immunol. 16:1655803. doi: 10.3389/fimmu.2025.1655803
Received: 28 June 2025; Accepted: 07 October 2025;
Published: 23 October 2025.
Edited by:
Francesco Benedetto, Roma Tre University, ItalyReviewed by:
Yanyang Jin, First Affiliated Hospital of Jinzhou Medical University, ChinaYue Huang, The Affiliated Hospital of Putian University, China
Copyright © 2025 Liu, Su, Du, Li, Sun, Shen, Liang, Chen, Liu, Zhang, Wang, Wang, Yin and Li. This is an open-access article distributed under the terms of the Creative Commons Attribution License (CC BY). The use, distribution or reproduction in other forums is permitted, provided the original author(s) and the copyright owner(s) are credited and that the original publication in this journal is cited, in accordance with accepted academic practice. No use, distribution or reproduction is permitted which does not comply with these terms.
*Correspondence: Yong Yin, eWlueW9uZ3NkQDEyNi5jb20=; Zhenjiang Li, emhlbmpsaTE5ODdAMTYzLmNvbQ==
†These authors have contributed equally to this work and share first authorship