 Yanmin Shi
 Yiting Li1†
 Suyun Li
 Yang Xie
- 1National Regional Traditional Chinese Medicine (Lung Disease) Diagnosis and Treatment Center, The First Affiliated Hospital of Henan University of Chinese Medicine, Zhengzhou, China
- 2Collaborative Innovation Center for Chinese Medicine and Respiratory Diseases Co-Construction by Henan Province and Education Ministry of P.R. China, Henan University of Chinese Medicine, Zhengzhou, China
- 3Henan International Joint Laboratory of Evidence-based Evaluation for Respiratory Diseases, Henan Province Clinical Research Center for Respiratory Diseases, The First Affiliated Hospital of Henan University of Chinese Medicine, Zhengzhou, China
Combined allergic rhinitis and asthma syndrome (CARAS) involves complex interactions between inflammation and lipid metabolism. This study recruited 90 CARAS patients admitted to the First Affiliated Hospital of Henan University of Chinese Medicine from August 2023 to August 2024 (30 cases each for CARASa, CARASb and CARASc), along with 30 healthy controls (HC). We systematically profiled serum lipidomes across different CARAS stages and examined associations with inflammatory cytokines and mucins. Baseline characteristics were comparable among healthy controls (HC) and CARAS subgroups. CARAS patients in the acute phase (CARASa) exhibited elevated serum-specific IgE and fractional exhaled nitric oxide, indicating heightened allergic sensitization, while pulmonary function remained preserved. Lipidomic analysis revealed a pronounced shift from fatty acids to glycerolipids in CARASa, with upregulation of triglycerides, digalactosyldiacylglycerol, phosphatidylserines, phosphatidylethanolamines, and ceramides. CARASb (chronic persistence) showed persistent dysregulation of sphingomyelins, lysophosphatidylcholines, and membrane lipids, whereas CARASc (clinical remission) exhibited partial recovery with residual alterations in specific lipid classes. Correlation analysis indicated that fatty acid depletion strongly associated with glycerolipid accumulation. Pathway enrichment highlighted stage-dependent disturbances in fatty acid transport, GLP-1/incretin turnover, sphingolipid biosynthesis, and retinoid metabolism, reflecting metabolic-immune crosstalk. Notably, differential lipids (Digalactosyldiacylglycerol, phosphatidylethanolamines and phosphatidylserine) positively correlated with pro-inflammatory cytokines (TNF-α, IL-6) and mucins (MUC1, MUC5AC) in CARASa and CARASb groups. In the CARASc group, these differential lipids showed a negative correlation with pro-inflammatory factors and mucins. These findings define a trajectory of stage-specific lipid metabolic remodeling in CARAS, linking energy metabolism and membrane lipid changes to inflammatory activation and mucin expression, providing potential metabolic biomarkers and therapeutic targets.
1 Introduction
Combined Allergic Rhinitis and Asthma Syndrome (CARAS) is an allergic inflammatory disorder that simultaneously affects both the upper and lower airways, manifesting as a single syndrome across respiratory compartments (1, 2). The notion of a “united airway” underlies this concept: rhinitis and asthma share overlapping immunopathology, risk factors, and often co-occur (3, 4). In fact, intranasal corticosteroids (INCS), which target nasal inflammation, have been explored for beneficial effects on asthma outcomes in CARAS, supporting the concept of shared mucosal inflammation pathways (3).
During its pathogenesis, airway epithelial barriers respond to environmental stimuli by releasing mediators, transmitting signals, and activating innate immune cells, which in turn dysregulate a broad array of effector molecules (5). Indeed, the transition from upper airway inflammation to lower airway hyperresponsiveness may be mediated by systemic “spillover” of inflammatory signals, recruitment of immune effectors, and modulation of distant microenvironments (6, 7). With rising air pollution and global environmental changes, the incidence of CARAS has steadily increased, making it a growing public health concern (4, 8, 9).
Lipids are fundamental to cellular homeostasis, serving as structural components of membranes, signaling molecules, and energy reserves (10, 11). Lipidomics, the comprehensive analysis of lipid species within biological systems, provides a powerful platform to characterize lipid structures, abundance, and dynamics under physiological and pathological conditions (12). Abnormal lipid metabolism has been increasingly implicated in immune regulation and chronic inflammatory diseases (13). In respiratory diseases, lipid mediators such as eicosanoids, sphingolipids, and specialized pro-resolving mediators (SPMs) regulate initiation and resolution of inflammation, bronchomotor tone, and tissue remodeling (14). Recent reviews emphasize how lipid metabolism and immune function are tightly interlinked in chronic lung diseases such as asthma and COPD (15).
Importantly, because CARAS represents a systemic disorder that integrates both allergic rhinitis and asthma, lipidomic profiling may offer new insights into the shared and distinct metabolic alterations underlying this comorbidity. Indeed, in asthma research, lipidomic stratification of induced sputum has been shown to discriminate phenotypes of disease (16). Moreover, plasma lipidomic studies in asthmatic patients have already revealed altered species (e.g. phosphatidylethanolamine, sphingomyelin, triglycerides) correlated with disease severity and immunoglobulin E (IgE) levels (17). On the genomic front, lipid metabolism-related genes have been implicated in asthma pathogenesis and shown to modulate the local immune microenvironment (18).
Despite growing recognition of the immunological and inflammatory aspects of CARAS, the role of systemic lipid metabolism in its initiation, exacerbation, and remission remains poorly defined. A central unanswered question is whether lipidomic alterations can explain disease progression and heterogeneity across clinical stages of CARAS. We hypothesize that distinct lipid metabolic signatures are associated with acute exacerbation, chronic persistence, and remission of CARAS, and that these signatures may help elucidate pathogenic mechanisms and identify candidate biomarkers.
By systematically characterizing serum lipid profiles across disease stages, our study aims to: define lipid alterations linked to CARAS pathophysiology, explore their associations with inflammatory mediators and mucins, provide a metabolic framework for improved diagnosis, subtyping, and therapeutic strategies. This lipidomic perspective may ultimately contribute to a clearer understanding of CARAS as a unified airway syndrome and inform precision medicine approaches for allergic airway diseases.
2 Materials and methods
2.1 Ethical approval and informed consent
This study was approved by the Ethics Committee of the First Affiliated Hospital of Henan University of Traditional Chinese Medicine in accordance with the Helsinki Declaration (2023HL-113-01). Notify patients participating in this study of relevant information and obtain their consent and sign an informed consent form (Supplementary Table S1).
2.2 Research subjects and enrollment process
2.2.1 Research subjects
30 CARASa patients (CARASa group), 30 CARASb patients (CARASb group), 30 CARASc patients (CARASc group) and 30 healthy volunteers (HC group) admitted to the First Affiliated Hospital of Henan University of Traditional Chinese Medicine from August 2023 to August 2024 were selected as the study subjects. Collect basic and main clinical information of three groups of research subjects, including basic information (age, gender, BMI, smoking history and drinking history) and clinical data (blood routine). The basic information and main clinical information of all research subjects are shown in Table 1.
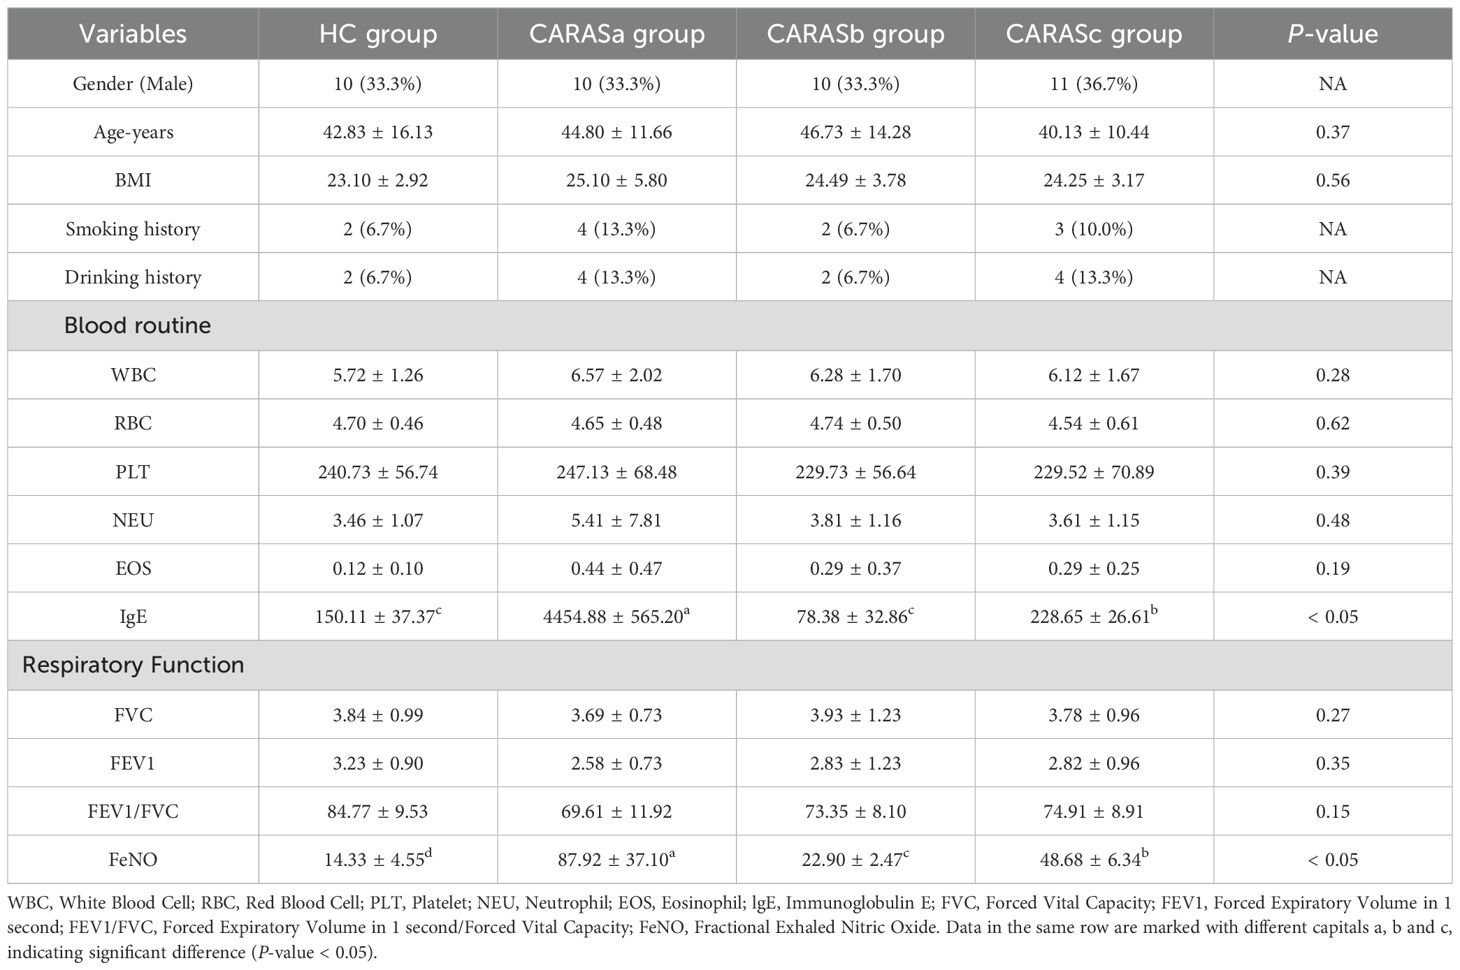
Table 1. Clinical data of patients with combined allergic rhinitis and asthma syndrome at different stages.
2.2.2 Enrollment process
Inclusion criteria: (1) Diagnosis of allergic rhinitis: Met symptom criteria per Allergic Rhinitis and its Impact on Asthma (ARIA) guidelines (nasal itching, sneezing, rhinorrhea, congestion ≥4 days/week for ≥4 weeks); Positive allergen test (skin prick test or serum IgE confirming sensitization to aeroallergens). (2) Diagnosis of bronchial asthma: Met Global Initiative for Asthma (GINA) diagnostic criteria (reversible airflow limitation: post-bronchodilator FEV1 improvement ≥ 12% and absolute increase ≥ 200 mL); Typical asthma symptoms. (3) Temporal association: Clear time-linked exacerbation (e.g., rhinitis episodes triggering/worsening asthma); Consistent allergen sensitization profiles for both conditions. (4) Age: 12–65 years; disease duration of asthma or allergic rhinitis ≥1 year.
Exclusion criteria: (1) Other respiratory/Nasal disorders: Chronic rhinosinusitis with nasal polyps, non-allergic rhinitis (e.g., vasomotor rhinitis); Chronic obstructive pulmonary disease, bronchiectasis, pulmonary fibrosis, active tuberculosis. (2) Systemic comorbidities: Severe cardiac/hepatic/renal failure; Immunodeficiency disorders, active malignancies. (3) Recent interventions: Systemic glucocorticoids or immunosuppressants within 4 weeks; Allergen immunotherapy within 6 months. (4) Special populations: Pregnancy or lactation; Inability to cooperate (e.g., severe cognitive impairment, psychiatric disorders).
2.3 Sample collection
Using sterile disposable vacuum blood collection needles and EDTA-anticoagulated tubes, perform venipuncture for blood collection and immediately conduct complete blood count analysis. Subsequently, collect a portion of the plasma sample for subsequent lipid identification. Collect a peripheral blood sample and isolate peripheral blood mononuclear cells (PBMCs) through Ficoll density gradient centrifugation, followed by cryopreservation in liquid nitrogen for subsequent inflammatory factor (TNF-α and IL-6) mRNA analysis. Collect induced sputum samples for subsequent mucin (MUC5AC and MUC1) mRNA analysis.
2.4 Serum lipidomics analysis
2.4.1 Lipid extraction
Lipids were extracted using a modified Bligh-Dyer method. 100 μL plasma was mixed with 1 mL chloroform-methanol (2:1, v/v) containing internal standards, vortexed for 5 min and centrifuged at 12, 000 ×g for 10 min at 4 °C. The lower organic phase was collected, dried under a nitrogen stream, reconstituted in 100 μL acetonitrile-methanol (6:4, v/v) with 0.1% formic acid, filtered through a 0.22 μm membrane and prepared for instrumental analysis.
2.4.2 Lipid separation and identification (UPLC-MS)
Chromatographic conditions: Waters ACQUITY UPLC BEH C18 column (1.7 μm, 2.1×100 mm); column temperature 45 °C; flow rate 0.4 mL/min; injection volume 2 μL. Mobile phase A: methanol-water (95:5, v/v) with 0.1% formic acid; mobile phase B: acetonitrile-isopropanol (60:40, v/v) with 0.1% formic acid. Gradient program: 0–1 min, 50% B; 1–10 min, 50% to 95% B; 10–12 min, 95% B; 12–13 min, 95% to 50% B; 13–15 min, 50% B. Mass spectrometry conditions: ESI ion source with positive/negative ion switching; capillary voltage 3.0 kV; cone voltage 40 V; desolvation gas temperature 500 °C; flow rate 800 L/h; scan range m/z 100-1500.
2.4.3 Data processing and analysis
Raw data were processed using Waters MassLynx 4.2. Lipid annotation was performed via LipidSearch 4.1, with structural confirmation against the LIPID MAPS database and authentic standards. Quantitation used internal standardization. Differential lipids were screened by multivariate statistics (PLS-DA) with significance thresholds of P < 0.05 and variable importance in projection (VIP) >1.0.
2.5 qRT-PCR
Total RNA was isolated following the manufacturer’s instructions and quantified with a NanoDrop ND-2000 spectrophotometer (Thermo Fisher Scientific, Waltham, MA, USA). The RNA integrity of each sample was evaluated via denaturing agarose gel electrophoresis (Liuyi Biotechnology, Beijing, China). In brief, 1 μg of total RNA was subjected to treatment with an RNase-free DNase I set, after which reverse transcription was conducted using a ReverAid First Strand cDNA Synthesis kit (Thermo Scientific, USA). Subsequently, qRT-PCR analysis was carried out using a LightCycler 96 instrument (Roch, USA) along with SYBR Green master mix (BioRed, USA). The GAPDH gene served as the reference gene for normalization, and the results were calculated using the 2-ΔΔCt method. Detailed information on genes and primers is provided in Supplementary Table S1. For qRT-PCR analysis, three biological replicates were included.
2.6 Statistical analysis
All data were processed using SPSS 24.0 statistical software. One way analysis of variance (ANOVA) was used for data that followed a normal distribution, while non parametric tests (Kruskal Wallis) were used for data that did not follow a normal distribution. P < 0.05 was considered statistically significant.
3 Results
3.1 Clinical characteristics indicate stage-dependent inflammatory activation
The baseline characteristics (age, gender, BMI, smoking and drinking history) were comparable among HC and CARAS subgroups (Table 1). However, CARASa patients displayed significantly elevated serum-IgE and fractional exhaled nitric oxide (FeNO) levels compared with HC and other CARAS subgroups (P < 0.05). These findings suggest stronger allergic sensitization and eosinophilic inflammation during acute exacerbation, whereas pulmonary function parameters (FVC, FEV1/FVC, FEV1%) remained preserved across groups (P > 0.05). This indicates that inflammatory and metabolic dysregulation may precede overt functional decline.
3.2 Global lipidomic profiling reveals a consistent shift from fatty acids to glycerolipids
Lipid compositional analysis revealed a marked redistribution of lipid categories across CARAS subgroups. Compared with HC (FA 22.08%, GL 54.55%), CARASa showed a striking depletion of fatty acids (FA, 7.66%) and expansion of glycerolipids (GL, 84.68%), while CARASb and CARASc demonstrated similar but stage-modulated patterns (Figures 1A-D). OPLS-DA score plots confirmed distinct separation between HC and CARAS groups, with > 95% of samples within Hotelling’s T-squared ellipses (Figures 1E-G). Volcano plots identified progressively larger sets of differentially abundant lipids from CARASa (total: 77, upregulated: 58, downregulated: 19) to CARASb (total: 66, upregulated: 52, downregulated: 19) and CARASc (total: 235, upregulated: 210, downregulated: 25) versus HC (Figures 1H-J). As the lipid annotations were primarily database-driven with limited use of authentic standards, the identifications should be regarded as putative and the quantification as semi-quantitative, underscoring the inherent limitations of untargeted lipidomics.
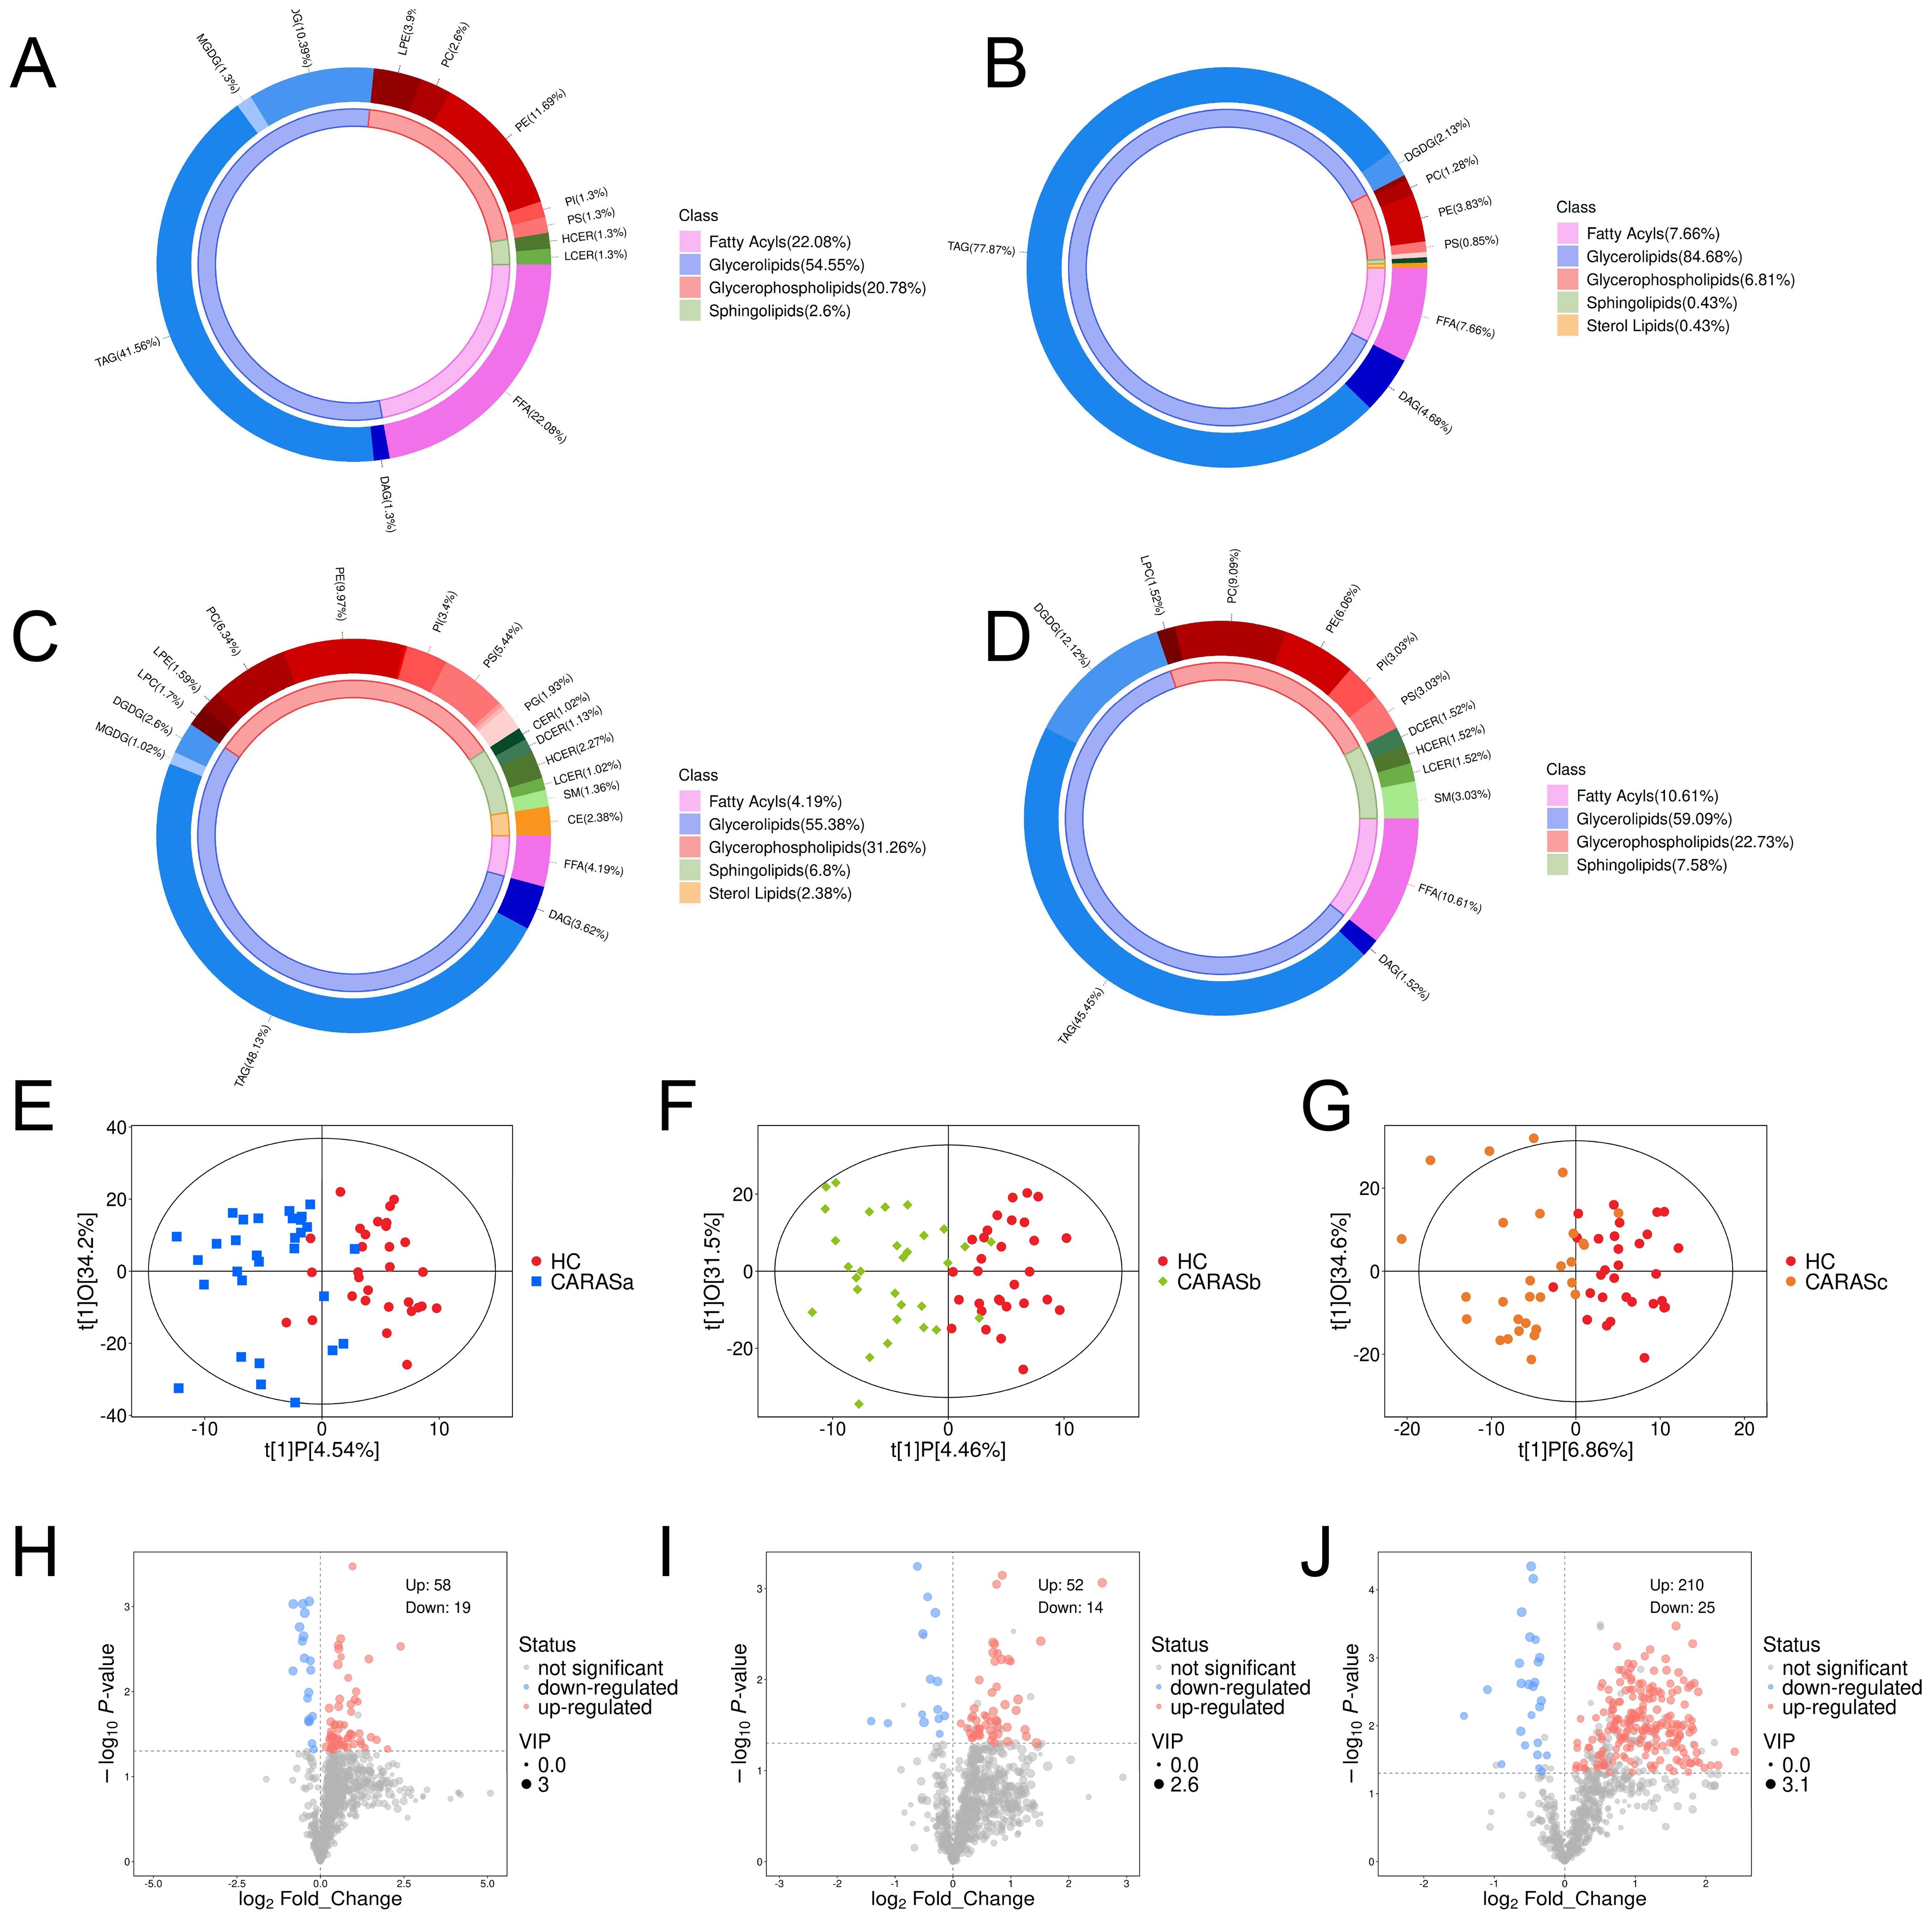
Figure 1. Lipid composition and differential lipid analysis. (A) Plasma lipid composition in HC group. (B) Plasma lipid composition in CARASa group. (C) Plasma lipid composition in CARASb group. (D) Plasma lipid composition in CARASc group. (E) Scatter plot of OPLS-DA scores between CARASa and HC group. (F) Scatter plot of OPLS-DA scores between CARASb and HC group. (G) Scatter plot of OPLS-DA scores between CARASc and HC group. (H) Differential lipid volcano plot between CARASa and HC group. (I) Differential lipid volcano plot between CARASb group and HC group. (J) Differential lipid volcano plot between CARASc and HC group.
3.3 Differential metabolite signatures define stage-specific lipid remodeling
Lipidomic profiling revealed distinct metabolic signatures across different clinical stages of CARAS (Figures 2, 3). Differential lipid analysis and hierarchical clustering further illustrated stage-specific patterns. Specifically, the results demonstrated a clear separation between CARASa (acute exacerbation) and healthy controls, indicating pronounced lipid disturbances during the acute phase. CARASa was characterized by a significant upregulation of lipid species previously implicated in inflammatory responses, including phosphatidylserine (PSs), phosphatidylethanolamines (PEs), ceramides (Hex2Cers), digalactosyldiacylglycerol (DGDGs) and triglycerides (TGs), consistent with acute immune activation and membrane remodeling. CARASb (chronic persistence) still exhibited a marked deviation from controls, though less pronounced than CARASa, persistent dysregulation was observed mainly in sphingomyelins (SMs), lysophosphatidylcholines (LPCs), phosphatidylserine (PSs), phosphatidylethanolamines (PEs) and digalactosyldiacylglycerol (DGDGs), reflecting chronic metabolic imbalance and impaired lipid signaling. In contrast, PEs, PSs, and DGDGs were significantly downregulated in the CARASc group compared with the HC group.
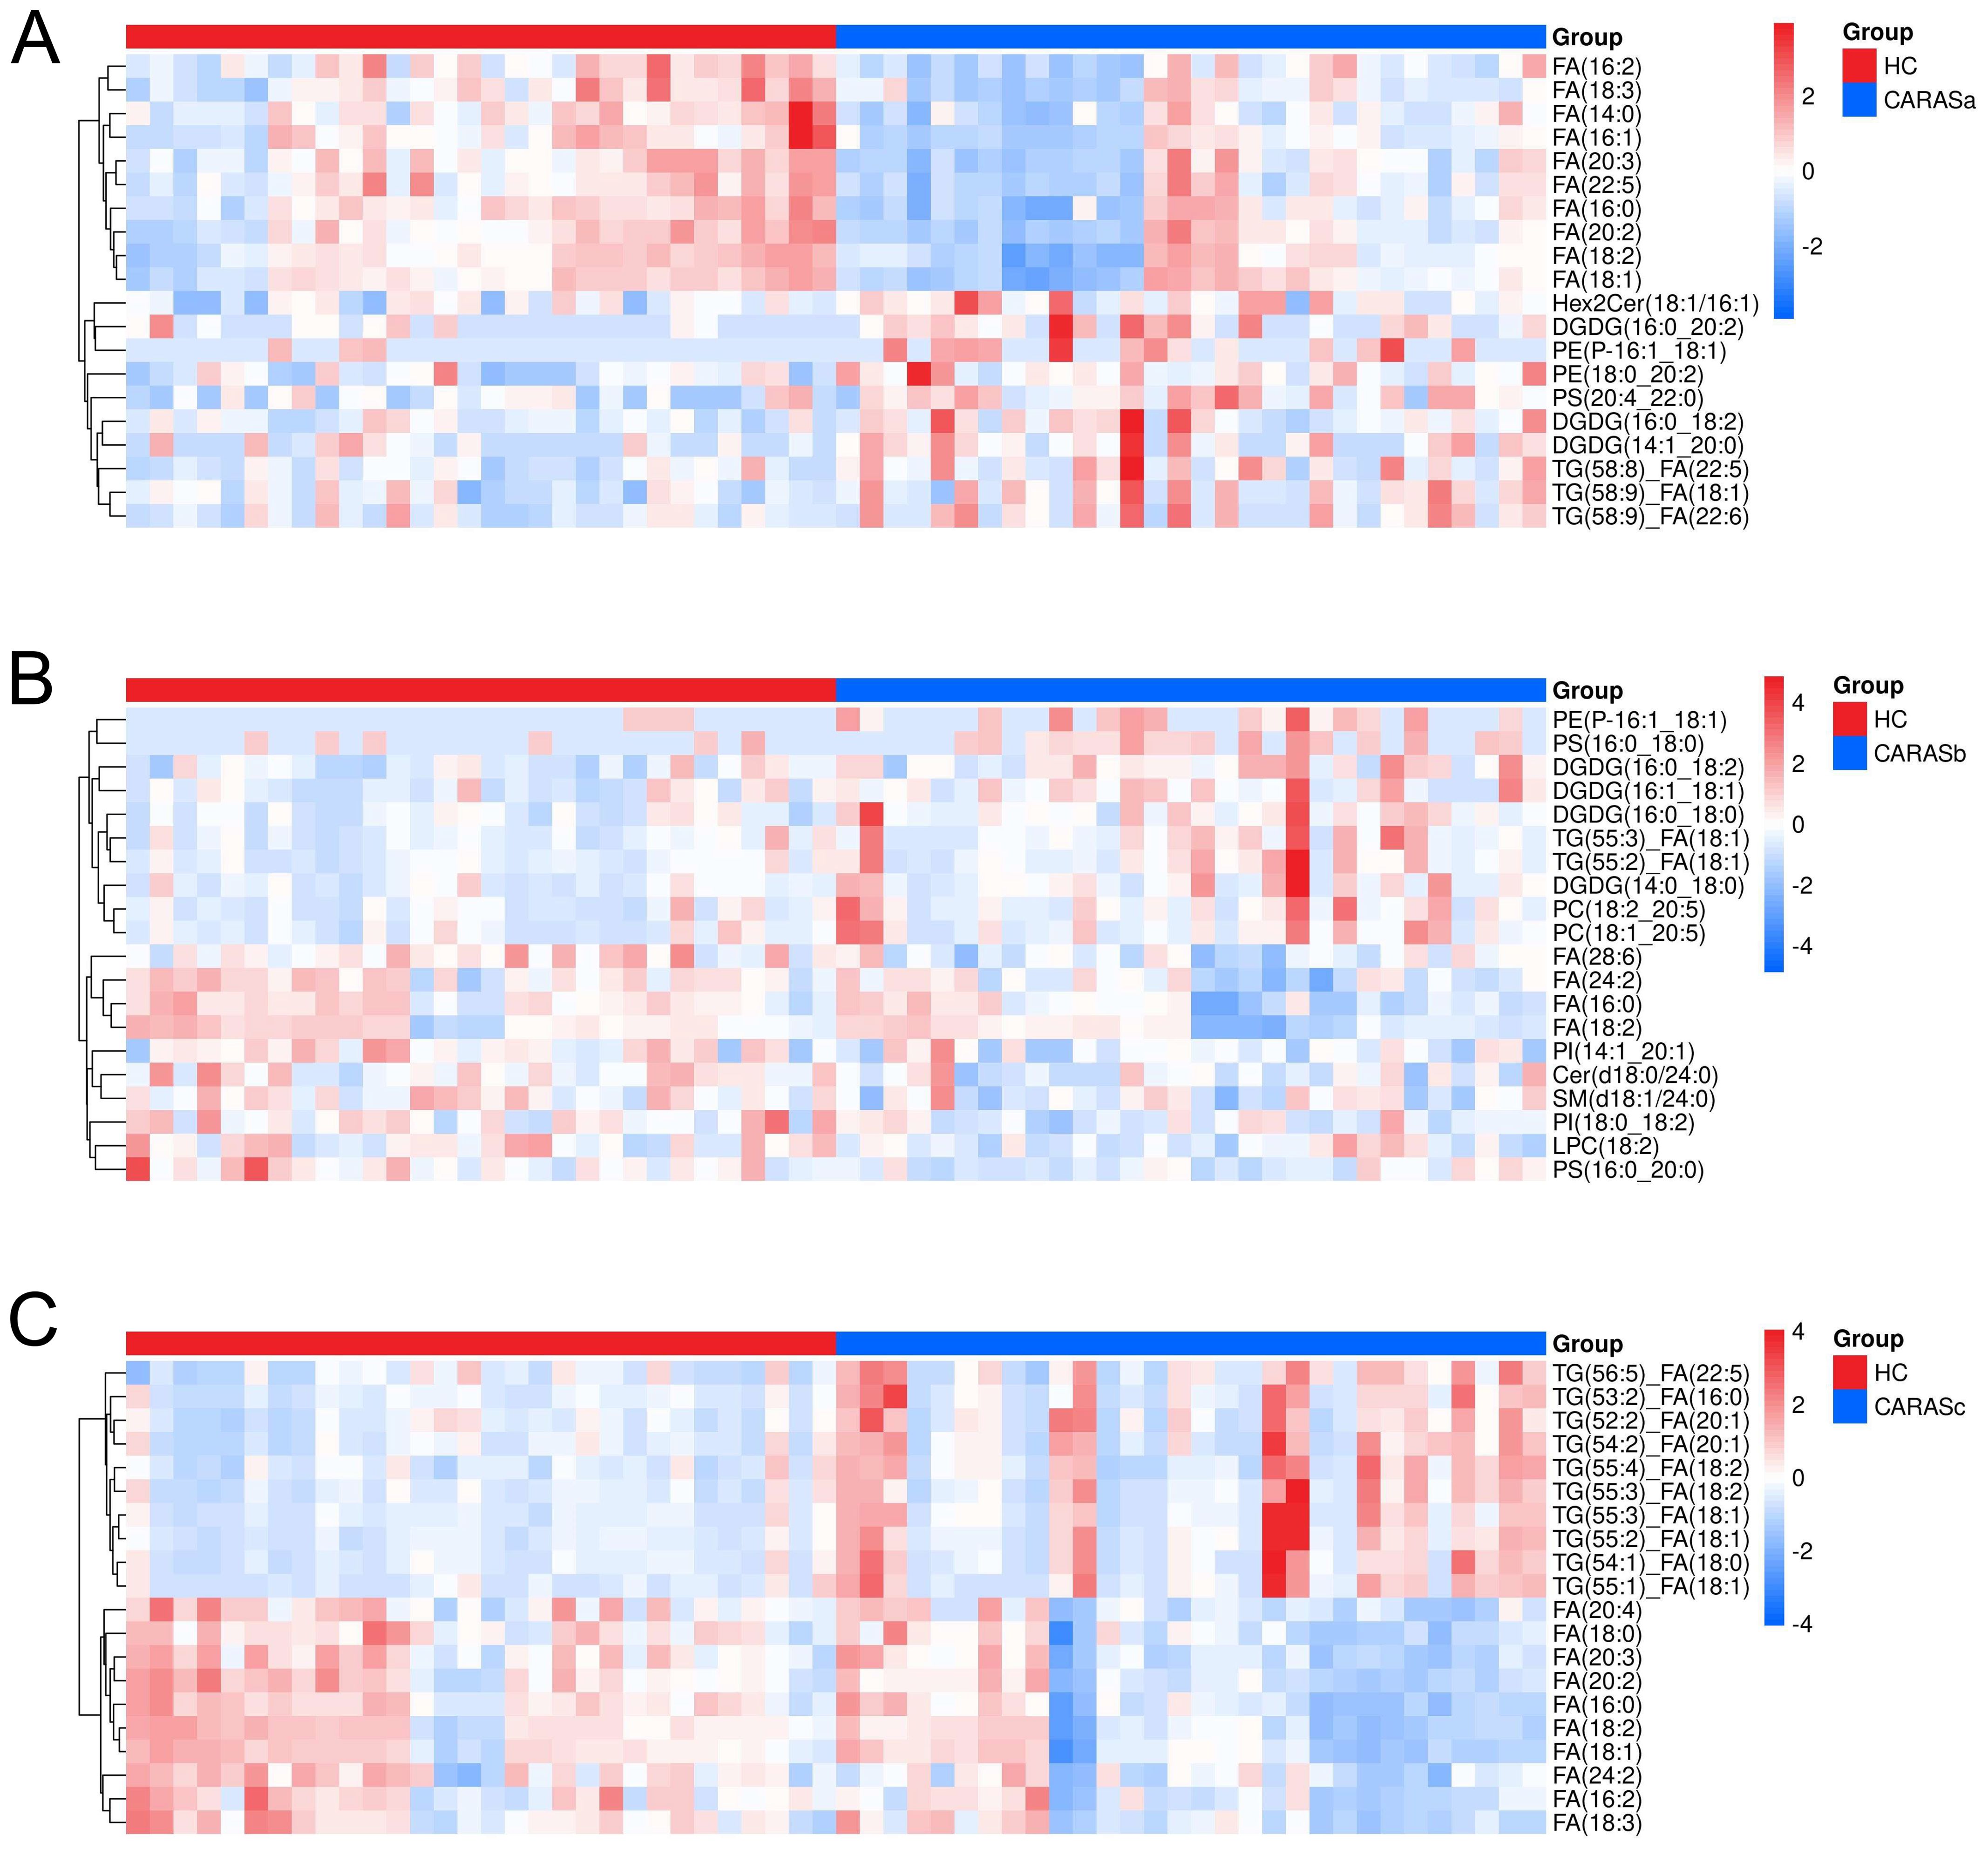
Figure 2. Hierarchical clustering of differential lipids. (A) Hierarchical clustering analysis of differential lipids between CARASa and HC groups (Note: The horizontal axis represents experimental groups, while the vertical axis displays differential metabolites for the group comparison. Color intensity in each tile indicates the relative abundance of the corresponding metabolite: red denotes higher abundance in its respective group, and blue indicates lower abundance). (B) Hierarchical clustering analysis of differential lipids between CARASb and HC groups. (C) Hierarchical clustering analysis of differential lipids between CARASc and HC groups.
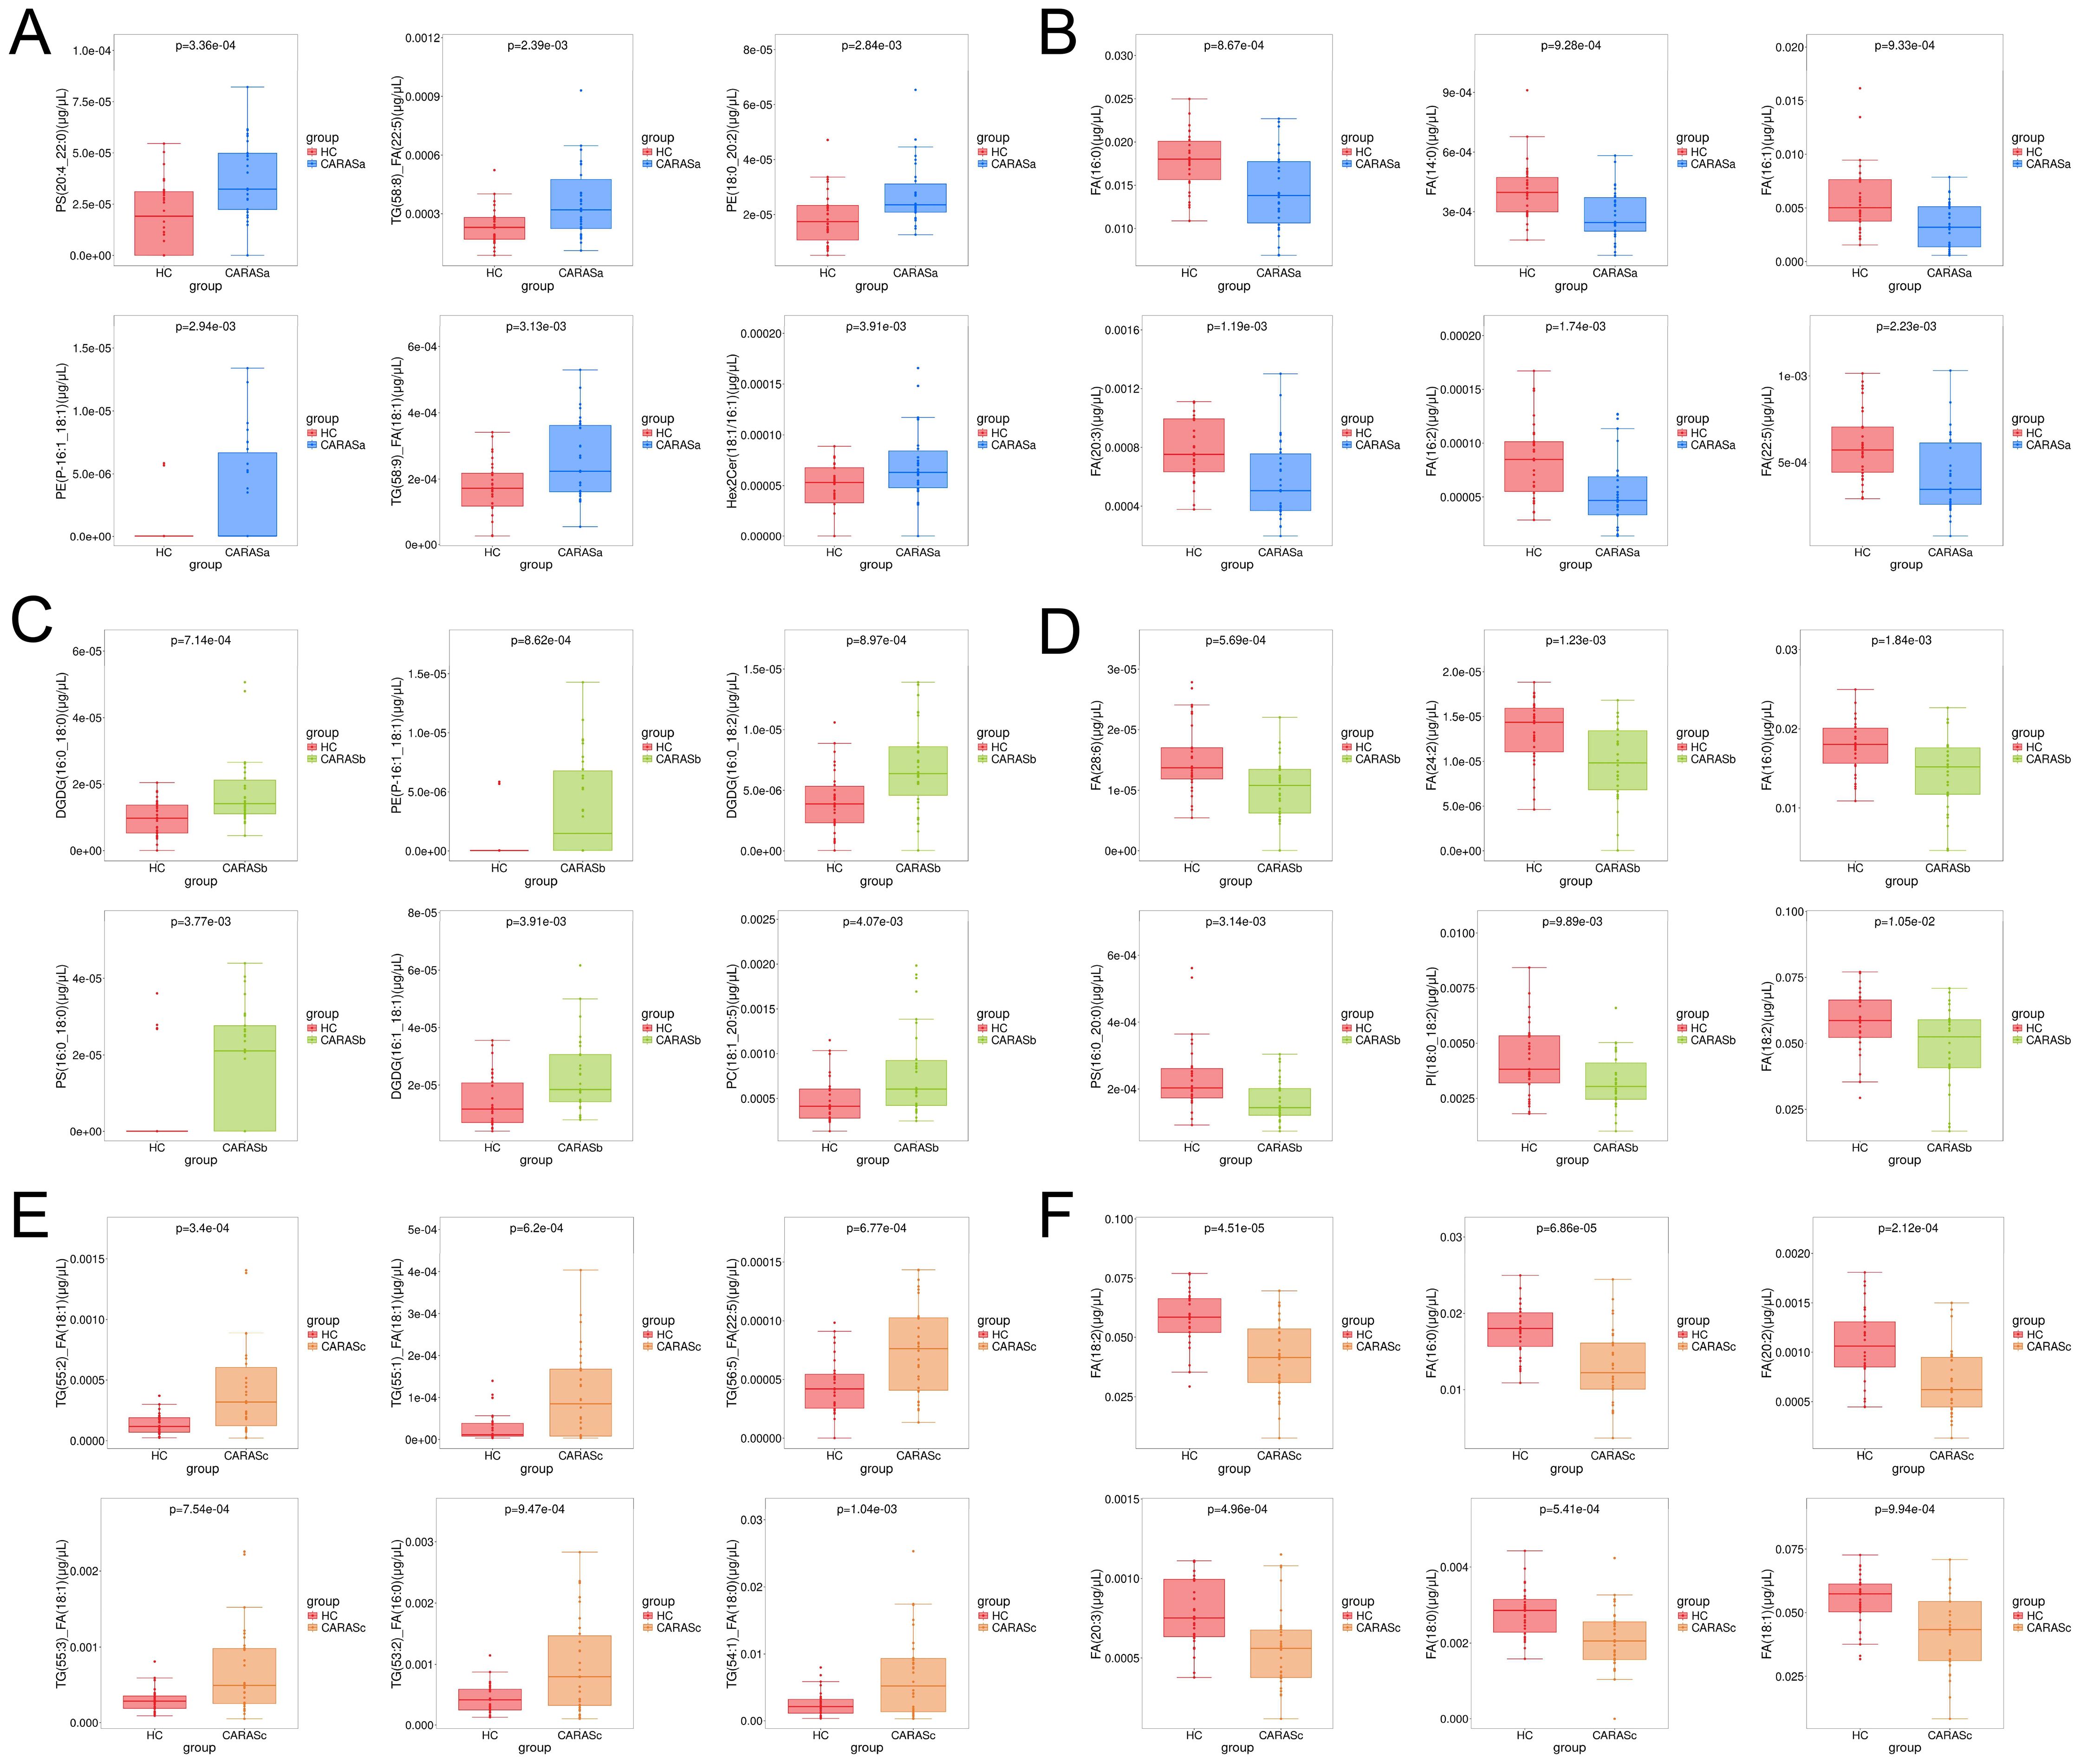
Figure 3. Box-plot analysis of differential lipids. (A) Lipids significantly upregulated in CARASa compared with HC group. (B) Lipids significantly downregulated in CARASa compared with HC group. (C) Lipids significantly upregulated in CARASb compared with HC group. (D) Lipids significantly downregulated in CARASb compared with HC group. (E) Lipids significantly upregulated in CARASc compared with HC group. (F) Lipids significantly downregulated in CARASc compared with HC group.
3.4 Correlation analysis links FA depletion to glycerolipid accumulation
Correlation heatmaps revealed strong negative correlations between FA and several glycerolipids, including DGDG, PE, and TG (Figures 4A-C). Bar plots further confirmed the consistent elevation of these glycerolipids (DGDG, PE, and TG) across CARAS stages relative to HC (Figures 5A-C). Collectively, the data show that depletion of FA pools is accompanied by a metabolic flux shift toward glycerolipid accumulation.
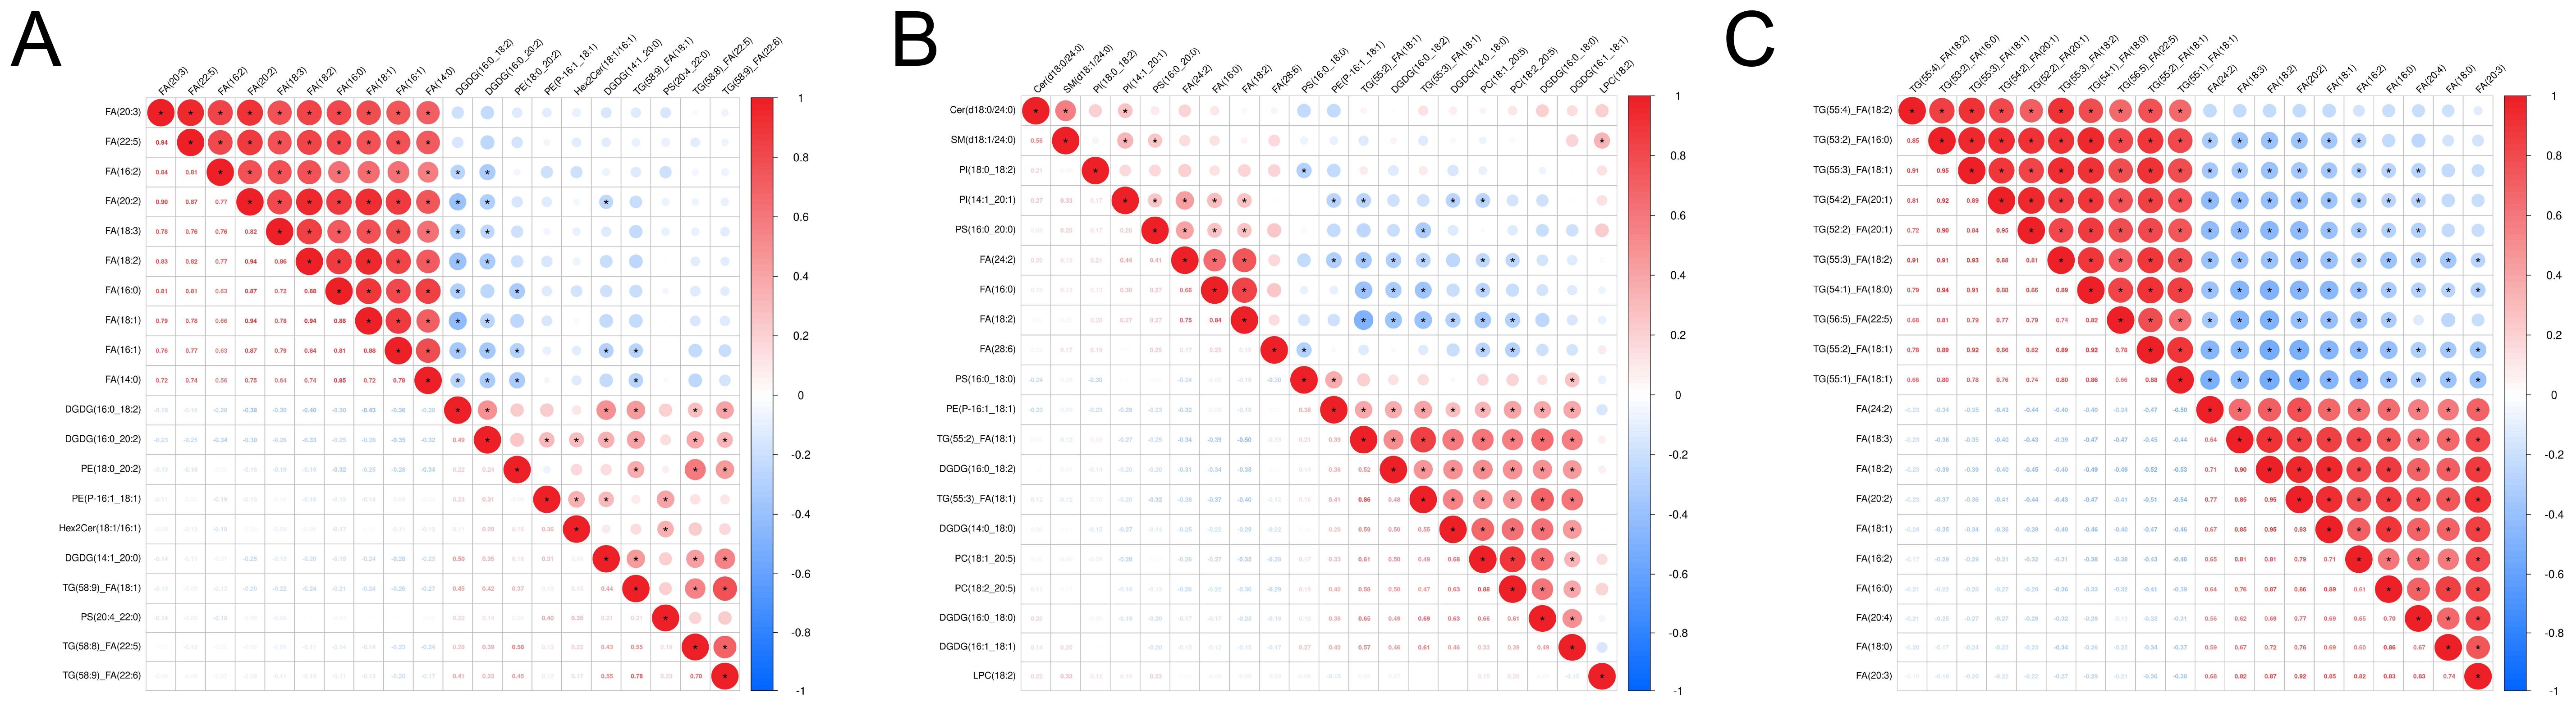
Figure 4. Correlation analysis and lipid composition changes. (A) Correlation analysis heatmap between CARASa and HC group (Note: The horizontal and vertical axes represent differential metabolites for the group comparison. Each color of square indicates the correlation coefficient magnitude between corresponding metabolites: red signifies positive correlation, blue denotes negative correlation, and color intensity scales with correlation strength. Asterisks (*) mark statistically significant correlations P < 0.05). (B) Correlation analysis heatmap between CARASb and HC group. (C) Correlation analysis heatmap between CARASc and HC group.
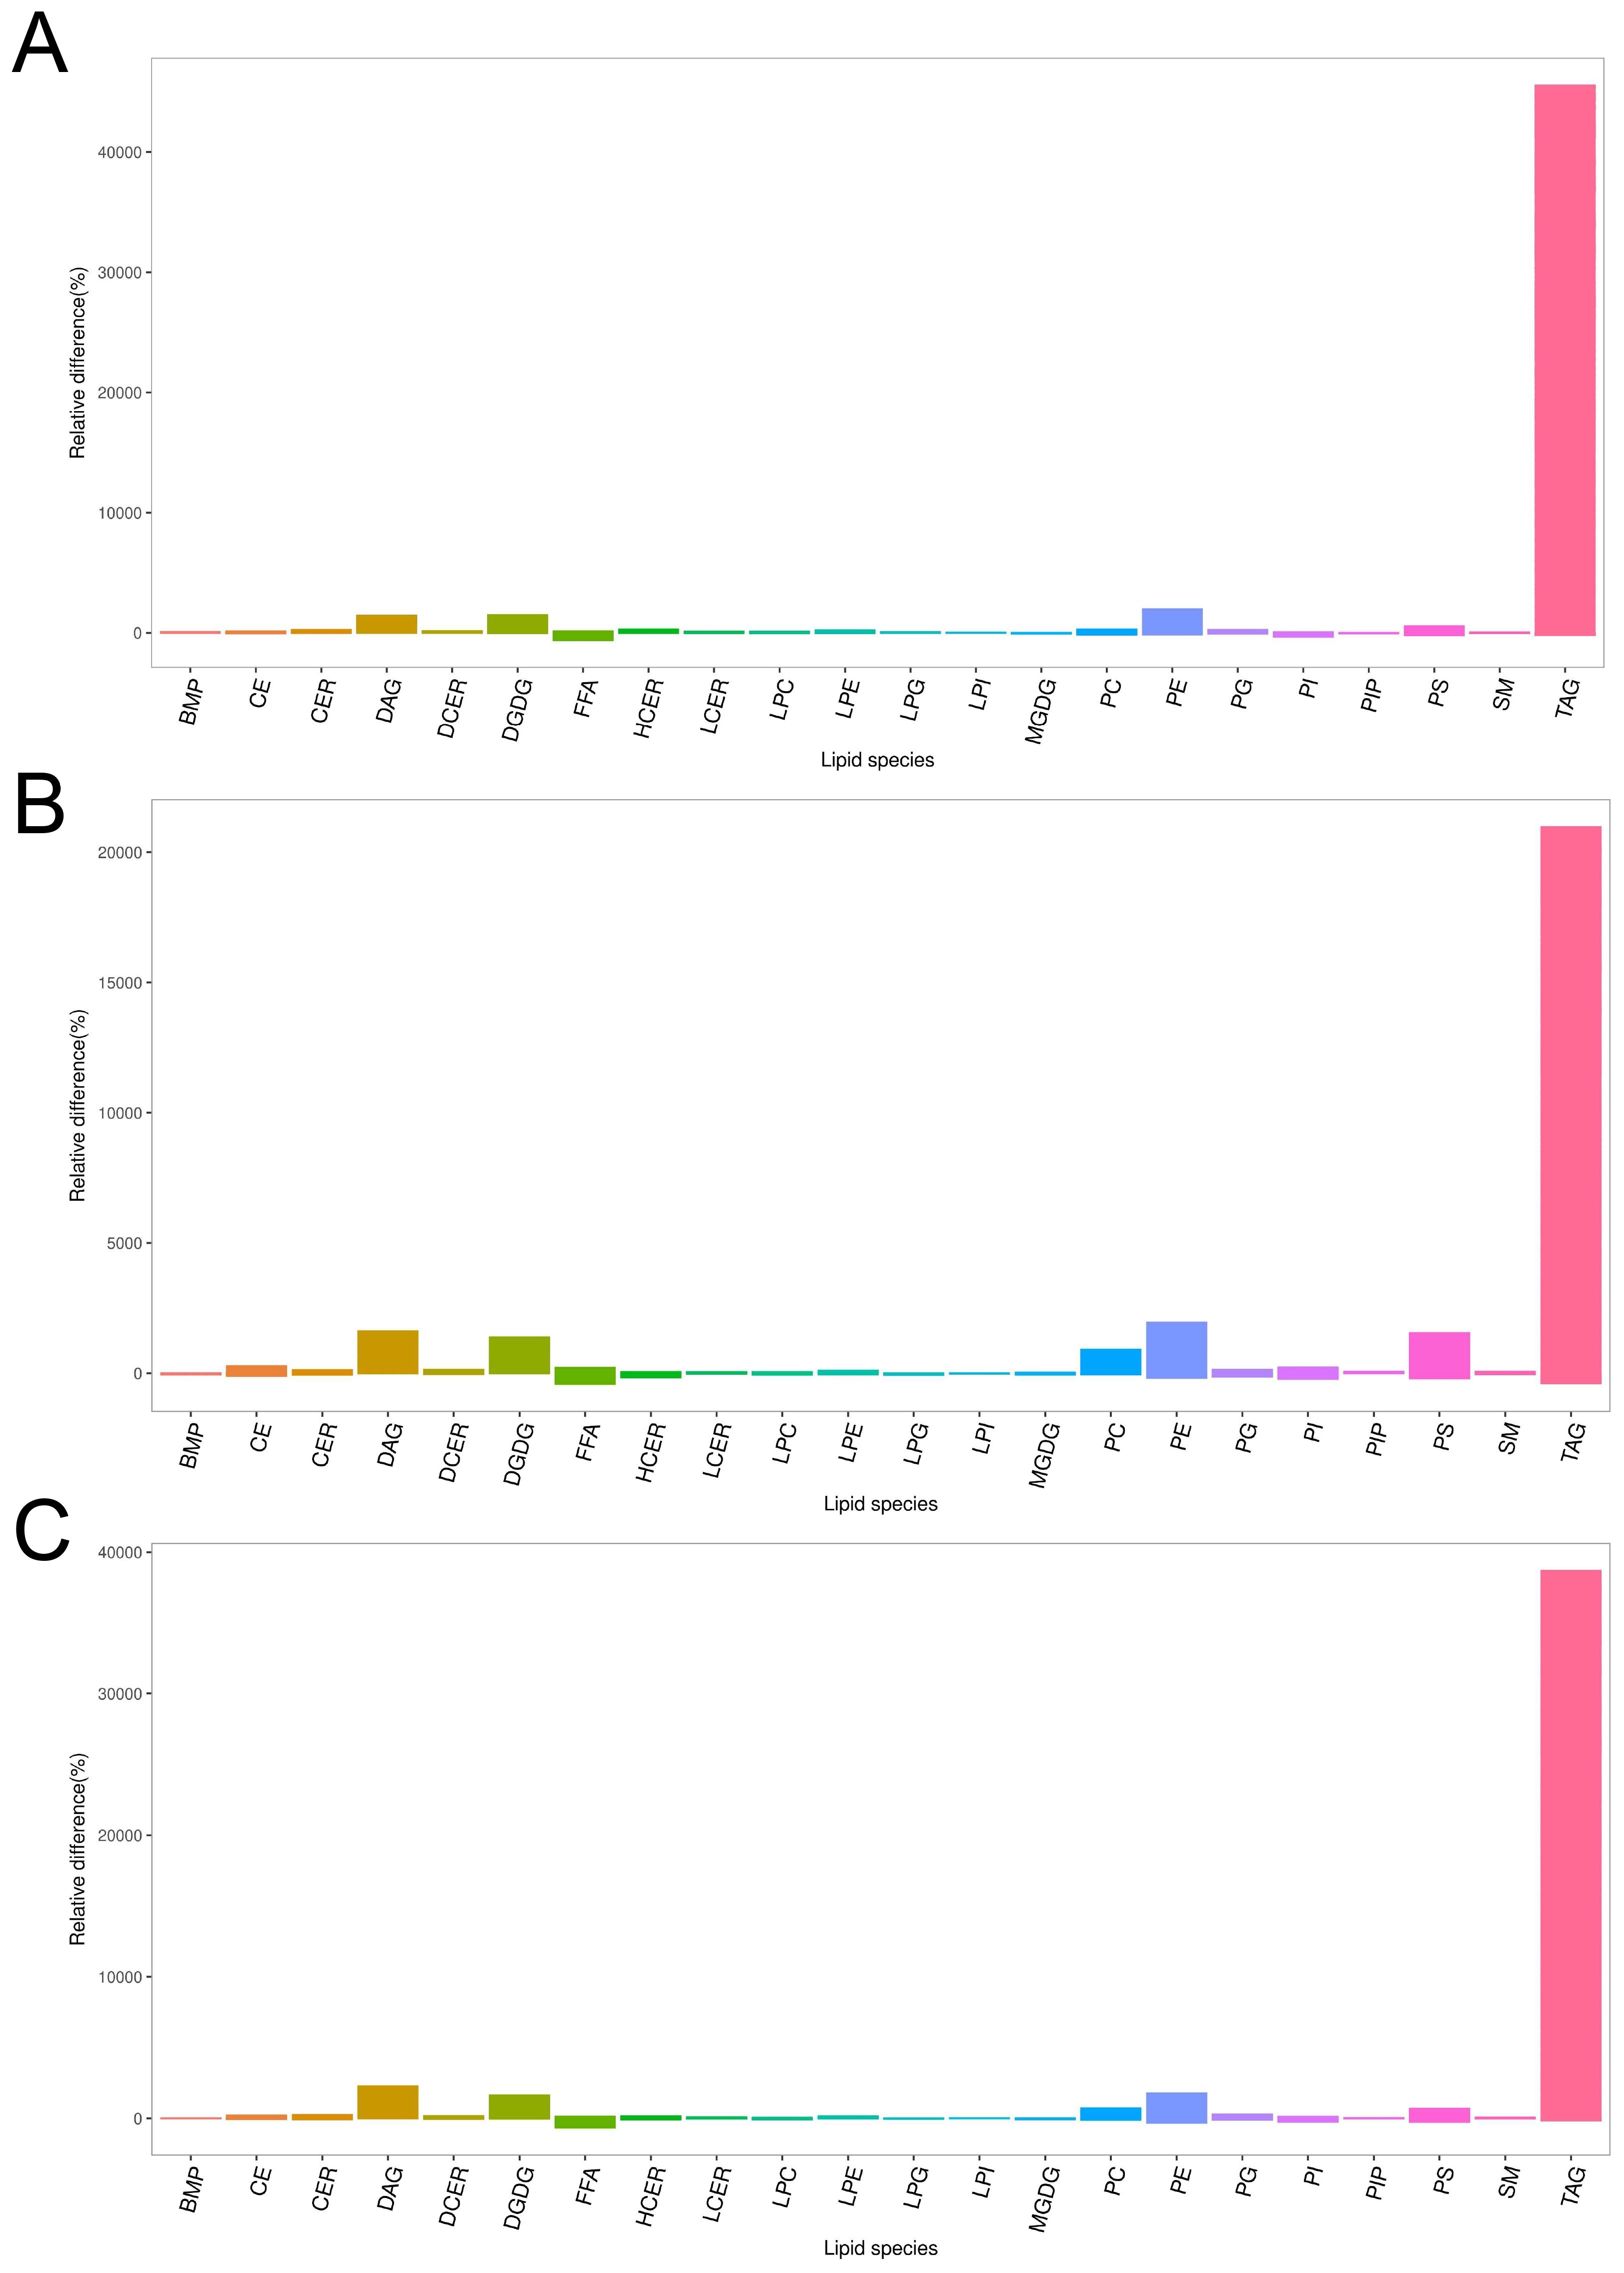
Figure 5. Column chart of lipid composition between CARAS groups and HC group. (A) Column chart of lipid composition between CARASa group and HC group (Note: In the lipidomics bar chart, each bar represents a class of metabolites. The ordinate of the chart represents the percentage of relative change in the content of each substance in the comparison of this group. If the percentage of relative change in content is zero, it indicates that the content of the substance is the same in both groups; a positive percentage of relative change in content indicates that the content of the substance is higher in the CARASa group; a negative percentage of relative change in content indicates that the content of the substance is higher in the HC group. The abscissa of the lipidomics bar chart indicates the classification information of lipids). (B) Column chart of lipid composition between CARASb group and HC group. (C) Column chart of lipid composition between CARASc group and HC group.
3.5 Pathway enrichment highlights lipid transport and metabolic-immune crosstalk
In this study, we systematically analyzed lipid metabolic pathways across different clinical stages of CARAS. Several core pathways, including fatty acid transport and signaling related to free fatty acid receptors and GLP-1/incretin function, remained consistently enriched across all stages. In the acute phase, differential lipids were mainly associated with fatty acid transport, GLP-1 and incretin turnover, omega-9 fatty acid synthesis, and neurotransmitter release, suggesting a tight link between acute inflammation, energy metabolism, and neuroimmune regulation (Figure 6A). During the chronic persistent phase, the metabolic network became more complex, with additional enrichment in linoleic acid metabolism, retinoid cycling and transport, sphingolipid biosynthesis, and fat-soluble vitamin metabolism, reflecting a shift toward structural and vitamin-related disturbances under sustained inflammation (Figure 6B). In the clinical remission phase, the lipid metabolic profile showed partial recovery, however, persistent alterations in sphingolipid and retinoid pathways indicated incomplete normalization (Figure 6C). Collectively, CARAS progression is marked by a transition from acute energy and signaling disruption to broader metabolic imbalance, followed by partial but unresolved recovery.
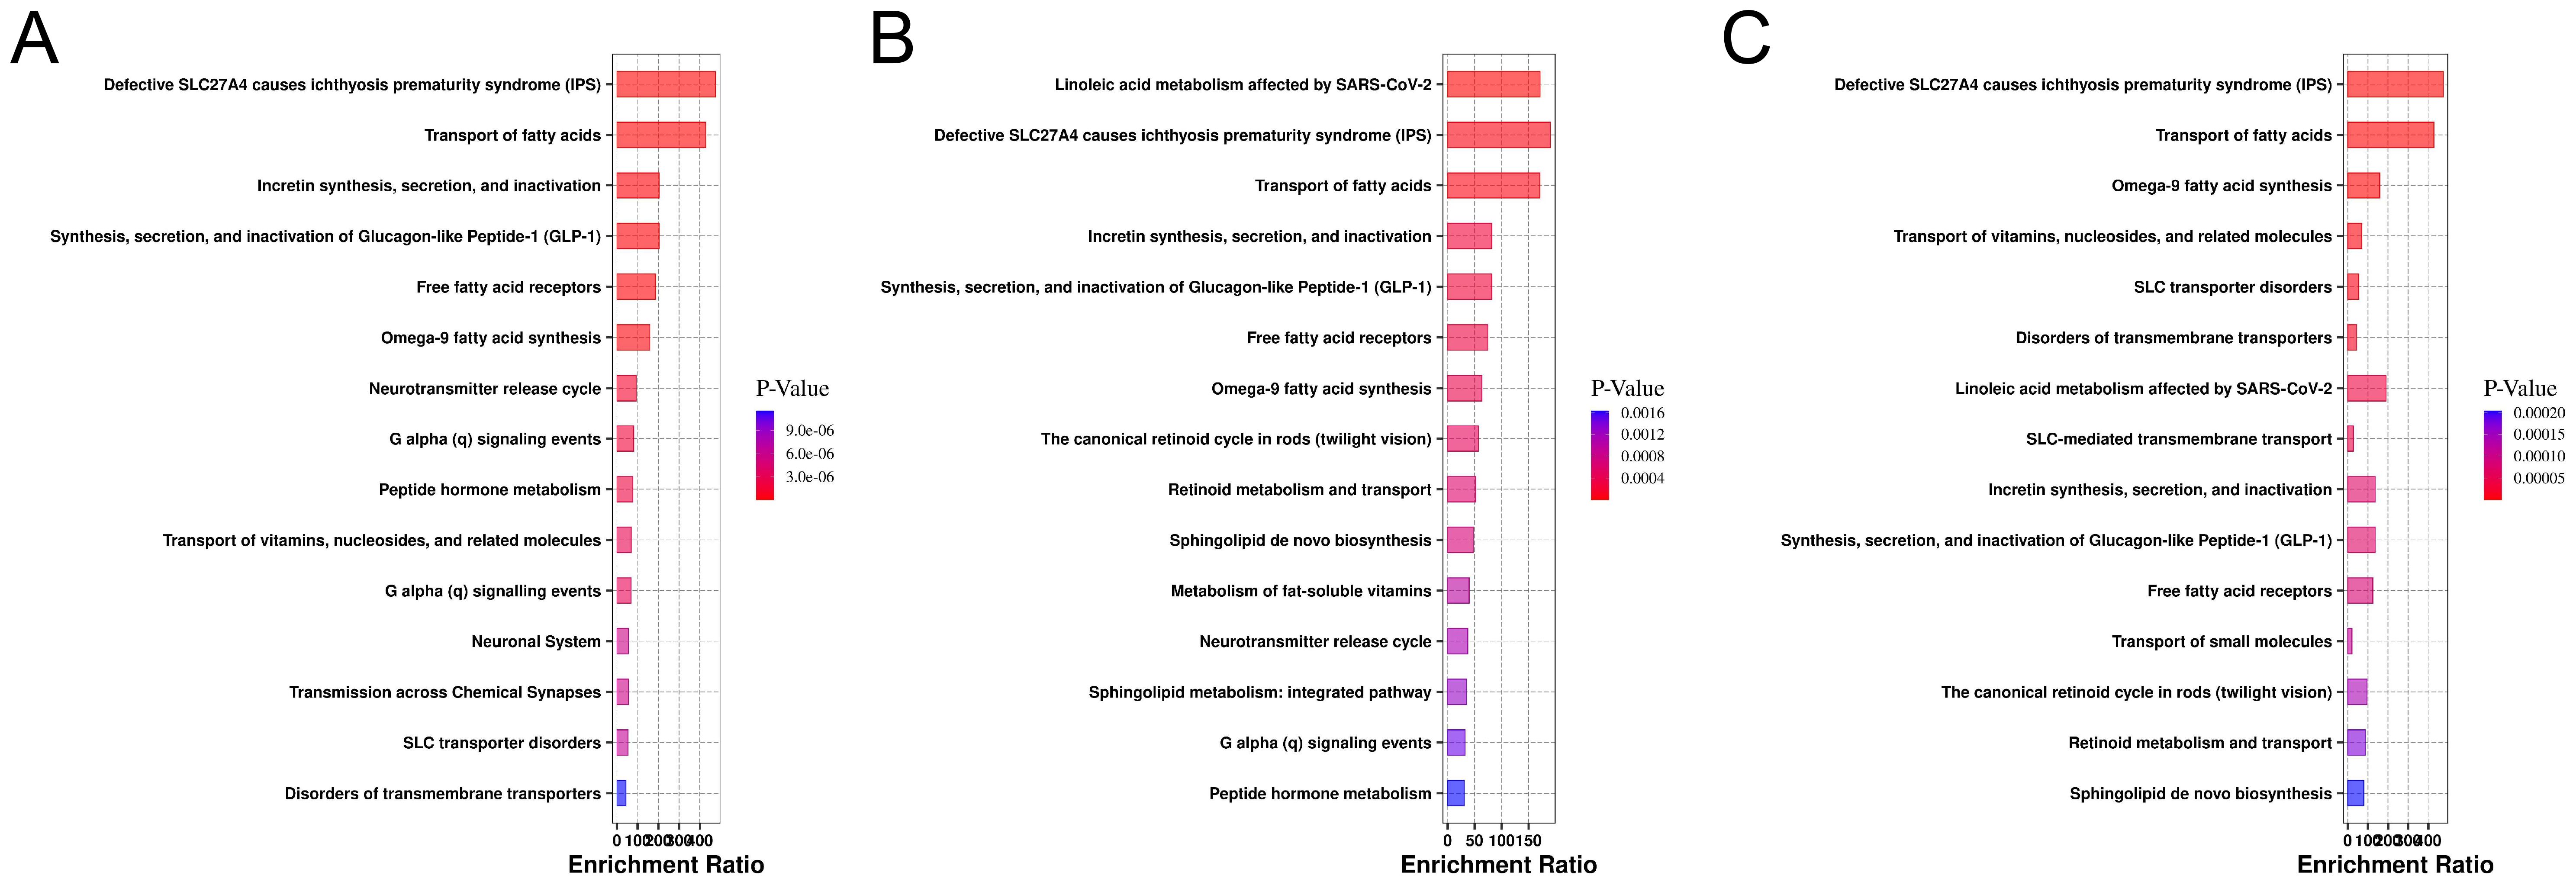
Figure 6. Enrichment analysis of metabolic pathways for differential lipids in the database. (A) Pathway enrichment plot of the CARASa group compared with the HC group (The x-axis represents the enrichment ratio for each pathway, while the y-axis lists metabolic pathway names. Color intensity indicates the magnitude of the P-value: smaller P-values correspond to redder hues, denoting greater enrichment significance). (B) Pathway enrichment plot of the CARASb group compared with the HC group. (C) Pathway enrichment plot of the CARASc group compared with the HC group.
3.6 Correlation analysis reveals associations between differential lipids, inflammatory cytokines, and mucins
qPCR validation demonstrated significant upregulation of pro-inflammatory cytokines (TNF-α, IL-6) in all CARAS groups compared with HC (P < 0.05). Mucin expression (MUC1 and MUC5AC) was significantly increased in CARASa and CARASb (P < 0.05), but not CARASc (P > 0.05) (Figure 7). Correlation analysis of inflammatory factors and mucins with differential lipid profiles showed that in the CARASa and CARASb groups, inflammatory factors (TNF-α and IL-6) and mucins (MUC1 and MUC5AC) were positively correlated with differential lipid profiles (PSs and PEs), but negatively correlated with FAs. In the CARASc group, inflammatory factors (TNF-α and IL-6) and mucins (MUC1 and MUC5AC) were positively correlated only with differential lipid profiles (TGs), but negatively correlated with FAs (Figure 8).
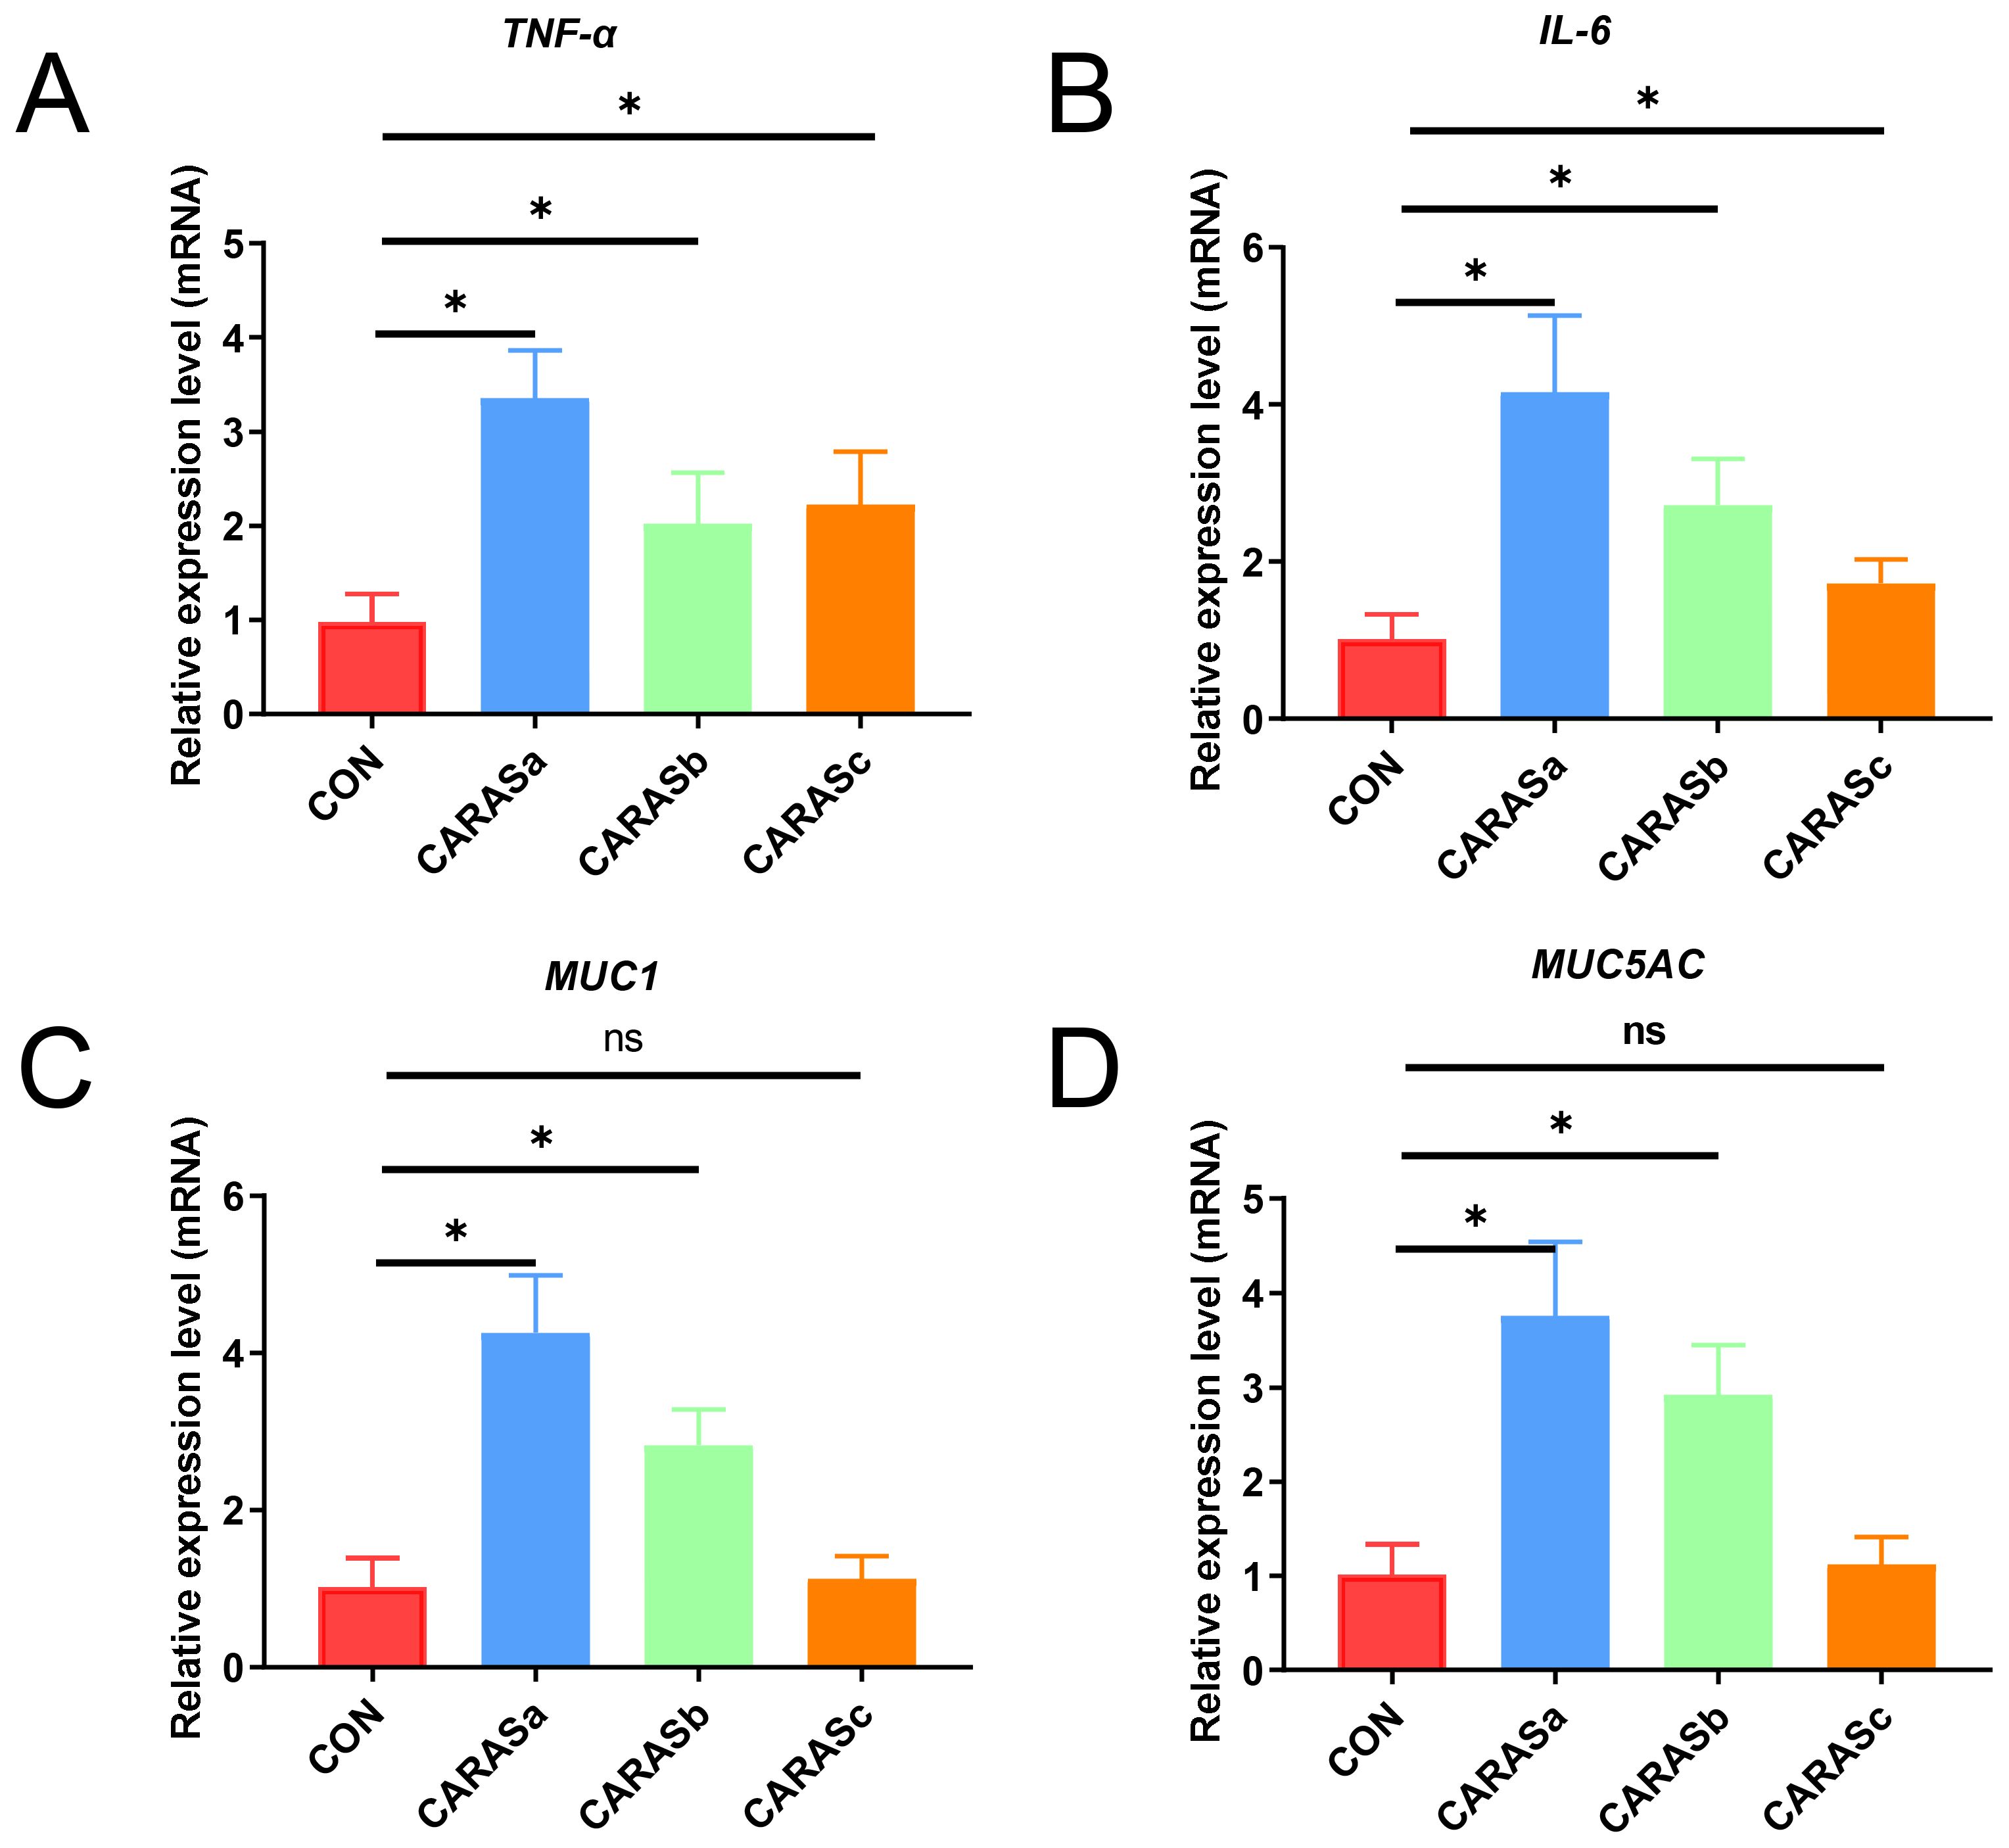
Figure 7. Analysis of relative expression levels of inflammatory cytokines and mucins. (A, B) Relative expression levels of inflammatory cytokines (TNF-α and IL-6) in blood. (C, D) Relative expression levels of mucins (MUC5AC and MUC1) in sputum. n = 10. * P < 0.05 was considered statistically significant. ns P > 0.05 was considered no statistically significant.
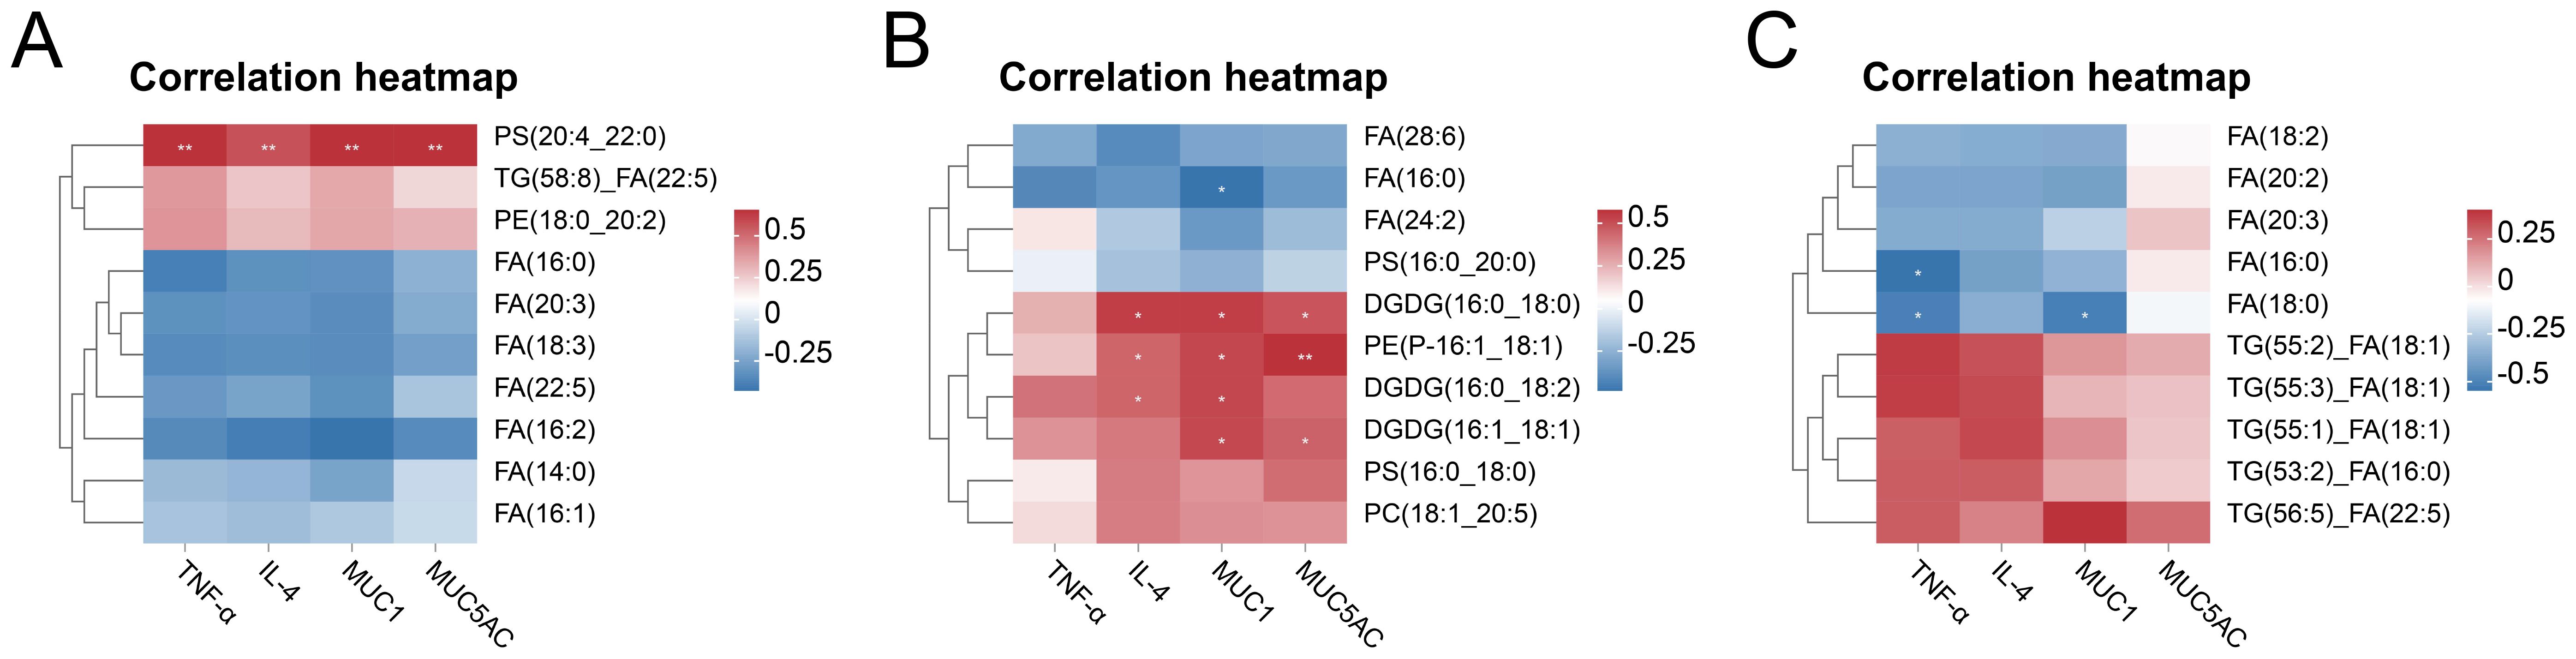
Figure 8. Correlation analysis between differential lipids and inflammatory cytokines, mucins. (A) Correlation heatmap of CARASa group and HC group. (B) Correlation heatmap of CARASb group and HC group. (C) Correlation heatmap of CARASc group and HC group. *P < 0.05 and **P < 0.01 were considered statistically significant.
4 Discussion
In this study, we systematically characterized lipid metabolic alterations in patients with combined allergic rhinitis and asthma syndrome (CARAS) across different clinical stages, and integrated these findings with inflammatory cytokines and mucin expression. Several novel insights were obtained that may contribute to understanding the interplay between lipid metabolism, immune activation, and epithelial barrier dysfunction in CARAS.
The lipidomic analysis revealed that triglycerides (TG), diacylglycerols (DG), and free fatty acids (FA) were significantly elevated in CARAS patients compared with healthy controls. These lipids showed a strong positive correlation with IgE levels and disease severity, suggesting that enhanced lipid mobilization may accompany or even promote allergic inflammation. Similar associations have been reported in allergic rhinitis and asthma cohorts, where TG, DG, and FA concentrations were linked to exacerbation severity and immunoglobulin responses (17, 19). The accumulation of these neutral lipids may contribute to energy demands during chronic inflammation and facilitate the production of pro-inflammatory lipid mediators.
In addition, we observed marked alterations in glycerophospholipids (GPs) and sphingolipids (SPs), particularly phosphatidylethanolamine (PE) and phosphatidylserine (PS). Enrichment analysis indicated significant involvement of the glycerophospholipid and sphingolipid pathways. These pathways have been previously implicated in airway remodeling and immune cell activation in both murine models of allergic sensitization and clinical asthma (16, 20, 21). Given the role of phospholipids in membrane dynamics and signal transduction, disturbances in these pathways may affect epithelial integrity and leukocyte recruitment.
The pathway enrichment analysis revealed stage-dependent perturbations in lipid metabolism that reflect the dynamic immune-metabolic landscape of CARAS. In the acute phase (CARASa), enrichment of fatty acid transport, incretin turnover, and neurotransmitter-related pathways suggests that acute inflammation rapidly reprograms lipid metabolism to support energy demands and neuroimmune communication. This finding is consistent with previous studies showing that acute allergic inflammation promotes fatty acid mobilization and signaling through G-protein-coupled free fatty acid receptors, which in turn amplify cytokine responses and epithelial barrier dysfunction (22–24) (25, 26). In contrast, the chronic phase (CARASb) was characterized by broader metabolic remodeling, with additional enrichment of linoleic acid metabolism, retinoid cycling, and sphingolipid biosynthesis. These pathways are known to modulate epithelial integrity, T helper cell polarization, and mucus hypersecretion during sustained airway inflammation (27–32). Although partial recovery of lipid metabolic balance was observed during remission (CARASc), persistent alterations in sphingolipid and retinoid metabolism suggest that metabolic-immune cross-talk remains incompletely resolved, potentially underlying susceptibility to recurrent exacerbations (29, 33, 34).
Correlation analyses further emphasized the close relationship between lipid alterations, inflammatory mediators, and mucus production. In both acute and chronic phases, phosphatidylserines (PSs) and phosphatidylethanolamines (PEs) positively correlated with pro-inflammatory cytokines (TNF-α, IL-6) and mucins (MUC1, MUC5AC), while free fatty acids (FAs) exhibited an inverse correlation, indicating a pro-inflammatory role of membrane phospholipid remodeling. This aligns with evidence that phospholipid derivatives can act as signaling mediators to activate NF-κB pathways and stimulate mucin expression in airway epithelial cells (26, 34). Interestingly, in the remission phase, triglycerides (TGs) rather than phospholipids were positively associated with inflammatory mediators, suggesting a metabolic shift in the residual inflammatory state (33, 35). These findings indicate that distinct lipid species differentially interact with immune effectors depending on disease stage, highlighting lipid metabolism as both a driver and a potential biomarker of airway inflammation in CARAS.
5 Conclusions
This study systematically characterized lipid metabolic alterations across different clinical stages of combined allergic rhinitis and asthma syndrome (CARAS). Neutral lipids (TGs and DGs) and membrane lipids (GPs, SPs, particularly PS and PE) exhibited significant changes that were associated with disease severity, inflammatory cytokines, and mucin expression. Pathway analysis indicated stage-dependent patterns: acute inflammation was linked with fatty acid mobilization and neuroimmune signaling, chronic persistence showed alterations in linoleic acid, retinoid, and sphingolipid pathways, and remission demonstrated partial metabolic recovery. Associations between specific lipid species and inflammatory mediators were observed, suggesting a potential role of lipid metabolism in immune and epithelial responses. These results provide a detailed reference for understanding lipid-immune-epithelial interactions in CARAS and may inform future studies on stage-specific biomarkers and therapeutic strategies.
Data availability statement
The original contributions presented in the study are included in the article/Supplementary Material, further inquiries can be directed to the corresponding author/s.
Ethics statement
This study was approved by the Ethics Committee of the First Affiliated Hospital of Henan University of Traditional Chinese Medicine in accordance with the Helsinki Declaration (2023HL-113-01). The studies were conducted in accordance with the local legislation and institutional requirements. Written informed consent for participation in this study was provided by the participants’ legal guardians/next of kin.
Author contributions
YS: Data curation, Writing – original draft. YL: Data curation, Writing – original draft. ZC: Methodology, Writing – review & editing. JW: Visualization, Writing – review & editing. SL: Funding acquisition, Resources, Supervision, Writing – review & editing. YX: Funding acquisition, Resources, Supervision, Writing – review & editing.
Funding
The author(s) declare financial support was received for the research and/or publication of this article. This study was supported by the National Science and Technology Major Project of China (2023ZD0506705), National Key Research and Development Program of China (2024YFC3505302), Special Scientific Research of Chinese Medicine in Henan Province (2022JDZX058).
Conflict of interest
The authors declare that the research was conducted in the absence of any commercial or financial relationships that could be construed as a potential conflict of interest.
Generative AI statement
The author(s) declare that no Generative AI was used in the creation of this manuscript.
Any alternative text (alt text) provided alongside figures in this article has been generated by Frontiers with the support of artificial intelligence and reasonable efforts have been made to ensure accuracy, including review by the authors wherever possible. If you identify any issues, please contact us.
Publisher’s note
All claims expressed in this article are solely those of the authors and do not necessarily represent those of their affiliated organizations, or those of the publisher, the editors and the reviewers. Any product that may be evaluated in this article, or claim that may be made by its manufacturer, is not guaranteed or endorsed by the publisher.
Supplementary material
The Supplementary Material for this article can be found online at: https://www.frontiersin.org/articles/10.3389/fimmu.2025.1666214/full#supplementary-material
Glossary
CARAS: Combined Allergic Rhinitis and Asthma Syndrome
ARIA: Allergic Rhinitis and its Impact on Asthma
GINA: Global Initiative for Asthma
KEGG: Kyoto encyclopedia of genes and genomes
PBMCs: Peripheral blood mononuclear cells
ESI: Electric spray ionization source
TNF-α: Tumor necrosis factor α
IL-6: Interleukin
MUC: Mucin
IgE: Immunoglobulin E
FVC: Forced vital capacity
FEV1: Forced expiratory volume in 1 second
FA: Fatty acids
GL: Glycerolipids
GP: Glycerophospholipids
SP: Sphingolipids
ST: Sterol lipids
SL: Saccharolipids
PK: Polyketides
OPLS-DA: Orthogonal projections to latent structures discriminant analysis
DGDG: Digalactosyldiacylglycerol
TG: Triacylglycerol
DAG: Diacylglycerol
PE: Phosphatidylethanolamine
TG: Triacylglycerol
IPS: Ichthyosis prematurity syndrome
References
1. Cong S, Feng Y, and Tang H. Network pharmacology and molecular docking to explore the potential mechanism of urolithin A in combined allergic rhinitis and asthma syndrome. Naunyn Schmiedebergs Arch Pharmacol. (2023) 396:2165–77. doi: 10.1007/s00210-023-02404-w
2. Mao ZD, Liu ZG, Qian Y, Shi YJ, Zhou LZ, Zhang Q, et al. and bioinformatics analysis to reveal potential biomarkers in patients with combined allergic rhinitis and asthma syndrome. J Inflammation Res. (2023) 16:6211–25. doi: 10.2147/JIR.S438758
3. Taramarcaz P and Gibson PG. The effectiveness of intranasal corticosteroids in combined allergic rhinitis and asthma syndrome. Clin Exp Allergy. (2004) 34:1883–9. doi: 10.1111/j.1365-2222.2004.02130.x
4. Paiva Ferreira LKD, Paiva Ferreira L, Monteiro TM, Bezerra GC, Bernardo LR, and Piuvezam MR. Combined allergic rhinitis and asthma syndrome (CARAS). Int Immunopharmacol. (2019) 74:105718. doi: 10.1016/j.intimp.2019.105718
5. Peñaranda A, Gantiva M, Moreno-López S, Peñaranda D, Pérez-Herrera LC, and García E. Factors associated with allergic rhinitis and combined allergic rhinitis and asthma syndrome (CARAS) in children aged 5–18 years undergoing immunotherapy in a tropical low- or middle-income country. Allergol Immunopathol (Madr). (2023) 51:126–32. doi: 10.15586/aei.v51i1.509
6. Braunstahl GJ, Fokkens WJ, Overbeek SE, Kleinjan A, Hoogsteden HC, and Prins JB. Mucosal and systemic inflammatory changes in allergic rhinitis and asthma: a comparison between upper and lower airways. Clin Exp Allergy. (2003) 33:579–87. doi: 10.1046/j.1365-2222.2003.01652.x
7. Liang KL, Jiang RS, Wang RC, Koo M, Chen SC, Huang WC, et al. Upper airway inflammation exacerbates bronchial hyperreactivity in mouse models of rhinosinusitis and allergic asthma. Int Forum Allergy Rhinol. (2013) 3:532–42. doi: 10.1002/alr.21160
8. Luo H, Zhang Q, Niu Y, Kan H, and Chen R. Fine particulate matter and cardiorespiratory health in China: A systematic review and meta-analysis of epidemiological studies. J Environ Sci (China). (2023) 123:306–16. doi: 10.1016/j.jes.2022.04.026
9. Zhang ZQ, Li JY, Guo Q, Li YL, Bao YW, Song YQ, et al. Association between air pollution and allergic upper respiratory diseases: a meta-analysis. Eur Respir Rev. (2025) 34(176):240266. doi: 10.1183/16000617.0266-2024
10. Hannun YA and Obeid LM. Sphingolipids and their metabolism in physiology and disease. Nat Rev Mol Cell Biol. (2018) 19:175–91. doi: 10.1038/nrm.2017.107
11. Olzmann JA and Carvalho P. Dynamics and functions of lipid droplets. Nat Rev Mol Cell Biol. (2019) 20:137–55. doi: 10.1038/s41580-018-0085-z
12. Han X and Gross RW. Global analyses of cellular lipidomes directly from crude extracts of biological samples by ESI mass spectrometry: a bridge to lipidomics. J Lipid Res. (2003) 44:1071–9. doi: 10.1194/jlr.R300004-JLR200
13. Avela HF and Sirén H. Advances in lipidomics. Clin Chim Acta. (2020) 510:123–41. doi: 10.1016/j.cca.2020.06.049
14. Monga N, Sethi GS, Kondepudi KK, and Naura AS. Lipid mediators and asthma: Scope of therapeutics - ScienceDirect. Biochem Pharmacol. (2020) 179:113925. doi: 10.1016/j.bcp.2020.113925
15. Kotlyarov S. Linking lipid metabolism and immune function: new insights into chronic respiratory diseases. Pathophysiology. (2025) 32(2):26. doi: 10.3390/pathophysiology32020026
16. Brandsma J, Schofield JPR, Yang X, Strazzeri F, Barber C, Goss VM, et al. Stratification of asthma by lipidomic profiling of induced sputum supernatant. J Allergy Clin Immunol. (2023) 152:117–25. doi: 10.1016/j.jaci.2023.02.032
17. Jiang T, Dai L, Li P, Zhao J, Wang X, An L, et al. Lipid metabolism and identification of biomarkers in asthma by lipidomic analysis. Biochim Biophys Acta Mol Cell Biol Lipids. (2021) 1866:158853. doi: 10.1016/j.bbalip.2020.158853
18. Jia Y, Wang H, Ma B, Zhang Z, Wang J, Wang J, et al. Lipid metabolism-related genes are involved in the occurrence of asthma and regulate the immune microenvironment. BMC Genomics. (2024) 25:129. doi: 10.1186/s12864-023-09795-3
19. Li T, Dou Y, Ji J, Chen H, Zhu S, Wang M, et al. Lipidomics reveals the serum profiles of pediatric allergic rhinitis and its severity. BioMed Chromatogr. (2024) 38:e5927. doi: 10.1002/bmc.5927
20. Wang S, Tang K, Lu Y, Tian Z, Huang Z, Wang M, et al. Revealing the role of glycerophospholipid metabolism in asthma through plasma lipidomics. Clin Chim Acta. (2021) 513:34–42. doi: 10.1016/j.cca.2020.11.026
21. Turi KN, Michel CR, Manke J, Doenges KA, Reisdorph N, and Bauer AK. Multi-omics analysis of lung tissue demonstrates changes to lipid metabolism during allergic sensitization in mice. Metabolites. (2023) 13(3):406. doi: 10.3390/metabo13030406
22. Gohy ST, Hupin C, Pilette C, and Ladjemi MZ. Chronic inflammatory airway diseases: the central role of the epithelium revisited. Clin Exp Allergy. (2016) 46:529–42. doi: 10.1111/cea.12712
23. Kimura I, Ichimura A, Ohue-Kitano R, and Igarashi M. Free fatty acid receptors in health and disease. Physiol Rev. (2020) 100:171–210. doi: 10.1152/physrev.00041.2018
24. Fernández-Gallego N, Castillo-González R, Moreno-Serna L, García-Cívico AJ, Sánchez-Martínez E, López-Sanz C, et al. Allergic inflammation triggers dyslipidemia via IgG signalling. Allergy. (2024) 79:2680–99. doi: 10.1111/all.16187
25. Angelis N, Porpodis K, Zarogoulidis P, Spyratos D, Kioumis I, Papaiwannou A, et al. Airway inflammation in chronic obstructive pulmonary disease. J Thorac Dis. (2014) 6 Suppl 1:S167–172. doi: 10.1016/S0091-6749(03)02012-8
26. Seo EH, Lee SH, Choi BY, Oh CS, and Kim JK. Exogenous lipoxin A4 attenuates IL4-induced mucin expression in human airway epithelial cells. Int J Med Sci. (2023) 20:406–14. doi: 10.7150/ijms.79525
27. Chen H, Li Z, Dong L, Wu Y, Shen H, and Chen Z. Lipid metabolism in chronic obstructive pulmonary disease. Int J Chron Obstruct Pulmon Dis. (2019) 14:1009–18. doi: 10.2147/COPD.S196210
28. Brennan E, Kantharidis P, Cooper ME, and Godson C. Pro-resolving lipid mediators: regulators of inflammation, metabolism and kidney function. Nat Rev Nephrol. (2021) 17:725–39. doi: 10.1038/s41581-021-00454-y
29. Wang Y, Chang C, Tian S, Wang J, Gai X, Zhou Q, et al. Differences in the lipid metabolism profile and clinical characteristics between eosinophilic and non-eosinophilic acute exacerbation of chronic obstructive pulmonary disease. Front Mol Biosci. (2023) 10:1204985. doi: 10.3389/fmolb.2023.1204985
30. Yazici D, Ogulur I, Pat Y, Babayev H, Barletta E, Ardicli S, et al. The epithelial barrier: The gateway to allergic, autoimmune, and metabolic diseases and chronic neuropsychiatric conditions. Semin Immunol. (2023) 70:101846. doi: 10.1016/j.smim.2023.101846
31. Yoshida K, Morishima Y, Ishii Y, Mastuzaka T, Shimano H, and Hizawa N. Abnormal saturated fatty acids and sphingolipids metabolism in asthma. Respir Investig. (2024) 62:526–30. doi: 10.1016/j.resinv.2024.04.006
32. Liang Q, Wang Y, and Li Z. Lipid metabolism reprogramming in chronic obstructive pulmonary disease. Mol Med. (2025) 31:129. doi: 10.1186/s10020-025-01191-9
33. Barochia AV, Gordon EM, Kaler M, Cuento RA, Theard P, Figueroa DM, et al. High density lipoproteins and type 2 inflammatory biomarkers are negatively correlated in atopic asthmatics. J Lipid Res. (2017) 58:1713–21. doi: 10.1194/jlr.P077776
34. Cheon YH, Kim MS, Kim JY, Kim DH, Han SY, and Lee JH. Eupatilin downregulates phorbol 12-myristate 13-acetate-induced MUC5AC expression via inhibition of p38/ERK/JNK MAPKs signal pathway in human airway epithelial cells. Korean J Physiol Pharmacol. (2020) 24:157–63. doi: 10.4196/kjpp.2020.24.2.157
Keywords: allergic inflammation, allergic syndrome, asthma, lipidomics, mucin
Citation: Shi Y, Li Y, Cheng Z, Wang J, Li S and Xie Y (2025) Study on dynamic alterations of plasma lipid profiles during disease progression in combined allergic rhinitis and asthma syndrome based on lipidomics. Front. Immunol. 16:1666214. doi: 10.3389/fimmu.2025.1666214
Received: 15 July 2025; Accepted: 09 October 2025;
Published: 22 October 2025.
Edited by:
Tanima Bose, Ludwig Maximilian University of Munich, GermanyReviewed by:
Rebecca Kelley Martin, Virginia Commonwealth University, United StatesYufan Zheng, National Institutes of Health (NIH), United States
Copyright © 2025 Shi, Li, Cheng, Wang, Li and Xie. This is an open-access article distributed under the terms of the Creative Commons Attribution License (CC BY). The use, distribution or reproduction in other forums is permitted, provided the original author(s) and the copyright owner(s) are credited and that the original publication in this journal is cited, in accordance with accepted academic practice. No use, distribution or reproduction is permitted which does not comply with these terms.
*Correspondence: Suyun Li, bGlzdXl1bjIwMDBAMTI2LmNvbQ==; Yang Xie, eGlleWFuZ2huQDE2My5jb20=
†These authors have contributed equally to this work