 Benjamin N. Woerner1
 Joseph Abbo1Allison Wang1,2Melanie K. Donahue1,2,3Judy Hines1
 Jessica O’Konek1,4
 Simon P. Hogan1,2,5
 James R. Baker Jr1,4,5
 Charles F. Schuler IV1,2,3*
- 1Mary H. Weiser Food Allergy Center, University of Michigan, Ann Arbor, MI, United States
- 2Graduate Program in Immunology, University of Michigan, Ann Arbor, MI, United States
- 3Division of Allergy and Clinical Immunology, Department of Internal Medicine, University of Michigan, Ann Arbor, MI, United States
- 4Michigan Nanotechnology Institute for Medicine and Biological Sciences, University of Michigan, Ann Arbor, MI, United States
- 5Department of Pathology, University of Michigan, Ann Arbor, MI, United States
Background: An increase in transepidermal water loss (TEWL) presages food anaphylaxis in allergic humans during oral food challenges. We sought to determine whether similar TEWL changes occur in mouse food anaphylaxis models.
Methods: Using a Tewameter™ Nano, a mouse-compatible device, TEWL measurements were conducted on the ear, paw, and abdomen of BALB/c mice. Because of the highest measurement reproducibility, the ear was selected for use in the study. Baseline TEWL measurements under varied conditions were evaluated. Histamine injections were given to evaluate a non-IgE-mediated reaction. Two IgE-based models of food anaphylaxis were utilized: (1) passive systemic anaphylaxis (PSA) with dinitrophenyl (DNP)-IgE sensitization and DNP-albumin challenge, and (2) active systemic anaphylaxis (ASA) with ovalbumin-alum immunization followed by ovalbumin challenges. Core temperature, reaction severity score, diarrhea, and TEWL were recorded. MCPT-1 was measured as a mast cell activation correlate.
Results: TEWL was reproducibly measured on the ear (17.7 g/m2/h) and showed no baseline differences with time, sex, device used, oral gavage, or intravenous injection. TEWL increased during histamine (5.73 g/m2/h), PSA (3.46 g/m2/h), and ASA (3.61 g/m2/h) challenges. TEWL correlated with reaction severity across conditions and with core temperature change in PSA and ASA challenges. TEWL increased significantly for all models, whereas other markers such as reaction severity and temperature change varied by model utilized.
Conclusion: TEWL is reliably measured on the mouse ear. TEWL increased under varied reaction conditions, and the stimulus used did not alter results. TEWL offers a novel, real-time, objective, and noninvasive measure of murine food anaphylaxis that corresponds to human pathophysiology.
Introduction
Food allergy (FA) in the United States is an increasingly prevalent illness affecting nearly 8% of children and 10% of adults (1–3). Food anaphylaxis is the severe and sometimes fatal outcome of food allergen exposure and is responsible for a high healthcare burden (4–8). FA diagnosis remains problematic given that traditional testing methods, such as food-specific skin and blood IgE testing, provide poor positive predictive values and fail to predict severity or threshold of reactivity (9–11). The oral food challenge (OFC) remains the criterion standard for the diagnosis of FA despite the inherent risk of anaphylaxis (6, 7, 12). Clinical diagnosis is required to identify the anaphylaxis endpoint and relies entirely upon physician observation since there is no approved measuring device, which increases costs, uncertainty, and perceived risk (9, 13). Early diagnosis and subsequent treatment of anaphylaxis can reduce reaction severity and symptoms (14).
Transepidermal water loss (TEWL) is a well-established measure of net skin barrier permeability that has been used in the assessment of dermatological conditions and medications. TEWL is measured by using skin contact probes that are painless and noninvasive and can give real-time feedback continuously over multiple hours (15, 16). Our group has previously shown that an increase in TEWL precedes food anaphylaxis during clinical OFCs and may provide advanced warning for anaphylaxis (17). TEWL has yet to be evaluated in murine models of food anaphylaxis, and prior studies offer varied methods for TEWL measurement in mice (18–22). The sole existing objective measure for food anaphylaxis in murine models is rectal temperature, which is invasive and carries a risk of perforation (23). A noninvasive measure, such as TEWL, would be a useful alternative for defining murine anaphylaxis severity given the key role of murine models as pre-clinical models in defining mechanisms, diagnostics, and therapeutics in food anaphylaxis.
In the present study, we aimed to determine an optimal approach for TEWL measurement in the context of murine food anaphylaxis and then define whether TEWL could provide a useful cutaneous measurement as in human food anaphylaxis to support future mechanistic studies in this disease context.
Materials and methods
Animals
BALB/c mice were housed under standard pathogen-free conditions in a temperature- and humidity-controlled room with food and water provided. Euthanasia procedures were conducted in accordance with University of Michigan’s Unit for Laboratory Animal Management policies. Carbon dioxide at 30%–70% flow rate of chamber volume per minute was used as a primary method, and terminal bleeding was used as a secondary method.
Sex as a biological variable: Both male and female mice between the ages of 4 and 6 weeks were employed in this study. We did not observe differences between male and female mice.
Study approval: All procedures were approved by the Institutional Animal Care and Use Committee (IACUC) at the University of Michigan under PRO00011478.
TEWL measurement
TEWL was taken at baseline and at 15-min intervals throughout each experiment. TEWL was measured with a Tewameter™ Nano (Courage + Khazaka gmbh, Germany) placed on the surface of the skin. After an equilibration time of 25–30 s, five sets of 5-s measurements were captured. The paired software (MPA plus, Courage + Khazaka) was used to analyze each set of measurements and compute one mean value. TEWL was taken at the ear, paw, and abdomen of mice to find the most consistent place to measure (Figure 1A). Once the ear was selected as the location for all future measurements, captured by pinning between the finger and the tewameter (Figure 1A), all subsequent data represent an ear measurement unless otherwise specified.
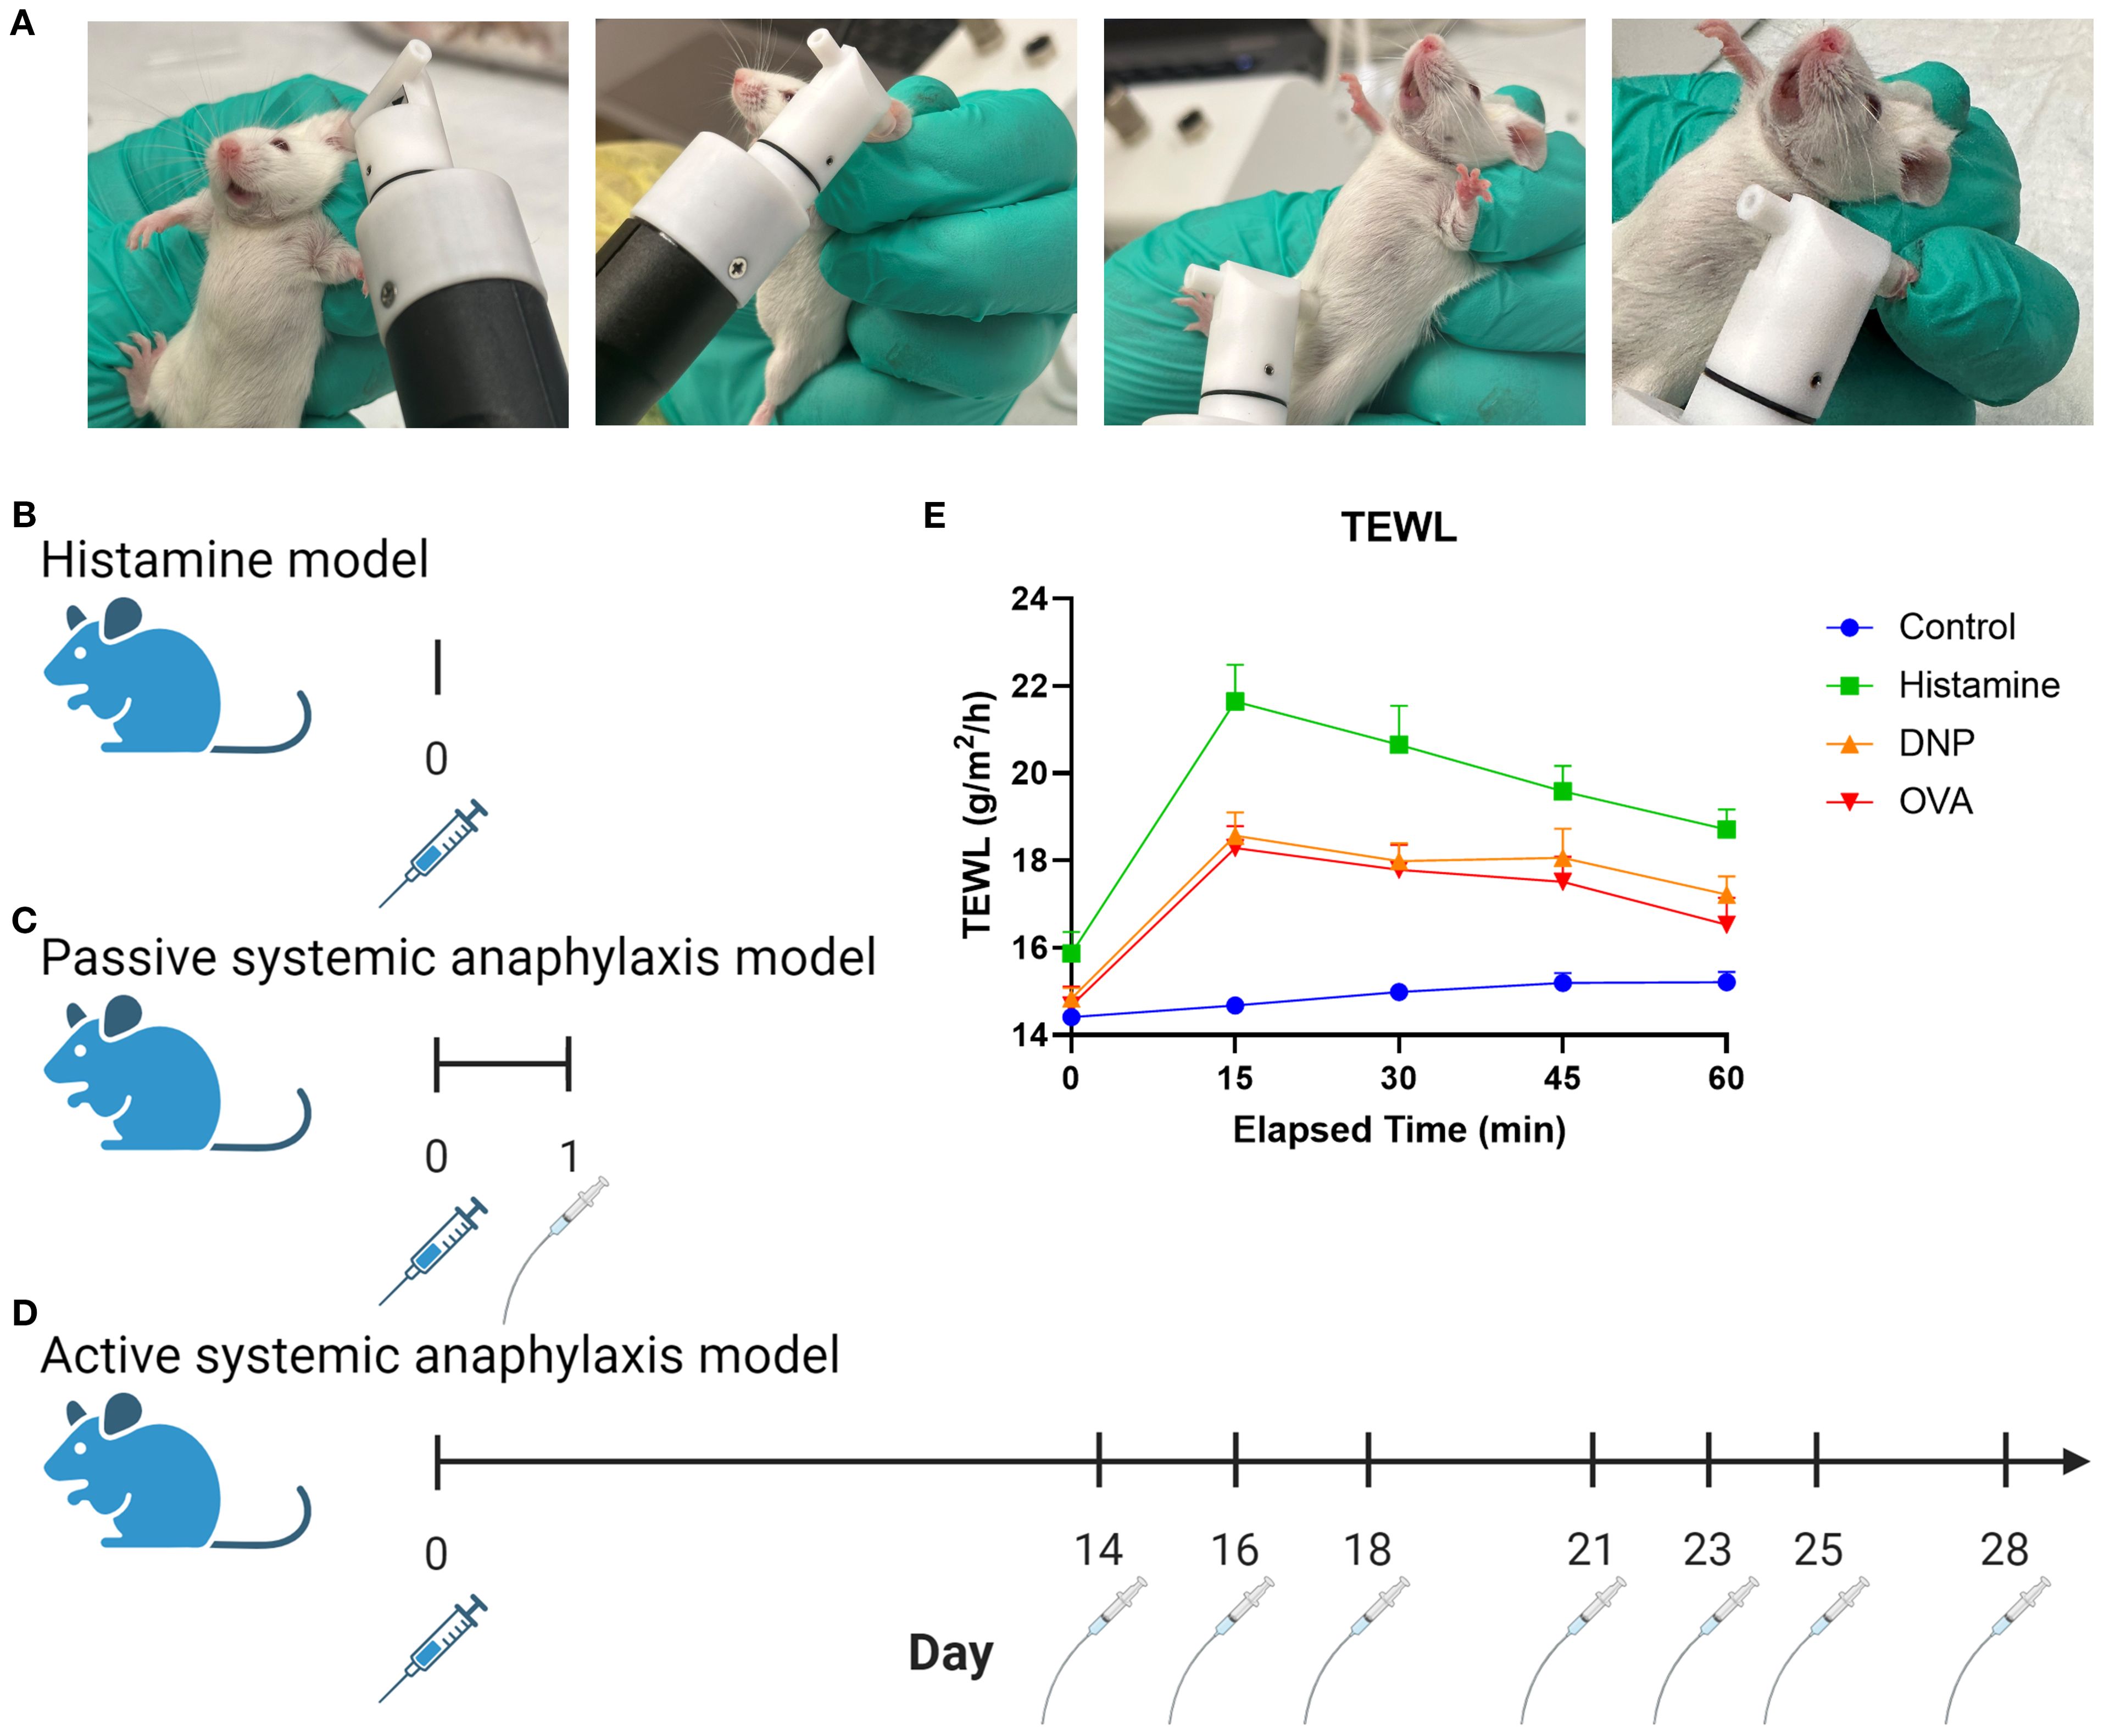
Figure 1. Graphic depiction of TEWL measurement and experimental models. (A) Images of tewameter placement on the murine ear, belly, and paw. (B) Non-IgE-mediated murine procedure using histamine via IV injection. (C) Murine PSA procedure using DNP sensitization via IV injection followed by oral gavage. (D) Murine ASA procedure using OVA sensitization with alum via IP injection followed by oral gavage challenges. (E) Measurement outcomes: anaphylaxis severity scoring, temperature, temperature change, TEWL and TEWL change, and MCPT-1.
Histamine model
The mice were heated under a heat lamp (Model HL-1B 120v; Braintree Scientific) for 10 min before tail intravenous (IV) injection. The experimental mice received an IV injection in the tail with a volume of 50 μL per mouse of histamine (Fisher Scientific, AAL0919814) in phosphate-buffered saline (PBS; Cytiva HyClone, SH30256.01) at a concentration of 200 mg/mL (Figure 1B). Control mice received an injection of 50 μL of PBS. Physiological responses of TEWL, temperature, and reaction score were taken at baseline and at 15-min intervals for 60 min. After the trial, the mice were anesthetized with isoflurane (ULAM) and blood samples were collected for MCPT-1 enzyme-linked immunosorbent assay (ELISA) prior to euthanasia.
Passive systemic anaphylaxis
All mice were sensitized with IV injections in the tail vein with 200 μL/100 μg per mouse of anti-dinitrophenyl (DNP)-IgE (Millipore Sigma, D8406) and PBS at a concentration of 50 μL/mL (Figure 1C). Prior to each challenge, all mice were starved for 5 h before experimental mice were challenged via oral gavage with a 50 mg/kg of DNP-albumin (Sigma-Aldrich, A6661) dissolved in 250 μL of PBS. The control mice were gavaged with 250 μL of PBS per mouse. Physiological responses of TEWL, temperature, and reaction score were taken at baseline and at 15-min intervals for 60 min. After the trial, the mice were anesthetized with isoflurane (ULAM) and blood samples were collected for MCPT-1 ELISA prior to euthanasia.
Active systemic anaphylaxis
All mice were sensitized to ovalbumin (OVA) via intraperitoneal injection with a solution of 50 μg of OVA (Sigma-Aldrich, 9006-59-1) and 100 μL/kg of alum (InvivoGen, 21645-51-2) into 250 μL of PBS per mouse (Figure 1D). Two weeks following sensitization, the mice were challenged every 2–3 days for a total of seven challenges (23, 24). Prior to each challenge, all mice were starved for 5 h before experimental mice were orally gavaged 50 mg/kg of OVA dissolved in 250 μL of PBS, and the control mice were gavaged with 250 μL of PBS. Physiological responses of TEWL, temperature, and reaction score were taken at baseline and every 15 min for 60 min. After the trial, the mice were anesthetized with isoflurane (ULAM) and blood samples were collected for MCPT-1 ELISA prior to euthanasia.
Additional physiological measurements
Core temperature was measured via a lubricated rectal probe (Model RET-3; Physitemp Instruments Inc.) following 5-s equilibration after insertion (Model Bat-12; Physitemp Instruments Inc). Reaction score was judged at each 15-min interval. The mice were assigned a score of 1 through 5 according to standard scoring, where 1 = excessive itching, 2 = hunching, 3 = labored breathing, 4 = moribund, and 5 = death (Figure 1E) (23). Diarrhea score is recorded binarily with 0 meaning no diarrhea occurred and 1 meaning it has.
Baseline TEWL was taken under various experimental control conditions. Mice were heated under a heat lamp (Model HL-1B 120v; Braintree Scientific) for either 5, 10, or 15 min and their TEWL and temperature were recorded every 15 min for 60 min. The mice were also placed under isoflurane until they were unconscious. The mice had their TEWL and temperature taken every 15 min for 60 min. Tail vein IV injections via a 26G ½ inch needle (Exel International, 14-841-32) and intragastric gavage via a reusable feeding needle (GloMed Inc., NC1299558) were also evaluated for their effect on baseline TEWL.
MCPT-1 ELISA
Following the last anaphylaxis event of each trial, blood was obtained from each mouse via cardiac puncture. The blood was placed into an ice bucket for 30 min before centrifugation at 9,000 rpm for 10 min to collect serum. The serum was stored at −80 °C until analysis. MCPT-1 levels were quantified using the Mouse MCPT-1 (mMCP-1) Uncoated ELISA kit (Invitrogen, 88-7503) according to the manufacturer’s instructions. At the end of the procedure, once the stop solution was added, the plate was read at 450 nm using the GloMax® Explorer plate reader (Promega, GM3500) and concentrations were calculated using a standard curve.
Statistical analysis
All statistical analyses were performed using GraphPad Prism (GraphPad Software, 10.4.1). Data were assessed for normality using the Shapiro–Wilk test. Comparisons between two groups were conducted using unpaired two-tailed t-tests for normally distributed data or the Mann–Whitney U test for non-normally distributed data. For comparisons involving more than two groups, one-way analysis of variance (ANOVA) followed by Tukey’s Honestly Significant Difference test was used. For the area under the curve (AUC) analysis, we calculated the area of the TEWL results above the baseline set for the food challenge by measurement at time 0 for each mouse. Where relevant, simple linear regressions were fit to XY data with an R2 and p-value reported. Data are presented as mean ±standard error of the mean (SEM) or median with interquartile range (IQR) as appropriate. Statistical significance was defined as p<0.05.
Results
Baseline TEWL measurements
To determine which part of the murine body would have TEWL results most reflective of human physiology (17), three body parts were tested: ear (mean, 17.7 g/m2/h), abdomen (mean, 21.8 g/m2/h), and paw (mean, 54.1 g/m2/h) (Figure 2A). The ear was most similar in TEWL to the human volar forearm data taken from OFCs as previously reported by our group (17) and was convenient to take measurements from. The abdomen posed the risk of the mouse urinating on the instrument and was not viable for repeated measures. Paw TEWL values were significantly greater than the ear and abdomen TEWL values (Figure 2A). All TEWL measurements aside from those explicitly labeled with a body site (Figure 2A) were conducted using the ear only.
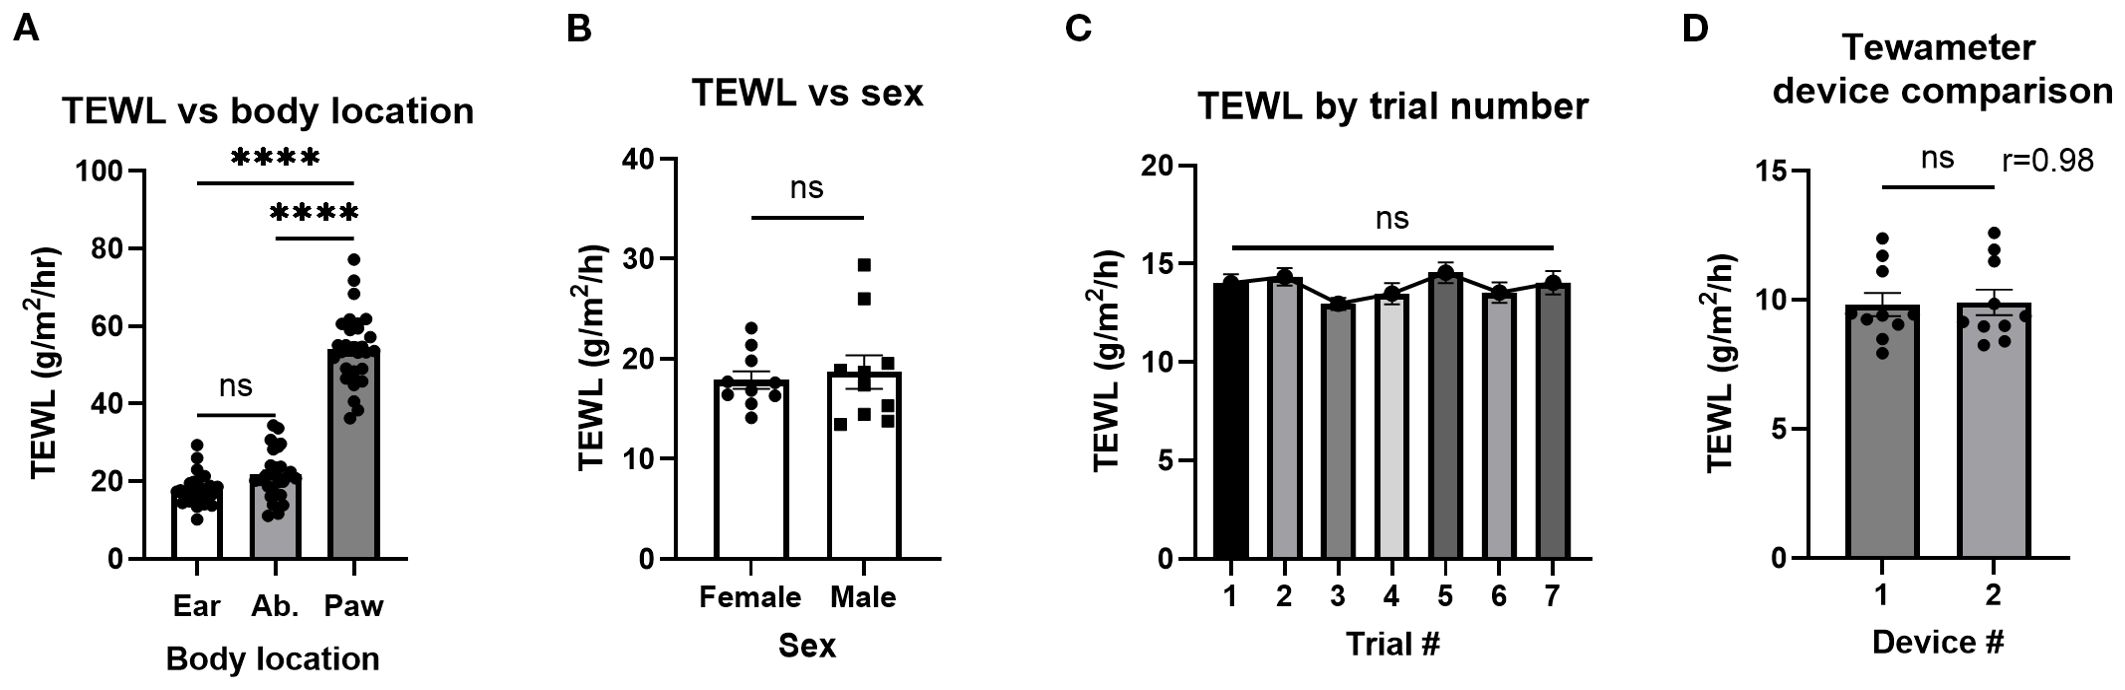
Figure 2. TEWL of different murine body parts, sexes, and a tewameter device comparison. (A) TEWL measurements of mouse ear, abdomen(Ab.), and paw; n = 30 per group. Ordinary one-way ANOVA. (B) TEWL measurements of male and female mice; n = 10 per group, unpaired t-test. (C) Baseline TEWL measurements of control mice for the seven trials making up the experiment. Trials 1–5, n = 24; trial 6, n = 17; trial 7, n = 11, mixed-effects analysis. (D) TEWL measurements using both available tewameters, n = 10, paired t-test. ****p<0.0001. ns, not significant.
To establish whether sex impacted TEWL measurement, the TEWL of both male (mean, 18.7 g/m2/h) and female (mean, 17.9 g/m2)/h) mice was compared with no significant differences observed (Figure 2B). TEWL from control mice over the course of seven non-reactive food challenges over a 17-day period [akin to the repeated reactions used in the active systemic anaphylaxis (ASA) studies later] was examined to determine that TEWL values were stable over time with no significant differences (Figure 2C). To confirm that both tewameters report similar measurements, a device comparison showed that minimal variation between tewameters was conducted (means, 9.8 and 9.9 g/m2/h) (Figures 2D, E).
Control TEWL measurements
To identify the impact on TEWL of the heat lamp used during tail vein IV injections, mice were warmed under the heat lamp for 5, 10, and 15 min before core temperature and TEWL were taken in parallel at 5-min intervals for 15 min after warming (Figures 3A–F). While core temperature increased after heating, TEWL did not vary significantly.
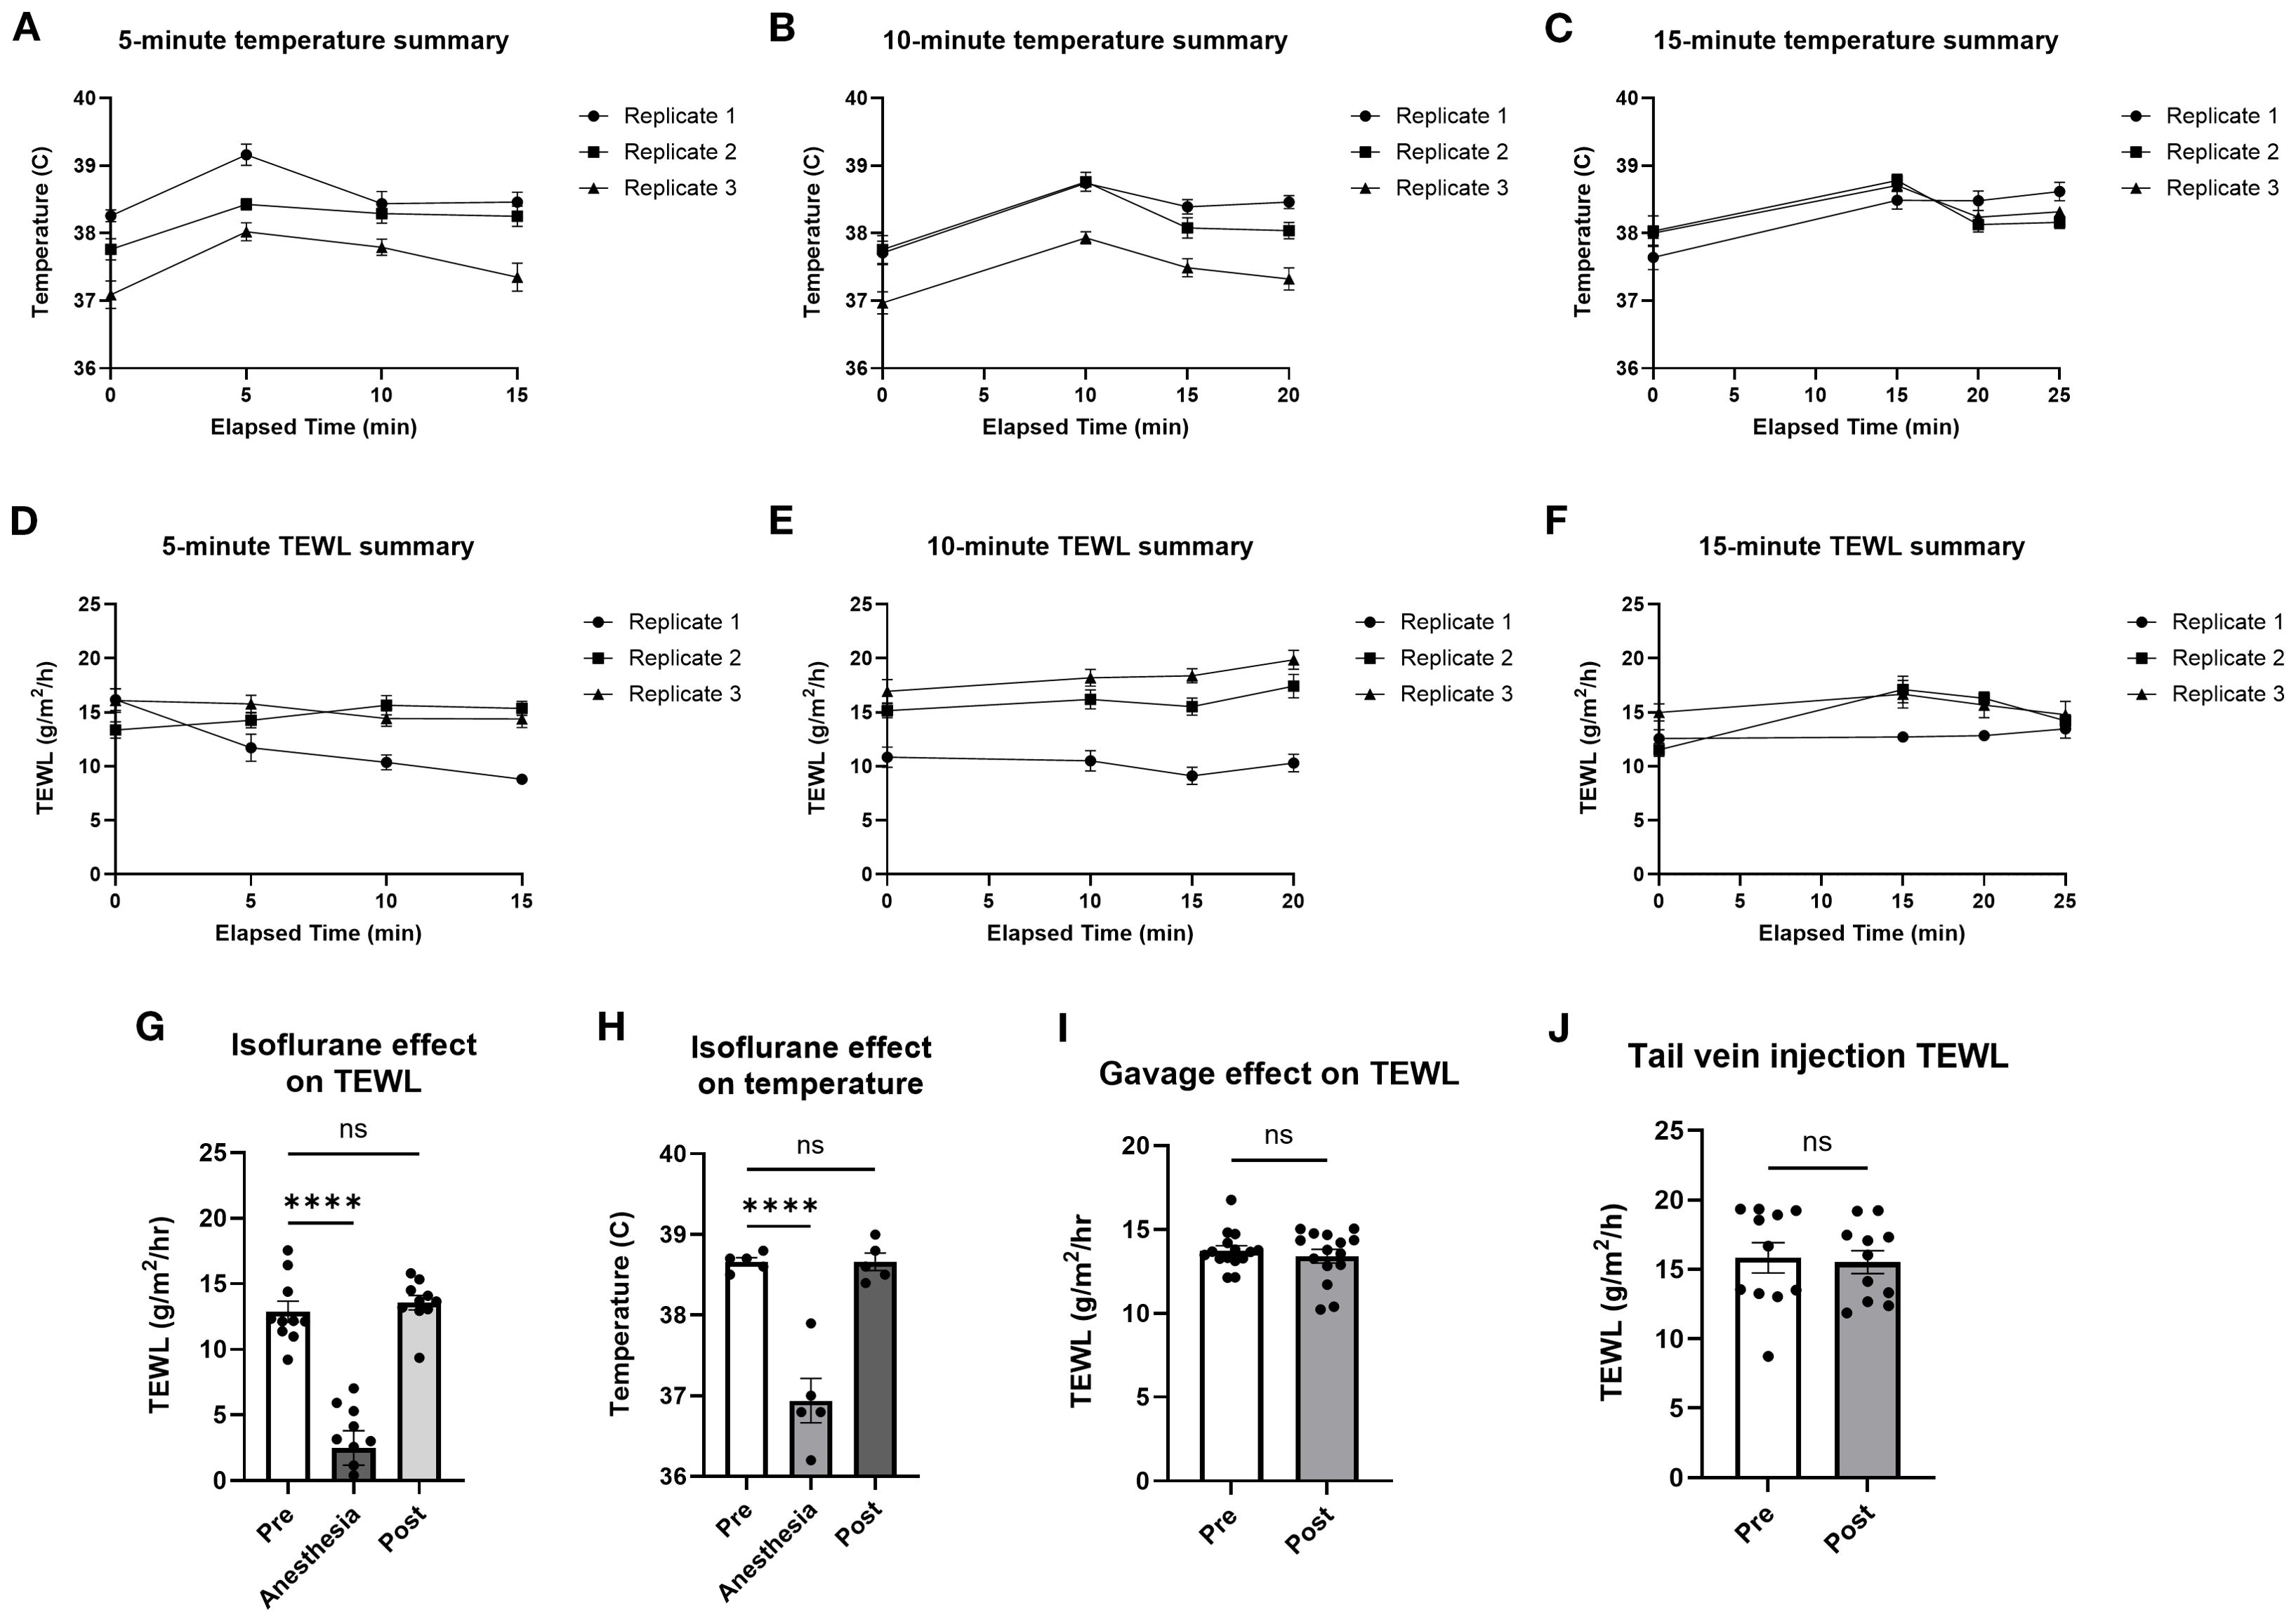
Figure 3. TEWL and temperature of mice before and after heat lamp trials, isoflurane trials, and oral gavage trials. Core temperature of mice was taken at baseline before being warmed for 5 min (A, D), 10 min (B, E), and 15 min (C, F) and in 5-min intervals after being warmed under the heat lamp; n = 10 per group. (G) Core temperature of mice taken at baseline, during, and after being induced with isoflurane anesthesia; n = 5 per group, * indicates statistical significance. (H) TEWL of mice taken at baseline, during, and after being induced with isoflurane anesthesia; n = 10 per group. (I) TEWL of mice taken at baseline and after being orally gavaged with saline; n = 15 per group. (J) TEWL of mice taken at baseline and after tail IV injection of saline; n = 11 per group. ****p<0.0001, ns, not significant.
To analyze the effect of isoflurane anesthesia, TEWL and temperature measurements were taken before (mean = 38.7 °C; 12.9 g/m2/h), during (mean = 36.9 °C; 2.5 g/m2/h), and after (mean = 38.7 °C; 13.6 g/m2/h) anesthesia (Figures 3G, H). Time from anesthesia onset to TEWL measurement was 2 min. To measure the effect of oral gavage on TEWL, TEWL was taken before (mean = 13.7 g/m2/h) and after (mean = 13.4 g/m2/h) oral gavage of PBS (Figure 3I). To identify the effect of tail IV injection on TEWL, TEWL was taken before (mean = 15.8 g/m2/h) and after (mean = 15.5 g/m2/h) tail IV injection of PBS (Figure 3J). Time from gavage or injection to TEWL measurement was 1 min. Overall, anesthesia clearly impacted TEWL measurements, so anesthesia was only used after challenge for terminal bleeding to avoid affecting TEWL measurements during anaphylaxis. Heating, gavage, and IV injections appeared to have no significant effect on TEWL and so were used in subsequent anaphylaxis models.
Non-IgE-mediated anaphylaxis—histamine
To identify the impact of a non-IgE-mediated anaphylaxis-like event on the TEWL of mice, the TEWL and temperature of the control and histamine groups were measured at baseline and in 15-min intervals after challenge with histamine (Figures 4A, B). The greatest change in TEWL occurred at the 15-min time point (mean control = 0.12 g/m /h; histamine = 5.7 g/m2/h), while temperature decreased more slowly and was minimally different at 15 min (mean control = −0.01°C; histamine = −0.47°C) and continued to decline at a significant rate for the duration of the trial (Figures 4C, D). Maximum anaphylaxis reaction score (mean control = 0, histamine = 3.4) and diarrhea status (mean control = 0, histamine = 0) were also recorded throughout the trial for the control and histamine mice as a secondary confirmation of anaphylaxis (Figures 4E, F). TEWL change at 15 min did not correlate with temperature change at 15 min (Figure 4G) but did correlate with anaphylaxis reaction score (Figure 4H). Serum was obtained via terminal bleed from mice following oral challenge and tested for MCPT-1 of the control (mean = 1,708.86 pg/mL) and histamine (mean = 1,468.61 pg/mL) mice (Figure 4I) and did not correlate with TEWL change at 15 min (Figure 4J), as expected.
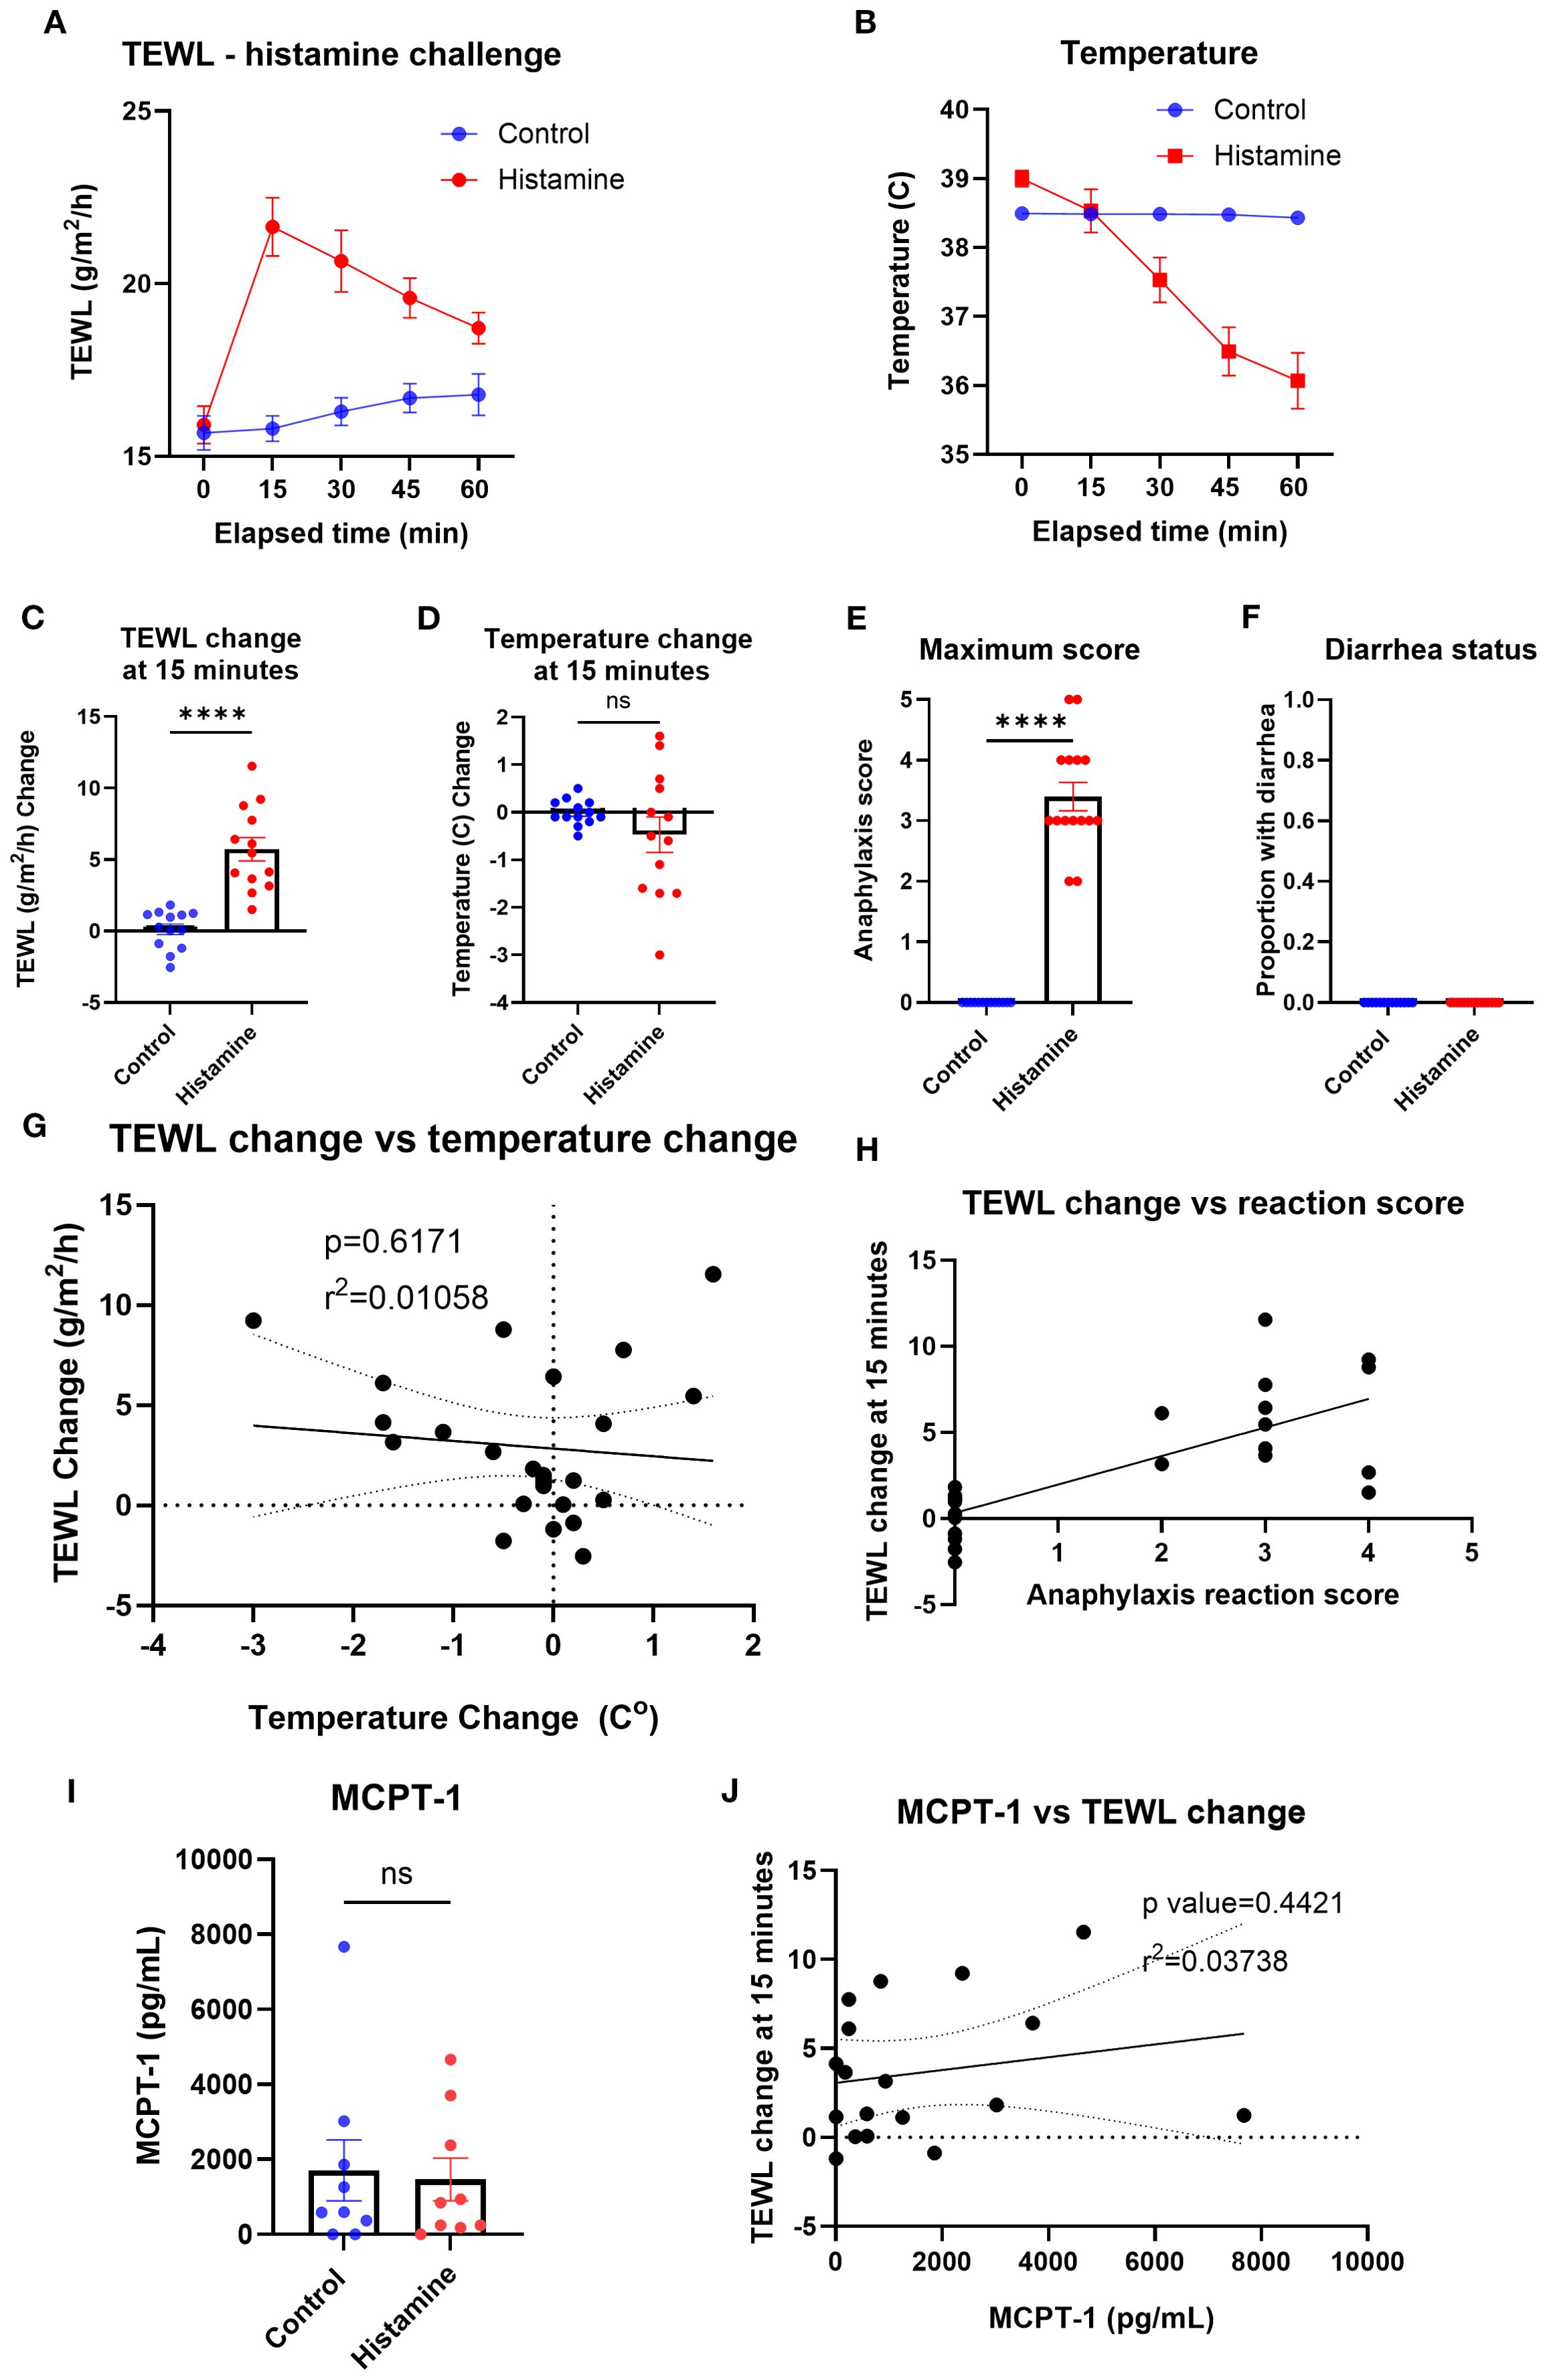
Figure 4. TEWL, temperature, anaphylaxis score, diarrhea status, and MCPT-1 measurements of control mice and mice administered histamine. (A) TEWL of mice taken at baseline and in 15-min intervals post-challenge for 60 min, n = 13 per group. (B) Internal temperature of mice taken at baseline and in 15-min intervals post-challenge for 60 min, n = 13 per group. (C) TEWL of mice at 15 min subtracted from baseline TEWL to get TEWL change at 15 min. n = 13 per group, unpaired t-test. (D) Internal temperature of mice at 15 min subtracted from baseline TEWL to get TEWL change at 15 min. n = 13 per group, unpaired t-test. (E) Highest score given to each mouse throughout the trial; n = 13 for each group; unpaired t-test. (F) Diarrhea status given to each mouse throughout the trial. n = 13 for each group; unpaired t-test. (G) Correlation of the mice’s TEWL change and their temperature change at 15 min. n = 26, simple linear regression. (H) Correlation of the mice’s TEWL change with their reaction score. n = 26 per group, ordinary one-way ANOVA. (I) Interpolation of MCPT-1 concentration found in the serum of control and histamine mice, n = 9 per group, unpaired t-test. (J) Interpolation of MCPT-1 concentration of murine serum correlated with TEWL change at 15 min; n = 9 per group, nonlinear fit. ****p<0.0001, ns, not significant.
Passive systemic anaphylaxis
To identify the impact of passive systemic anaphylaxis (PSA) on the TEWL of mice, TEWL and temperature were measured at baseline and in 15-min intervals post-oral challenge with DNP-challenged mice (Figures 5A, B). The TEWL and temperature change of DNP mice (mean TEWL change at 15 min = 3.48 g/m2/h; mean temperature change at 15 min = −0.55°C) changed the most at the 15-min time point, compared to that of the control mice (mean 0.91 g/m2/h; 0.03°C) (Figures 5C, D). Anaphylaxis reaction score (mean control = 0; DNP = 1.7) and diarrhea status were also recorded throughout the trial to corroborate the reaction status (Figures 5E, F). TEWL change (baseline TEWL subtracted from TEWL of mice at 15 min) correlated with temperature change (Figure 5G) as well as with anaphylaxis reaction score (Figure 5H). Serum MCPT-1 was obtained from control (mean = 1,210.83 pg/mL) and DNP (mean = 5,995.14 pg/mL) mice via terminal bleed following oral challenge (Figure 5I) and did not correlate with the TEWL change (Figure 5J).
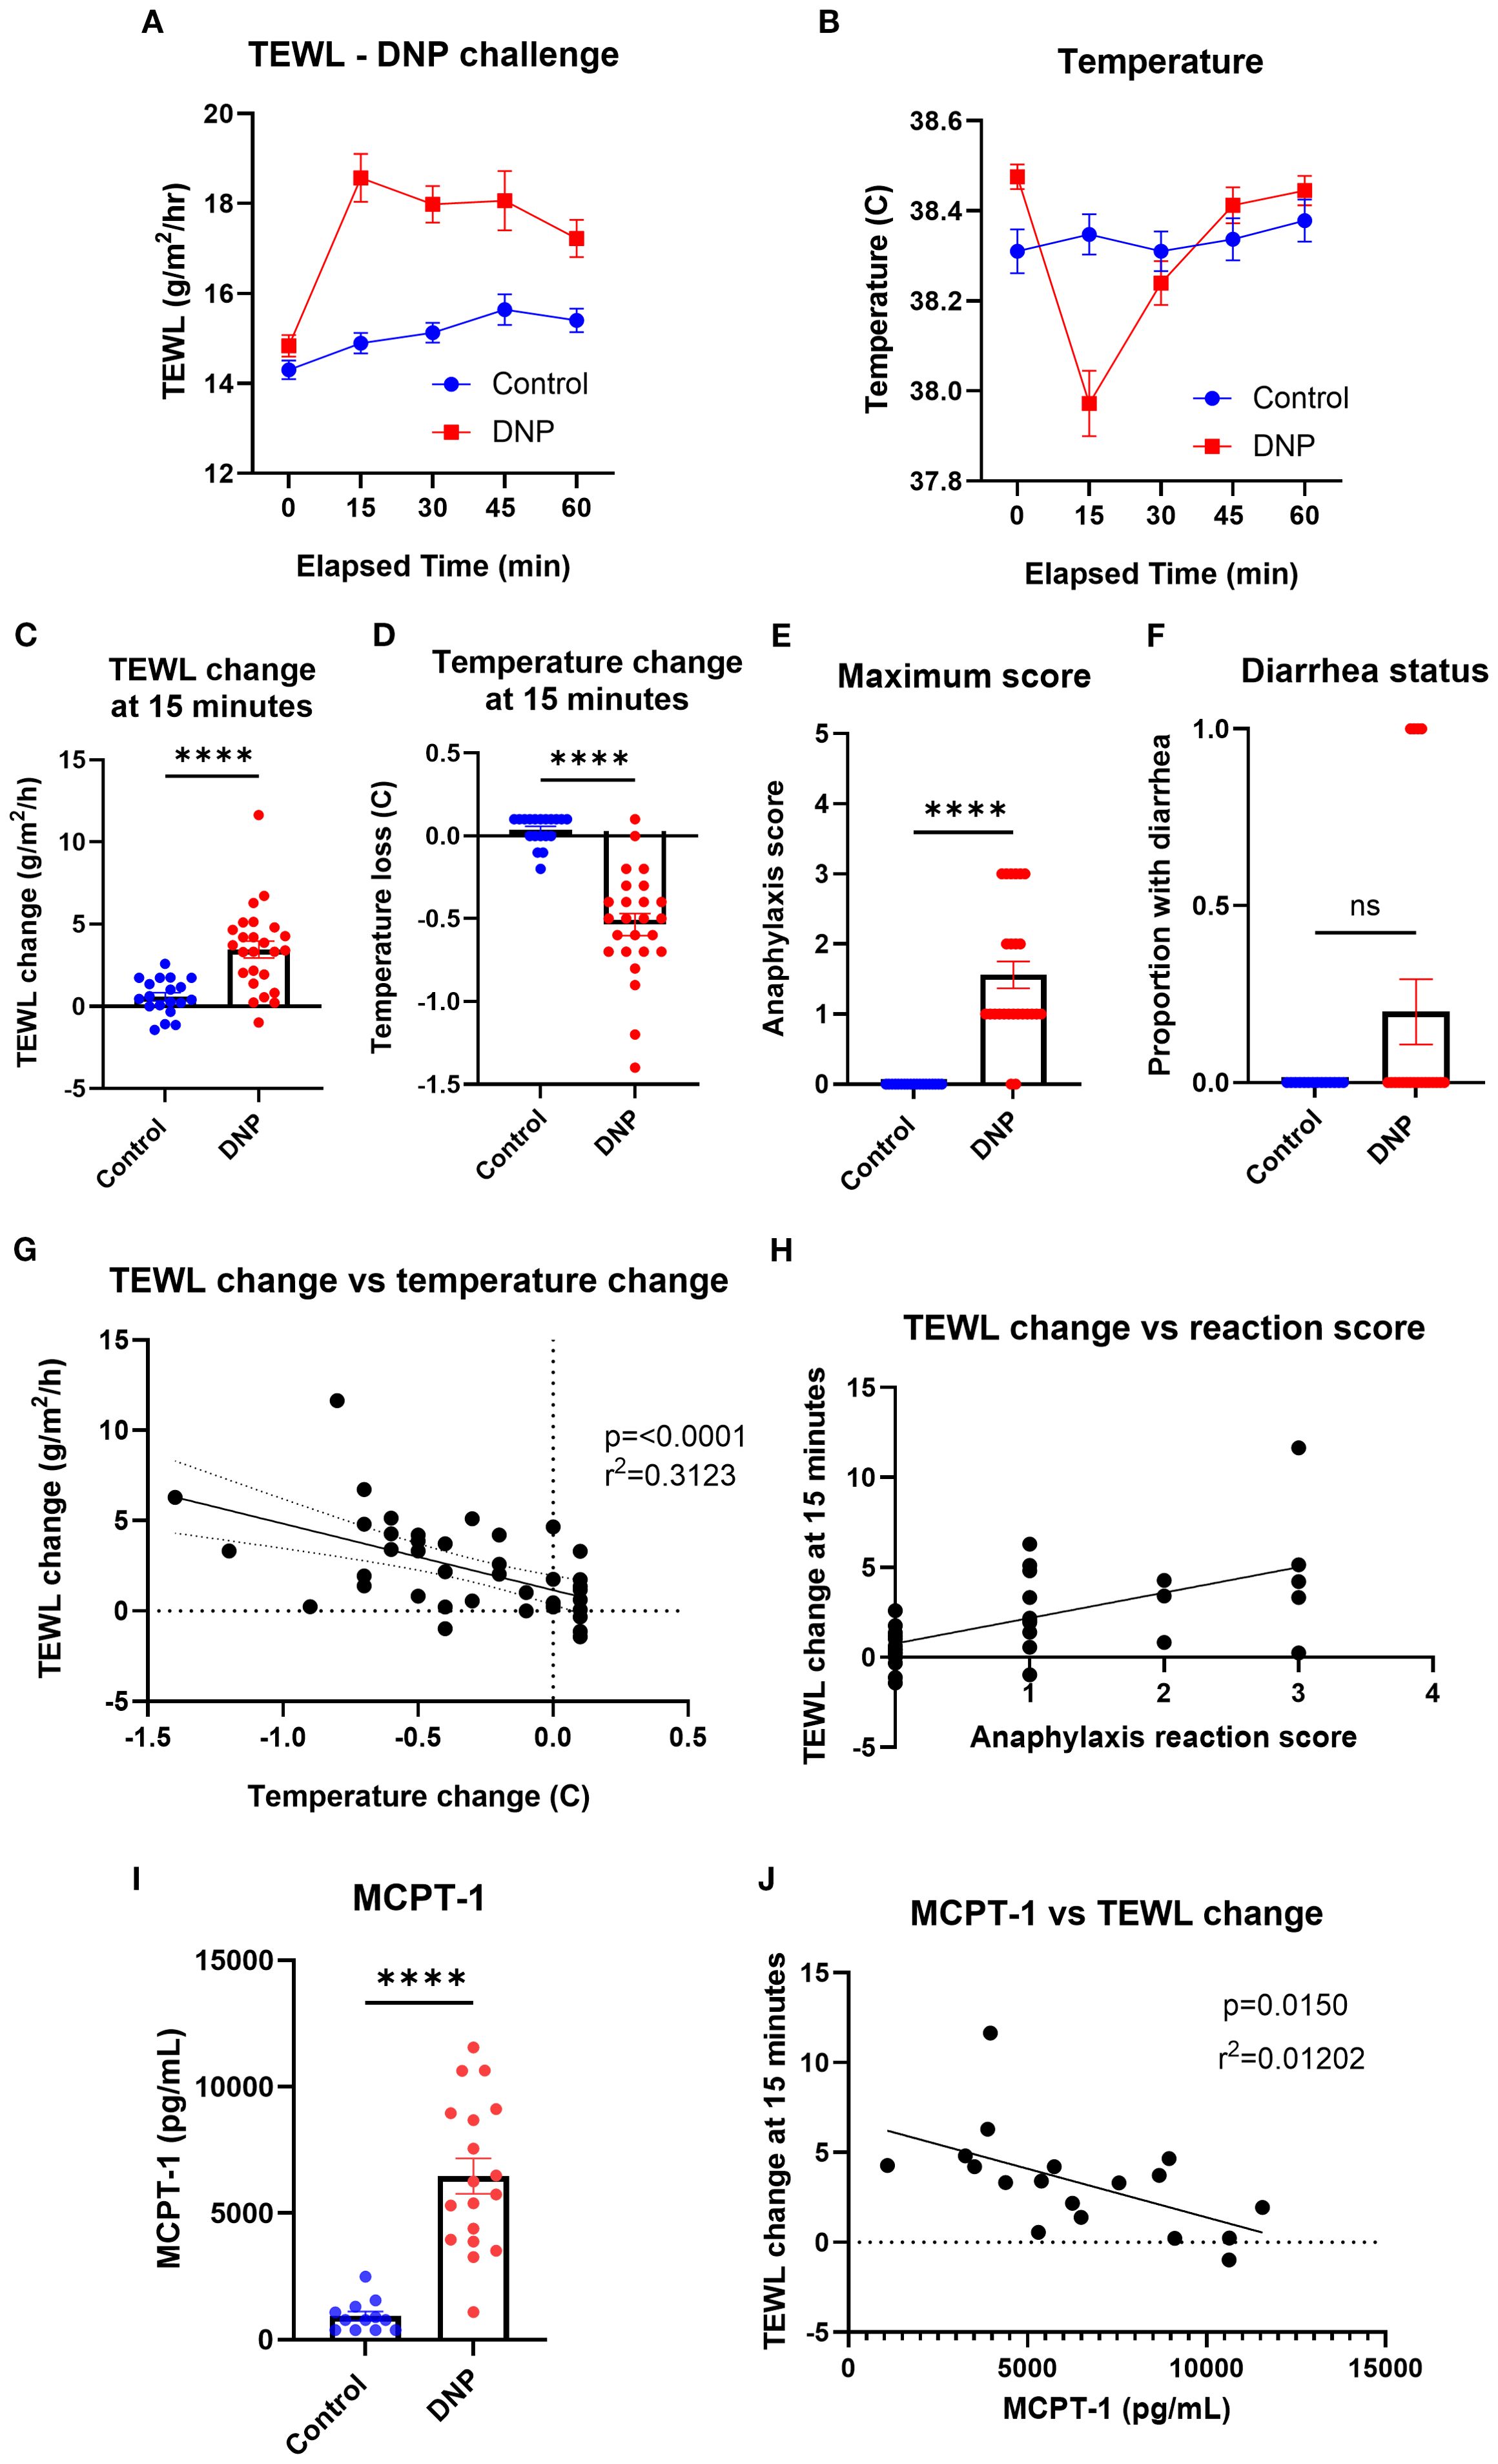
Figure 5. TEWL, temperature, anaphylaxis score, diarrhea status, and MCPT-1 measurements of control mice and mice orally challenged with DNP. (A) TEWL of mice taken at baseline and in 15-min intervals post-challenge for 60 min; Control n = 19, DNP n = 25. (B) Core temperature of mice taken at baseline and in 15-min intervals post-challenge for 60 min; Control n = 19, DNP n = 25. (C) TEWL of mice at 15 min subtracted from baseline TEWL to get TEWL change at 15 min. Control n = 19, DNP n = 25, unpaired t-test. (D) Core temperature of mice at 15 min subtracted from baseline TEWL to get TEWL change at 15 min. Control n = 19, DNP n = 25, unpaired t-test. (E) Highest score given to each mouse throughout the trial. Control n = 19, DNP n = 25, unpaired t-test. (F) Diarrhea status given to each mouse throughout the trial. Control (0) n = 19, DNP (0) n = 25 unpaired t-test. (G) Correlation of the mice’s TEWL change and their temperature change at 15 min. n = 44, simple linear regression. (H) Correlation of the mice’s TEWL change with their reaction score. n = 44, ordinary one-way ANOVA. (I) Interpolation of MCPT-1 concentration found in the serum of control and DNP mice. Control n = 12, DNP n = 18, unpaired t-test. (J) Interpolation of MCPT-1 concentration of murine serum correlated with TEWL change at 15 min; Control n = 12, DNP n = 18, linear regression fit shown. ****p<0.0001, ns, not significant.
Active systemic anaphylaxis
To identify the impact of ASA on the TEWL of mice, TEWL and temperature of OVA-sensitized mice were measured at baseline and in 15-min intervals post-oral challenge with OVA (only data from challenge number 7 used) (Figures 6A, B). The TEWL and temperature change of OVA-challenged mice (mean TEWL change at 15 min = 3.61 g/m2/h; mean temperature change at 15 min = −1.4°C) changed the most at the 15-min time point, compared to that of the control mice (mean TEWL change at 15 min = 0.11 g/m2/h; mean temperature change at 15 min = −0.97°C) (Figures 6C, D). Anaphylaxis reaction score and diarrhea status were also recorded for control (maximum anaphylaxis reaction score = 0; diarrhea status = 0) and OVA (mean maximum anaphylaxis reaction score = 2.84; diarrhea status = 0.72) mice throughout the trial to corroborate the reaction’s severity (Figures 6E, F). TEWL change at 15 min correlated with temperature change (Figure 6G) as well as with anaphylaxis reaction score (Figure 6H). Serum MCPT-1 was obtained via terminal bleed following oral challenge in control (mean = 3,738.46 pg/mL) and OVA mice (mean = 12,648.7 pg/mL) (Figure 6I), which trended toward a correlation with TEWL change (Figure 6J).
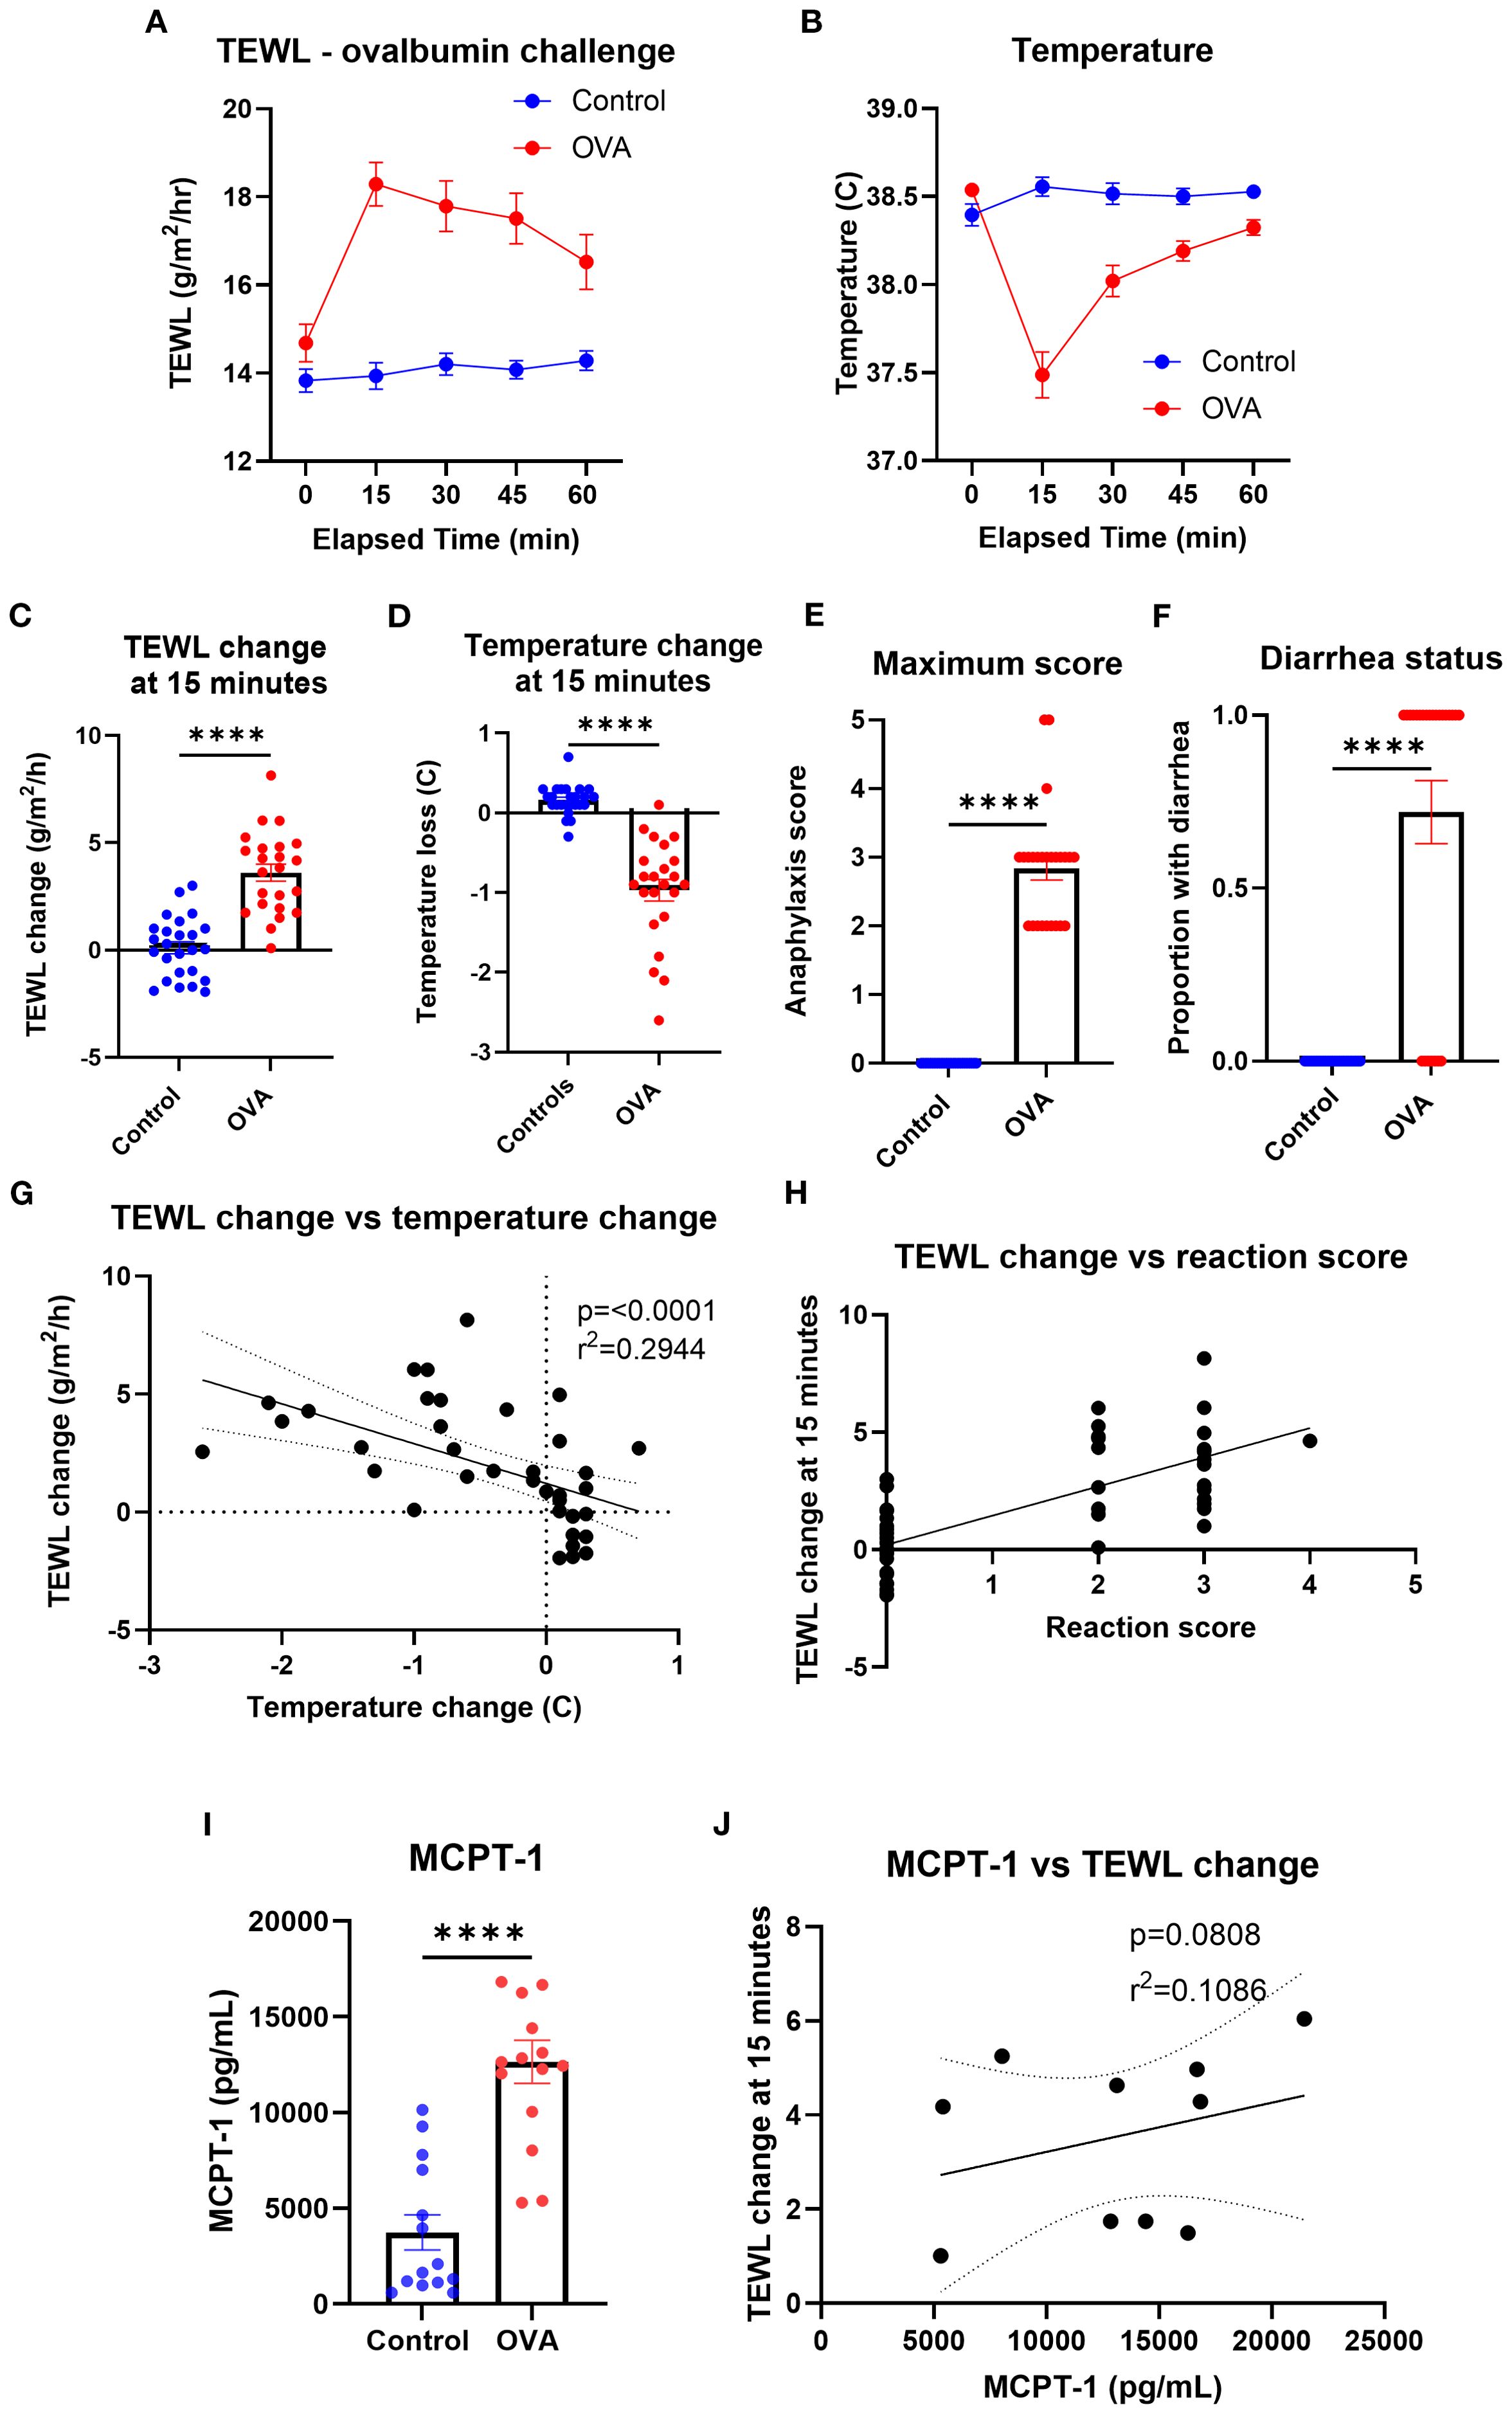
Figure 6. TEWL, temperature, anaphylaxis score, diarrhea status, and MCPT-1 measurements of control mice and mice orally challenged with OVA from trial 7. (A) TEWL of mice taken at baseline and in 15-min intervals post-challenge for 60 min; Control n = 25, OVA n = 23. (B) Core temperature of mice taken at baseline and in 15-min intervals post-challenge for 60 min; Control n = 25, OVA n = 23 (C) TEWL of mice at 15 min subtracted from baseline TEWL to get TEWL change at 15 min. Control n = 25, OVA n = 23, unpaired t-test. (D) Internal temperature of mice at 15 min subtracted from baseline TEWL to get TEWL change at 15 min. Control n = 25, OVA n = 23, unpaired t-test. (E) Highest score given to control and OVA mice throughout the trial. n = 15 per group, unpaired t-test. (F) Diarrhea status given to each control and OVA mice throughout the trial; Control n = 25, OVA n = 23, unpaired t-test. (G) Correlation of the mice’s TEWL change and their temperature change at 15 min. n = 48, simple linear regression. (H) Correlation of the mice’s TEWL change with their reaction score. n = 48, ordinary one-way ANOVA. (I) Interpolation of MCPT-1 concentration found in the serum of control and OVA mice. Control n = 14, OVA n = 15, unpaired t-test. (J) Interpolation of MCPT-1 concentration of murine serum correlated with TEWL change at 15 min; Control n = 14, OVA n = 15, linear regression line fit shown. ****p<0.0001, ns, not significant.
Non-IgE-mediated vs. IgE-mediated models
To identify the impacts of varying types of anaphylaxes on TEWL measurements, histamine models (non-IgE-mediated) and DNP and OVA (IgE-mediated) models were compared by TEWL results (Figure 7A), TEWL change at 15 min (Figure 7B), temperature (Figure 7C), and temperature change at 15 min (Figure 7D). TEWL increased significantly for all models, whereas other markers such as anaphylaxis reaction severity and temperature change varied greatly depending on which model was utilized. In addition, in order to evaluate the total change in TEWL during the entire challenge time course, we calculated the AUC for TEWL in each challenge. We then correlated the values with temperature change at 15 min, maximum anaphylaxis severity score, and MCPT-1 results (Supplementary Figure S1). To determine the effect of anaphylaxis on TEWL during earlier challenges, prior to the seventh trial, TEWL change at 15 min, temperature change at 15 min, maximum anaphylaxis severity score, and diarrhea status were recorded and plotted from Trial 4 through Trial 6 (Supplementary Figure S2).
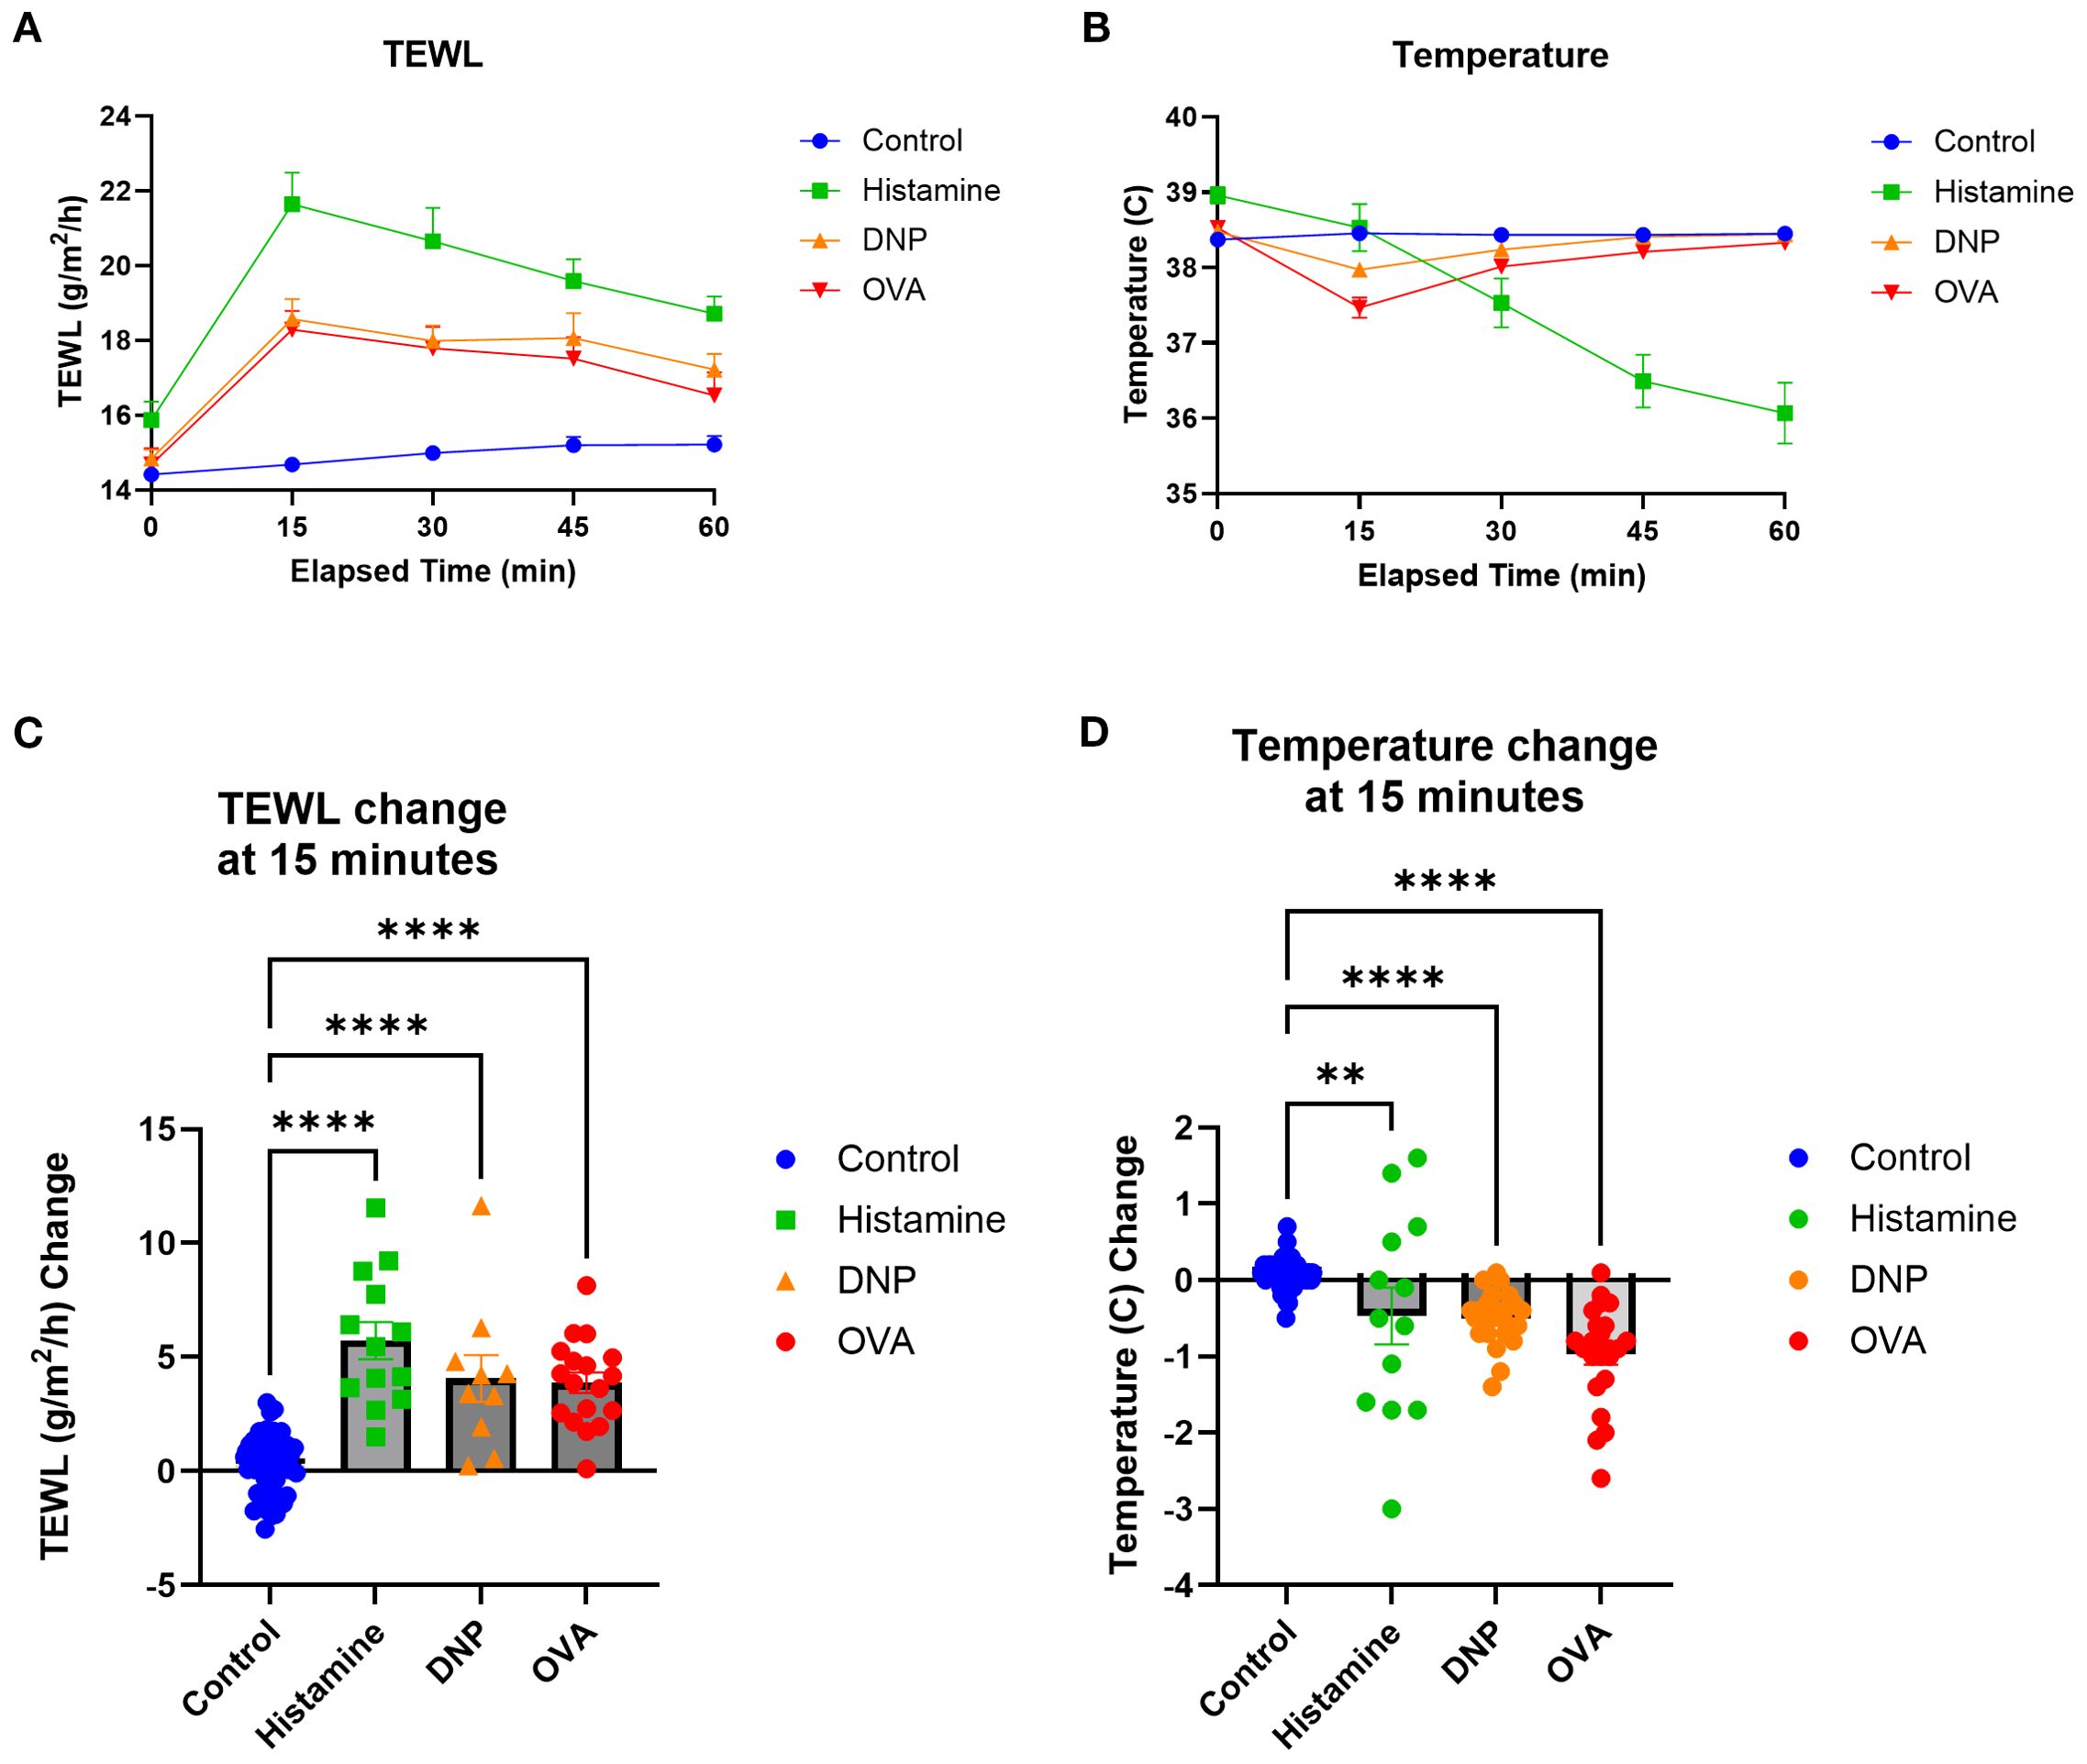
Figure 7. TEWL and temperature comparisons of the three models utilized. (A) TEWL of mice taken at baseline and in 15-min intervals post-challenge for 60 min. (B) Core temperature of mice taken at baseline and in 15-min intervals post-challenge for 60 min. (C) TEWL of mice at 15 min subtracted from baseline TEWL to get TEWL change at 15 min, one-way ANOVA. (D) Internal temperature of mice at 15 min subtracted from baseline TEWL to get TEWL change at 15 min, one-way ANOVA. Control n = 57, histamine n = 13, DNP n = 25, and OVA n = 23. ****p<0.0001, **p<0.001, ns, not significant.
Discussion
FA persists as a profound societal health issue with nearly 8% of children and 10% of adults affected in the United States (15, 16). Food anaphylaxis, an unpredictable, potentially deadly consequence of FA, causes 200,000 annual US emergency room visits (1–3). The OFC remains the gold standard diagnostic test for FA, but OFCs carry anaphylaxis risk, especially for those in clinical trials expecting a reaction on entry OFC (6, 7, 12). Unfortunately, the anaphylaxis endpoint relies purely on a clinical diagnosis through physician observation, and no approved monitoring device is available (9, 13). However, early identification and treatment of anaphylaxis can reduce reaction severity and minimize adverse outcomes (14). Our group has previously shown that TEWL increases during human FA reactions and likely provides some level of advanced warning for anaphylaxis (4, 5, 8).
TEWL is a well-established measure of skin barrier function and is used in evaluating topical medications and in dermatological conditions (17). TEWL is measured painlessly and noninvasively using skin contact probes to give real-time results, and newer technology allows for continuous measurement over several hours (15, 16). Presently, the only objective measurement in mice to confirm anaphylaxis in real time is invasive rectal temperature measurement, which does not correlate fully with what occurs in human food anaphylaxis pathophysiology (23). Core temperature measurement in mice may not consistently correlate with other anaphylaxis measures in all models, such as symptom scores or MCPT-1 results (25–27), supporting the need for an additional objective reaction correlate, such as TEWL. TEWL has never been reported in mouse models of food anaphylaxis, so in this study, we sought to evaluate whether TEWL could provide a similar measure of cutaneous change in such models as in human food anaphylaxis in order to predict the onset of anaphylaxis. This could facilitate a bedside–bench–bedside virtuous cycle to facilitate a better understanding of anaphylaxis pathophysiology. Of particular interest in this study, we find that TEWL increased in a comparable manner in all three reaction models, and preceded the temperature drop in a histamine model. This suggests that TEWL represents a shared outcome regardless of allergic stimulus that may be useful in standardizing allergic models.
Prior studies with TEWL in mouse models provide variable or limited technical information on effective device use or measurement, and no reviews are available to describe a standardized measurement approach (18–22). There are a variety of effective mouse models of FA and anaphylaxis (23, 28). We sought to define a standardized TEWL measurement approach for food anaphylaxis modeling to support future research into food anaphylaxis mechanisms. We note that the ear is a commonly targeted site in mice for skin evaluations (29, 30) and for various anaphylaxis models, particularly for vascular effects of allergic reactions (31, 32). Thus, optimizing TEWL to the mouse ear provides a useful correlation to well-established models commonly used in the food anaphylaxis space.
While a great deal of detail on the mechanisms of food anaphylaxis is known (33–35), key specifics around how the skin dynamically changes during anaphylaxis remain understudied. One mechanism of the TEWL change in food anaphylaxis may relate the effect of histamine on the vasculature in anaphylaxis (36). We demonstrate that direct IV injection of high-dose histamine, sufficient to replicate anaphylaxis symptoms, readily induces a TEWL increase without evidence of underlying MC activation and with a slower onset of temperature loss. Anaphylaxis is associated with intense peripheral vasodilation (31, 32). Histamine is known to have a direct effect on vascular endothelial integrity, leading to interstitial leaking of fluid (37). Furthermore, in human food anaphylaxis, serum albumin decreases during more intense anaphylaxis, suggesting a high level of extravasation with worse reactions (38). Vascular leak has long been associated with the observation of temperature loss during anaphylaxis in the mouse (39), so the lack of a temporal association between histamine-driven TEWL increase and a slower temperature loss suggests that additional factors may be at play. For example, mast cell granule contents can directly antagonize cell adhesion molecules; if there is an acute cutaneous release of MC granules, this could directly affect the skin barrier in real time as an alternate or additive mechanism for the increase seen in TEWL (38). To this point, we see a trend toward a correlation between the ASA model’s MCPT-1 release and the TEWL increase, suggesting that a more “complete” immune response driving the reaction may include just such a mechanism. Altogether, the observations here suggest that more is occurring at or just below the skin during food anaphylaxis than is fully understood, supporting the need for additional investigations into the role of cutaneous changes in anaphylaxis pathogenesis.
This study has several limitations. First, this study does not directly assess the mechanism of the TEWL changes observed. In addition, not all food anaphylaxis models were utilized, such as cholera toxin or skin sensitization models, and non-anaphylaxis-producing models were not included either. A largely method-focused approach was taken to provide a clear framework for future mechanistic work that will follow and to provide the field with details on TEWL use in food anaphylaxis models more promptly. In this context, additional food anaphylaxis models can utilize the TEWL framework provided here. Furthermore, this study focuses on non-anesthetized mice with ear-focused TEWL measurements, while other methods might require anesthesia or cutaneous barrier measurements on other areas of the body. As we show in the baseline measurements, other body areas may present challenges for TEWL measurement, and so that work may need additional optimization.
To summarize, we show that TEWL increases significantly and rapidly in multiple food anaphylaxis models in mice, even when no temperature drop had been observed. This supports the potential of TEWL as a noninvasive predictor to anaphylaxis for multiple stimulation approaches. This work demonstrates that TEWL can be readily measured in mouse models of food anaphylaxis regardless of stimulus approach with reproducible and largely stable baseline values. Furthermore, TEWL rises during mouse food anaphylaxis in a manner akin to human food anaphylaxis, which will facilitate mechanistic investigations into the rapid cutaneous changes during the early phases of food anaphylaxis.
Data availability statement
Any data requests for this manuscript require review and approval by the University of Michigan Office for Research and Sponsored Programs. Requests to access the datasets should be directed to CS, c2NodWxlcmNAbWVkLnVtaWNoLmVkdQ==.
Ethics statement
The animal study was approved by University of Michigan Institutional Animal Care and Use Committee. The study was conducted in accordance with the local legislation and institutional requirements.
Author contributions
BW: Investigation, Writing – original draft, Software, Conceptualization, Resources, Visualization, Formal Analysis, Validation, Data curation, Writing – review & editing, Project administration, Methodology. JA: Methodology, Validation, Data curation, Writing – review & editing, Software, Investigation, Formal Analysis, Resources, Visualization. AW: Validation, Writing – review & editing, Data curation, Methodology, Investigation, Resources, Conceptualization, Visualization, Formal Analysis. MD: Writing – review & editing, Conceptualization, Visualization, Validation, Investigation, Resources, Formal Analysis, Data curation, Methodology, Software. JH: Writing – review & editing, Conceptualization, Software, Writing – original draft, Investigation, Resources, Formal Analysis, Project administration, Data curation, Methodology, Validation, Visualization. JO’K: Methodology, Validation, Writing – review & editing, Formal Analysis, Supervision, Resources, Visualization. SH: Writing – review & editing, Supervision, Investigation, Resources, Conceptualization, Methodology. JB: Visualization, Formal Analysis, Resources, Funding acquisition, Project administration, Conceptualization, Methodology, Writing – review & editing, Supervision. CS: Supervision, Resources, Validation, Project administration, Conceptualization, Writing – review & editing, Data curation, Funding acquisition, Methodology, Writing – original draft, Formal Analysis, Software, Visualization, Investigation.
Funding
The author(s) declare financial support was received for the research and/or publication of this article. This work was supported by the University of Michigan via the Ronald Koenig, MD, PhD Department of Internal Medicine Early Career Endowment (CS) as well as the National Institutes of Health under award K23AI162661 (CS).
Conflict of interest
The authors declare that the research was conducted in the absence of any commercial or financial relationships that could be construed as a potential conflict of interest.
The author(s) declared that they were an editorial board member of Frontiers, at the time of submission. This had no impact on the peer review process and the final decision.
Generative AI statement
The author(s) declare that no Generative AI was used in the creation of this manuscript.
Any alternative text (alt text) provided alongside figures in this article has been generated by Frontiers with the support of artificial intelligence and reasonable efforts have been made to ensure accuracy, including review by the authors wherever possible. If you identify any issues, please contact us.
Publisher’s note
All claims expressed in this article are solely those of the authors and do not necessarily represent those of their affiliated organizations, or those of the publisher, the editors and the reviewers. Any product that may be evaluated in this article, or claim that may be made by its manufacturer, is not guaranteed or endorsed by the publisher.
Supplementary material
The Supplementary Material for this article can be found online at: https://www.frontiersin.org/articles/10.3389/fimmu.2025.1667569/full#supplementary-material
References
1. Gupta RS, Warren CM, Smith BM, Blumenstock JA, Jiang J, Davis MM, et al. The public health impact of parent-reported childhood food allergies in the United States. Pediatrics. (2018) 142:23. doi: 10.1542/peds.2018-1235
2. Gupta RS, Warren CM, Smith BM, Jiang J, Blumenstock JA, Davis MM, et al. Prevalence and severity of food allergies among US adults. JAMA Netw Open. (2019) 2:e185630. doi: 10.1001/jamanetworkopen.2018.5630
3. Bilaver LA, Chadha AS, Doshi P, O’Dwyer L, and Gupta RS. Economic burden of food allergy: A systematic review. Ann Allergy Asthma Immunol. (2019) 122:373–380 e1. doi: 10.1016/j.anai.2019.01.014
4. Bilo MB, Martini M, Tontini C, Corsi A, and Antonicelli L. Anaphylaxis. Eur Ann Allergy Clin Immunol. (2021) 53:4–17. doi: 10.23822/EurAnnACI.1764-1489.158
5. Mikhail I, Stukus DR, and Prince BT. Fatal anaphylaxis: epidemiology and risk factors. Curr Allergy Asthma Rep. (2021) 21:28. doi: 10.1007/s11882-021-01006-x
6. Robinson LB, Arroyo AC, Faridi MK, Rudders S, and Camargo CA Jr. Trends in US emergency department visits for anaphylaxis among infants and toddlers: 2006-2015. J Allergy Clin Immunol Pract. (2021) 9:1931–1938 e2. doi: 10.1016/j.jaip.2021.01.010
7. Rudders SA, Banerji A, Vassallo MF, Clark S, and Camargo CA Jr. Trends in pediatric emergency department visits for food-induced anaphylaxis. J Allergy Clin Immunol. (2010) 126:385–8. doi: 10.1016/j.jaci.2010.05.018
8. Toy D, Braga MS, Greenhawt M, and Shaker M. An update on allergic emergencies. Curr Opin Pediatr. (2019) 31:426–32. doi: 10.1097/MOP.0000000000000769
9. Kawahara T, Tezuka J, Ninomiya T, Honjo S, Masumoto N, Nanishi M, et al. Risk prediction of severe reaction to oral challenge test of cow’s milk. Eur J Pediatr. (2019) 178:181–8. doi: 10.1007/s00431-018-3274-z
10. Koplin JJ, Perrett KP, and Sampson HA. Diagnosing peanut allergy with fewer oral food challenges. J Allergy Clin Immunol Pract. (2019) 7:375–80. doi: 10.1016/j.jaip.2018.11.010
11. Peters RL, Allen KJ, Dharmage SC, Tang MLK, Koplin JJ, Ponsonby AL, et al. Skin prick test responses and allergen-specific IgE levels as predictors of peanut, egg, and sesame allergy in infants. J Allergy Clin Immunol. (2013) 132:874–80. doi: 10.1016/j.jaci.2013.05.038
12. Sicherer SH. Epidemiology of food allergy. J Allergy Clin Immunol. (2011) 127:594–602. doi: 10.1016/j.jaci.2010.11.044
13. Calvani M, Berti I, Fiocchi A, Galli E, Giorgio V, Martelli A, et al. Oral food challenge: safety, adherence to guidelines and predictive value of skin prick testing. Pediatr Allergy Immunol. (2012) 23:755–61. doi: 10.1111/pai.12016
14. Bird JA, Leonard S, Groetch M, Assa'ad A, Cianferoni A, Clark A, et al. Conducting an oral food challenge: an update to the 2009 adverse reactions to foods committee work group report. J Allergy Clin Immunol Pract. (2020) 8:75–90 e17. doi: 10.1016/j.jaip.2019.09.029
15. Alexander H, Brown S, Danby S, and Flohr C. Research techniques made simple: transepidermal water loss measurement as a research tool. J Invest Dermatol. (2018) 138:2295–2300 e1. doi: 10.1016/j.jid.2018.09.001
16. Berardesca E, Loden M, Serup J, Masson P, and Rodrigues LM. The revised EEMCO guidance for the in vivo measurement of water in the skin. Skin Res Technol. (2018) 24:351–8. doi: 10.1111/srt.12599
17. Schuler C, O’Shea KM, Troost JP, Kaul B, Launius CM, Cannon J, et al. Transepidermal water loss rises before food anaphylaxis and predicts food challenge outcomes. J Clin Invest. (2023) 133. doi: 10.1172/JCI168965
18. Miyamoto T, Komuro M, Aihara R, Ohira C, Kaneki M, Iwashita N, et al. Short-Term Oral Administration of 1.5 mug/kg bw/day of Deoxynivalenol Significantly Exacerbates Inflammatory and Itching Symptoms in a Mouse Model of Imiquimod-Induced Psoriasis. Toxins (Basel). (2025) 17:47. doi: 10.3390/toxins17020047
19. Yang CC, Hung YL, Ko WC, Tsai YJ, Chang JF, Liang CW, et al. Effect of neferine on DNCB-induced atopic dermatitis in haCaT cells and BALB/c mice. Int J Mol Sci. (2021) 22. doi: 10.3390/ijms22158237
20. Yun HR, Ahn SW, Seol B, Vasileva EA, Mishchenko, Fedoreyev SA, et al. Echinochrome A treatment alleviates atopic dermatitis-like skin lesions in NC/nga mice via IL-4 and IL-13 suppression. Mar Drugs. (2021) . doi: 10.3390/md19110622
21. Nomoto K, Itaya Y, Watanabe K, Yamashita T, Okazaki T, and Tokudome Y. Epidermal permeability barrier function and sphingolipid content in the skin of sphingomyelin synthase 2 deficient mice. Exp Dermatol Aug. (2018) 27:827–32. doi: 10.1111/exd.13497
22. Kim TY, Park NJ, Jegal J, Choi S, Lee SW, Hang J, et al. Chamaejasmine isolated from wikstroemia dolichantha diels suppresses 2,4-dinitrofluoro-benzene-induced atopic dermatitis in SKH-1 hairless mice. Biomolecules. (2019) 9:697. doi: 10.3390/biom9110697
23. Kazemi S, Danisman E, and Epstein MM. Animal models for the study of food allergies. Curr Protoc. (2023) 3:e685. doi: 10.1002/cpz1.685
24. Ahrens R, Osterfeld H, Wu D, Chen CY, Arumugam, Groschwitz, et al. Intestinal mast cell levels control severity of oral antigen-induced anaphylaxis in mice. Am J Pathol Apr. (2012) 180:1535–46. doi: 10.1016/j.ajpath.2011.12.036
25. Kawakami Y, Sielski R, and Kawakami T. Mouse body temperature measurement using infrared thermometer during passive systemic anaphylaxis and food allergy evaluation. J Vis Exp. (2018) 139:58391. doi: 10.3791/58391
26. Lexmond WS, Goettel JA, Sallis BF, McCann K, Rings EHHM, Jensen-Jarolim E, et al. Spontaneous food allergy in Was(-/-) mice occurs independent of FcepsilonRI-mediated mast cell activation. Allergy Dec. (2017) 72:1916–24. doi: 10.1111/all.13219
27. Marco-Martin G, La Rotta Hernandez A, Vazquez de la Torre M, Higaki Y, Zubeldia JM, and Baeza ML. Differences in the anaphylactic response between C3H/heOuJ and BALB/c mice. Int Arch Allergy Immunol. (2017) 173:204–12. doi: 10.1159/000478983
28. Smeekens JM and Kulis MD. Mouse models of food allergy in the pursuit of novel treatment modalities. Front Allergy. (2021) 2:810067. doi: 10.3389/falgy.2021.810067
29. Clark A, Mangat J, King Y, Islam S, Anagnostou K, Foley L, et al. Thermographic imaging during nasal peanut challenge may be useful in the diagnosis of peanut allergy. Allergy Apr. (2012) 67:574–6. doi: 10.1111/j.1398-9995.2012.02788.x
30. Clark AT, Mangat JS, Tay SS, King Y, Monk CJ, White PA, et al. Facial thermography is a sensitive and specific method for assessing food challenge outcome. Allergy. (2007) 62:744–9. doi: 10.1111/j.1398-9995.2007.01363.x
31. Luo J, Chen Q, Min S, and Yu J. Perioperative anaphylaxis from a perspective of temperature. J Invest Surg. (2022) 35:833–40. doi: 10.1080/08941939.2021.1922553
32. Makabe-Kobayashi Y, Hori Y, Adachi T, Ishigaki-Suzuki S, Kikuchi Y, Kagaya Y, et al. The control effect of histamine on body temperature and respiratory function in IgE-dependent systemic anaphylaxis. J Allergy Clin Immunol. (2002) 110:298–303. doi: 10.1067/mai.2002.125977
33. Ballesteros-Martinez C, Mendez-Barbero N, Montalvo-Yuste A, Jensen BM, Gomez-Cardenosa A, Klitfod L, et al. Endothelial regulator of calcineurin 1 promotes barrier integrity and modulates histamine-induced barrier dysfunction in anaphylaxis. Front Immunol. (2017) 8:1323. doi: 10.3389/fimmu.2017.01323
34. Mendez-Barbero N, Yuste-Montalvo A, Nunez-Borque E, Jensen BM, Guitierrez-Munoz C, Tome-Amat J, et al. The TNF-like weak inducer of the apoptosis/fibroblast growth factor-inducible molecule 14 axis mediates histamine and platelet-activating factor-induced subcutaneous vascular leakage and anaphylactic shock. J Allergy Clin Immunol. (2020) 145:583–596 e6. doi: 10.1016/j.jaci.2019.09.019
35. Mikelis CM, Simaan M, Ando K, Fukuhara S, Sakurai A, Amornphimoltham P, et al. RhoA and ROCK mediate histamine-induced vascular leakage and anaphylactic shock. Nat Commun. (2015) 6:6725. doi: 10.1038/ncomms7725
36. Krempski J, Yamani A, Thota LNR, Marella S, Ganesan V, Sharma A, et al. IL-4-STAT6 axis amplifies histamine-induced vascular endothelial dysfunction and hypovolemic shock. J Allergy Clin Immunol. (2024) 154:719–34. doi: 10.1016/j.jaci.2024.05.009
37. Nunez-Borque E, Betancor D, Pastor-Vargas C, Fernandez-Bravo S, Martin-Blazquez A, Casado-Navarro N, et al. Personalized diagnostic approach and indirect quantification of extravasation in human anaphylaxis. Allergy. (2023) 78:202–13. doi: 10.1111/all.15443
38. Ramu S, Akbarshahi H, Mogren S, Berlin F, Cerps S, Menzel M, et al. Direct effects of mast cell proteases, tryptase and chymase, on bronchial epithelial integrity proteins and anti-viral responses. BMC Immunol. (2021) 22:35. doi: 10.1186/s12865-021-00424-w
Keywords: food allergy, anaphylaxis, transepidermal water loss (TEWL), food anaphylaxis, biomarker
Citation: Woerner BN, Abbo J, Wang A, Donahue MK, Hines J, O’Konek J, Hogan SP, Baker JR Jr and Schuler CF IV (2025) Transepidermal water loss increases during murine food anaphylaxis and reflects reaction severity. Front. Immunol. 16:1667569. doi: 10.3389/fimmu.2025.1667569
Received: 16 July 2025; Accepted: 15 September 2025;
Published: 02 October 2025.
Edited by:
Peisong Gao, Johns Hopkins University, United StatesReviewed by:
Timothy Paul Moran, University of North Carolina at Chapel Hill, United StatesSahar Kazemi, Medical University of Vienna, Austria
Copyright © 2025 Woerner, Abbo, Wang, Donahue, Hines, O’Konek, Hogan, Baker and Schuler. This is an open-access article distributed under the terms of the Creative Commons Attribution License (CC BY). The use, distribution or reproduction in other forums is permitted, provided the original author(s) and the copyright owner(s) are credited and that the original publication in this journal is cited, in accordance with accepted academic practice. No use, distribution or reproduction is permitted which does not comply with these terms.
*Correspondence: Charles F. Schuler IV, c2NodWxlcmNAbWVkLnVtaWNoLmVkdQ==