 Krzysztof Przęczek
 Dorota Cibor1
- 1Department of Gastroenterology and Hepatology, Faculty of Medicine, Jagiellonian University Medical College, Krakow, Poland
- 2Doctoral School of Medical and Health Sciences, Jagiellonian University Medical College, Krakow, Poland
Introduction: Endothelial dysfunction is a recognized component of the pathogenesis and clinical course of inflammatory bowel disease (IBD). Measurement of soluble forms of cell adhesion molecules (CAMs) may reflect the extent of endothelial injury and serve as potential biomarkers of disease activity. We conducted a systematic review and meta-analysis of studies reporting soluble intercellular adhesion molecule−1 (sICAM−1), vascular cell adhesion molecule−1 (sVCAM−1), mucosal addressin cell adhesion molecule−1 (sMAdCAM−1), and selectins (sE−selectin, sP−selectin, and sL−selectin) in patients with IBD and healthy controls, or in comparable IBD subgroups defined by disease activity or type.
Methods: We systematically searched PubMed, Embase, Web of Science, and Scopus from inception to June 15, 2025. Risk of bias was assessed using a modified Newcastle–Ottawa Scale.
Results: Twenty-six studies met the inclusion criteria. Compared with healthy controls, patients with IBD showed higher levels of sICAM-1 (SMD 1.38, 95% CI 0.51 to 2.25, p=0.002) and sE-selectin (SMD 0.35, 95% CI 0.09 to 0.61, p=0.008). In subgroup analyses, this association persisted for sICAM-1 in both Crohn’s disease (CD) (SMD 1.89, 95% CI 0.15 to 3.62, p=0.033) and ulcerative colitis (UC) (SMD 0.95, 95% CI 0.25 to 1.64, p=0.008), and for sE-selectin only in CD (SMD 0.43, 95% CI 0.04 to 0.82, p=0.032). When comparing active and inactive disease, higher sICAM-1 levels were observed in the active group (SMD 0.75, 95% CI 0.38 to 1.12, p<0.001), while no significant differences were found for other CAMs. No differences in levels of these molecules were observed between CD and UC.
Conclusions: Circulating CAMs, particularly sICAM-1 and sE-selectin, are elevated in IBD patients, supporting a role of endothelial injury in disease pathogenesis. Among these, sICAM-1 shows potential as a biomarker for distinguishing active from inactive disease.
Systematic Review Registration: https://www.crd.york.ac.uk/PROSPERO/, identifier CRD420251088622.
1 Introduction
Inflammatory bowel disease (IBD) comprises a group of chronic gastrointestinal disorders characterized by alternating periods of exacerbation and remission. The two primary subtypes are ulcerative colitis (UC), which is typically confined to the colon and manifests clinically with diarrhea and rectal bleeding, and Crohn’s disease (CD), which can affect any segment of the gastrointestinal tract and may lead to complications such as fistulas, strictures, and abscesses (1). Importantly, both during active phases and remission, IBD may be associated with a range of extraintestinal manifestations, including malnutrition, anemia, arthritis, dermatologic lesions, hepatobiliary disorders, and cardiovascular complications, notably venous thromboembolic events (2–6). IBD occurs more frequently in industrialized countries; however, epidemiological data indicate a global increase in incidence, affecting both developed and developing regions worldwide (7). The pathogenesis of IBD is multifactorial and not yet fully understood. It involves genetic susceptibility, environmental factors, disturbances in the gut microbiota, immune dysregulation, and endothelial dysfunction (ED) (1, 8, 9). The vascular endothelium plays a crucial role in multiple physiological processes, including the regulation of coagulation, cell proliferation and angiogenesis, leukocyte migration, and the inflammatory response. ED, primarily associated with a decrease in production or activity of the vasodilator nitric oxide (NO), leads to increased expression of cell adhesion molecules (CAMs), elevated vascular wall permeability, and augmented leukocyte transmigration (10–13).
The main groups of CAMs include integrins, selectins, and the immunoglobulin superfamily of CAMs, which encompasses, e.g., intercellular adhesion molecule-1 (ICAM-1), vascular cell adhesion molecule-1 (VCAM-1), and mucosal addressin cell adhesion molecule-1 (MAdCAM-1) (14). Selectins exist in three forms: L-selectin, expressed on leukocytes; E-selectin, expressed on activated endothelial cells; and P-selectin, found on activated platelets and endothelial cells. Selectins participate in the initial phase of the adhesion cascade by mediating the rolling of leukocytes along the vascular endothelium (15, 16). During inflammatory conditions, the expression of ICAM-1 is upregulated, and its primary ligands are leukocyte-specific β2 integrins, CD11 and CD18. Similarly, VCAM-1 is upregulated and interacts with the α4β1 integrin, which is expressed on leukocytes (17, 18). MAdCAM-1 is predominantly expressed on activated endothelial cells in the intestinal mucosa and interacts with the α4β7 integrin present on the surface of lymphocytes (19, 20). Soluble forms of the aforementioned adhesion molecules serve as biomarkers of endothelial activation and function in various diseases, including IBD (17, 21–24).
To evaluate the utility of selected soluble CAMs as disease biomarkers, we conducted a systematic review and meta-analysis of studies assessing their serum and plasma concentrations in patients with IBD compared to healthy controls, with primary outcomes focused on differences between IBD patients and controls, and secondary outcomes including comparisons between CD and UC as well as between active and inactive disease states.
2 Materials and methods
This study was conducted in accordance with the Preferred Reporting Items for Systematic Reviews and Meta-Analyses (PRISMA) guidelines (25). The study protocol was registered in the International Prospective Register of Systematic Reviews (PROSPERO registration number: CRD420251088622).
2.1 Search strategy
We systematically searched PubMed, Embase, Web of Science, and Scopus from their inception to June 15, 2025, using the following search terms: (“ICAM” OR “Intercellular Adhesion Molecule” OR “sICAM” OR “VCAM” OR “sVCAM” OR “Vascular cell adhesion molecule” OR “Mucosal vascular addressin cell adhesion molecule” OR “MAdCAM” OR “sMAdCAM” OR “selectin” OR “L-selectin” OR “sL-selectin” OR “P-selectin” OR “sP-selectin” OR “E-selectin” OR “sE-selectin” OR “CD62L” OR “CD62P” OR “CD62E” OR “sCD62L” OR “sCD62P” OR “sCD62E”) AND (“Crohn” OR “ulcerative colitis” OR “inflammatory bowel disease” OR “IBD” OR “Crohn’s disease”). In addition, the reference lists of the included studies were manually reviewed to identify any additional eligible publications. Duplicate records were removed using the Bramer method in EndNote (26).
2.2 Eligibility criteria
The inclusion criteria were as follows: (1) measurement of serum or plasma concentrations of soluble forms of ICAM-1, VCAM-1, MAdCAM-1, E-selectin, P-selectin, or L-selectin; (2) a case–control design including either a healthy control group and IBD patients, a comparison between CD and UC patients, or a comparison between active and inactive IBD patients; (3) participants aged over 18 years; (4) study groups comprising at least five individuals; (5) publication written in English; and (6) full-text availability. Studies were excluded if they met any of the following criteria: (1) review articles, letters to the editor, case reports, or conference abstracts; (2) inclusion of patients with other inflammatory, ischemic, or neoplastic bowel diseases; or (3) duplicate publications or insufficient data for analysis.
2.3 Data extraction
Each abstract was independently screened by two reviewers (KP and DC). If considered potentially relevant, the full-text article was retrieved and evaluated for further assessment. Any disagreements between reviewers were resolved by a third reviewer (DO). From the included studies, the following data were extracted: country of study, year of publication, participant age, male-to-female ratio, biomarker analyzed with units, assay method, IBD subtype, disease activity, disease phenotype, and treatment details. When data were not reported in numerical form, values were extracted from graphs using WebPlotDigitizer (version 5.2; Ankit Rohatgi, CA, USA). Medians, interquartile ranges (IQRs), and complete ranges were converted to means and standard deviations using validated statistical methods (27, 28).
2.4 Bias assessment
Risk of bias was assessed using a modified Newcastle-Ottawa Scale (NOS) for case-control studies. Since the non-response rate was not applicable, the maximum attainable score was 8 points (29, 30). Studies were categorized based on their NOS scores as follows: 0–3 points indicated low quality with high risk of bias, 4–6 points indicated moderate quality and risk, and 7–8 points indicated high quality with low risk of bias. In studies lacking a healthy control group, comparisons were made between the groups being studied, such as CD vs UC or inactive vs active disease.
2.5 Statistical analysis
The primary outcome was the difference in biomarkers concentrations between patients with IBD and healthy controls, with subgroup analyses conducted separately for CD and UC. Secondary outcomes included comparisons between CD and UC, as well as between active and inactive IBD. Heterogeneity between studies was assessed using Cochran’s Q test, with a significance level set at p<0.10 (31). The degree of heterogeneity was quantified using the I² statistic, and categorized as low (<25%), moderate (25–75%), or high (>75%) (32, 33). Due to substantial heterogeneity observed across most studies, a random-effects model was applied to calculate standardized mean differences (SMDs) along with 95% confidence intervals (CIs) (34). Hedges’ correction was used to adjust for small-sample bias. The effect size was considered small for SMD<0.5, moderate for SMD between 0.5 and 0.8, and large for SMD>0.8. A p-value of <0.05 was considered statistically significant (33). Forest plots were generated from the calculated SMDs to visualize effect sizes across studies. Sensitivity analysis was performed by sequentially removing each study to assess its influence on the overall effect size. Publication bias was evaluated using Begg’s rank correlation test and Egger’s regression asymmetry test, and visually assessed using funnel plots, when at least ten studies were included (35, 36). When publication bias was suggested, the Duval and Tweedie “trim-and-fill” method was applied to estimate the potential impact of missing studies (37). Subgroup analyses were performed for biomarkers reported in at least five studies to investigate potential differences in effect sizes across disease types and disease activity levels. Meta-regression was not performed due to the limited number of included studies and the insufficient reporting of demographic and clinical data. Statistical analyses were performed using STATA version 19 (StataCorp LLC, College Station, TX, USA).
3 Results
3.1 Study selection
A total of 4,129 records were identified; 2,316 duplicates were removed, and 1,763 records were excluded after screening titles and abstracts. Among the remaining 50 articles, three could not be retrieved, eleven did not include relevant comparisons, four were conducted in populations under 18 years old, two lacked a case–control design, two were not available in English, and two had missing data. A total of 26 studies (13, 38–62) were included in the meta-analysis (Table 1). The flow chart of the selection process is presented in Figure 1. The risk of bias was rated as low in thirteen studies (13, 39, 40, 44, 45, 47, 50, 52, 53, 57, 58, 61, 62), moderate in twelve (41–43, 46, 48, 49, 51, 54–56, 59, 60), and high in one study (38) (Table 2).
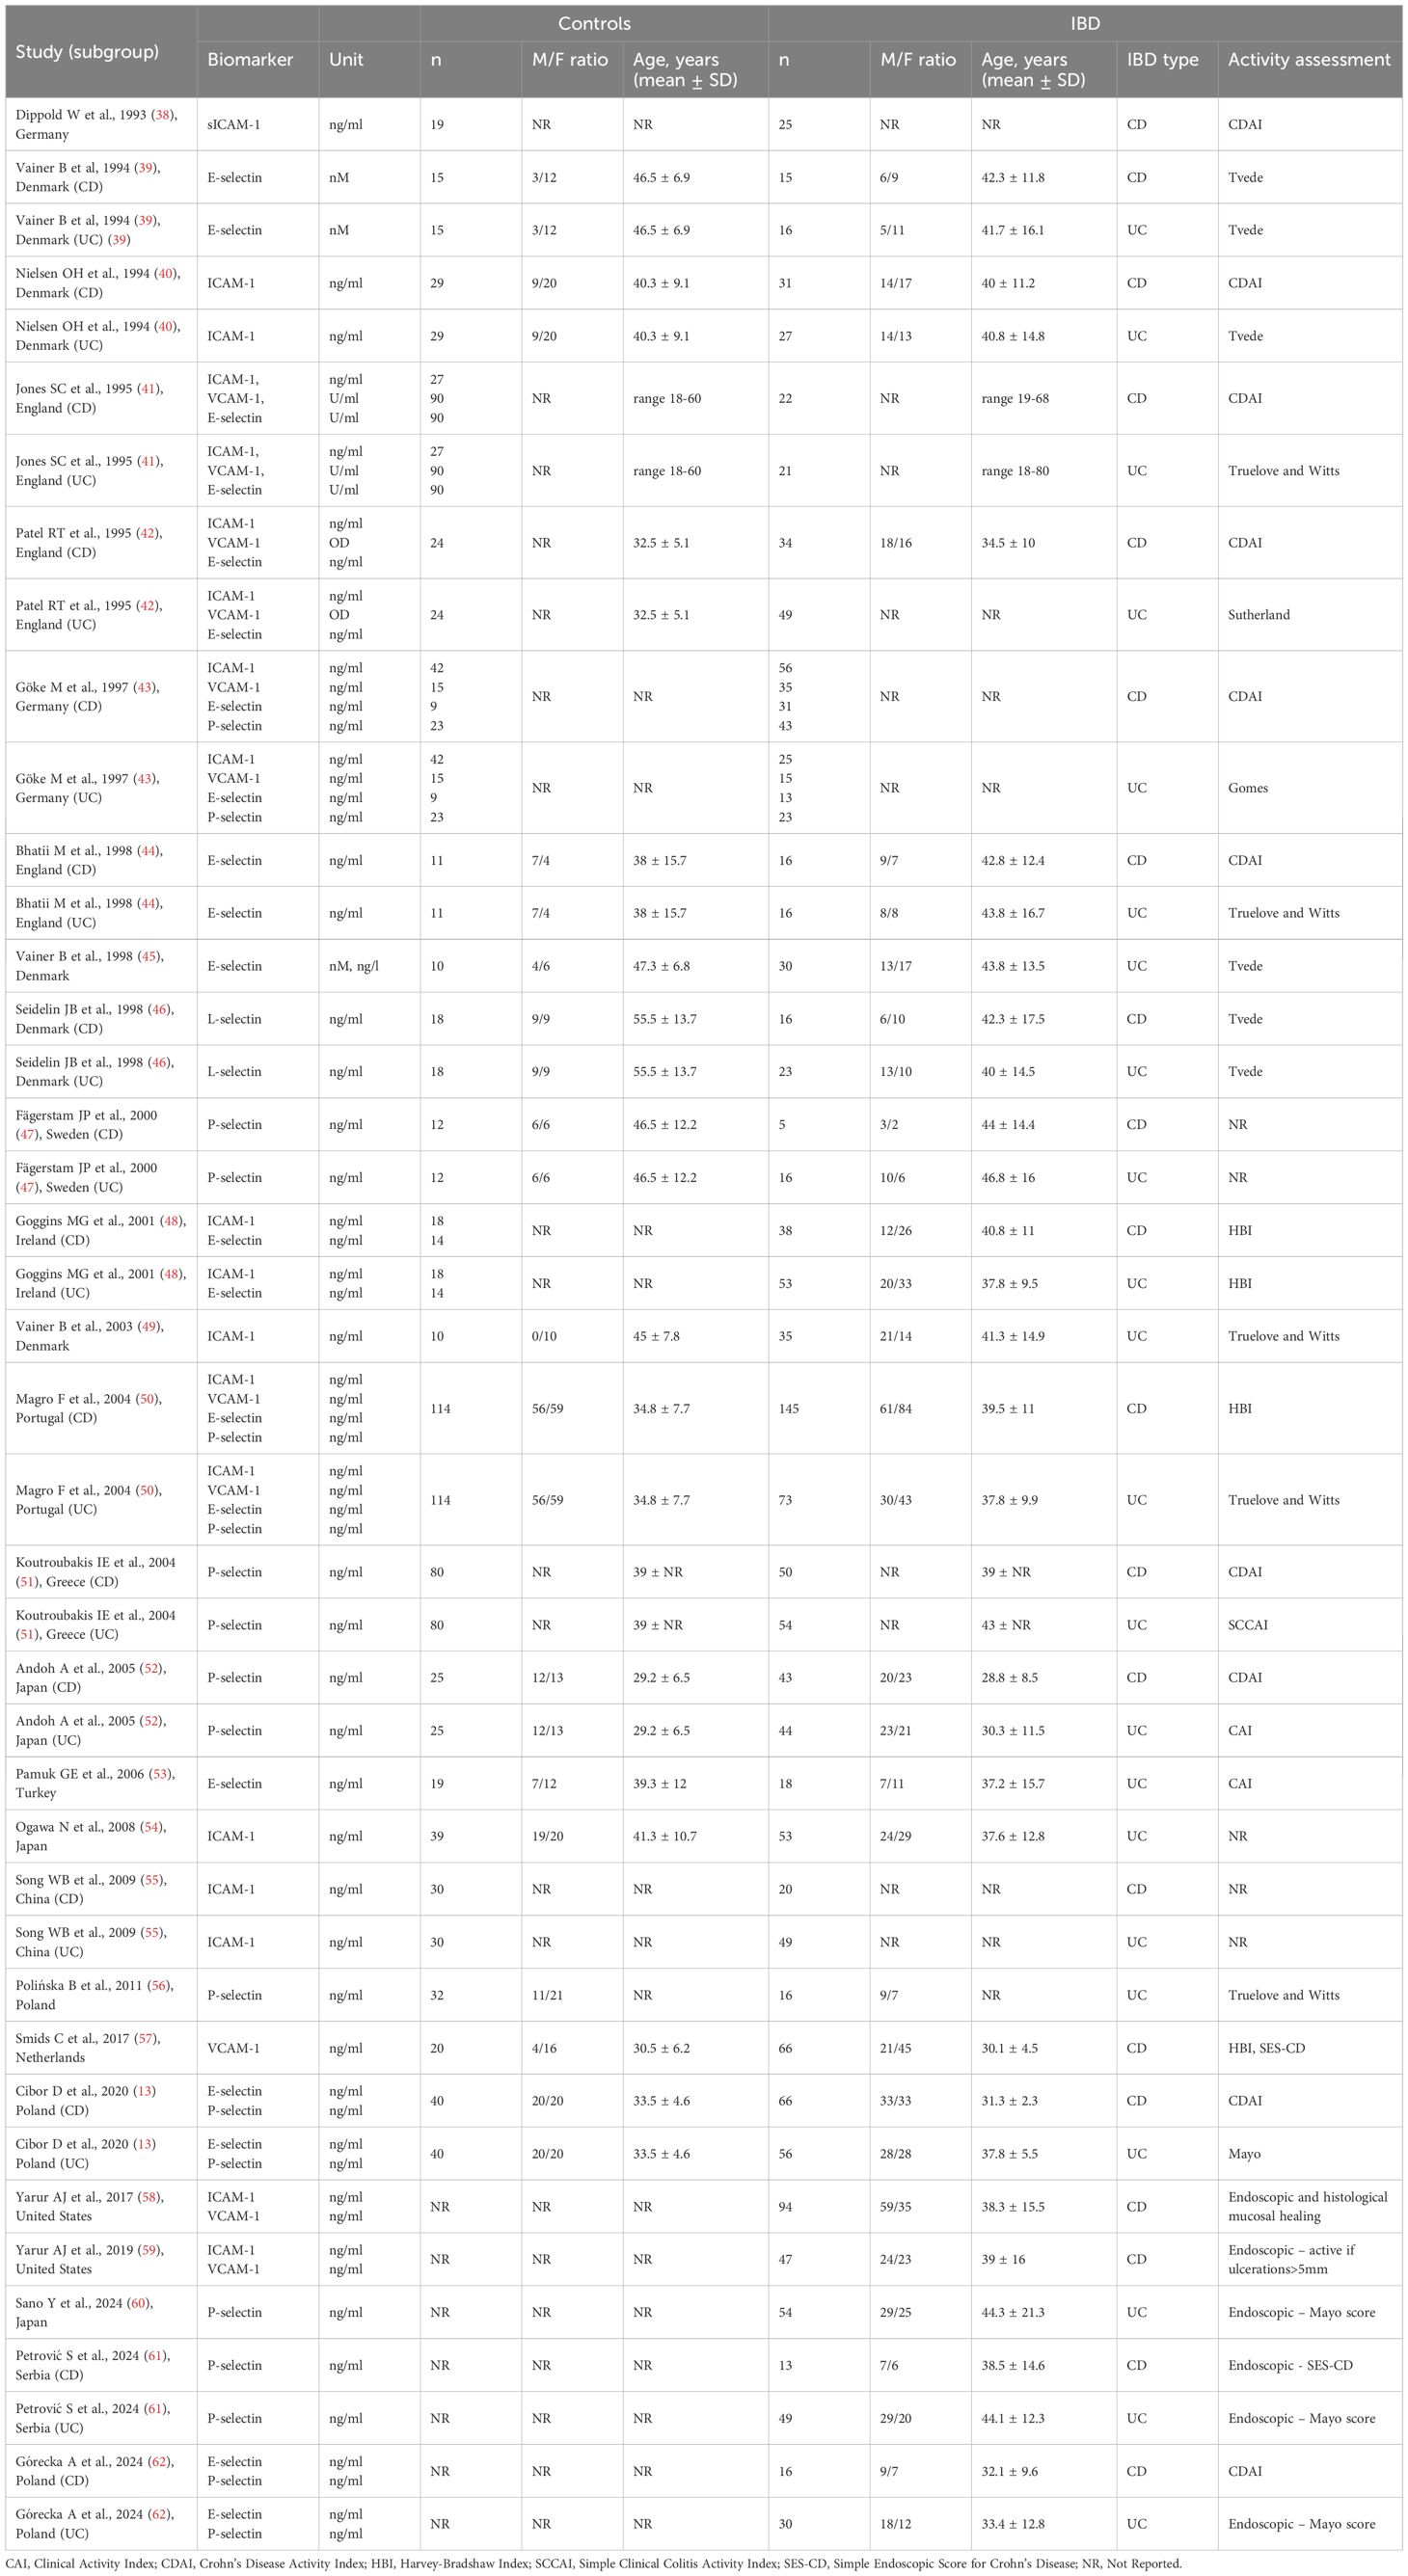
Table 1. Main characteristics of the studies included in the meta-analysis.
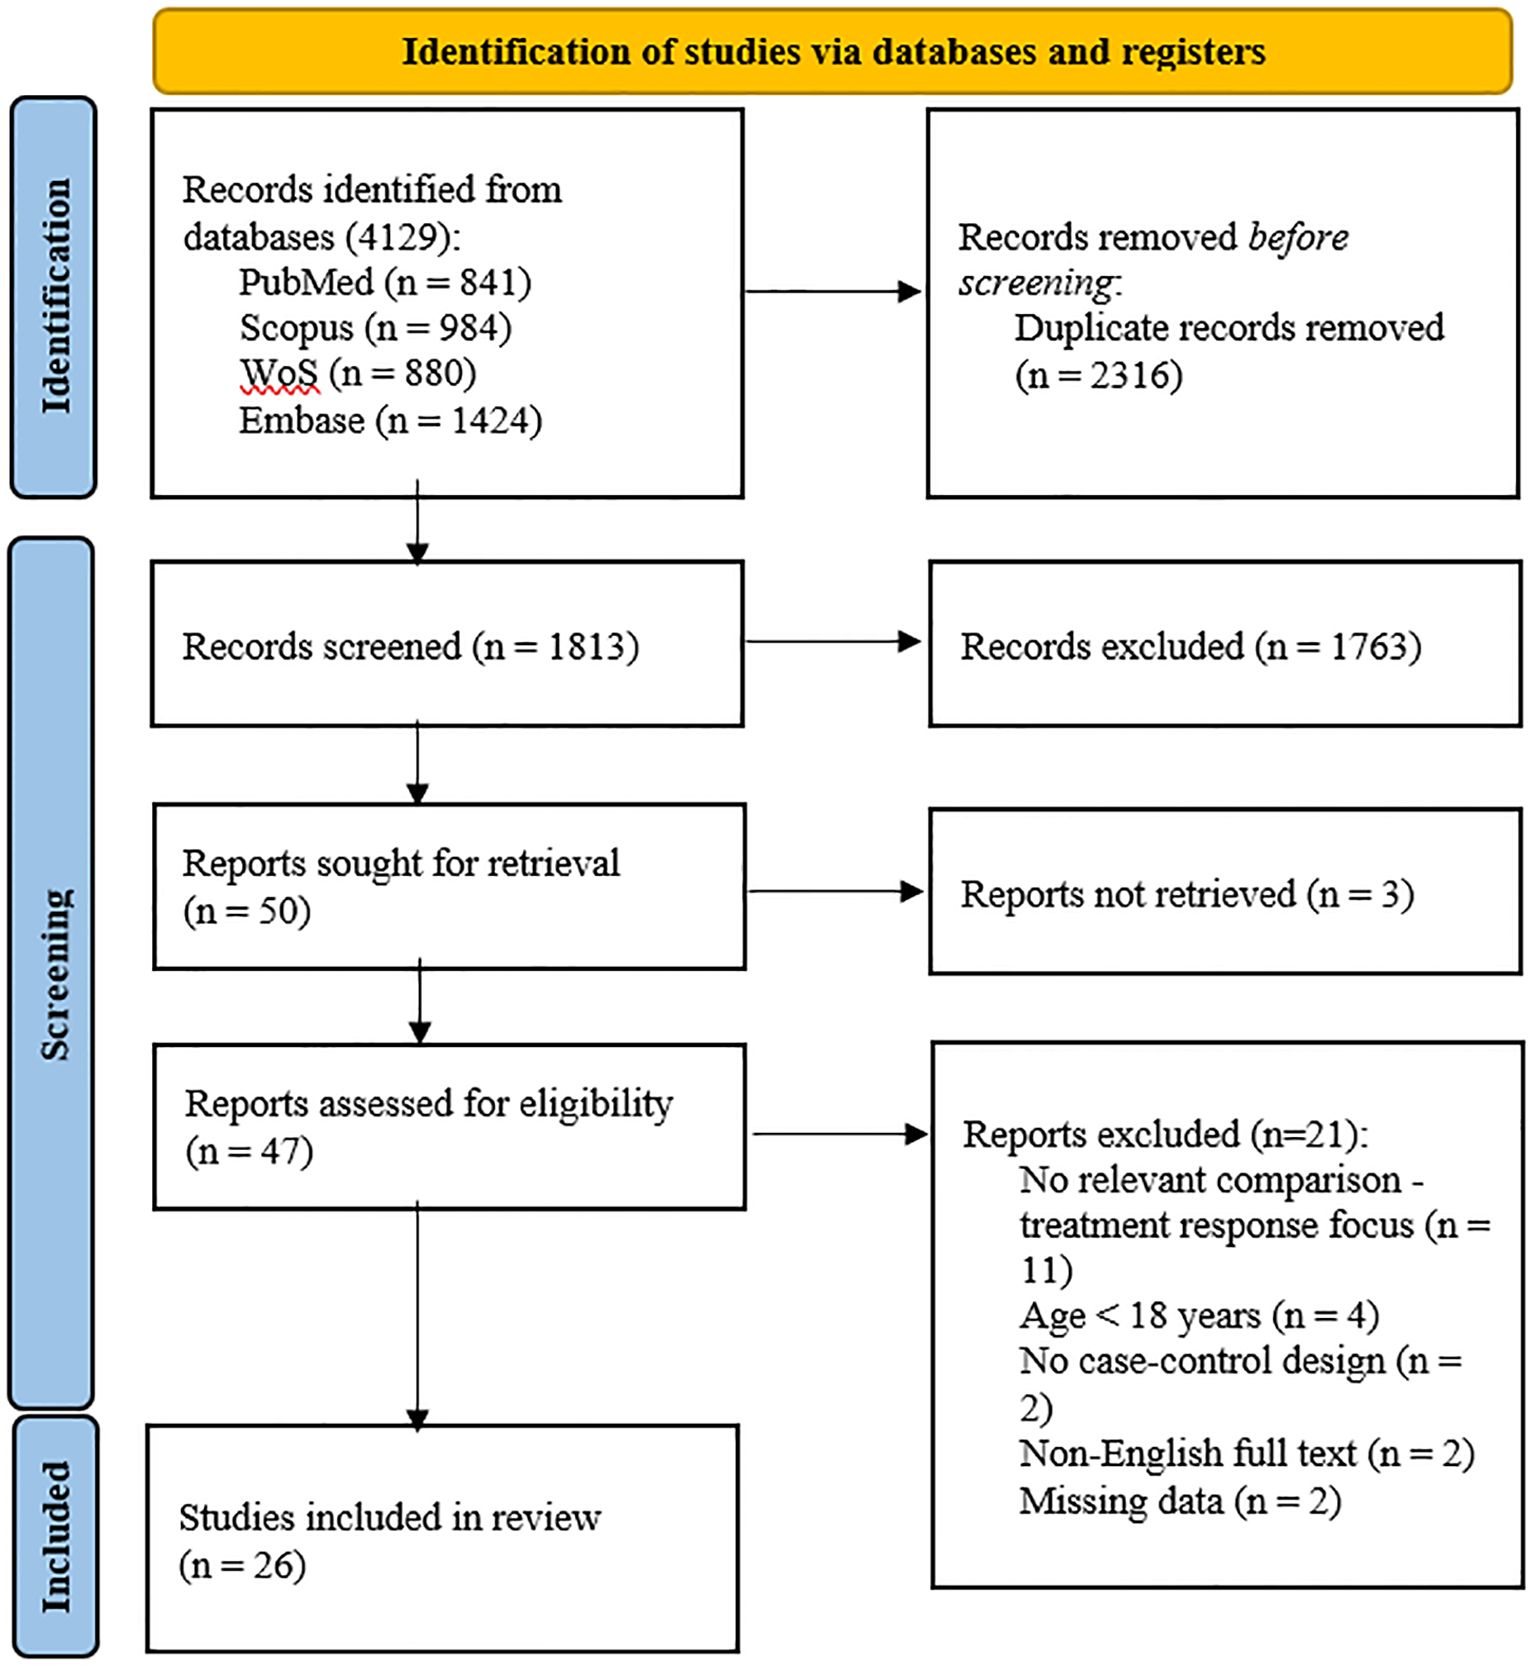
Figure 1. PRISMA 2020 flow diagram.
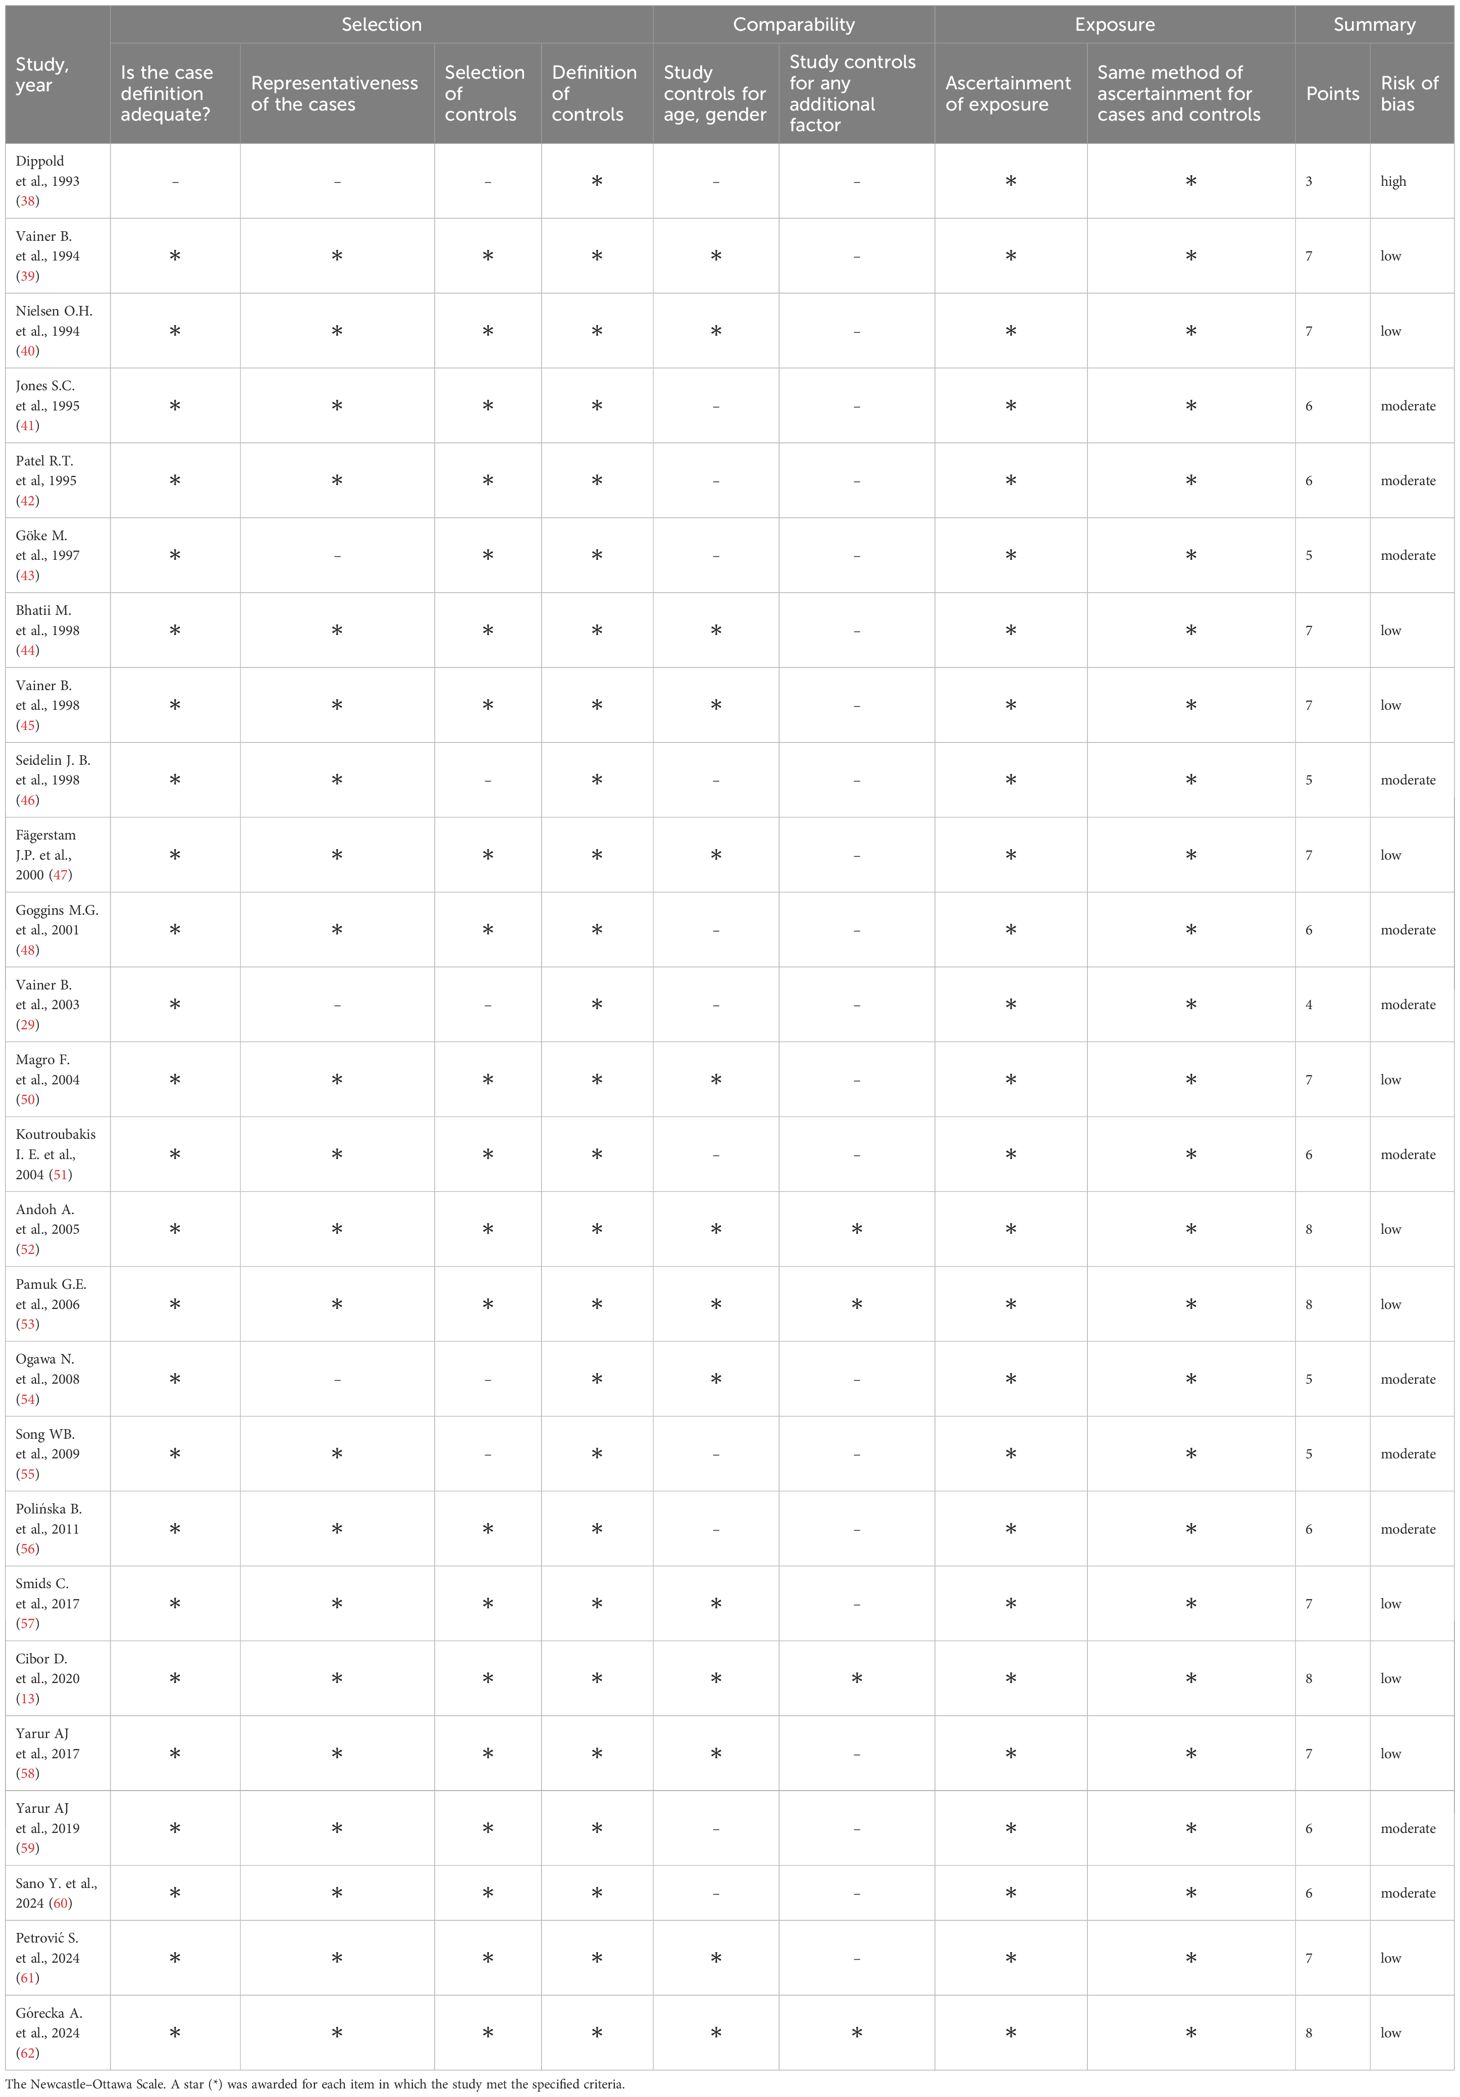
Table 2. The Newcastle-Ottawa Scale.
3.2 sICAM-1
Twelve studies (38, 40–43, 48–50, 54, 55, 58, 59) reported sICAM-1 concentrations, including a total of 364 healthy controls, 521 CD patients, and 388 UC patients. Seven studies (40–43, 48, 50, 55) included all three groups: healthy controls, CD, and UC patients; among these, five studies (40–42, 48, 50) further stratified the IBD groups according to disease activity. Two studies (39, 54) included only healthy controls and patients with inactive and active UC. One study (38) included healthy controls and patients with inactive and active CD. The remaining two studies (58, 59) compared only patients with inactive and active CD. The risk of bias was assessed as low in two studies (40, 50), moderate in nine studies (41–43, 48, 49, 54, 55, 58, 59), and high in one study (38) (Table 2). sICAM-1 concentration was significantly higher in the IBD group compared to controls (SMD 1.38, 95% CI 0.51 to 2.25, p=0.002; I² = 98.1%, p<0.001), and this association remained stable in the sensitivity analysis (SMD range 0.98 - 1.50). A significant publication bias was detected (Begg’s test, p<0.001; Egger’s test, p<0.001); however, the trim-and-fill method did not identify any potentially missing studies. When forced imputation was applied, six studies were imputed on the right side of the funnel plot, further increasing the overall SMD to 2.08 (95% CI 1.26 to 2.89). In the subgroup analysis, elevated sICAM-1 levels were consistently observed in both CD (SMD 1.89, 95% CI 0.15 to 3.62, p=0.033; I² = 98.8%, p<0.001) and UC patients (SMD 0.95, 95% CI 0.25 to 1.64, p=0.008; I² = 94.1%, p<0.001) (Figure 2). No difference in sICAM-1 concentrations was observed between the CD and UC groups (SMD -0.13, 95% CI -0.67 to 0.41, p=0.637; I² = 90.2%, p<0.001), and the result remained robust in the sensitivity analysis (SMD range -0.27 to 0.15). When comparing within the IBD group, sICAM-1 concentration was significantly higher in active IBD compared to inactive disease (SMD 0.75, 95% CI 0.38 to 1.12, p<0.001; I² = 81.4%, p<0.001), with no substantial changes observed in the sensitivity analysis (SMD range 0.59 - 0.82). Publication bias was not detected (Begg’s test, p=0.166; Egger’s test, p=0.088). Subgroup analysis demonstrated significantly higher sICAM-1 levels in active CD (SMD 0.92, 95% CI 0.39 to 1.45, p<0.001; I² = 83.2%, p<0.001) and UC (SMD 0.56, 95% CI 0.03 to 1.08, p = 0.037; I²=78.4%, p<0.001) compared to inactive disease.
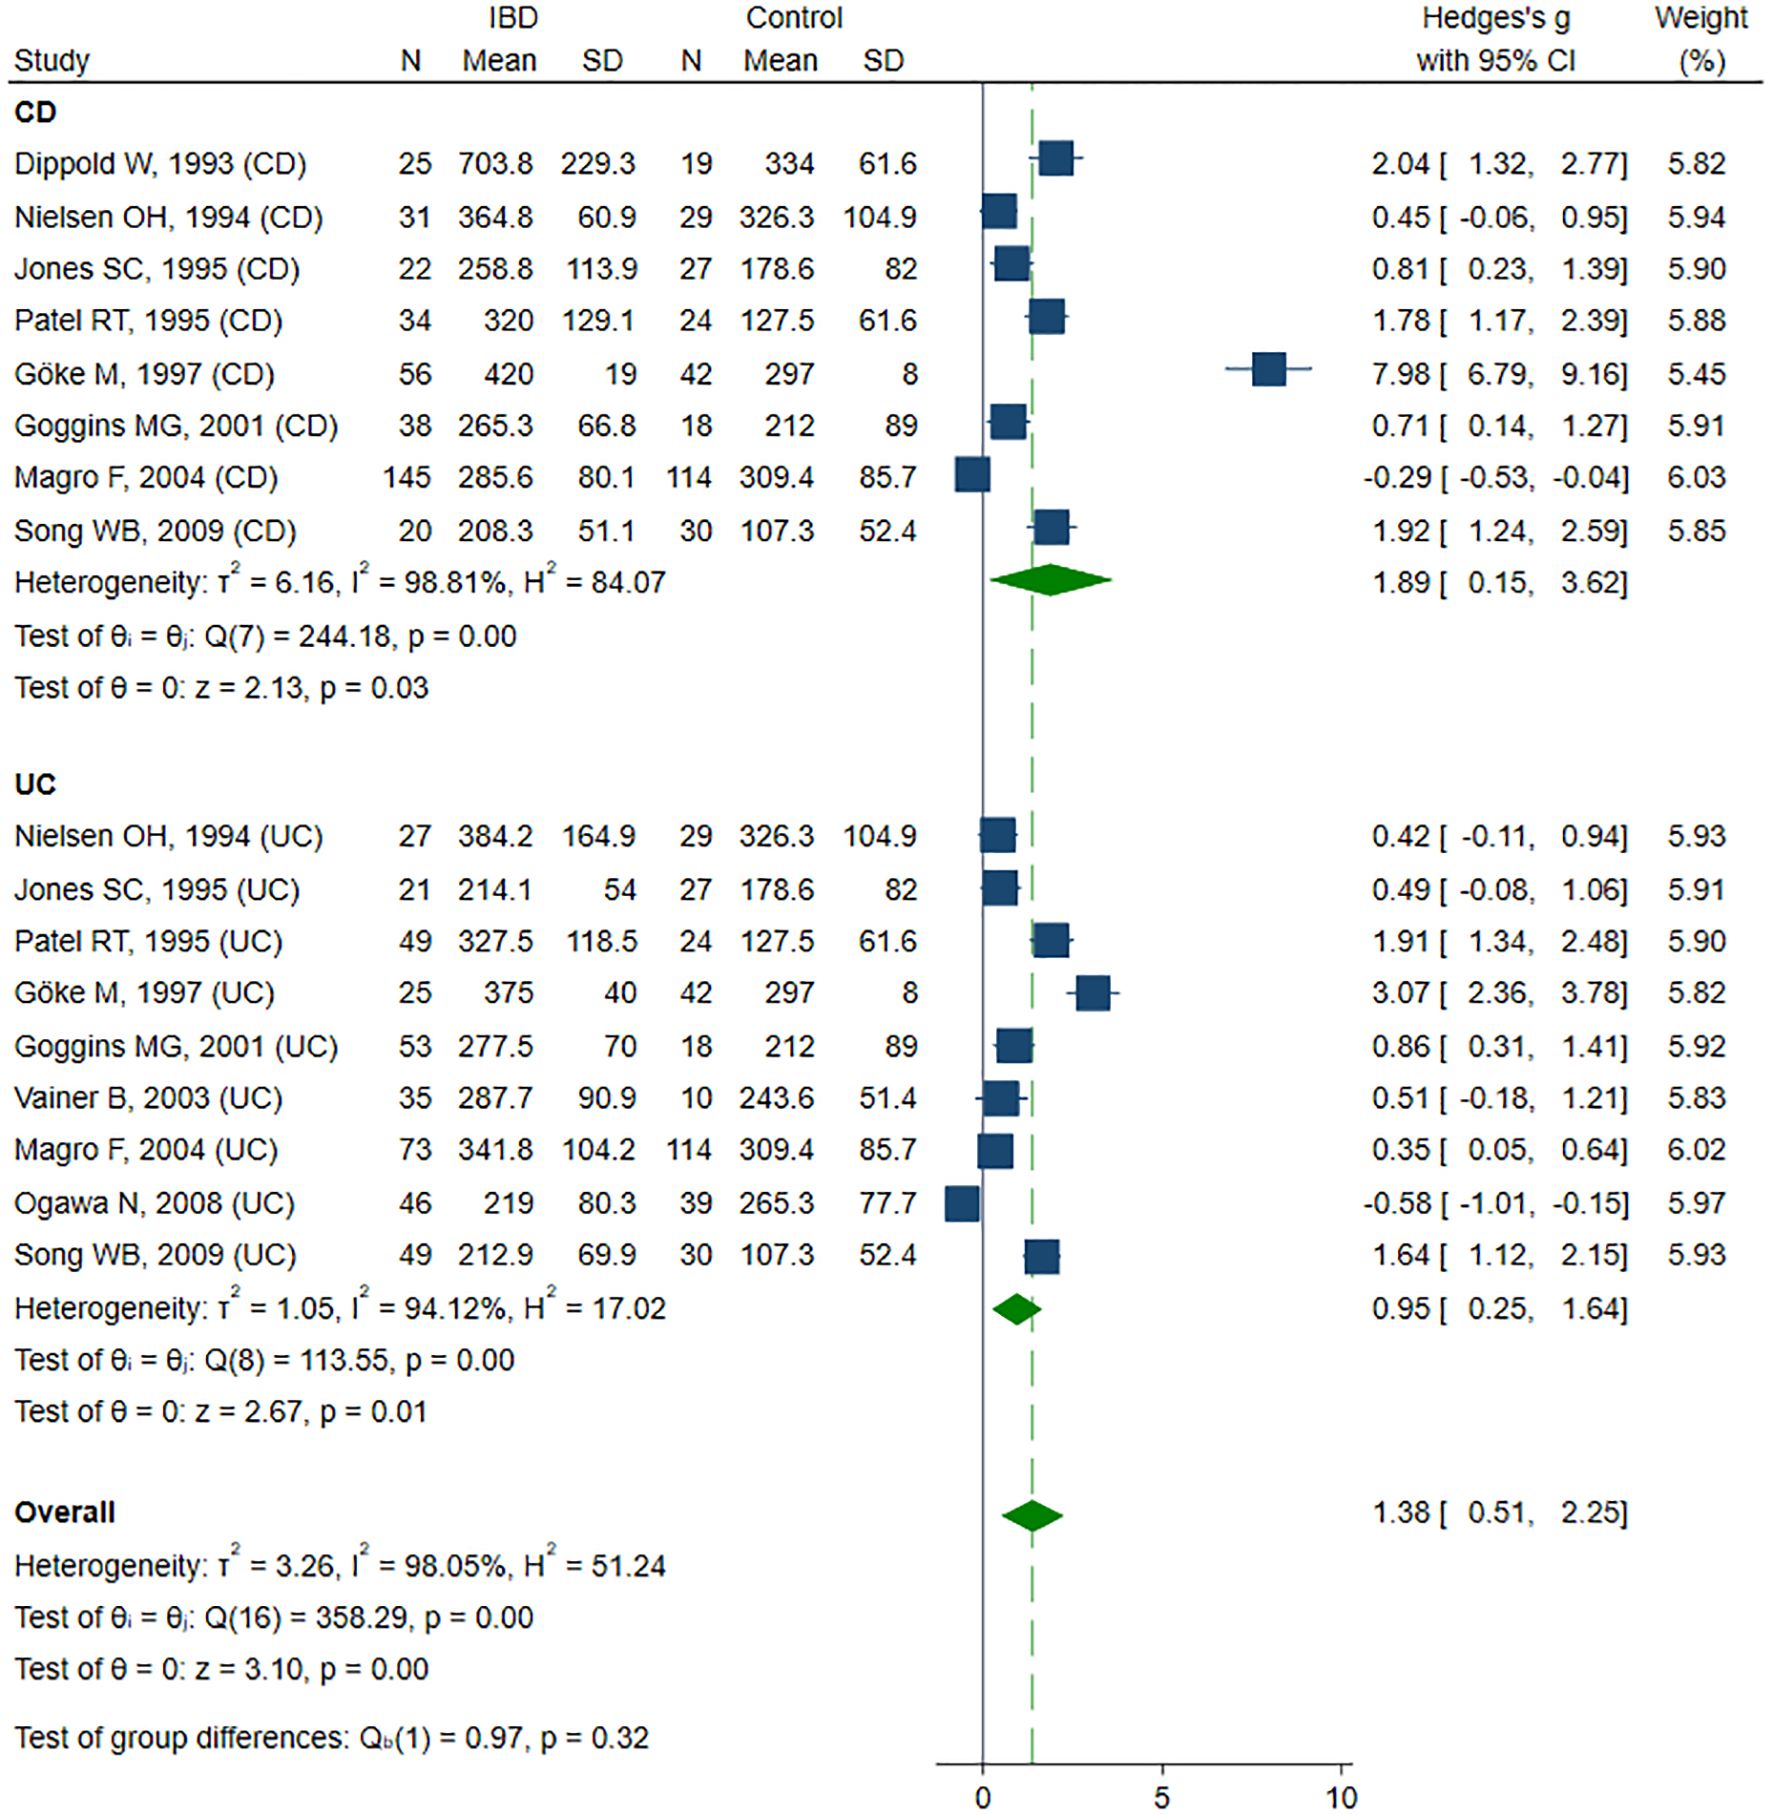
Figure 2. Forest plot of studies comparing sICAM-1 levels between IBD patients and healthy controls, with subgroup analysis for IBD.
3.3 sVCAM-1
sVCAM-1 levels were evaluated across seven studies (41–43, 50, 57–59), including a total of 263 healthy controls, 443 CD patients and 158 UC patients. Four studies (41–43, 50) included healthy controls, CD and UC patients, and in three of them (41, 42, 50), IBD was subdivided according to disease activity. One study (57) included only active and inactive CD, along with controls. Two studies (58, 59) compared sVCAM-1 levels exclusively between active and inactive CD. The risk of bias was rated as low in three studies (50, 57, 58) and as moderate in four (41–43, 59) (Table 2). SMD indicated a trend toward elevated sVCAM-1 levels in IBD patients, although the result was not statistically significant (SMD 1.11, 95% CI –0.25 to 2.47, p=0.109; I² = 98.7%, p<0.001). In sensitivity analyses (SMD range from 0.74 to 1.46), exclusion of the UC subgroup from the Magro study (50) revealed a significant increase in sVCAM-1 levels among IBD patients (SMD 1.46, 95% CI 0.13–2.78, p=0.031). Removal of the entire Magro study further confirmed a significant elevation in sVCAM-1 levels (SMD 1.73, 95% CI 0.32–3.14; p=0.016; I² = 97.7%, p<0.001). Subgroup analysis, despite a consistent trend toward higher sVCAM-1 levels in patients with IBD, did not reveal statistically significant differences in SMD for CD (SMD 1.01, 95% CI –0.53 to 2.56, p=0.198; I² = 98.2%, p<0.001) and UC (SMD 1.24, 95% CI –1.44 to 3.92, p=0.363; I² = 99.1%; p< 0.001) compared with controls (Figure 3). Exclusion of the Magro study did not alter the statistical significance of these findings. No significant difference in sVCAM-1 levels was observed between CD and UC patients (SMD 0.58, 95% CI –1.16 to 2.31, p=0.516; I² = 98%, p<0.001), and the result remained stable in sensitivity analysis (SMD range from –0.25 to 1.17). Comparison between patients with active and inactive IBD also revealed no statistically significant difference in sVCAM-1 concentrations (SMD 0.20, 95% CI –0.11 to 0.51, p=0.212; I² = 63.5%, p = 0.003). This finding was consistent in sensitivity analysis (SMD ranged from 0.09 to 0.29), although exclusion of the UC subgroup from the Patel study (42) resulted in a borderline significant difference favoring higher sVCAM-1 levels in the active disease group (SMD 0.29, 95% CI –0.001 to 0.58, p=0.050). Subgroup analyses showed no significant differences in sVCAM-1 levels between inactive and active disease in either CD (SMD 0.24, 95% CI –0.08 to 0.56, p=0.140; I² = 50.0%, p=0.071) or UC (SMD 0.24, 95% CI –0.75 to 1.22, p=0.636; I² = 86.8%, p=0.004).
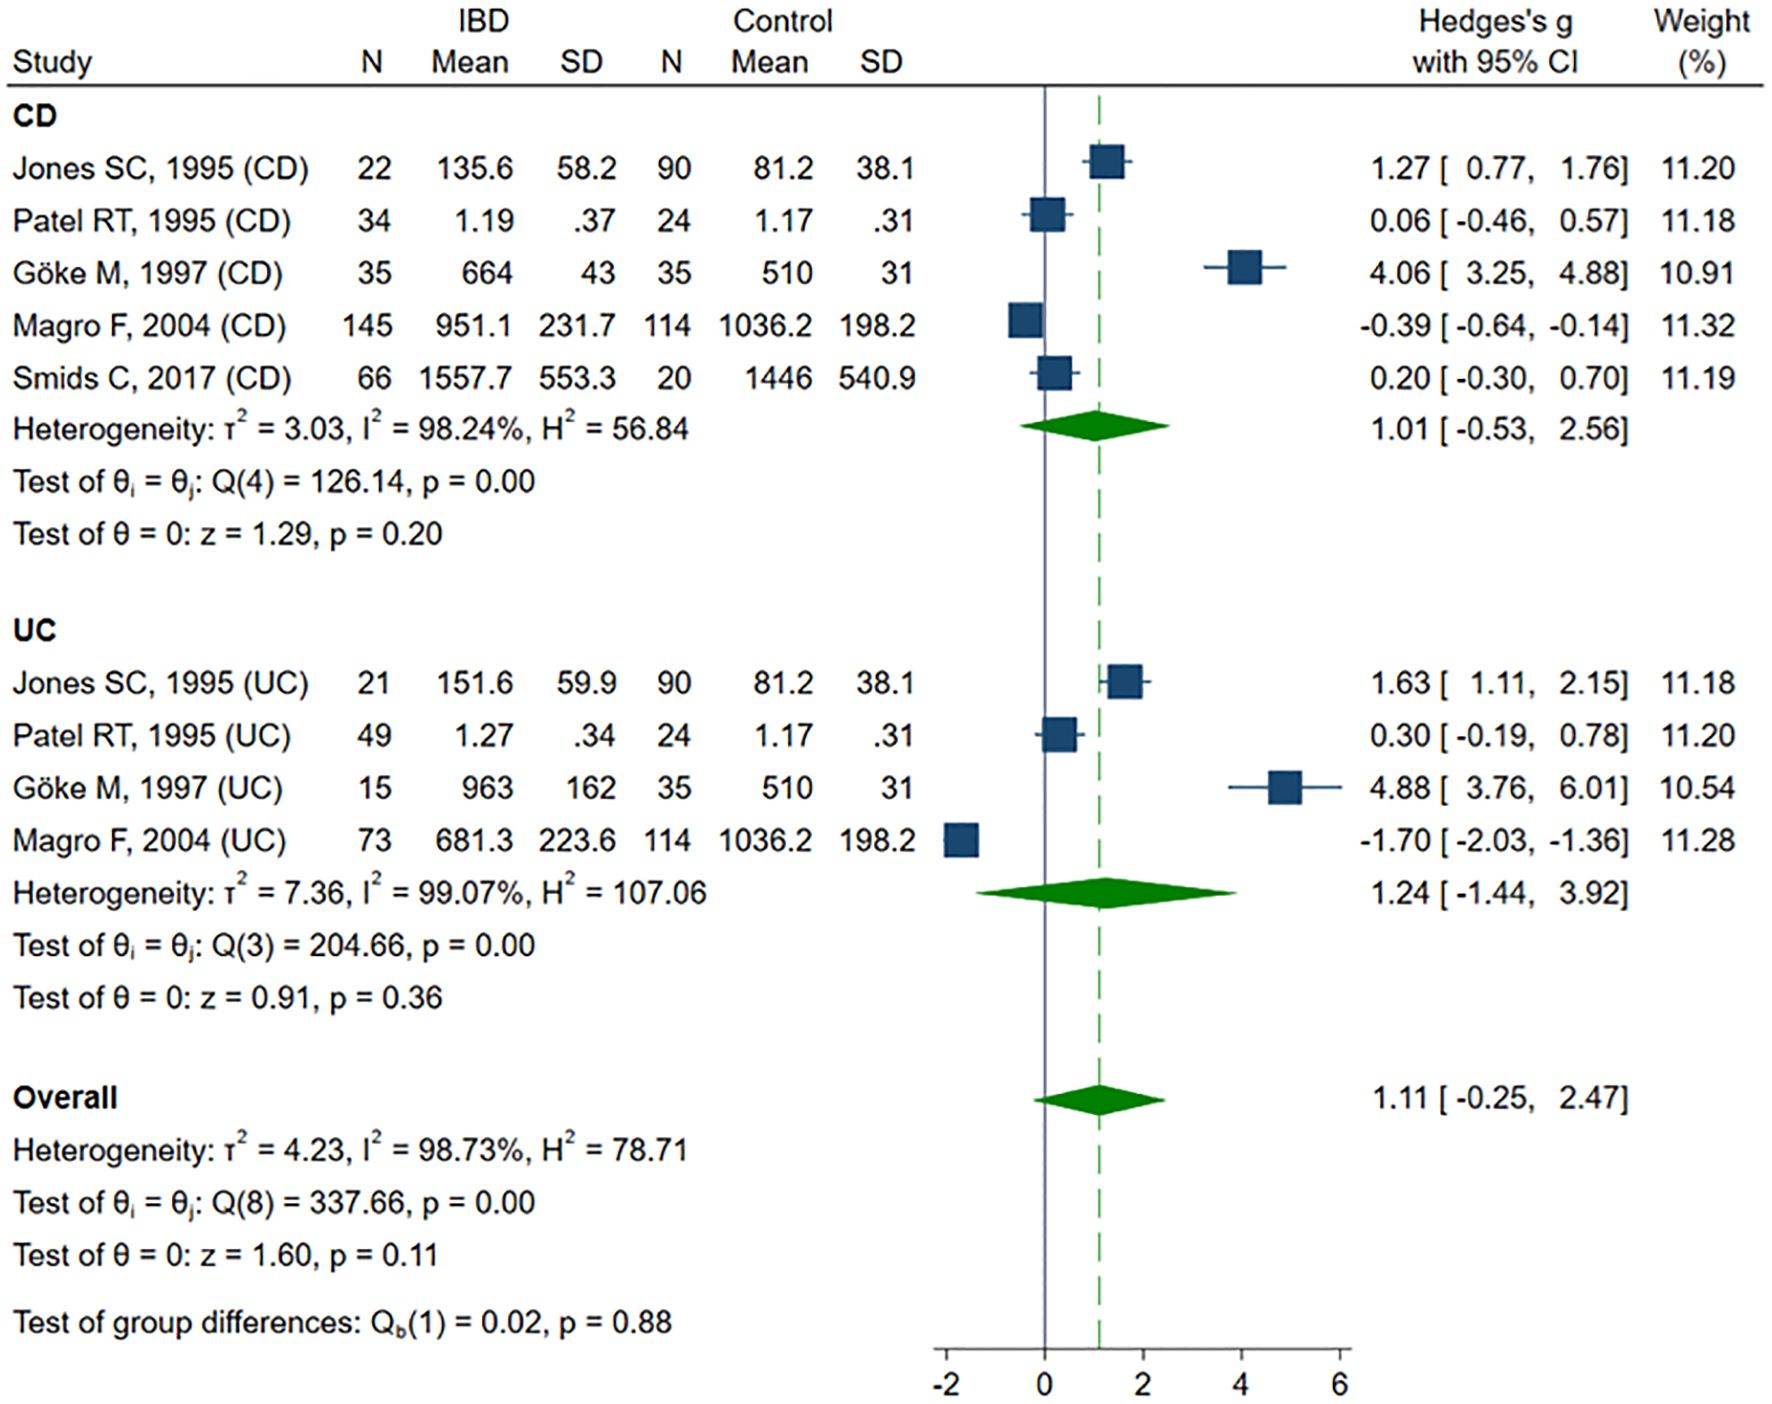
Figure 3. Forest plot of studies comparing sVCAM-1 levels between IBD patients and healthy controls, with subgroup analysis for IBD.
3.4 sMAdCAM-1
No studies comparing sMAdCAM-1 concentrations between the investigated groups were identified.
3.5 sE-selectin
Eleven studies reported sE-selectin concentrations (13, 39, 41–45, 48, 50, 53, 62) in a total of 346 healthy controls, 383 CD patients, and 375 UC patients. Eight studies (13, 39, 41–44, 48, 50) included healthy controls, CD, and UC patients, of which six (13, 41, 42, 44, 48, 50) compared groups by disease activity. Two studies (45, 53) compared healthy controls with patients with active and inactive UC. One study (62) included only patients with active CD and UC. The risk of bias was assessed as low in seven studies (13, 39, 44, 45, 50, 53, 62), and moderate in four studies (41–43, 48) (Table 2). sE-selectin levels were significantly higher in patients with IBD compared to controls (SMD 0.35, 95% CI 0.09 to 0.61, p=0.008; I² = 77.6%, p<0.001), and this difference remained stable in the sensitivity analysis (SMD range 0.30 – 0.40). Significant publication bias was detected (Begg’s test, p=0.049; Egger’s test, p=0.002). Using the trim-and-fill method, four potentially missing studies were imputed on the left side of the funnel plot; their inclusion reduced SMD and resulted in a loss of statistical significance (SMD 0.17, 95% CI -0.09 to 0.44, p=0.208). In the subgroup analysis, elevated sE-selectin levels remained significant in the CD group (SMD 0.43, 95% CI 0.04 to 0.82, p=0.032; I² = 79.3%, p<0.001), but lost statistical significance in the UC group (SMD 0.29, 95% CI -0.07 to 0.64, p=0.113; I² = 76.6%, p<0.001) (Figure 4). No significant differences in sE-selectin levels were observed between CD and UC groups (SMD -0.05, 95% CI -0.42 to 0.32, p=0.803; I² = 81.2%, p<0.001), and this finding remained robust in the sensitivity analysis (SMD range -0.13 to 0.09). The study by Górecka et al. (62) was identified as a significant outlier; its exclusion markedly reduced heterogeneity, but without affecting the statistical significance of the results (SMD 0.09, 95% CI -0.11 to 0.28, p=0.396; I² = 30.3%, p=0.107). No significant differences in sE-selectin concentrations were observed between patients with active and inactive IBD (SMD 0.44, 95% CI -0.15 to 1.03, p=0.146; I² = 91.7%, p<0.001). Exclusion of the Vainer (45) (SMD 0.55, 95% CI -0.03 to 1.13, p=0.061) or Pamuk (53) (SMD 0.55, 95% CI -0.01 to 1.12, p=0.056) study shifted the elevated sE-selectin levels in active IBD closer to statistical significance; however, the results remained non-significant in sensitive analysis (SMD range 0.26 – 0.55). No publication bias was detected (Begg’s test, p=0.661, Egger’s test, p=0.051). Subgroup analysis did not reveal statistical significance between patients with active and inactive forms of CD (SMD 0.80, 95% CI -0.05 to 0.1.64, p=0.065; I² = 91.2%, p<0.001) and UC (SMD 0.16, 95% CI -0.66 to 0.98, p=0.699; I² = 91.7%, p<0.001).
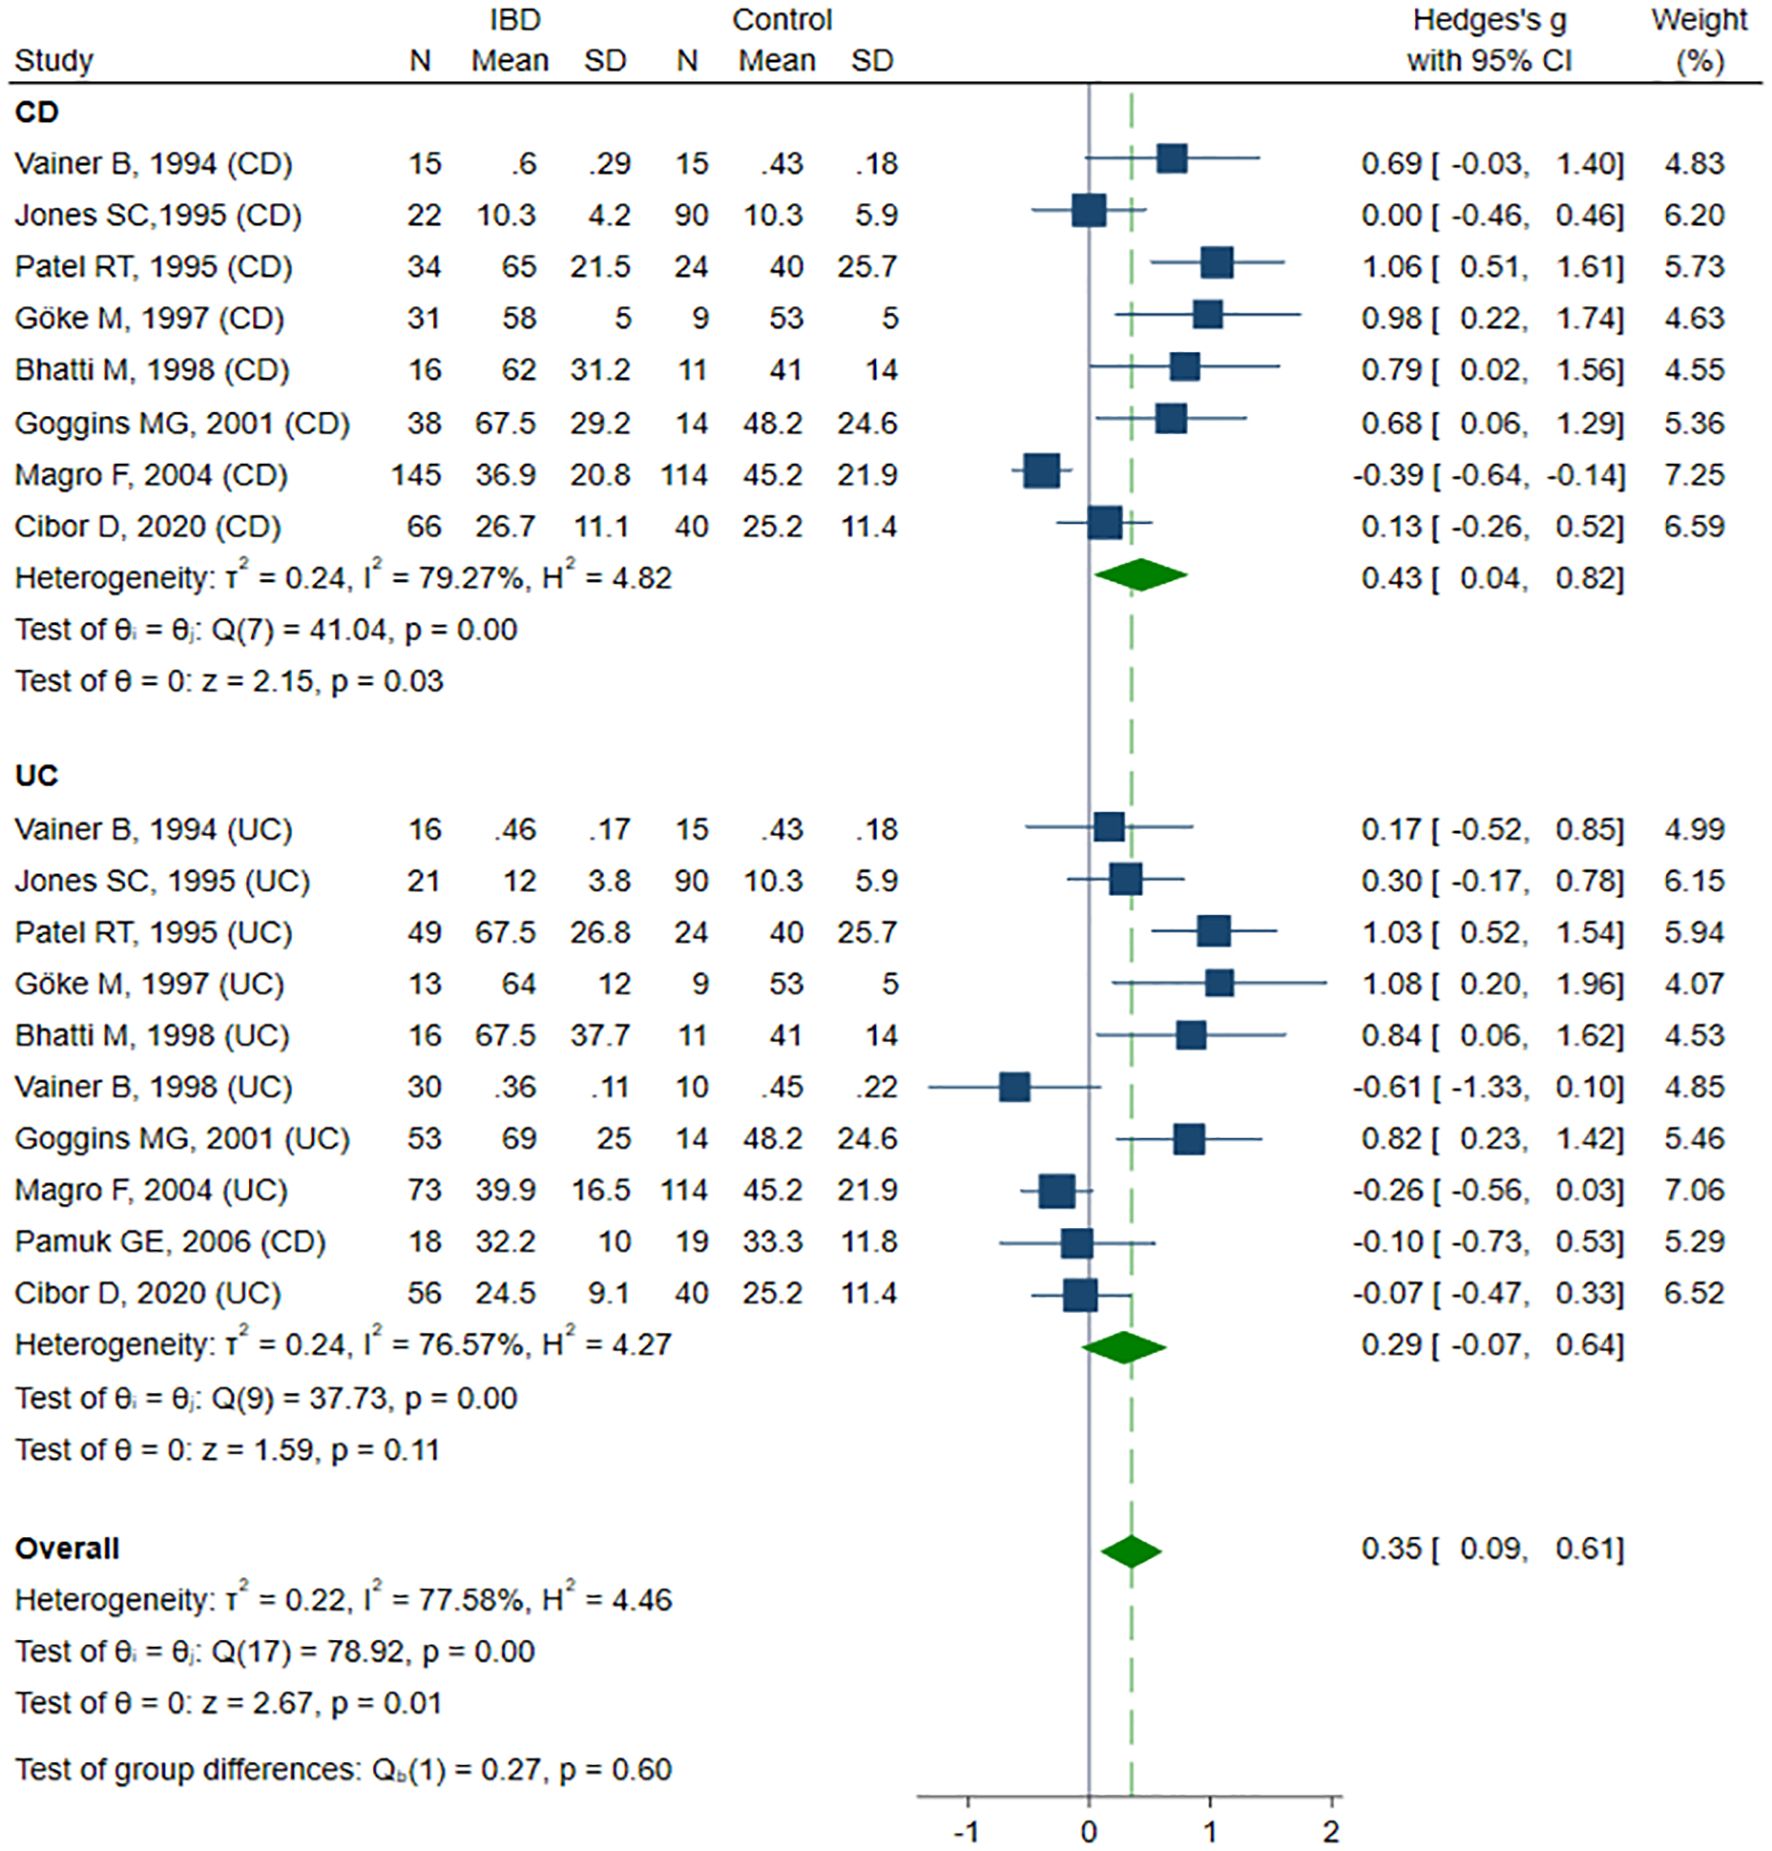
Figure 4. Forest plot of studies comparing sE-selectin levels between IBD patients and healthy controls, with subgroup analysis for IBD.
3.6 sP-selectin
Ten studies (13, 43, 47, 50–52, 56, 60– 62) sP-selectin concentrations, including a total of 327 healthy controls, 309 CD patients, and 487 UC patients. Six studies (13, 43, 47, 50–52) included healthy controls, CD, and UC patients, among these, three studies (13, 50, 52) compared groups according to disease activity. One study (56) included controls and UC patients. The remaining three studies did not include healthy controls: in one study (61) sP-selectin levels were compared between active and inactive CD and UC patients, in one study (60), between active and inactive UC patients, and in one study (62) only in active CD and UC patients. The risk of bias was assessed as low in six studies (13, 47, 50, 52, 61, 62), and moderate in four studies (43, 51, 56, 60) (Table 2). Despite a tendency toward higher sP-selectin concentrations in IBD patients compared to the healthy controls, the difference was not statistically significant (SMD 0.72, 95% CI -0.10 to 1.54, p=0.086; I² = 97.8%, p<0.001). The results were stable in sensitivity analysis, with SMD ranging from 0.41 to 0.85. A significant publication bias was detected (Begg’s test, p=0.033; Egger’s test, p=0.002); however, the trim-and-fill method did not impute any missing studies. When forced imputation was applied, three studies were imputed on the right side of the funnel plot, resulting in a marked increase in the pooled SMD (95% CI 0.34 to 1.93, p=0.005). No differences in sP-selectin levels were observed in the CD (SMD 0.71, 95% CI -0.79 to 2.20, p=0.356; I² = 98.5%, p<0.001) and UC (SMD 0.73, 95% CI -0.23 to 1.68, p=0.135; I² = 96.6%, p<0.001) group in the subgroup analysis (Figure 5). No differences in sP-selectin concentrations were detected between patients with CD and UC (SMD -0.15, 95% CI -0.48 to 0.18, p=0.362; I² = 75.6%, p=0.002), with the finding remaining robust in the sensitivity analysis (SMD range -0.23 to -0.03). Similarly, no significant differences were found between active and inactive IBD patients (SMD 0.04, 95% CI -0.43 to 0.51, p=0.880; I² = 84.8%, p<0.001), and this result was maintained in subgroup analyses conducted for CD (SMD 0.27, 95% CI -0.08 to 0.67, p=0.129; I² = 40.5%, p=0.171), and UC (SMD 0.04, 95% CI -0.43 to 0.51, p=0.696; I² = 89.5%, p<0.001).
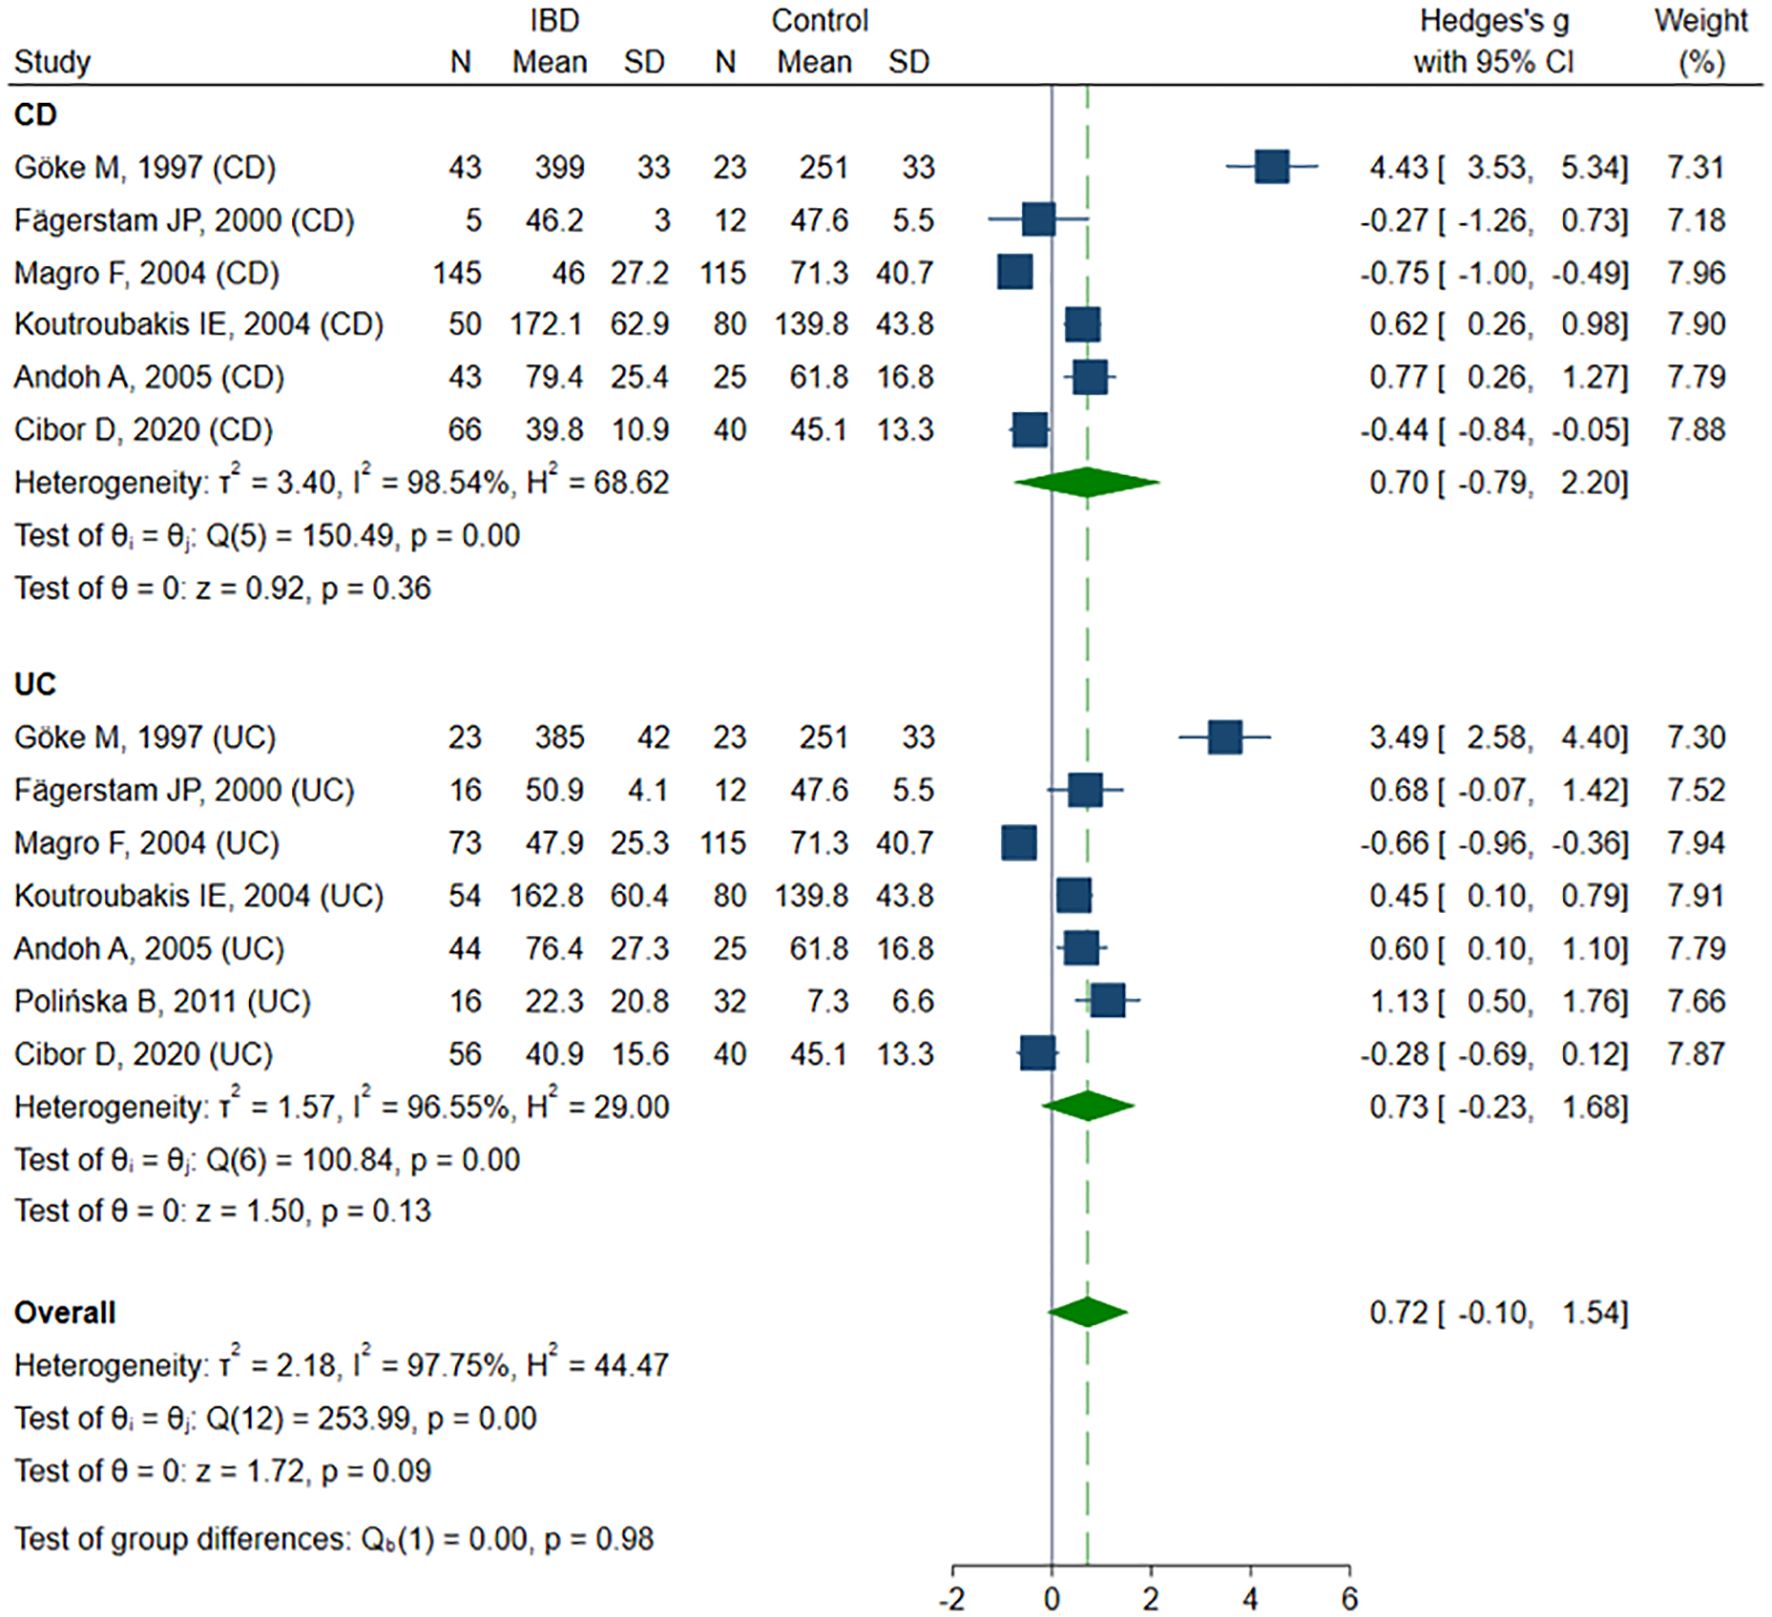
Figure 5. Forest plot of studies comparing sP-selectin levels between IBD patients and healthy controls, with subgroup analysis for IBD.
3.7 sL-selectin
Only one study (46) reported sL-selectin concentrations. sL-selectin levels did not differ significantly between healthy controls (n=12, median; IQR: 722; 634–767 ng/ml), patients with CD (n=16, 749; 613–846 ng/ml), and those with UC (n=23, 811; 611–874 ng/ml). However, within the UC subgroup, patients with inactive disease (n=8, 577; 428–632 ng/ml) demonstrated lower sL-selectin levels (p<0.005), while those with severe disease (n=7, 1012, 830–1068 ng/ml) exhibited elevated levels (p<0.002) compared to controls, with no differences with respect to mild and moderate activity subgroups. In contrast, no significant differences in sL-selectin levels were observed between CD patients - regardless of disease activity - and healthy individuals.
4 Discussion
The migration and adhesion of immune cells is a complex, multistep process involving a diverse set of molecules that are essential for effective immune and inflammatory responses. The initial phase of leukocyte adhesion involves transient and low-affinity interactions between selectins, L-selectin, P-selectin, and E-selectin, and their glycosylated ligands, mainly P-selectin glycoprotein ligand-1 (PSGL-1), which mediate leukocyte tethering and rolling along the endothelial surface under shear flow conditions. This rolling step is necessary for subsequent firm adhesion, primarily mediated by integrins such as α4β1 and α4β7. These integrins bind to immunoglobulin superfamily members expressed on activated endothelial cells, including ICAM-1, VCAM-1, and MAdCAM-1, allowing stable leukocyte arrest and transmigration (16, 63–66). Increased expression of these endothelial adhesion molecules has been consistently demonstrated in IBD patients, reflecting widespread endothelial activation within the inflamed intestinal mucosa (14, 20, 44, 67, 68).
Circulating forms of CAMs are produced through proteolytic shedding, and their elevated levels have been observed in various pathological conditions, including cardiovascular diseases, atherosclerosis, rheumatologic disorders, sepsis, and malignancies. These soluble isoforms likely reflect endothelial activation or injury and are increasingly investigated as potential biomarkers for disease activity, progression, and therapeutic response (17, 21–24, 69, 70).
Our study suggests a potential association between IBD, endothelial injury, and elevated levels of circulating adhesion molecules. Among the biomarkers analyzed, all showed a trend toward higher concentrations in IBD patients; however, only sICAM-1 and sE-selectin reached statistical significance. In subgroup analysis, the association for sICAM-1 remained significant in both CD and UC, while for sE-selectin, it persisted only in CD. This may be partially due to the fact that sICAM-1 and sE-selectin were evaluated in a greater number of studies compared to the other molecules. Importantly, only sICAM-1 was able to distinguish between active and inactive disease. None of the adhesion molecules showed significant differences between IBD subtypes.
We did not identify studies directly comparing sMAdCAM-1 levels between IBD patients and healthy controls. While no studies meeting the inclusion criteria specifically assessed vedolizumab or sMAdCAM-1, we briefly discuss available evidence from related literature as a narrative review. Notably, a few studies have explored the potential utility of sMAdCAM-1 as a biomarker for monitoring treatment response to vedolizumab. Vedolizumab is a humanized monoclonal IgG1 antibody that selectively inhibits the interaction between α4β7 integrin and MAdCAM-1, thereby blocking lymphocyte trafficking across the gut endothelium and reducing intestinal inflammation (20, 71, 72). Holmer et al. (73) demonstrated a reduction in sMAdCAM-1 levels in a cohort of 22 CD patients treated with vedolizumab; however, no significant differences were observed between patients who achieved remission and those who did not during the 26-week follow-up period. A similar association was reported by Battat et al. (74) in UC patients who presented with a decrease in sMAdCAM-1 levels compared to baseline, yet no significant differences were observed between remitters and non-remitters. However, Van den Berge et al. (75) and Kajikawa et al. (76) reported higher sMAdCAM-1 levels in patients with UC in remission at week 14 of treatment.
Vedolizumab, currently widely used in clinical practice, has demonstrated substantial efficacy and a favorable safety profile in the treatment of IBD by selectively targeting the α4β7 integrin-MAdCAM-1 pathway. Nevertheless, adhesion molecule pathways remain a focus of ongoing therapeutic development. Several emerging agents, such as natalizumab (targeting the α4 integrin subunit), etrolizumab (targeting the β7 integrin subunit), alicaforsen (inhibiting the activity of ICAM-1) and direct MAdCAM-1 inhibitors, are under investigation for their potential to further modulate leukocyte trafficking and improve clinical outcomes (77, 78). In this context, studies exploring the role of soluble adhesion molecules as biomarkers of endothelial activity and treatment response are of growing importance and may provide valuable tools for therapeutic monitoring and disease stratification.
4.1 Strengths and limitations
The main strength of our study was the evaluation of multiple adhesion molecules and the comparison of their concentrations not only between patients and healthy controls, but also across different types of IBD and disease activity states. Another strength was the use of subgroup analyses, as well as the application of the trim-and-fill method when appropriate and feasible, to identify potential missing studies.
Nevertheless, several important limitations should be acknowledged. First and foremost, only a small number of eligible studies were identified, most of which included relatively small sample sizes.
There was substantial heterogeneity among the included studies, which could not be fully explained. This variability may be attributed to several factors, including the overall moderate quality of the studies - as only half met the criteria for high quality according to the NOS scale — as well as the frequent lack of reporting of both basic demographic information and more detailed clinical characteristics, such as disease phenotype, duration, and treatment. Significant differences may also have arisen from the analytical methods employed, as various studies used ELISA kits from different manufacturers and analyzed different types of biological samples (serum vs. plasma), potentially contributing to discrepancies in the measured biomarker levels. Moreover, the high degree of heterogeneity may be partly related to the long time span of the included studies (1993–2025), during which laboratory techniques, diagnostic criteria, and the management of inflammatory bowel disease have evolved substantially.
Given the limited number of studies and incomplete reporting of individual patient data, it was not possible to perform a meta-regression analysis or adjust for potential confounding factors such as age, smoking status, specific medications, or disease duration. Furthermore, comparisons between IBD patients based on specific disease characteristics were not feasible, as participants were generally reported as a single group despite considerable variability in treatment regimens, disease phenotypes, and disease activity indices.
Significant publication bias was detected for sICAM-1 and sE-selectin. For sICAM-1, the bias did not affect the results and, in fact, the forced adjustment slightly increased the observed effect size. In contrast, for sE-selectin, the hypothetical missing studies suggested by the trim-and-fill method eliminated the statistical significance for the UC group.
Moreover, disease activity was assessed using different scoring systems, reflecting both the diversity of available tools and the evolution of assessment methods over the extended time span of the included studies. This variation in activity indices - including CDAI, Mayo, Truelove & Witts, and other scores - contributed substantially to clinical heterogeneity, as it made the classification of patients into “active” versus “inactive” disease groups less uniform across studies.
Finally, although a strength of our study was the inclusion of various adhesion molecules, it is important to acknowledge the multitude of other adhesion proteins that remain unexplored or are rarely measured, and therefore, could not be included in this meta-analysis.
5 Conclusions
Circulating CAMs, particularly sICAM-1 and sE-selectin, are elevated in IBD patients, supporting the involvement of endothelial injury in disease pathogenesis. Among these, sICAM-1 may have utility as a biomarker for differentiating disease activity. The complex mechanisms governing leukocyte adhesion and migration highlight opportunities for the development of targeted therapies that aim to modulate the inflammatory cascade. Circulating adhesion molecules may also serve as surrogate markers for evaluating therapeutic efficacy. However, given the limitations of the current evidence base and the multifactorial nature of these processes, further well-designed studies are needed to clarify their roles and enhance their translational potential in clinical practice.
Data availability statement
The original contributions presented in the study are included in the article/Supplementary Material. Further inquiries can be directed to the corresponding author/s.
Author contributions
KP: Conceptualization, Data curation, Formal Analysis, Visualization, Writing – original draft, Writing – review & editing. DC: Data curation, Formal Analysis, Validation, Writing – review & editing. MZ: Data curation, Validation, Writing – review & editing. DO: Data curation, Supervision, Validation, Writing – review & editing.
Funding
The author(s) declare that no financial support was received for the research and/or publication of this article.
Conflict of interest
The authors declare that the research was conducted in the absence of any commercial or financial relationships that could be construed as a potential conflict of interest.
Generative AI statement
The author(s) declare that no Generative AI was used in the creation of this manuscript.
Any alternative text (alt text) provided alongside figures in this article has been generated by Frontiers with the support of artificial intelligence and reasonable efforts have been made to ensure accuracy, including review by the authors wherever possible. If you identify any issues, please contact us.
Publisher’s note
All claims expressed in this article are solely those of the authors and do not necessarily represent those of their affiliated organizations, or those of the publisher, the editors and the reviewers. Any product that may be evaluated in this article, or claim that may be made by its manufacturer, is not guaranteed or endorsed by the publisher.
Supplementary material
The Supplementary Material for this article can be found online at: https://www.frontiersin.org/articles/10.3389/fimmu.2025.1680317/full#supplementary-material
References
1. Zhang YZ and Li YY. Inflammatory bowel disease: pathogenesis. World J Gastroenterol. (2014) 20:91–9. doi: 10.3748/wjg.v20.i1.91
2. Gordon H, Burisch J, Ellul P, Karmiris K, Katsanos K, Allocca M, et al. ECCO guidelines on extraintestinal manifestations in inflammatory bowel disease. J Crohns Colitis. (2024) 18:1–37. doi: 10.1093/ecco-jcc/jjad108
3. Kaczmarczyk O, Dąbek-Drobny A, Piątek-Guziewicz A, Woźniakiewicz M, Paśko P, Dobrowolska-Iwanek J, et al. The importance of nutritional aspects in the assessment of inflammation and intestinal barrier in patients with inflammatory bowel disease. Nutrients. (2022) 14:4622. doi: 10.3390/nu14214622
4. Piątek-Guziewicz A, Paśko P, Wcisło K, Dąbek-Drobny A, Przybylska-Feluś M, Kaczmarczyk O, et al. Serum levels of selected micronutrients in patients with inflammatory bowel disease in clinical remission. Pol Arch Intern Med. (2021) 131:701–8. doi: 10.20452/pamw.15999
5. He R, Zhao S, Cui M, Chen Y, Ma J, Li J, et al. Cutaneous manifestations of inflammatory bowel disease: basic characteristics, therapy, and potential pathophysiological associations. Front Immunol. (2023) 14:1234535. doi: 10.3389/fimmu.2023.1234535
6. Owczarek D, Cibor D, Głowacki MK, Rodacki T, and Mach T. Inflammatory bowel disease: epidemiology, pathology and risk factors for hypercoagulability. World J Gastroenterol. (2014) 20:53–63. doi: 10.3748/wjg.v20.i1.53
7. Wang R, Li Z, Liu S, and Zhang D. Global, regional and national burden of inflammatory bowel disease in 204 countries and territories from 1990 to 2019: a systematic analysis based on the Global Burden of Disease Study 2019. BMJ Open. (2023) 13:e065186. doi: 10.1136/bmjopen-2022-065186
8. Cibor D, Domagala-Rodacka R, Rodacki T, Jurczyszyn A, Mach T, and Owczarek D. Endothelial dysfunction in inflammatory bowel diseases: Pathogenesis, assessment and implications. World J Gastroenterol. (2016) 22:1067–77. doi: 10.3748/wjg.v22.i3.1067
9. Kofla-Dłubacz A, Pytrus T, Akutko K, Sputa-Grzegrzółka P, Piotrowska A, and Dzięgiel P. Etiology of IBD-is it still a mystery? Int J Mol Sci. (2022) 23:12445. doi: 10.3390/ijms232012445
10. Davignon J and Ganz P. Role of endothelial dysfunction in atherosclerosis. Circulation. (2004) 109:III27–32. doi: 10.1161/01.CIR.0000131515.03336.f8
11. Godo S and Shimokawa H. Endothelial functions. Arterioscler Thromb Vasc Biol. (2017) 37:e108–14. doi: 10.1161/ATVBAHA.117.309813
12. Małyszko J and Matuszkiewicz-Rowińska J. Endothelium, asymmetric dimethylarginine, and atherosclerosis in chronic kidney disease. Pol Arch Intern Med. (2018) 128:145–7. doi: 10.20452/pamw.4232
13. Cibor D, Szczeklik K, Kozioł K, Pocztar H, Mach T, and Owczarek D. Serum concentration of selected biochemical markers of endothelial dysfunction and inflammation in patients with the varying activity of inflammatory bowel disease. Pol Arch Intern Med. (2020) 130:598–606. doi: 10.20452/pamw.15463
14. Danese S. Role of the vascular and lymphatic endothelium in the pathogenesis of inflammatory bowel disease: 'brothers in arms'. Gut. (2011) 60:998–1008. doi: 10.1136/gut.2010.207480
15. McEver RP and Zhu C. Rolling cell adhesion. Annu Rev Cell Dev Biol. (2010) 26:363–96. doi: 10.1146/annurev.cellbio.042308.113238
16. McEver RP. Selectins: initiators of leucocyte adhesion and signalling at the vascular wall. Cardiovasc Res. (2015) 107:331–9. doi: 10.1093/cvr/cvv154
17. Bui TM, Wiesolek HL, and Sumagin R. ICAM-1: A master regulator of cellular responses in inflammation, injury resolution, and tumorigenesis. J Leukoc Biol. (2020) 108:787–99. doi: 10.1002/JLB.2MR0220-549R
18. Singh V, Kaur R, Kumari P, Pasricha C, and Singh R. ICAM-1 and VCAM-1: Gatekeepers in various inflammatory and cardiovascular disorders. Clin Chim Acta. (2023) 548:117487. doi: 10.1016/j.cca.2023.117487
19. Kuhbandner K, Hammer A, Haase S, Terbrack E, Hoffmann A, Schippers A, et al. MAdCAM-1-mediated intestinal lymphocyte homing is critical for the development of active experimental autoimmune encephalomyelitis. Front Immunol. (2019) 10:903. doi: 10.3389/fimmu.2019.00903
20. Briskin M, Winsor-Hines D, Shyjan A, Cochran N, Bloom S, Wilson J, et al. Human mucosal addressin cell adhesion molecule-1 is preferentially expressed in intestinal tract and associated lymphoid tissue. Am J Pathol. (1997) 151:97–110.
21. Troncoso MF, Ortiz-Quintero J, Garrido-Moreno V, Sanhueza-Olivares F, Guerrero-Moncayo A, Chiong M, et al. VCAM-1 as a predictor biomarker in cardiovascular disease. Biochim Biophys Acta Mol Basis Dis. (2021) 1867:166170. doi: 10.1016/j.bbadis.2021.166170
22. Mangoni AA and Zinellu A. Circulating cell adhesion molecules in systemic sclerosis: a systematic review and meta-analysis. Front Immunol. (2024) 15:1438302. doi: 10.3389/fimmu.2024.1438302
23. Zonneveld R, Martinelli R, Shapiro NI, Kuijpers TW, Plötz FB, and Carman CV. Soluble adhesion molecules as markers for sepsis and the potential pathophysiological discrepancy in neonates, children and adults. Crit Care. (2014) 18:204. doi: 10.1186/cc13733
24. Hisada Y and Mackman N. Cancer-associated pathways and biomarkers of venous thrombosis. Blood. (2017) 130:1499–506. doi: 10.1182/blood-2017-03-743211
25. Page MJ, McKenzie JE, Bossuyt PM, Boutron I, Hoffmann TC, Mulrow CD, et al. The PRISMA 2020 statement: an updated guideline for reporting systematic reviews. BMJ. (2021) 372:n71. doi: 10.1136/bmj.n71
26. Bramer WM, Giustini D, de Jonge GB, Holland L, and Bekhuis T. De-duplication of database search results for systematic reviews in EndNote. J Med Libr Assoc. (2016) 104:240–3. doi: 10.3163/1536-5050.104.3.014
27. Abbas A, Hefnawy MT, and Negida A. Meta-analysis accelerator: a comprehensive tool for statistical data conversion in systematic reviews with meta-analysis. BMC Med Res Methodol. (2024) 24:243. doi: 10.1186/s12874-024-02356-6
28. Wan X, Wang W, Liu J, and Tong T. Estimating the sample mean and standard deviation from the sample size, median, range and/or interquartile range. BMC Med Res Methodol. (2014) 14:135. doi: 10.1186/1471-2288-14-135
29. Wells GA, Shea B, O’Connell D, Peterson J, Welch V, Losos M, et al. The Newcastle-Ottawa Scale (NOS) for assessing the quality of nonrandomised studies in meta-analyses. Ottawa: Ottawa Hospital Research Institute (2013).
30. Li X, Hu S, and Liu P. Vascular-related biomarkers in psychosis: a systematic review and meta-analysis. Front Psychiatry. (2023) 14:1241422. doi: 10.3389/fpsyt.2023.1241422
31. Bowden J, Tierney JF, Copas AJ, and Burdett S. Quantifying, displaying and accounting for heterogeneity in the meta-analysis of RCTs using standard and generalised Q statistics. BMC Med Res Methodol. (2011) 11:41. doi: 10.1186/1471-2288-11-41
32. Higgins JP, Thompson SG, Deeks JJ, and Altman DG. Measuring inconsistency in meta-analyses. BMJ. (2003) 327:557–60. doi: 10.1136/bmj.327.7414.557
33. Higgins JPT, Thomas J, Chandler J, Cumpston M, Li T, Page MJ, and Welch VA eds. Cochrane handbook for systematic reviews of interventions version 6.5. London, UK: Cochrane (2024).
34. DerSimonian R and Laird N. Meta-analysis in clinical trials. Control Clin Trials. (1986) 7:177–88. doi: 10.1016/0197-2456(86)90046-2
35. Begg CB and Mazumdar M. Operating characteristics of a rank correlation test for publication bias. Biometrics. (1994) 50:1088–101. doi: 10.2307/2533446
36. Sterne JA and Egger M. Funnel plots for detecting bias in meta-analysis: guidelines on choice of axis. J Clin Epidemiol. (2001) 54:1046–55. doi: 10.1016/s0895-4356(01)00377-8
37. Duval S and Tweedie R. Trim and fill: A simple funnel-plot-based method of testing and adjusting for publication bias in meta-analysis. Biometrics. (2000) 56:455–63. doi: 10.1111/j.0006-341x.2000.00455.x
38. Dippold W, Wittig B, Schwaeble W, Mayet W, and Meyer zum Büschenfelde KH. Expression of intercellular adhesion molecule 1 (ICAM-1, CD54) in colonic epithelial cells. Gut. (1993) 34:1593–7. doi: 10.1136/gut.34.11.1593
39. Vainer B and Nielsen OH. Serum concentration and chemotactic activity of E-selectin (CD62E) in inflammatory bowel disease. Mediators Inflammation. (1994) 3:215–8. doi: 10.1155/S096293519400030X
40. Nielsen OH, Langholz E, Hendel J, and Brynskov J. Circulating soluble intercellular adhesion molecule-1 (sICAM-1) in active inflammatory bowel disease. Dig Dis Sci. (1994) 39:1918–23. doi: 10.1007/BF02088125
41. Jones SC, Banks RE, Haidar A, Gearing AJ, Hemingway IK, Ibbotson SH, et al. Adhesion molecules in inflammatory bowel disease. Gut. (1995) 36:724–30. doi: 10.1136/gut.36.5.724
42. Patel RT, Pall AA, Adu D, and Keighley MR. Circulating soluble adhesion molecules in inflammatory bowel disease. Eur J Gastroenterol Hepatol. (1995) 7:1037–41. doi: 10.1097/00042737-199511000-00005
43. Göke M, Hoffmann JC, Evers J, Krüger H, and Manns MP. Elevated serum concentrations of soluble selectin and immunoglobulin type adhesion molecules in patients with inflammatory bowel disease. J Gastroenterol. (1997) 32:480–6. doi: 10.1007/BF02934086
44. Bhatti M, Chapman P, Peters M, Haskard D, and Hodgson HJ. Visualising E-selectin in the detection and evaluation of inflammatory bowel disease. Gut. (1998) 43:40–7. doi: 10.1136/gut.43.1.40
45. Vainer B, Nielsen OH, and Horn T. Expression of E-selectin, sialyl Lewis X, and macrophage inflammatory protein-1alpha by colonic epithelial cells in ulcerative colitis. Dig Dis Sci. (1998) 43:596–608. doi: 10.1023/a:1018875410987
46. Seidelin JB, Vainer B, Horn T, and Nielsen OH. Circulating L-selectin levels and endothelial CD34 expression in inflammatory bowel disease. Am J Gastroenterol. (1998) 93:1854–9. doi: 10.1111/j.1572-0241.1998.538_f.x
47. Fägerstam JP, Whiss PA, Ström M, and Andersson RG. Expression of platelet P-selectin and detection of soluble P-selectin, NPY and RANTES in patients with inflammatory bowel disease. Inflammation Res. (2000) 49:466–72. doi: 10.1007/s000110050618
48. Goggins MG, Goh J, O'Connell MA, Weir DG, Kelleher D, and Mahmud N. Soluble adhesion molecules in inflammatory bowel disease. Ir J Med Sci. (2001) 170:107–11. doi: 10.1007/BF03168821
49. Vainer B and Nielsen OH. Correlation between circulating soluble ICAM-1 and prednisolone-induced amelioration of ulcerative colitis. Scand J Gastroenterol. (2003) 38:283–7. doi: 10.1080/00365520310000609a
50. Magro F, Araujo F, Pereira P, Meireles E, Diniz-Ribeiro M, and Velosom FT. Soluble selectins, sICAM, sVCAM, and angiogenic proteins in different activity groups of patients with inflammatory bowel disease. Dig Dis Sci. (2004) 49:1265–74. doi: 10.1023/b:ddas.0000037822.55717.31
51. Koutroubakis IE, Theodoropoulou A, Xidakis C, Sfiridaki A, Notas G, Kolios G, et al. Association between enhanced soluble CD40 ligand and prothrombotic state in inflammatory bowel disease. Eur J Gastroenterol Hepatol. (2004) 16:1147–52. doi: 10.1097/00042737-200411000-00011
52. Andoh A, Tsujikawa T, Hata K, Araki Y, Kitoh K, Sasaki M, et al. Elevated circulating platelet-derived microparticles in patients with active inflammatory bowel disease. Am J Gastroenterol. (2005) 100:2042–8. doi: 10.1111/j.1572-0241.2005.50381.x
53. Pamuk GE, Vural O, Turgut B, Demir M, Umit H, and Tezel A. Increased circulating platelet-neutrophil, platelet-monocyte complexes, and platelet activation in patients with ulcerative colitis: a comparative study. Am J Hematol. (2006) 81:753–9. doi: 10.1002/ajh.20655
54. Ogawa N, Saito N, Kameoka S, and Kobayashi M. Clinical significance of intercellular adhesion molecule-1 in ulcerative colitis. Int Surg. (2008) 93:37–44.
55. Song WB, Lv YH, Zhang ZS, Li YN, Xiao LP, Yu XP, et al. Soluble intercellular adhesion molecule-1, D-lactate and diamine oxidase in patients with inflammatory bowel disease. World J Gastroenterol. (2009) 15:3916–9. doi: 10.3748/wjg.15.3916
56. Polińska B, Matowicka-Karna J, and Kemona H. Assessment of the influence of the inflammatory process on the activation of blood platelets and morphological parameters in patients with ulcerative colitis (colitis ulcerosa). Folia Histochem Cytobiol. (2011) 49:119–24. doi: 10.5603/fhc.2011.0017
57. Smids C, Horjus Talabur Horje CS, Nierkens S, Drylewicz J, Groenen MJM, Wahab PJ, et al. Candidate serum markers in early crohn's disease: predictors of disease course. J Crohns Colitis. (2017) 11:1090–100. doi: 10.1093/ecco-jcc/jjx049
58. Yarur AJ, Quintero MA, Jain A, Czul F, Barkin JS, and Abreu MT. Serum amyloid A as a surrogate marker for mucosal and histologic inflammation in patients with crohn's disease. Inflammation Bowel Dis. (2017) 23:158–64. doi: 10.1097/MIB.0000000000000991
59. Yarur AJ, Jain A, Quintero MA, Czul F, Deshpande AR, Kerman DH, et al. Inflammatory cytokine profile in crohn's disease nonresponders to optimal antitumor necrosis factor therapy. J Clin Gastroenterol. (2019) 53:210–5. doi: 10.1097/MCG.0000000000001002
60. Sano Y, Tomiyama T, Yagi N, Ito Y, Honzawa Y, Tahara T, et al. Platelet activation through CD62P and the formation of platelet-monocyte complexes are associated with the exacerbation of mucosal inflammation in patients with ulcerative colitis. Sci Rep. (2024) 14:28055. doi: 10.1038/s41598-024-78462-8
61. Petrović S, Tarabar D, Ćujić D, Stamenkovic D, Petrović M, Rančić N, et al. A prospective observational study analyzing the diagnostic value of hepcidin-25 for anemia in patients with inflammatory bowel diseases. Int J Mol Sci. (2024) 25:3564. doi: 10.3390/ijms25073564
62. Górecka A, Wisowski G, Kisselova-Kaneva Y, Ivanova D, Olczyk P, and Komosinska-Vassev K. Serum profiling of proinflammatory mediators in inflammatory bowel disease: indication for use in differential diagnosis. Appl Sci. (2024) 14:5434. doi: 10.3390/app14135434
63. Ley K, Laudanna C, Cybulsky MI, and Nourshargh S. Getting to the site of inflammation: the leukocyte adhesion cascade updated. Nat Rev Immunol. (2007) 7:678–89. doi: 10.1038/nri2156
64. Sun H, Liu J, Zheng Y, Pan Y, Zhang K, and Chen J. Distinct chemokine signaling regulates integrin ligand specificity to dictate tissue-specific lymphocyte homing. Dev Cell. (2014) 30:61–70. doi: 10.1016/j.devcel.2014.05.002
65. Harjunpää H, Llort Asens M, Guenther C, and Fagerholm SC. Cell adhesion molecules and their roles and regulation in the immune and tumor microenvironment. Front Immunol. (2019) 10:1078. doi: 10.3389/fimmu.2019.01078
66. Souchak J, Mohammed NBB, Lau LS, and Dimitroff CJ. The role of galectins in mediating the adhesion of circulating cells to vascular endothelium. Front Immunol. (2024) 15:1395714. doi: 10.3389/fimmu.2024.1395714
67. Hatoum OA, Miura H, and Binion DG. The vascular contribution in the pathogenesis of inflammatory bowel disease. Am J Physiol Heart Circ Physiol. (2003) 285:H1791–6. doi: 10.1152/ajpheart.00552.2003
68. Schürmann GM, Bishop AE, Facer P, Vecchio M, Lee JC, Rampton DS, et al. Increased expression of cell adhesion molecule P-selectin in active inflammatory bowel disease. Gut. (1995) 36:411–8. doi: 10.1136/gut.36.3.411
69. Tvaroška I, Selvaraj C, and Koča J. Selectins-the two dr. Jekyll and mr. Hyde faces of adhesion molecules-A review. Molecules. (2020) 25:2835. doi: 10.3390/molecules25122835
70. Gross MD, Bielinski SJ, Suarez-Lopez JR, Reiner AP, Bailey K, Thyagarajan B, et al. Circulating soluble intercellular adhesion molecule 1 and subclinical atherosclerosis: the Coronary Artery Risk Development in Young Adults Study. Clin Chem. (2012) 58:411–20. doi: 10.1373/clinchem.2011.168559
71. Streeter PR, Berg EL, Rouse BT, Bargatze RF, and Butcher EC. A tissuespecific endothelial cell molecule involved in lymphocyte homing. Nature. (1988) 331:41–6. doi: 10.1038/331041a0
72. Uchiyama K, Takagi T, Mizushima K, Hirai Y, Asaeda K, Sugaya T, et al. Mucosal addressin cell adhesion molecule 1 expression reflects mucosal inflammation and subsequent relapse in patients with ulcerative colitis. J Crohns Colitis. (2023) 17:786–94. doi: 10.1093/ecco-jcc/jjac182
73. Holmer AK, Battat R, Dulai PS, Vande Casteele N, Nguyen N, Jain A, et al. Biomarkers are associated with clinical and endoscopic outcomes with vedolizumab treatment in Crohn's disease. Therap Adv Gastroenterol. (2020) 13:1756284820971214. doi: 10.1177/1756284820971214
74. Battat R, Dulai PS, Vande Casteele N, Evans E, Hester KD, Webster E, et al. Biomarkers are associated with clinical and endoscopic outcomes with vedolizumab treatment in ulcerative colitis. Inflammation Bowel Dis. (2019) 25:410–20. doi: 10.1093/ibd/izy307
75. Van Den Berghe N, Verstockt B, Gils A, Sabino J, Ferrante M, Vermeire S, et al. Tissue Exposure does not Explain Non-Response in Ulcerative Colitis Patients with Adequate Serum Vedolizumab Concentrations. J Crohns Colitis. (2021) 15:988–93. doi: 10.1093/ecco-jcc/jjaa239
76. Kajikawa G, Sawada T, Nakamura M, Yamamura T, Maeda K, Ishikawa E, et al. Predictors of the efficacy of vedolizumab in patients with ulcerative colitis. Nagoya J Med Sci. (2024) 86:407–21. doi: 10.18999/nagjms.86.3.407
77. Schreiner P, Neurath MF, Ng SC, El-Omar EM, Sharara AI, Kobayashi T, et al. Mechanism-based treatment strategies for IBD: cytokines, cell adhesion molecules, JAK inhibitors, gut flora, and more. Inflammation Intest Dis. (2019) 4:79–96. doi: 10.1159/000500721
Keywords: biomarkers, cell adhesion molecules, crohn’s disease, inflammatory bowel disease, immunoglobulin-like cell adhesion molecules, endothelial dysfunction, ulcerative colitis, selectins
Citation: Przęczek K, Cibor D, Zwolińska-Wcisło M and Owczarek D (2025) Circulating cell adhesion molecules as biomarkers in inflammatory bowel disease: a systematic review and meta-analysis. Front. Immunol. 16:1680317. doi: 10.3389/fimmu.2025.1680317
Received: 05 August 2025; Accepted: 12 November 2025; Revised: 11 November 2025;
Published: 01 December 2025.
Edited by:
Jian Liu, University of Bristol, United KingdomReviewed by:
Miriam Di Mattia, University of Studies G. d’Annunzio Chieti and Pescara, ItalyBinazir Khanabadi, Shahid Beheshti University of Medical Sciences, Iran
Copyright © 2025 Przęczek, Cibor, Zwolińska-Wcisło and Owczarek. This is an open-access article distributed under the terms of the Creative Commons Attribution License (CC BY). The use, distribution or reproduction in other forums is permitted, provided the original author(s) and the copyright owner(s) are credited and that the original publication in this journal is cited, in accordance with accepted academic practice. No use, distribution or reproduction is permitted which does not comply with these terms.
*Correspondence: Krzysztof Przęczek, a3J6eXN6dG9mLnByemVjemVrQGRvY3RvcmFsLnVqLmVkdS5wbA==