Abstract
Objective:
Spontaneous bacterial peritonitis (SBP) is a severe complication of hepatitis B virus (HBV)-related cirrhosis, in which gut microbiota dysbiosis plays a pivotal role. This study aimed to characterize microbial alterations, establish a microbiota-derived index (SBP-MI), evaluate longitudinal changes, and develop an SBP risk prediction model (SBP-RP).
Methods:
A total of 135 participants were included: healthy controls (n=40), compensated cirrhosis (n=30), cirrhosis with ascites but without SBP (n=40), and SBP (n=25). Fecal 16S rRNA sequencing and clinical data were obtained. An additional 140 cirrhotic patients with ascites were prospectively followed for 6 months, with SBP occurrence as the endpoint; 40 provided paired fecal samples. SBP-MI was constructed from key microbial shifts, and multivariable Firth logistic regression identified independent predictors.
Results:
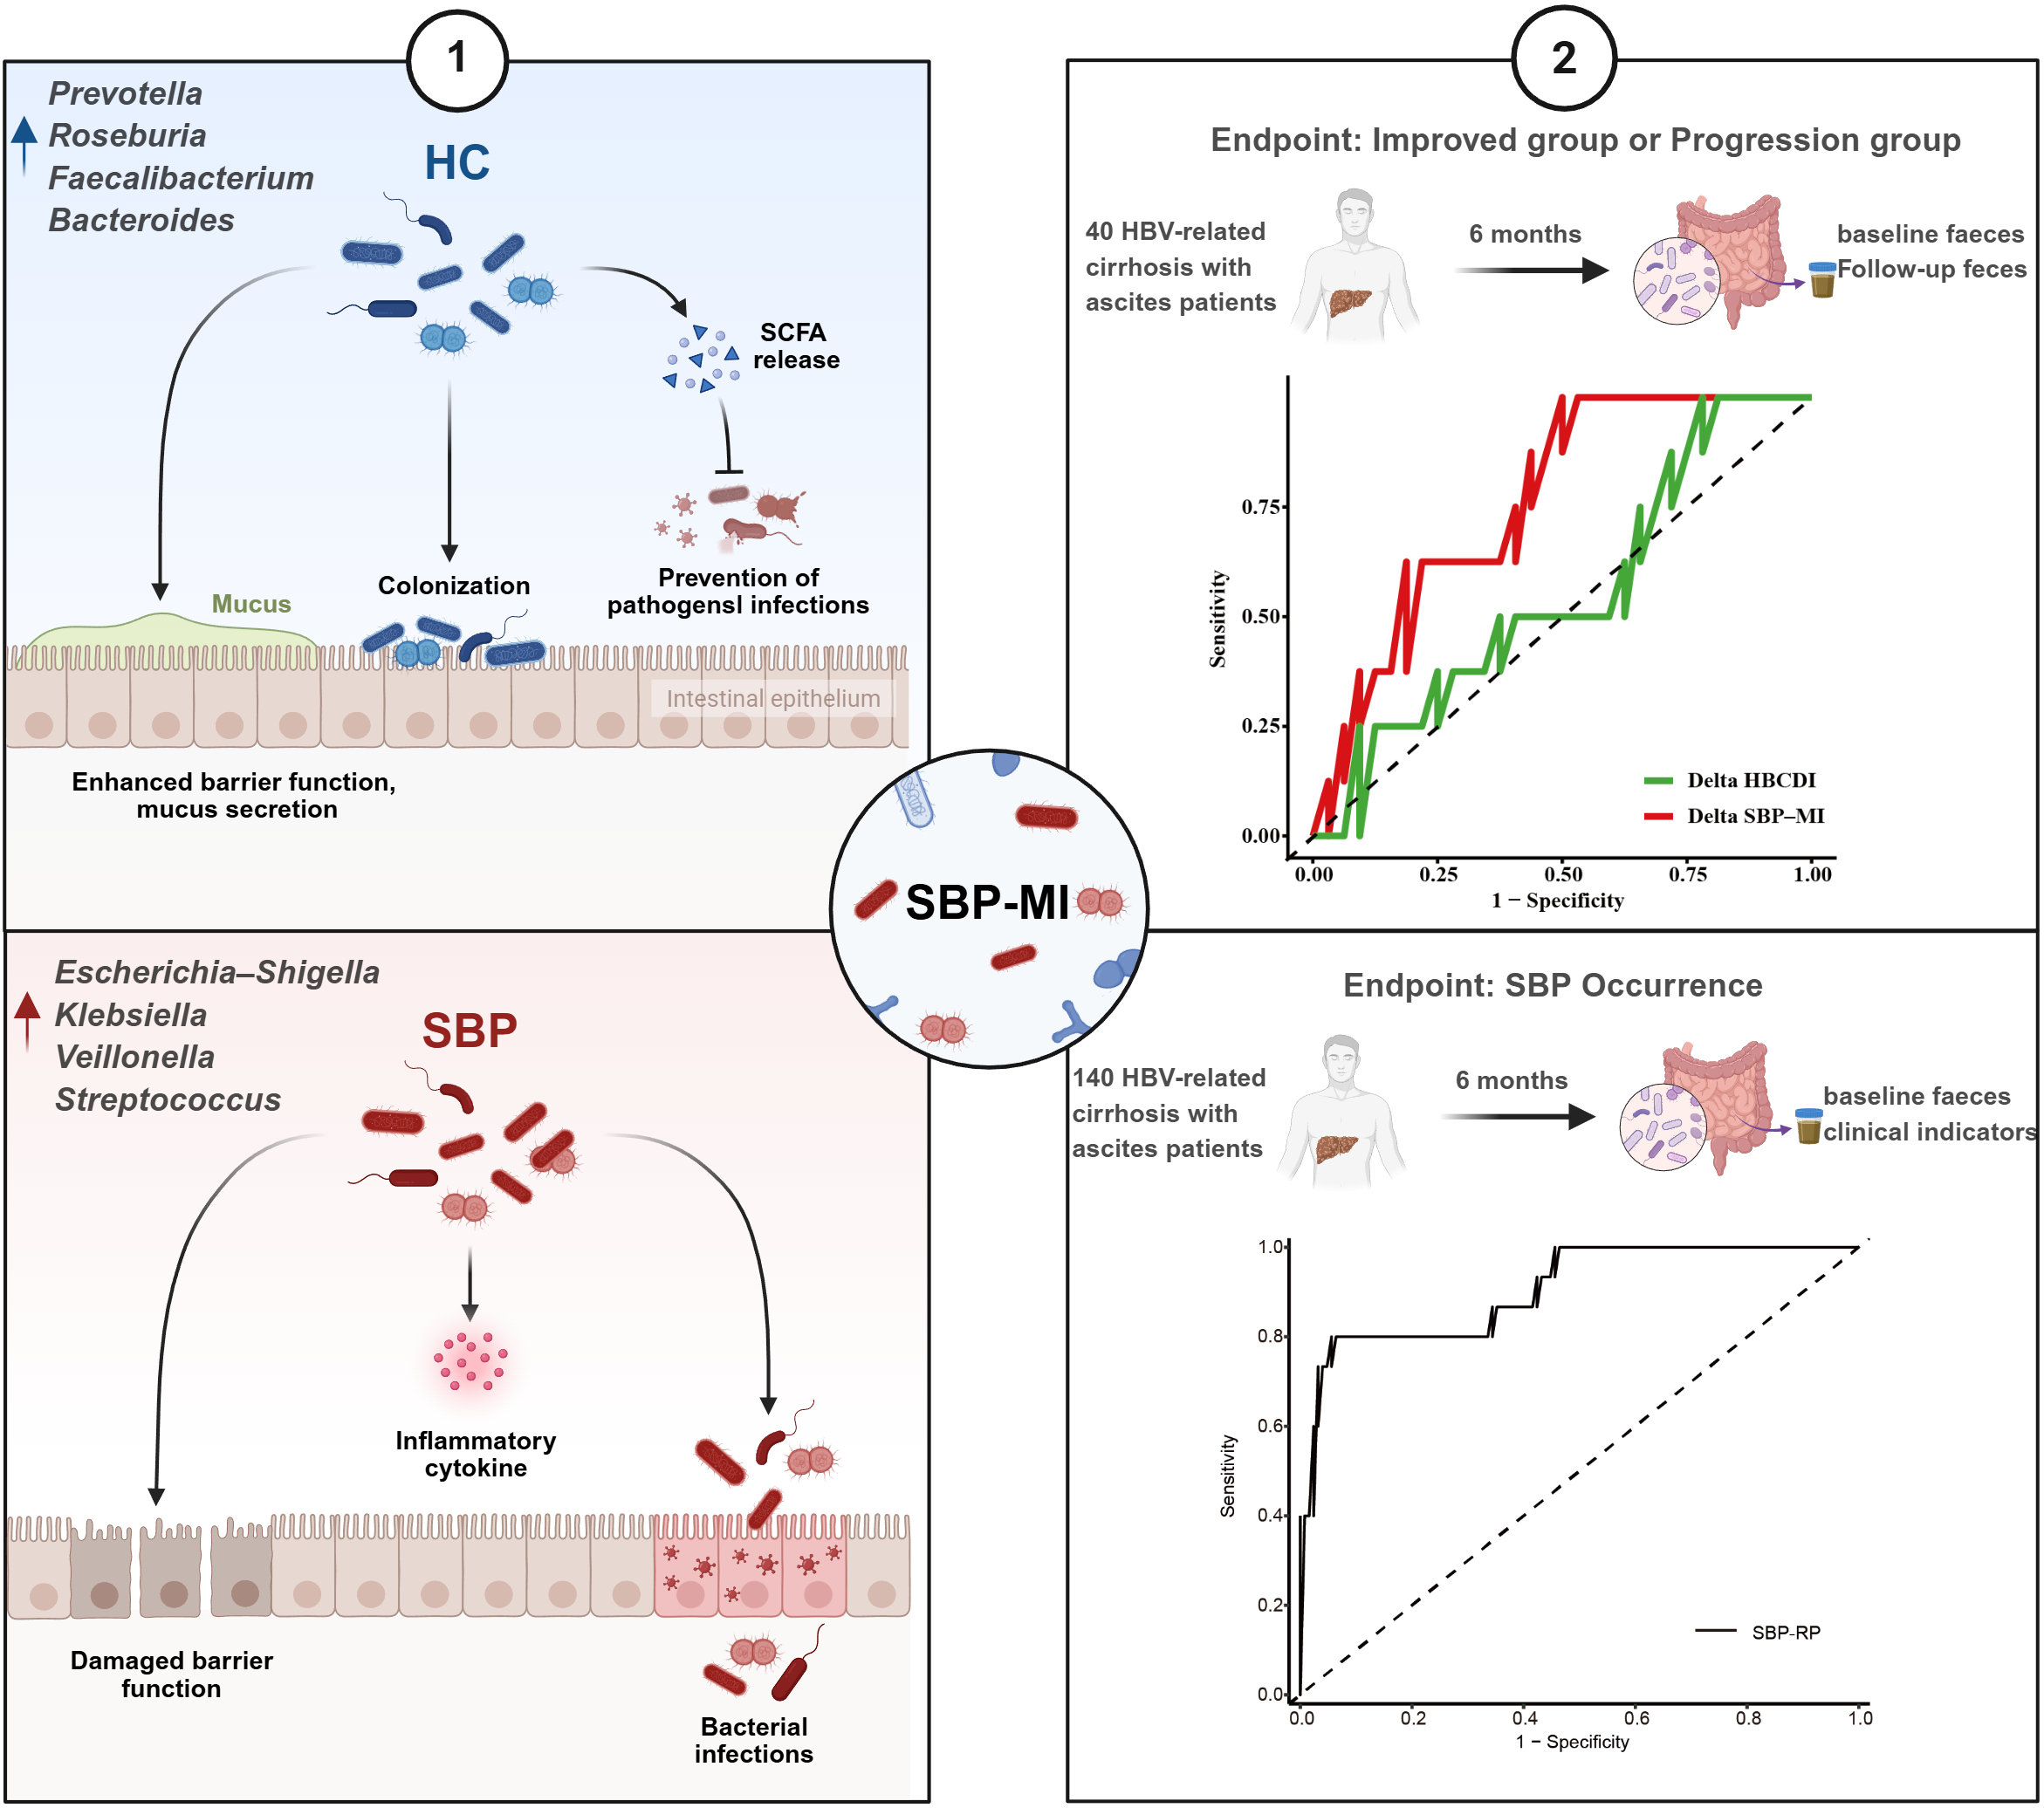
SBP was characterized by enrichment of pathogenic taxa (Escherichia–Shigella, Klebsiella, Veillonella, Streptococcus) and depletion of short-chain fatty acid producers (Prevotella, Roseburia, Faecalibacterium, Bacteroides), forming the basis of SBP-MI. During follow-up, improved patients had greater microbial diversity and beneficial commensals, whereas progression was linked to Haemophilus expansion. SBP-MI effectively tracked these changes and outperformed the Hepatitis B Cirrhosis Dysbiosis Index. Multivariable analysis identified INR, previous history of SBP, and SBP-MI as independent predictors. The SBP-RP yielded an AUC of 0.91(95% CI: 0.82–0.99), with calibration that appeared acceptable in this cohort.
Conclusion:
Distinct dysbiosis characterizes SBP. SBP-MI captures microbial imbalance and progression, while the SBP-RP model integrating microbial and clinical factors provides promising predictive value for early risk stratification.
Graphical Abstract
Highlights
-
We developed a spontaneous bacterial peritonitis microbiota-derived index (SBP-MI) that captures gut microbial imbalance in spontaneous bacterial peritonitis.
-
In patients with hepatitis B virus–related cirrhosis and ascites, SBP-MI reflects both disease improvement and progression.
-
By integrating SBP-MI with routine clinical variables, we constructed a spontaneous bacterial peritonitis risk prediction model (SBP-RP) to stratify SBP risk.
1 Introduction
Cirrhosis is a major cause of mortality worldwide (1). Spontaneous bacterial peritonitis (SBP) is one of the most common and severe complications of cirrhosis, usually occurring in end-stage disease. Among hospitalized cirrhotic patients with ascites, the 1-year recurrence rate of SBP is as high as 40%–70% (2). However, despite the availability of highly sensitive detection techniques, the positive culture rate remains low (3), and a subset of SBP patients presents without typical clinical symptoms. Hepatitis B virus (HBV)-related cirrhosis with ascites represents a high -risk state for spontaneous bacterial peritonitis, in which alterations of the gut microbiota appear to play an important role. Nevertheless, current evidence remains limited. Therefore, identifying high-risk patients early using microbiome-informed markers and implementing timely preventive strategies are critical to reducing the incidence and recurrence of SBP.
The pathogenesis of spontaneous bacterial peritonitis in cirrhosis is complex and is closely linked to intestinal mucosal barrier dysfunction and bacterial translocation (4). Causative pathogens predominantly originate from intestinal commensals, and ascitic fluid cultures frequently yield Gram-negative bacteria such as Escherichia coli, Streptococcus, Enterococcus, and Klebsiella species (3). Several microbiota-based indices have been proposed to quantify dysbiosis in cirrhosis, including the cirrhosis dysbiosis ratio (CDR) (5), the probability of disease score (POD) (6), and the hepatitis B cirrhosis dysbiosis indicator (HBCDI) (7). Although simple to calculate, the CDR was not developed in HBV-related cirrhosis and has limited applicability. The POD index has been reported to predict SBP. However, its algorithmic complexity and limited consideration of etiology, together with the predominance of cross-sectional sampling, make it difficult to evaluate microbiota dynamics during disease progression. The HBCDI was derived in HBV-related cirrhosis, but its value for SBP risk assessment and for serial monitoring has not been established. Overall, existing indices do not provide a simple measure that both discriminates SBP risk and reflects disease evolution in HBV-related cirrhosis with ascites.
Therefore, the present study aimed to systematically characterize the gut microbiota in HBV-related cirrhosis across different disease stages, to develop the SBP microbiota-derived index (SBP-MI) as a novel dysbiosis index, and to evaluate its potential in longitudinal follow-up. Furthermore, we integrated SBP-MI with clinical factors to establish a risk prediction model for SBP. This microbiome-informed framework may help identify patients at higher SBP risk and support targeted preventive management.
2 Materials and methods
2.1 Study design and participants
This study was conducted at Beijing Ditan Hospital, Capital Medical University, between September 2019 and November 2021, and included both a case-control study and a prospective cohort component (Figure 1). The protocol was approved by the institutional ethics committee (DT-IRB-2018-040-01), and written informed consent was obtained. The prospective cohort was registered in the Chinese Clinical Trial Registry (trial registration number: ChiCTR-ROC-17013343).
Figure 1
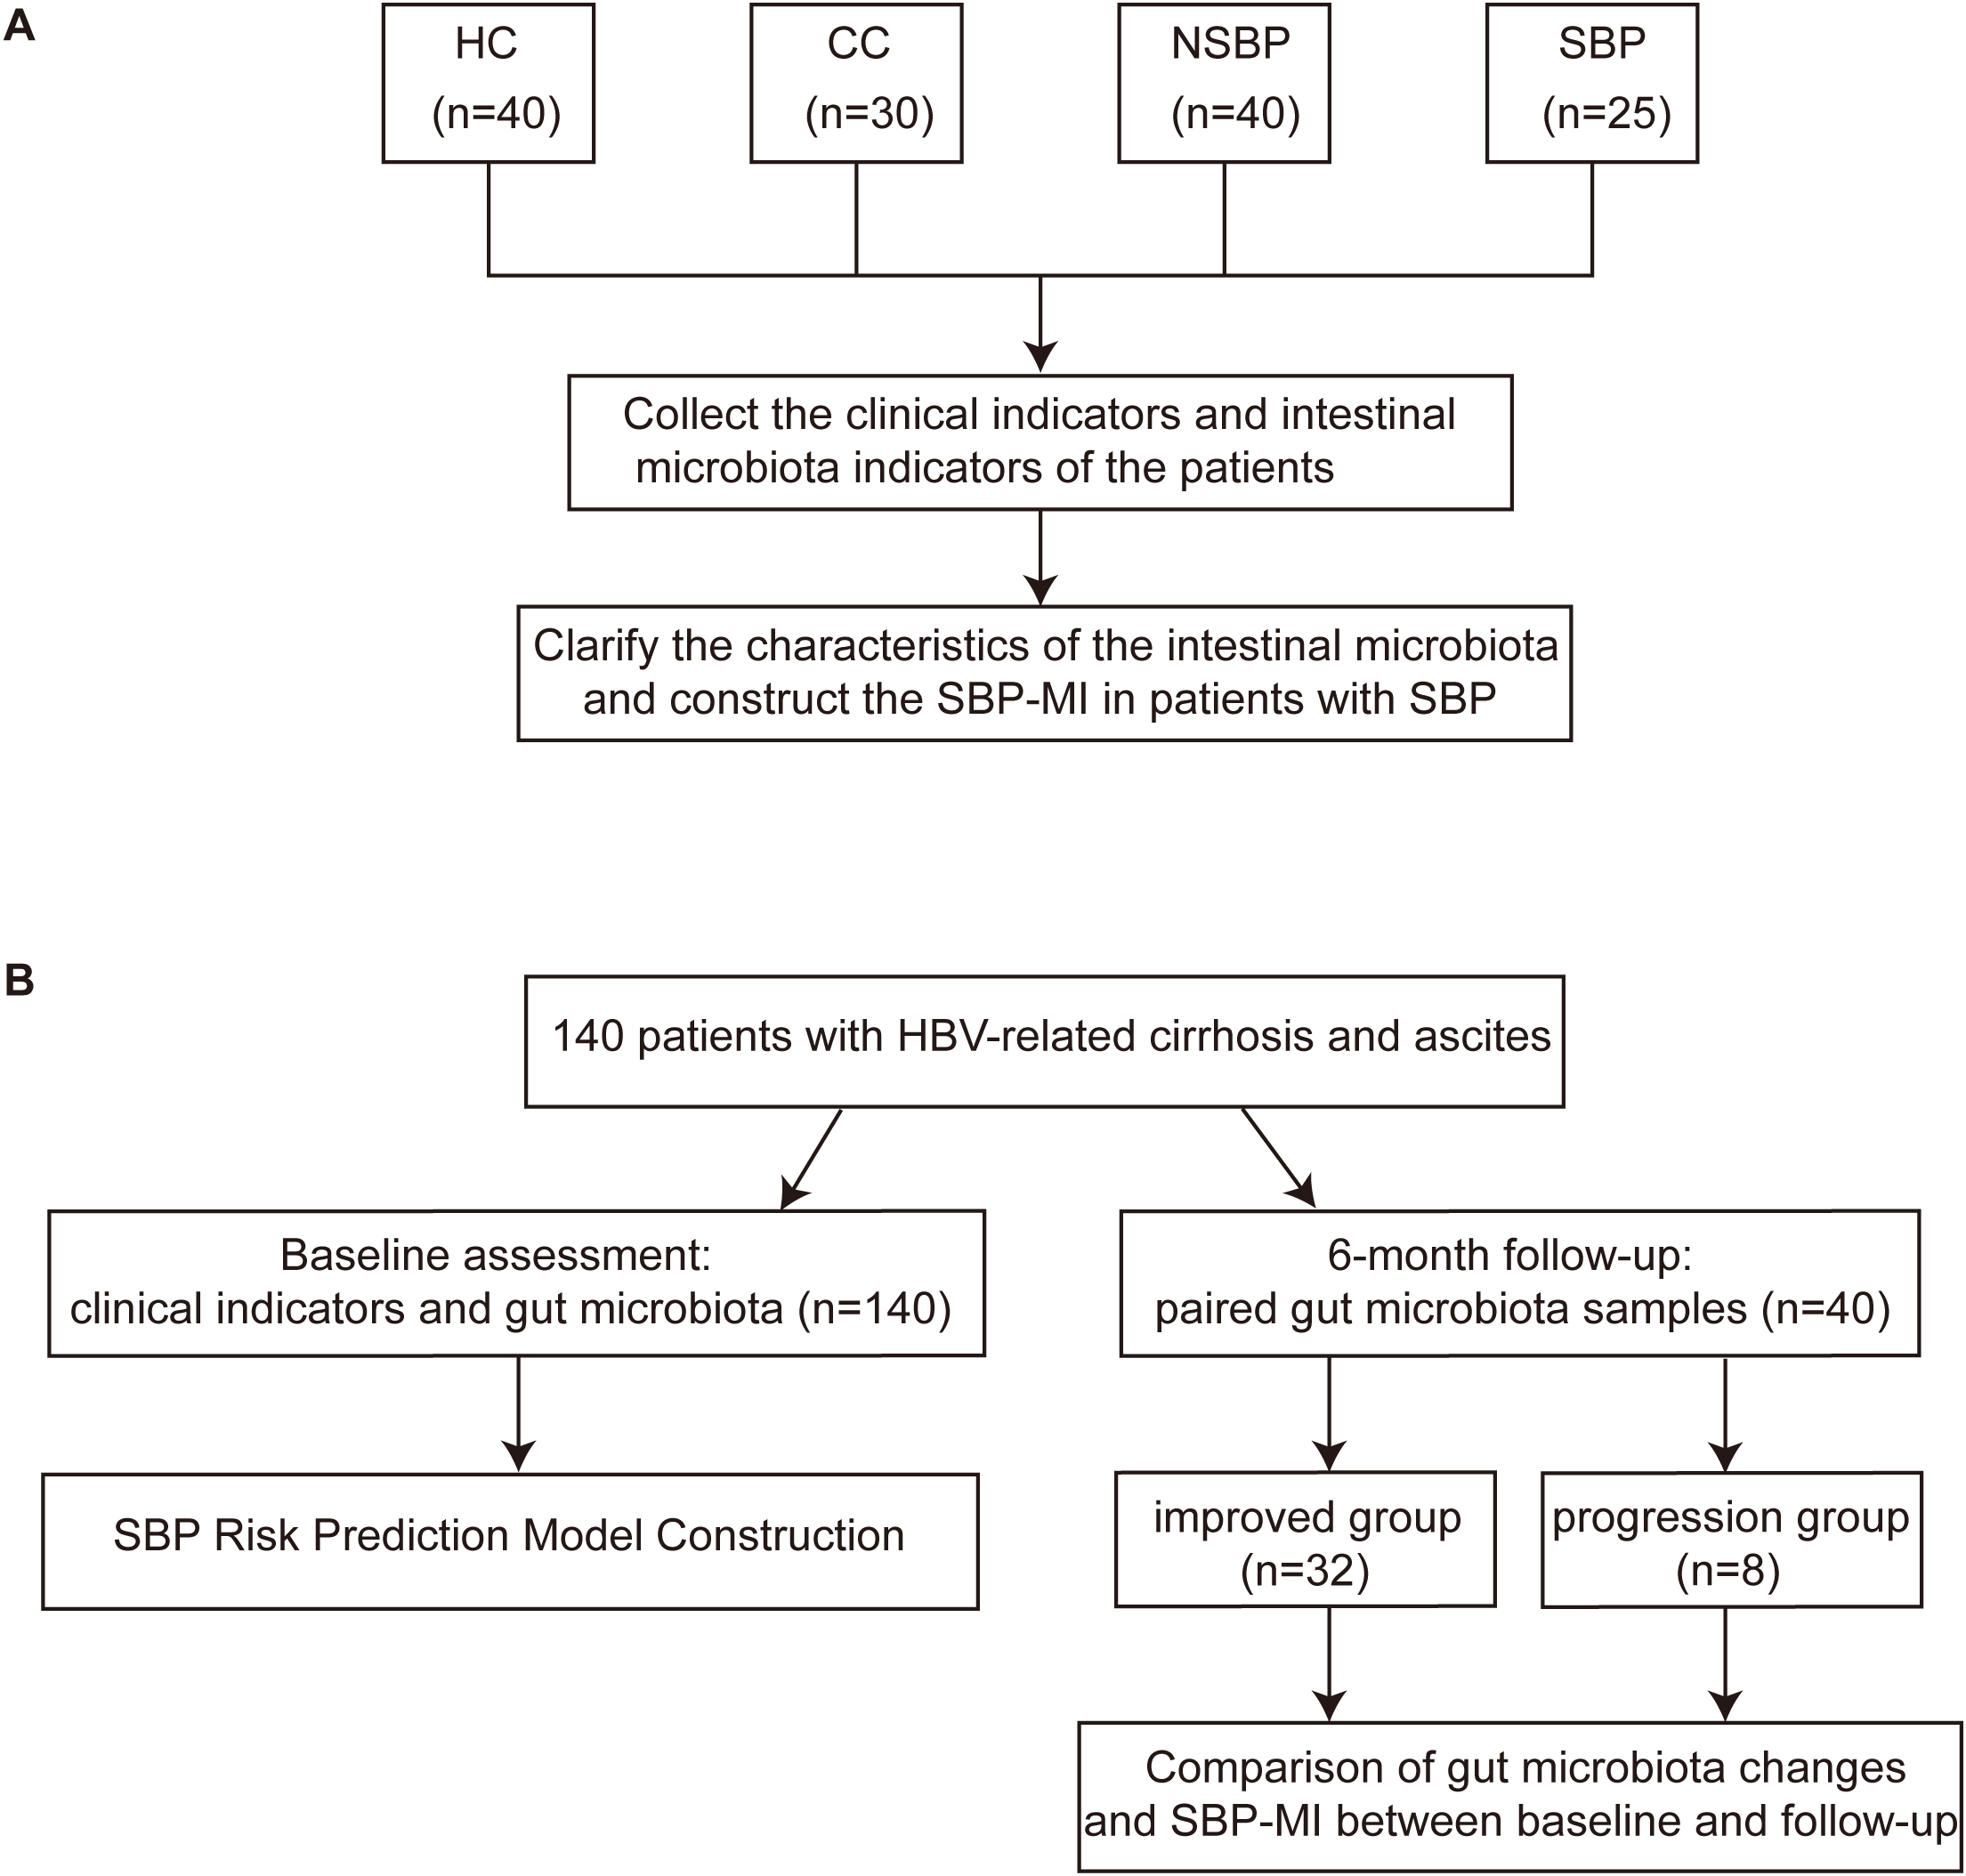
Design of the case-control study and the prospective cohort. (A) Case-control study comparing clinical parameters and gut microbiota among HC (n=40), CC (n=30), NSBP (n=40), and SBP (n=25), with construction of the SBP-MI. (B) A total of 140 patients with HBV-related cirrhosis and ascites were enrolled and underwent baseline clinical assessment and gut microbiota profiling (n = 140) for construction of the SBP risk prediction model, with incident SBP as the primary endpoint. Forty patients provided paired fecal samples at baseline and 6-month follow-up, including an improved group (n = 32) and a progression group (n = 8), to assess longitudinal changes in gut microbiota composition and SBP-MI between time points. HC, healthy control; CC, compensated HBV-related cirrhosis; NSBP, HBV-related cirrhosis with ascites but without spontaneous bacterial peritonitis; SBP, HBV-related cirrhosis with spontaneous bacterial peritonitis; SBP-MI, Spontaneous bacterial peritonitis microbiota-derived index.
In the case-control study, four groups were enrolled: healthy controls (HC, n=40), compensated HBV-related cirrhosis (CC, n=30), cirrhosis with ascites but without SBP (NSBP, n=40), and cirrhosis with SBP (SBP, n=25). Clinical and microbial characteristics were analyzed, and the SBP-MI was constructed from differential taxa and evaluated for discrimination. We conducted an unmatched, stratified case-control study with consecutive enrollment under prespecified criteria. The resulting group sizes and age distributions reflect real-world accrual patterns and underlying disease severity.
In the prospective cohort, 140 patients with HBV-related cirrhosis and ascites were followed for 6 months, with SBP occurrence as the primary endpoint. Stool samples were collected from 140 patients at baseline. The prospective cohort enrolled ascitic patients without SBP at baseline. Accordingly, SBP cases included in the case-control study were not part of the baseline prospective cohort. The SBP risk prediction model (SBP-RP) was constructed using baseline SBP-MI and baseline clinical variables. A subset of 40 patients provided paired baseline and follow-up fecal samples, enabling assessment of clinical progression or improvement on the basis of microbial dynamics and changes in SBP-MI.
2.2 Inclusion and exclusion criteria
Exclusion criteria: The case-control and prospective studies applied identical exclusion criteria. Exclusion criteria included non-HBV etiologies of liver disease, hepatocellular carcinoma, other malignancies, severe comorbidities, active tuberculosis, concomitant extrahepatic infections, non-hepatic ascites, and the presence of a transjugular intrahepatic portosystemic shunt (TIPS) at baseline and follow-up.
Inclusion criteria: Core inclusion criteria were harmonized in the case-control and prospective studies. Core inclusion criteria were >18 years of age and had not received antibiotics, probiotics, proton pump inhibitors, bowel-preparation cathartics, or motility-altering agents including lactulose within 1 month before enrollment. This 1-month window was used to reduce recent medication-related perturbations of the gut microbiota at the time of sampling. Participants had not consumed yogurt and had not used other microbiota-altering agents. All participants consumed a mixed diet of plant- and animal-based foods, without vegetarian or other restrictive dietary patterns. Because the enrolled clinical states differed, disease-specific inclusion criteria were as follows. In the case-control study: HC required normal clinical, laboratory, and ultrasound findings without major systemic disease. CC was defined by chronic HBV infection with histologic, imaging, or endoscopic evidence of cirrhosis, liver stiffness >12.0 kPa, and Child–Pugh A (<7). NSBP required chronic HBV infection, cirrhosis with ascites, and absence of infection, encephalopathy, or gastrointestinal bleeding. SBP required fulfillment of NSBP criteria plus acute peritonitis or systemic inflammatory response, and an ascitic polymorphonuclear cell count ≥0.25 × 10⁹/L without secondary causes. In the prospective cohort study: HBV-related cirrhosis with ascites but without SBP at baseline.
2.3 Definition of improved and progression groups
Patients with HBV-related cirrhosis and ascites were prospectively followed for 6 months.
Progression group: Progression was defined within 6 months if any of the following applied:
-
Ascites grade increased from baseline according to EASL guidelines (8). Grade 1 is mild and detectable only by ultrasound. Grade 2 is moderate with symmetrical abdominal distension. Grade 3 is large or tense with marked abdominal distension.
-
Spontaneous bacterial peritonitis, death, or liver transplantation occurred.
-
Biochemical worsening was present, defined as ALT or AST increasing by at least 50% from baseline and exceeding the upper limit of normal, defined as ALT greater than 40 U/L or AST greater than 50 U/L, or serum albumin decreasing from baseline or falling below 40 g/L.
Improved group: Improved status required that all of the following criteria were met:
-
Ascites grade decreased or remained unchanged.
-
No spontaneous bacterial peritonitis, death, or liver transplantation.
-
Biochemical improvement, defined as decreases in ALT and AST from baseline or values within the normal range (ALT ≤ 40 U/L; AST ≤ 50 U/L), together with an increase in serum albumin from baseline or restoration to the normal range (40–55 g/L).
Patients with stable disease who had ALT ≤ 40 U/L and AST ≤ 50 U/L and albumin 40 to 55 g/L at baseline, remained within these ranges at follow-up, and had no increase in ascites grade and no SBP, death, or liver transplantation were classified as Improved.
2.4 Sample collection and sequencing
Demographic and clinical data were recorded at enrollment. Assessments of oesophago-gastric varices and measurement of portal pressure by the hepatic venous pressure gradient (HVPG) are invasive and are not routinely indicated outside the prophylaxis or treatment of variceal bleeding. Transient elastography may be unreliable in the presence of tense ascites or acute infection. In SBP, clinical instability at enrollment therefore precluded routine assessment of oesophago-gastric varices, portal pressure, and transient elastography. Fasting peripheral blood samples were collected for biochemical and virological assays. Fresh stool samples were obtained using sterile containers, transported on ice, aliquoted within 30 minutes, and stored at –80 °C until analysis. Microbial DNA extracted from fecal samples was used to amplify the V3–V4 region of the 16S rRNA gene, and the resulting libraries were sequenced on the Illumina NovaSeq platform. Further details are provided in the Supplementary Methods.
2.5 Construction of the SBP-MI
Taxa for the SBP-MI were selected in the case-control discovery set (HC, CC, NSBP, SBP) using two complementary genus level criteria. First, LEfSe was used to determine enrichment direction and effect size, with LDA scores defining the candidate pool. Second, four group mean relative abundance heatmaps were inspected to confirm trends consistent with disease staging. Detailed genus selection was described in the Results section. The SBP-MI was then calculated as follows: xg denotes the genus-level relative abundance in each sample. A pseudocount of 10–6 was added to each xg to handle zero values and enable log-ratio calculation.
HBCDI was previously developed by our group to quantify gut microbial imbalance in patients with HBV-related cirrhosis. The HBCDI was then calculated as follows: HBCDI = (Escherichia − Shigella + Streptococcus + Lactobacillus)/(Ruminococcus + Prevotella + Bacteroides) (7, 9).
2.6 Bioinformatics and statistical analysis
Raw reads were processed in QIIME 2 (release 2025.7) for 97% OTU clustering, taxonomic assignment, and diversity analyses. Differential taxa were identified using LEfSe after exporting the feature table and metadata. Baseline laboratory data were complete, with no missing values. Data visualization was performed in R (v4.5.1). Group comparisons were conducted with appropriate parametric or non-parametric tests, and categorical variables with χ² or Fisher’s exact test. Given the limited number of SBP events in the prospective cohort, predictive modeling was performed using Firth’s penalized logistic regression to reduce small-sample bias and address potential separation. Model performance was assessed by ROC analysis, bootstrap validation, and calibration. P<0.05 (two-sided) was considered significant. Details are provided in the Supplementary Methods.
3 Results
3.1 Baseline clinical characteristics of HC, CC, NSBP, and SBP
A total of 30 patients with CC, 40 with NSBP, 25 with SBP, and 40 HC were included in the analysis. Baseline characteristics of the four groups are summarized in Table 1. Compared with HC and CC, NSBP and SBP were characterized by significantly higher TBil and lower RBC, ALB, HGB, and PLT (P < 0.05). The median NE% was numerically higher in the SBP group; however, the difference was not statistically significant. Smoking status was comparable across groups. Diuretic therapy was universal in the NSBP and SBP cohorts, consistent with standard ascites management. Model for End-Stage Liver Disease (MELD) increased progressively with disease stage, and Child–Pugh class shifted toward more advanced categories. In the SBP group, 5 of 25 patients (20%) had a prior history of SBP.
Table 1
| Characteristics | HC (n=40) | CC (n=30) | NSBP (n=40) | SBP (n=25) |
|---|---|---|---|---|
| Male (%) | 30 (75.0)a | 17 (56.7)a | 27 (67.5)a | 19 (76.0)a |
| BMI | 23.6 (22.5–25.2)a | 24.0 (22.9–24.7)a | 24.0 (23.0–25.3)a | 23.1 (22.1–25.0)a |
| Age | 52.5 ± 7.6a | 49.2 ± 9.3a | 52.5 ± 9.4a | 60.6 ± 12.5b |
| ALT (U/L) | 17.4 (13.0–22.1)a | 24.2 (21.1–32.0)b | 27.2 (16.1–37.3)b | 19.5 (14.0–32.7)ab |
| AST (U/L) | 18.8 (17.2–21.6)a | 26.6 (23.2–34.3)b | 34.0 (25.3–50.1)b | 27.2 (19.9–59.3)b |
| ALB (g/L) | 46.4 (44.3–47.4)a | 44.3 (39.4–48.3)a | 32.0 (27.8–37.5)b | 29.5 (26.3–32.8)b |
| TBil (μmol/L) | 13.8 (11.8–15.2)a | 14.9 (11.4–22.4)a | 30.1 (18.2–53.8)b | 51.6 (31.9–74.0)b |
| Cr (μmol/L) | 73.5 (63.1–80.4)a | 65.2 (57.6–72.2)a | 66.9 (60.4–76.1)a | 77.3 (60.5–88.1)a |
| WBC (109/L) | 5.8 (4.8–6.1)a | 4.3 (3.7–5.4)b | 2.9 (2.2–3.6)c | 3.0 (2.4–4.7)c |
| NE (%) | 56.2 (52.3–61.5)a | 56.1 (53.9–61.0)a | 57.1 (50.6–65.1)a | 70.1 (50.6–75.7)a |
| RBC (1012/L) | 4.8 (4.5–5.0)a | 4.8 (4.3–5.0)a | 3.5 (3.2–4.2)b | 3.1 (2.6–3.9)b |
| HGB (g/L) | 146.0 (140.0–155.0)a | 143.0 (129.8–156.8)a | 114.5 (96.8–127.2)b | 104.0 (83.5–111.0)b |
| PLT (109/L) | 235.5 (180.8–264.2)a | 104.0 (92.0–135.8)b | 56.0 (42.4–81.2)c | 62.0 (41.0–88.2)c |
| Dietary habit | Mix | Mix | Mix | Mix |
| Smoking (%) | 8(20)a | 7(23.3)a | 7(17.5)a | 5(20)a |
| Diuretics (%) | 0(0)a | 0(0)a | 40(100)b | 25(100)b |
| Previous history of SBP (%) | 0(0)a | 0(0)a | 0(0)a | 5(20)b |
| MELD | 7.0(7.0-7.2)a | 8.5(7.0-9.8)b | 12.0(9.8-15.0)c | 19.0(15.0-21.0)d |
| Child-Pugh A, n (%) | 40 (100)a | 30 (100)a | 12 (30)b | 1 (4)c |
| Child-Pugh B, n (%) | 0 (0)a | 0 (0)a | 21 (52.5)b | 10 (40)c |
| Child-Pugh C, n (%) | 0 (0)a | 0 (0)a | 7 (17.5)b | 14 (56)c |
Baseline clinical characteristics of HC, CC, NSBP, and SBP.
Data were shown as mean ± SD, median (IQR), or n (%). Different superscript letters (a, b, c, d) denote significant differences between groups (P < 0.05).
HC, Healthy control; CC, Compensated HBV-related cirrhosis; NSBP, HBV-related cirrhosis with ascites but without spontaneous bacterial peritonitis; SBP, HBV-related cirrhosis with spontaneous bacterial peritonitis; BMI, body mass index; ALT, alanine aminotransferase; AST, aspartate aminotransferase; ALB, albumin; TBil, total bilirubin; Cr, creatinine; WBC, white blood cell; NE, neutrophil percentage; RBC, red blood cell; HGB, hemoglobin; PLT, platelet; MELD, Model for End-Stage Liver Disease.
3.2 Gut microbiota dysbiosis is most pronounced in SBP
Analysis of α-diversity showed that the HC group had the highest Shannon and phylogenetic diversity (PD) whole-tree indices, indicating the greatest microbial and phylogenetic diversity. Compared with HC and CC, both NSBP and SBP exhibited significantly decreased diversity (P < 0.05), with SBP showing the lowest PD whole-tree index (Figure 2A). Based on unweighted UniFrac β-diversity (Figure 2B), distance values in NSBP and SBP were higher than those in HC and CC. Principal coordinates analysis (PCoA) further revealed a clear separation between diseased groups and healthy controls, suggesting marked alterations in community composition during disease progression.
Figure 2
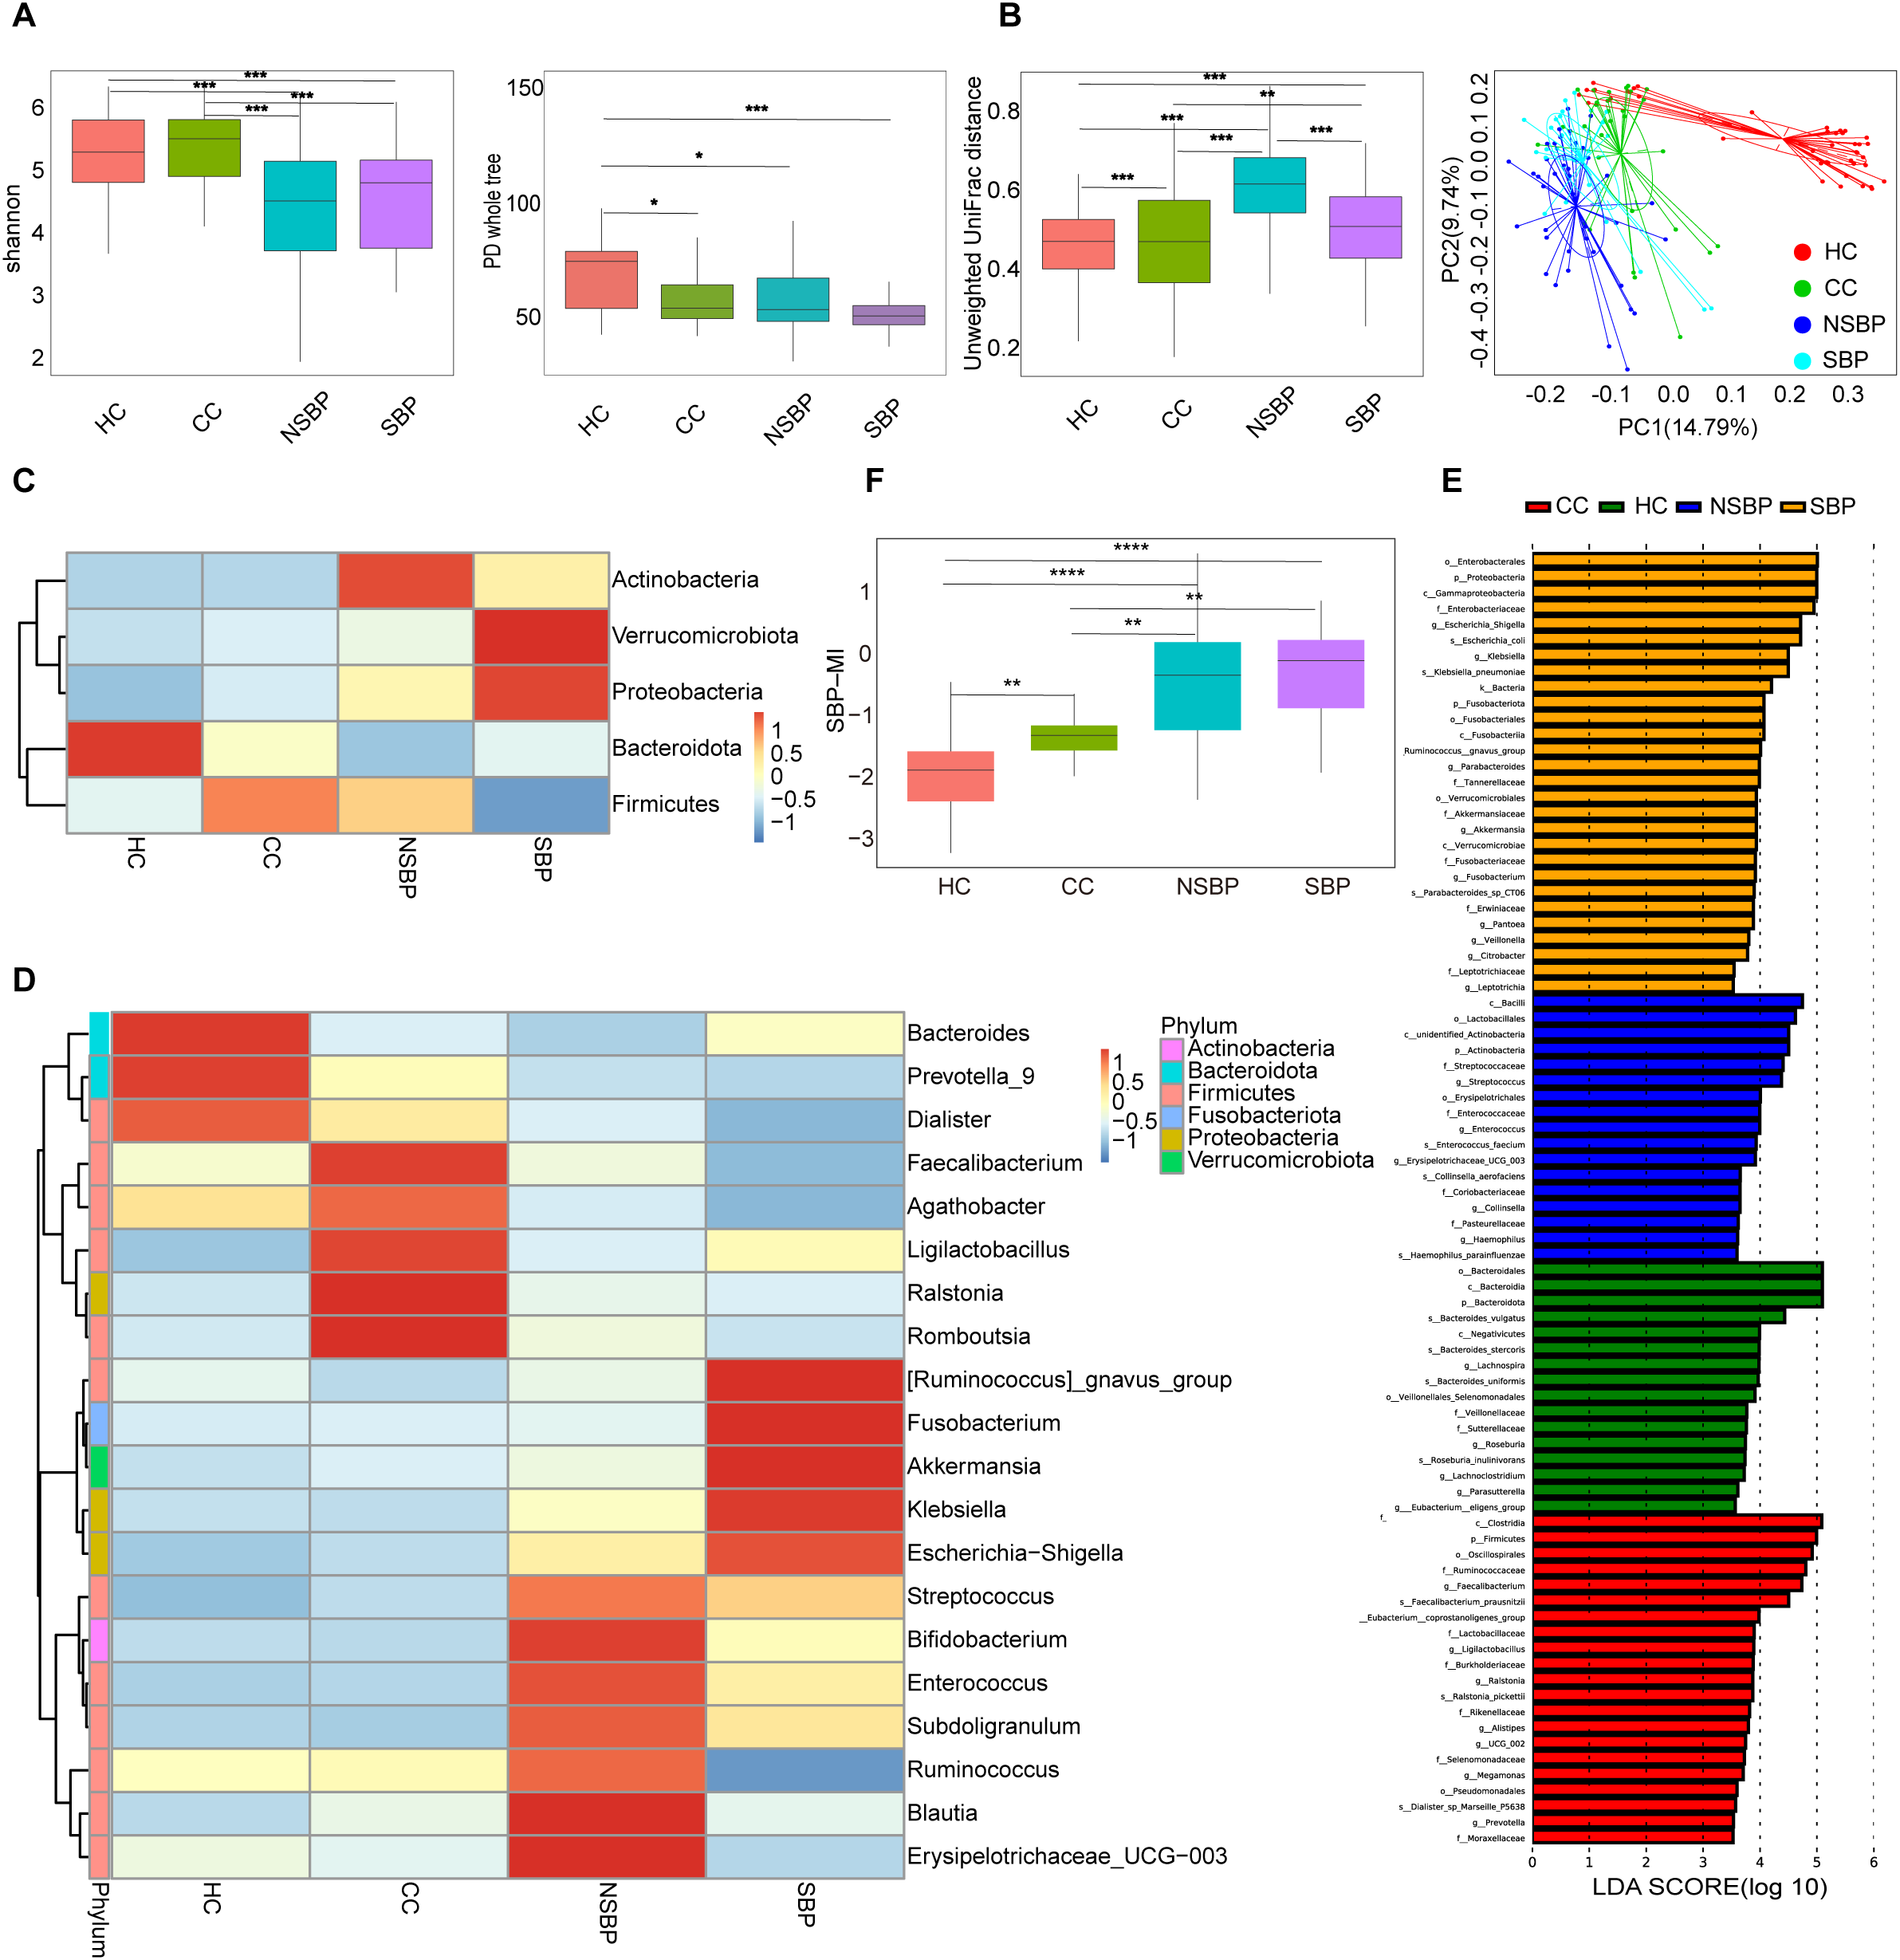
Gut microbial diversity and composition in HC, CC, NSBP, and SBP. (A) α-diversity indices (Shannon and PD whole tree); (B) β-diversity based on Unweighted UniFrac distances and PCoA; (C) Relative abundance at the phylum level; (D) Relative abundance at the genus level; (E) Differential taxa identified by LEfSe analysis(LDA>3.5); (F) Boxplots showing the distribution of SBP-MI among HC, CC, NSBP, and SBP groups. HC, Healthy control; CC, Compensated HBV-related cirrhosis; NSBP, HBV-related cirrhosis with ascites but without spontaneous bacterial peritonitis; SBP, HBV-related cirrhosis with spontaneous bacterial peritonitis; PCoA, principal coordinates analysis; LEfSe, linear discriminant analysis effect size; LDA, linear discriminant analysis; SBP-MI, Spontaneous bacterial peritonitis microbiota-derived index. *P < 0.05, **P < 0.01, ***P < 0.001, and ****P < 0.0001.
At the phylum level (Figure 2C), Firmicutes, Bacteroidota, Proteobacteria, Actinobacteria, and Verrucomicrobiota together accounted for more than 90% of the total abundance. HC was dominated by Bacteroidota. With disease progression, Bacteroidota progressively decreased, whereas Proteobacteria markedly increased. In SBP, Firmicutes were reduced, while Proteobacteria and Verrucomicrobiota were enriched. At the genus level (Figure 2D), HC was enriched in Bacteroides, Prevotella_9, and Faecalibacterium, whereas pathogenic genera such as Escherichia–Shigella, Klebsiella, and Streptococcus peaked in SBP. LEfSe analysis identified stage-specific enriched taxa (Figure 2E): Roseburia in HC; Faecalibacterium and Prevotella in CC; Enterococcus and Haemophilus in NSBP; and Escherichia–Shigella, Klebsiella, and Veillonella in SBP. Collectively, these findings indicate that the progression of HBV-related cirrhosis is accompanied by a gradual loss of commensals and an expansion of potential pathogens, with the shift being most pronounced at the SBP stage.
3.3 Construction of the SBP-MI index
To quantify gut microbial imbalance associated with disease progression, we constructed the SBP-MI by integrating the results of LEfSe analysis and genus-level abundance heatmaps. Accordingly, the numerator comprised Escherichia–Shigella, Klebsiella, and Veillonella, which were enriched in SBP with LDA scores of 4.71, 4.49, and 3.80, respectively. Streptococcus showed a stepwise increase from HC/CC to NSBP/SBP on the heatmap (Figure 2D) and was included to capture the progression toward SBP. The denominator comprised Roseburia, Bacteroides, Prevotella, and Faecalibacterium. Roseburia was enriched in HC (LDA 3.74). Bacteroides and Prevotella showed the highest mean relative abundance in HC and were clearly separated from the other groups. Faecalibacterium was higher in HC and CC and lowest in SBP. The SBP-MI differed significantly across the four groups (P < 0.001). Pairwise comparisons revealed significant differences between HC and NSBP, HC and SBP, as well as between CC and SBP (Figure 2F). Trend analysis further demonstrated that the SBP-MI increased progressively with disease progression (P < 0.001). In cirrhosis (CC, NSBP, SBP), SBP-MI correlated positively with MELD (Spearman ρ=0.36; 95% CI, 0.17–0.54; P = 0.0003).
3.4 Gut microbial shifts associated with clinical improvement and progression in ascites
We prospectively enrolled 140 patients with HBV related cirrhosis and ascites and followed them for 6 months. Forty patients provided paired fecal samples at baseline and follow-up. Of these, 32 were classified as improved and 8 as progressed. The paired-sample analyses were designed to determine whether SBP-MI and overall community composition track clinical improvement versus progression.
In the improved group (Supplementary Table S1), ALB, HGB, and RBC increased, whereas TBil, AFP, HBV DNA, and MELD decreased at follow-up (P < 0.05). α-diversity based on observed species was significantly higher at follow-up (Figure 3A), and PCoA revealed separation between baseline and follow-up samples (Figure 3B). At the genus level, Klebsiella, Streptococcus, and Enterococcus decreased (Figure 3C). LEfSe confirmed reduced Streptococcus and enrichment of Bacteroides, Prevotella, and Faecalibacterium (Figure 3D).
Figure 3
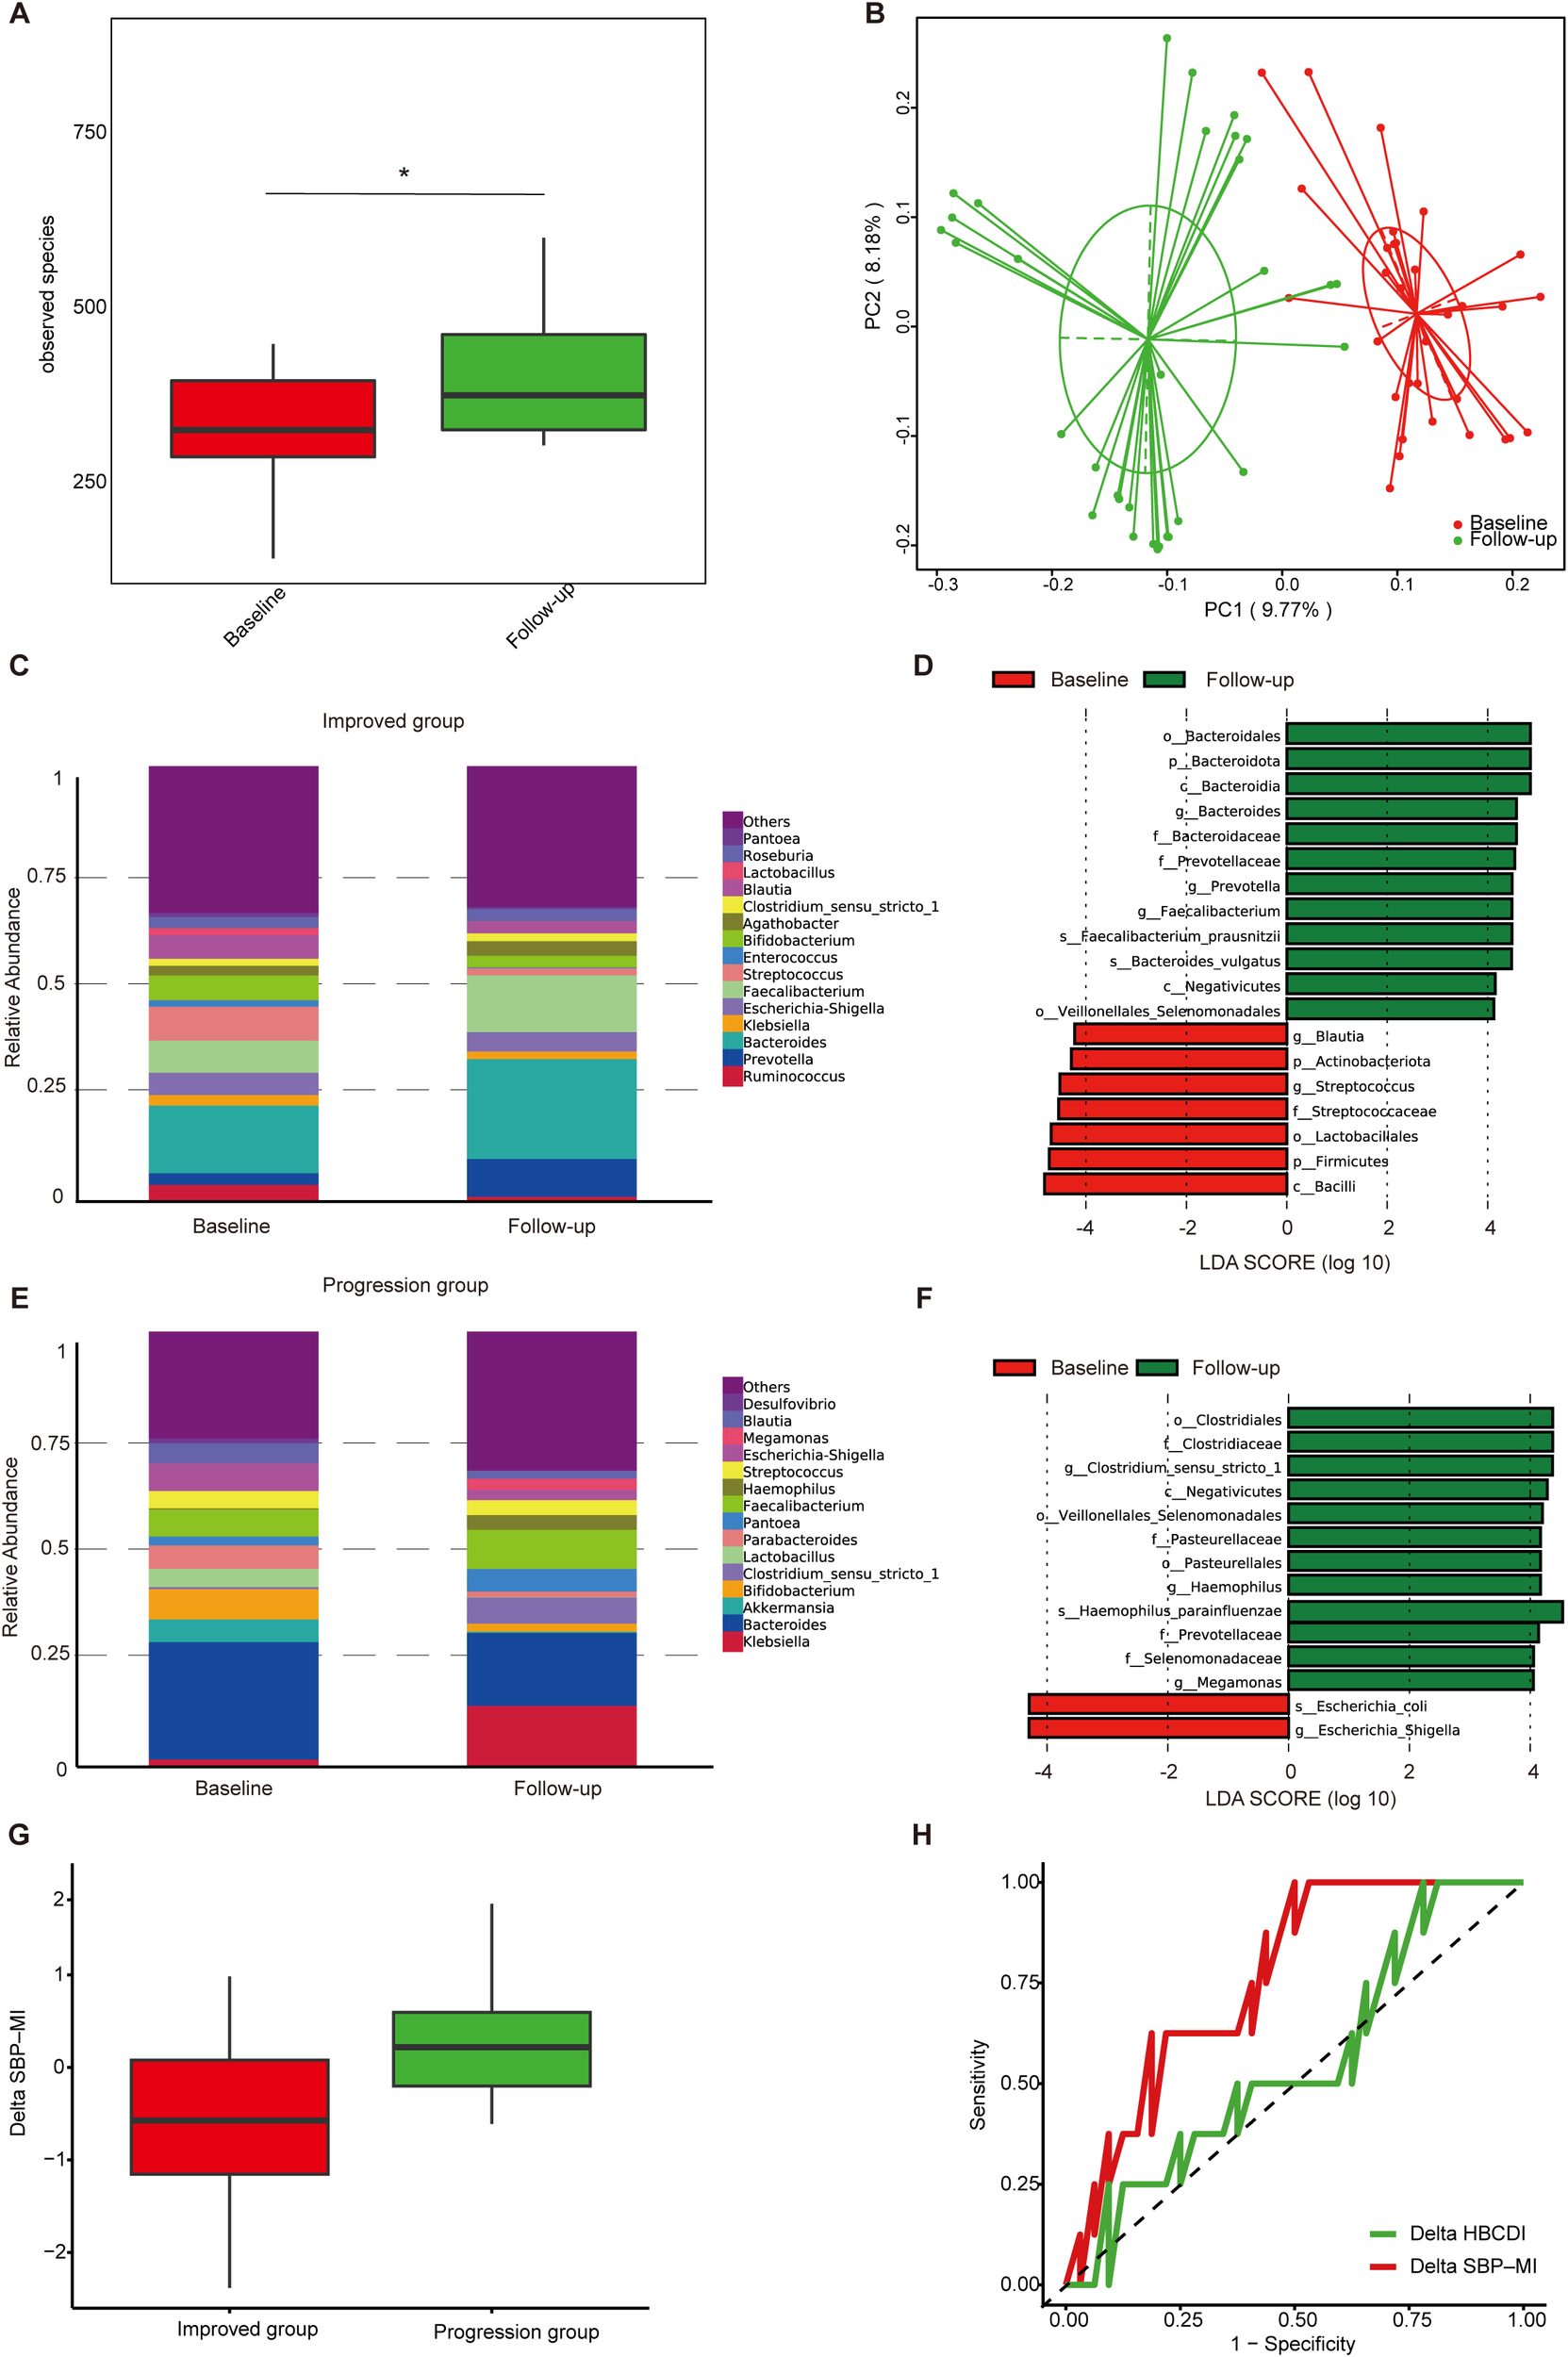
Gut microbiota dynamics in ascites patients during follow-up. (A) α-diversity based on observed species in the improved group; (B) PCoA based on Binary Jaccard distance in the improved group; (C) Genus-level relative abundance in the improved group; (D) Differential taxa identified by LEfSe analysis in the improved group (LDA>4); (E) Genus-level relative abundance in the progression group; (F) Differential taxa identified by LEfSe analysis in the progression group (LDA>4); (G) Boxplots of Delta SBP-MI in the progression and improved groups; (H) ROC curve analysis of Delta SBP-MI (AUC 0.76, 95%CI 0.60–0.93) and Delta HBCDI (AUC 0.55, 95%CI 0.33–0.78) for predicting clinical outcomes. PCoA, principal coordinates analysis; LEfSe, linear discriminant analysis effect size; LDA, linear discriminant analysis; ROC, receiver operating characteristic; SBP-MI, Spontaneous bacterial peritonitis microbiota-derived index; HBCDI, Hepatitis B Cirrhosis Dysbiosis Indicator. *P < 0.05.
In the progression group (Supplementary Table S2), TBil and MELD increased at follow-up (P < 0.05). At the genus level, Klebsiella and Haemophilus increased, whereas Akkermansia, Bifidobacterium, and Lactobacillus decreased (Figure 3E). LEfSe revealed higher abundance of Escherichia–Shigella at baseline and Haemophilus parainfluenzae at follow-up (Figure 3F). Overall, the improved group was associated with increased diversity and enrichment of commensals, whereas the progression group was characterized by persistence or further enrichment of potential pathogens.
To further assess longitudinal changes in microbial indices, we calculated ΔSBP-MI and ΔHBCDI as the differences between follow-up and baseline values in the 40 patients with paired fecal samples. (ΔSBP-MI=SBP-MIfollow-up-SBP-MIbaseline; ΔHBCDI= HBCDIfollow-up- HBCDIbaseline) ΔSBP-MI was significantly higher in the progression group than in the improved group (P = 0.02) (Figure 3G). ROC analysis showed that ΔSBP-MI had an AUC of 0.76 (95% CI: 0.60–0.93). At the optimal cut-off of −0.62, ΔSBP-MI achieved a sensitivity of 1.00 and a specificity of 0.50. By comparison, ΔHBCDI showed lower discrimination, with an AUC of 0.55 (95% CI: 0.33–0.78) (Figure 3H), supporting the better performance of ΔSBP-MI in distinguishing improved from progressed outcomes.
3.5 Development of the SBP-RP model based on clinical and microbial factors
In a 6-month prospective cohort comprising 140 patients with HBV-related cirrhosis and ascites, the primary endpoint was incident SBP, which occurred in 15 patients (10.7%). No patient was lost to follow-up, died, or underwent liver transplantation. Baseline clinical characteristics of patients with HBV-related cirrhosis and ascites were summarized in Supplementary Table S3. The association between a previous history of SBP and incident SBP during follow-up was summarized in Supplementary Table S4. The AUC for SBP-MI was 0.83 (95% CI: 0.74–0.92), compared with 0.73 for CDR (95% CI: 0.58–0.89) and 0.71 for HBCDI (95% CI: 0.57–0.85), indicating superior discriminatory performance of SBP-MI (Supplementary Figure S1). As shown in Table 2, 10 variables with P < 0.10 in univariable analyses were entered into the multivariable Firth logistic regression. SBP-MI, INR, and previous history of SBP remained independent predictors (P < 0.05). The final predictive equation was: SBP-RP = –6.8107 + 2.9873 × SBP-MI + 2.4316 × INR + 2.0950 × previous history of SBP. Discrimination was good, with an AUC of 0.91 (95% CI: 0.82–0.99). At the optimal cutoff of 0.262, the sensitivity was 0.80 and the specificity was 0.944 (Figure 4A). Bootstrap optimism correction (500 resamples; seed 2025) gave an optimism-corrected AUC of 0.90 (95% CI: 0.82–0.99). Calibration was acceptable overall. The calibration slope was 1.11 (95% CI: 1.08–1.30) and the Brier score was 0.051, with a non-significant Hosmer–Lemeshow test (P = 0.77). However, the calibration curve deviated from the ideal line at higher predicted probabilities (Figure 4B). These findings should be interpreted cautiously given the low number of events. A nomogram was generated to enhance clinical applicability (Figure 4C). These results suggest that the SBP-RP model can stratify short-term SBP risk in HBV related cirrhosis with ascites. Its longer-term performance will be assessed with extended follow-up and validated in larger external cohorts.
Table 2
| Characteristics | Univariable | Multivariable | ||
|---|---|---|---|---|
| OR (95% CI) | p value | OR (95%CI) | p value | |
| SBP-MI | 10.953 (3.616 – 44.297) |
<0.001 | 19.832 (5.091 – 140.054) |
<0.001 |
| INR | 3.950 (1.483 – 11.296) |
0.007 | 11.377 (2.989 – 55.277) |
<0.001 |
| HBCDI | 1.153 (1.049 – 1.394) |
0.008 | – | – |
| NE | 1.048 (1.006 – 1.097) |
0.018 | – | – |
| ALB | 0.904 (0.821 – 0.986) |
0.021 | – | – |
| CHE | 1.000 (0.999 – 1.000) |
0.022 | – | – |
| Na | 0.838 (0.729 – 0.962) |
0.029 | – | – |
| Previous history of SBP | 3.019 (1.016 – 8.855) |
0.057 | 8.125 (1.976 – 40.901) |
0.003 |
| Cr | 1.005 (0.995 – 1.013) |
0.070 | – | – |
| Age | 1.043 (0.999 – 1.090) |
0.083 | – | – |
| TBil | 1.007 (0.998 – 1.015) |
0.158 | – | – |
| Gender | 2.558 (0.729 – 13.475) |
0.231 | – | – |
| RBC | 0.658 (0.312 – 1.377) |
0.251 | – | – |
| WBC | 1.123 (0.838 – 1.455) |
0.666 | – | – |
| PLT | 1.002 (0.991 – 1.010) |
0.688 | – | – |
| Diabetes | 1.469 (0.412 – 4.507) |
0.739 | – | – |
| ALT | 1.001 (0.993 – 1.006) |
0.788 | – | – |
| AST | 1.001 (0.993 – 1.006) |
0.808 | – | – |
| log10HBV DNA | 1.027 (0.767 – 1.317) |
0.873 | – | – |
| GLU | 1.043 (0.805 – 1.255) |
0.997 | – | – |
Univariable and multivariable logistic regression analysis of risk factors for SBP.
SBP, spontaneous bacterial peritonitis; SBP-MI, Spontaneous bacterial peritonitis microbiota-derived index; INR, international normalized ratio; HBCDI, Hepatitis B Cirrhosis Dysbiosis Indicator; NE, neutrophil percentage; ALB, albumin; CHE, cholinesterase; Cr, creatinine; TBil, total bilirubin; RBC, red blood cell; WBC, white blood cell; PLT, platelet; ALT, alanine aminotransferase; AST, aspartate aminotransferase; HBV DNA, hepatitis B virus DNA; GLU, glucose.
Figure 4
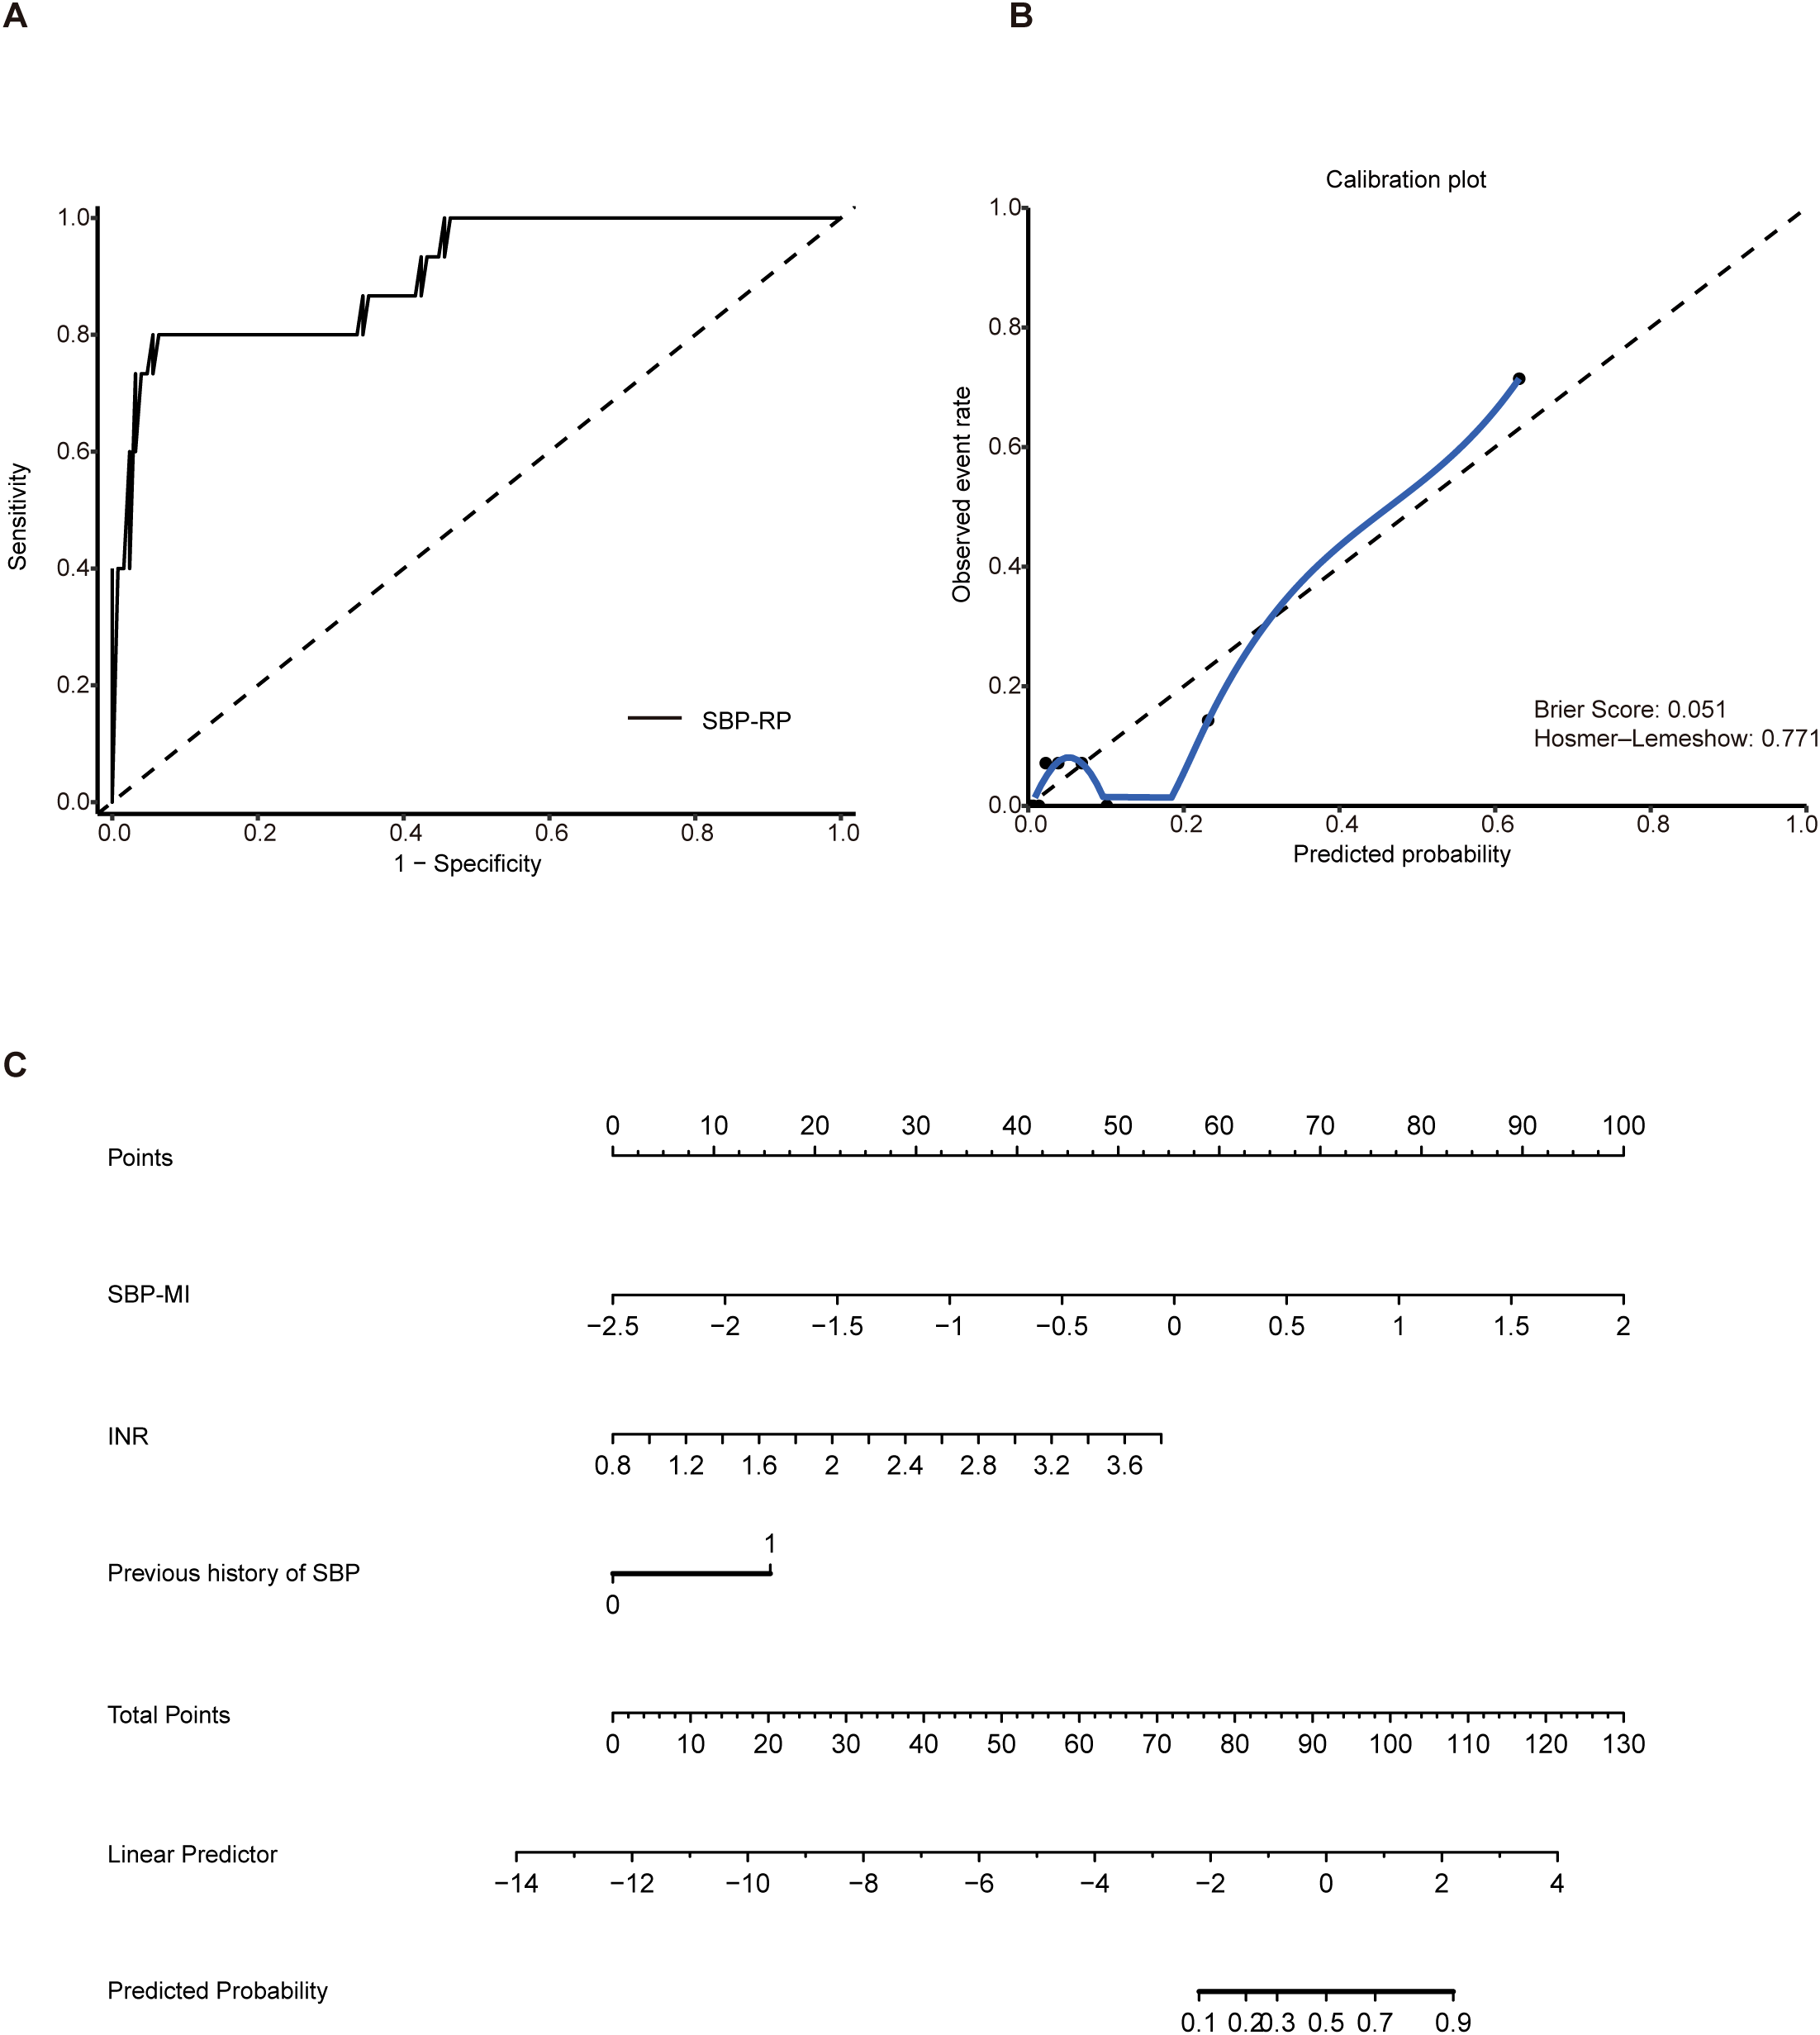
Construction of the SBP-RP model. (A) ROC curve of SBP-RP (AUC 0.91, 95% CI: 0.82–0.99); (B) Calibration plot of the SBP-RP model; (C) Nomogram of SBP-RP. SBP, spontaneous bacterial peritonitis; SBP-RP, SBP risk prediction model; ROC, receiver operating characteristic; AUC, area under the curve.
4 Discussion
SBP represents a serious complication of cirrhosis and is strongly linked to gut dysbiosis and bacterial translocation (4). Although the role of microbiota in cirrhosis has been increasingly recognized, microbiota-derived indices specifically addressing SBP risk or progression remain limited. In this study, we systematically profiled HBV-related cirrhosis across disease stages and established the SBP-MI, which captured microbial alterations associated with disease progression. Furthermore, by integrating microbial and clinical parameters, we developed the SBP-RP model as a potential tool for early identification of high-risk patients and guiding preventive strategies.
Mechanistically, the microbiota–gut–liver axis provides a unifying framework for these observations. Increased intestinal permeability permits translocation of pathogen associated molecular patterns, such as lipopolysaccharide and bacterial DNA, into the portal and systemic circulation (4). This influx amplifies systemic inflammation and promotes cirrhosis associated immune dysfunction, a state of concurrent immune activation and impaired antimicrobial defenses that heightens susceptibility to infection (10). Cirrhosis is associated with mycobiome alterations, including reduced fungal diversity and increased Candida abundance. Invasive fungal infections in this population are linked to worse early outcomes, suggesting that fungal overgrowth may further weaken barrier function and increase infection risk (11). The role of fungi in SBP will be explored in future work.
In the case-control analysis, α-diversity was significantly reduced and β-diversity analyses showed a clear separation from healthy controls (Figures 2A, B), suggesting marked remodeling of the gut microbial community in cirrhosis complicated by SBP. Previous studies have reported that cirrhosis-associated dysbiosis worsens with decompensation and infectious episodes and is linked to greater clinical severity and adverse outcomes (12). Accordingly, the loss of diversity observed represents a microbiome feature accompanying disease progression. From a pathophysiological standpoint (4), cirrhosis is frequently associated with disrupted mucosal immune homeostasis and impaired intestinal barrier integrity. These abnormalities may act in concert with microbial community alterations to facilitate pathological bacterial translocation, thereby increasing susceptibility to SBP. In this context, a key feature was the depletion of Prevotella, Roseburia, Faecalibacterium, and Bacteroides, as shown in Figures 2D, E. These genera are central to microbial metabolism and the production of SCFAs (short-chain fatty acids). Roseburia and Faecalibacterium are typical butyrate producers. Butyrate not only serves as the main energy source for colonic epithelial cells but also regulates immune responses and preserves mucosal barrier integrity by upregulating tight junction proteins such as ZO-1, claudin, and occludin, thereby reducing intestinal permeability and bacterial translocation (13). Rivera-Chávez et al. showed that loss of butyrate-producing Clostridia increases luminal oxygen and drives Salmonella enterica expansion (14). By contrast, Bacteroides and Prevotella mainly produce acetate and propionate. These metabolites contribute to energy metabolism and immune regulation, and also act as substrates for butyrate-producing bacteria through cross-feeding (15), thereby indirectly supporting butyrate formation and maintaining the overall SCFAs balance. Experimental studies have demonstrated that SCFAs supplementation reduces intestinal permeability and alleviates liver injury in models of liver disease (16). Consistently, clinical studies have reported significantly decreased levels of acetate, propionate, and butyrate in patients with cirrhosis (17), suggesting that reduced SCFAs may contribute to both disease progression and microbial dysbiosis. At the same time, 16S rRNA profiling characterizes community composition rather than metabolic pathway capacity, and microbial communities often exhibit functional redundancy, whereby taxonomically distinct organisms can perform the same functions (18). Thus, compositional depletion of canonical SCFA producers does not by itself demonstrate reduced SCFA biosynthesis. Future work will incorporate shotgun metagenomics to quantify butyrate, acetate, and propionate pathways and to identify differentially abundant species, together with targeted SCFA measurements in stool. Taken together, the observed depletion of commensal genera is compatible with diminished SCFA production, impaired barrier integrity, and increased bacterial translocation risk in SBP, but direct functional assessment is warranted.
In SBP patients, we observed an increased abundance of Streptococcus, Escherichia–Shigella, Klebsiella, and Veillonella (Figures 2D, E). These four taxa are considered to be closely associated with the development of SBP. A significant increase in the phylum Proteobacteria was also detected in SBP patients. Expansion of Proteobacteria is regarded as a marker of microbial community instability and a potential diagnostic indicator of dysbiosis and disease risk (19). Escherichia–Shigella represents one of the most common pathogenic groups in SBP, with pathogenic E. coli shown to disrupt epithelial tight junctions and impair the mucus barrier, thereby facilitating bacterial translocation (20). Klebsiella pneumoniae is another frequently isolated Gram-negative bacterium in SBP ascites (21), and multidrug-resistant strains have been strongly linked to adverse outcomes (22). In recent years, the detection rate of Gram-positive Streptococcus has increased, suggesting its emerging role in the pathogen spectrum of SBP (23). Meanwhile, Veillonella was significantly enriched in the gut of SBP patients (24). As this genus contains lipopolysaccharides (LPS) in its outer membrane, it may activate the TLR4 signaling pathway, thereby increasing intestinal permeability, inducing inflammation, and accelerating SBP progression (25). Overall, the expansion of these taxa is consistent with a more pathobiont enriched community. This observation provides the rationale for SBP-MI, which summarizes the SBP associated dysbiotic profile. SBP-MI can therefore be evaluated as a tool for tracking disease progression. In addition, because SBP-MI is derived from genus-level 16S rRNA profiles, it cannot resolve species/strain-specific drivers of SBP or directly interrogate functional attributes such as virulence determinants and antimicrobial resistance. Future studies incorporating shotgun metagenomics will enable species/strain-resolved profiling and functional characterization, thereby strengthening mechanistic interpretation and clinical translation.
In the prospective follow-up, we further identified dynamic microbial changes linked to clinical outcomes in HBV-related cirrhosis with ascites. Streptococcus decreased, while Bacteroidaceae, Prevotella, and Faecalibacterium were significantly enriched (Figure 3C). Bert et al. (26) reported that streptococci, particularly viridans group streptococci, are common causative pathogens of SBP and related infections. Therefore, a decline in Streptococcus may indicate a reduced pathogenic burden, consistent with clinical improvement. In contrast, enrichment of Bacteroidaceae, Prevotella, and Faecalibacterium may reflect microbial rebalancing that helps maintain intestinal homeostasis and confers protective effects. In patients with disease progression, however, Haemophilus was significantly increased (Figure 3E). Although Haemophilus is not a typical SBP pathogen, A case report described H. influenzae causing severe ascitic infections (27). Its enrichment may therefore signal barrier impairment and greater risk of bacterial translocation in progressive disease. In the longitudinal analysis, changes in SBP-MI provided further insight into disease dynamics. ΔSBP-MI was significantly higher in patients with progression than in those with improvement (Figure 3G), suggesting that a rising SBP-MI reflects worsening dysbiosis and increased risk. By contrast, ΔHBCDI showed limited discriminatory ability. ROC analysis further highlighted the advantage of ΔSBP-MI, indicating its potential value for monitoring disease trajectories during follow-up (Figure 3H).
Among the 140 HBV-related cirrhosis patients with ascites followed for 6 months, 15 developed SBP. By integrating clinical and microbial indicators, we identified INR, previous history of SBP, and SBP-MI as independent predictors (Table 2), and on this basis constructed the SBP-RP model. These findings are broadly consistent with previous reports: elevated INR has been associated with increased susceptibility (28), and according to the EASL clinical practice guidelines (29), a prior episode of SBP substantially increases the likelihood of recurrence, underscoring the vulnerability of this subgroup. Notably, the SBP-RP model appeared to show good predictive performance, as illustrated in Figure 4A. Calibration analysis further demonstrated good agreement between predicted and observed risks (Figure 4B), indicating that the model may be both well calibrated and potentially reliable for risk prediction. This index was developed in a single-center cohort of patients with HBV-associated cirrhosis in China, and the number of incident SBP events was small. Because baseline microbiome composition, diet, clinical practice, and SBP pathogen spectra can vary by cirrhosis etiology and geography, the discrimination and calibration of SBP-MI may differ across etiologies and regions.
In conclusion, this study systematically profiled the gut microbiota of HBV-related cirrhosis across disease stages and identified SBP-MI as a candidate composite index that may reflect the imbalance between protective commensals and potentially pathogenic taxa. In prospective follow-up, SBP-MI captured microbial dynamics associated with clinical outcomes. Unlike single-taxa analyses, it integrates multiple alterations and may reflects disease stage, progression, and predictive value. Based on this, we developed the SBP-RP model by combining microbial and clinical factors, which may facilitate early identification of short-term risk patients and could inform preventive strategies. We will extend follow-up beyond six months and conduct a multicenter prospective validation to confirm the clinical utility of both SBP-MI and SBP-RP prior to wider clinical adoption.
This study has several limitations. First, strict inclusion and exclusion criteria were used to minimize medication related confounding, but this limited the sample size at our single center. The number of SBP events in the follow-up cohort was small, and follow-up was restricted to 6 months. Although we used Firth penalized logistic regression and bootstrap internal validation, the SBP-MI and SBP-RP should be regarded as exploratory, and their longer-term predictive performance will need to be assessed with extended follow-up. Second, there was no external validation cohort. Multicenter prospective studies with larger populations are needed to confirm robustness and clinical applicability, with stratified analyses for potential confounders such as age and diabetes. Third, several clinically relevant variables, including oesophago-gastric varices, portal pressure, elastography-based fibrosis indices, and ascitic protein, were not uniformly collected at baseline. Future studies will incorporate these parameters when feasible and evaluate their clinical utility. Finally, 16S rRNA sequencing provides mainly genus-level resolution and does not resolve species/strain-specific pathogens or SBP-relevant functional features, including virulence and antimicrobial resistance. Future studies using shotgun metagenomics will support species/strain-resolved taxonomy (including the mycobiome) and functional profiling.
Statements
Data availability statement
The data presented in the study are deposited in the CNGBdb repository, accession number CNP0008877.
Ethics statement
The studies involving humans were approved by Beijing Ditan Hospital, Capital Medical University. The studies were conducted in accordance with the local legislation and institutional requirements. The participants provided their written informed consent to participate in this study.
Author contributions
ZZ: Writing – review & editing, Formal Analysis, Writing – original draft, Data curation. XS: Writing – original draft, Writing – review & editing. DC: Writing – review & editing, Data curation. HX: Writing – original draft, Writing – review & editing, Supervision.
Funding
The author(s) declared that financial support was received for this work and/or its publication. This work was supported by National Key R&D Program of China(2022YFC2304500); Beijing Municipal of Science and Technology Major Project (Z221100007422002); National Key R&D Program of China(2021YFC2301801); Capital Funds for Health Improvement and Research (CFH-2024-1-2181); Beijing igandan foundation (iGandanF-1082023-GSH011).
Acknowledgments
We gratefully acknowledge the support of the staff in Center of Liver Diseases Division 3, Beijing Ditan Hospital. The graphical abstract was created with BioRender.com.
Conflict of interest
The author(s) declared that this work was conducted in the absence of any commercial or financial relationships that could be construed as a potential conflict of interest.
Generative AI statement
The author(s) declared that generative AI was not used in the creation of this manuscript.
Any alternative text (alt text) provided alongside figures in this article has been generated by Frontiers with the support of artificial intelligence and reasonable efforts have been made to ensure accuracy, including review by the authors wherever possible. If you identify any issues, please contact us.
Publisher’s note
All claims expressed in this article are solely those of the authors and do not necessarily represent those of their affiliated organizations, or those of the publisher, the editors and the reviewers. Any product that may be evaluated in this article, or claim that may be made by its manufacturer, is not guaranteed or endorsed by the publisher.
Supplementary material
The Supplementary Material for this article can be found online at: https://www.frontiersin.org/articles/10.3389/fimmu.2026.1753063/full#supplementary-material
Glossary
- SBP
Spontaneous bacterial peritonitis
- HBV
Hepatitis B virus
- SBP-MI
Spontaneous bacterial peritonitis microbiota-derived index
- SBP-RP
Spontaneous bacterial peritonitis risk prediction
- INR
International normalized ratio
- AUC
Area under the curve
- CDR
cirrhosis dysbiosis ratio
- POD
probability of disease
- HBCDI
Hepatitis B Cirrhosis Dysbiosis Indicator.
- HC
Healthy controls
- CC
Compensated HBV-related cirrhosis
- NSBP
HBV-related cirrhosis with ascites but without SBP
- TIPS
Transjugular intrahepatic portosystemic shunt
- ALT
alanine aminotransferase
- AST
aspartate aminotransferase
- HVPG
Hepatic venous pressure gradient
- LEfSe
Linear discriminant analysis effect size
- OTU
Operational taxonomic unit
- ROC
Receiver operating characteristic
- TBil
Total bilirubin
- RBC
Red blood cell
- ALB
Albumin
- HGB
Hemoglobin
- PLT
Platelet
- MELD
Model for End-Stage Liver Disease
- PD
phylogenetic diversity
- PCoA
Principal coordinates analysis
- AFP
Alpha-fetoprotein
- SCFAs
short-chain fatty acids
- LPS
Lipopolysaccharide
References
1
Blachier M Leleu H Peck-Radosavljevic M Valla DC Roudot-Thoraval F . The burden of liver disease in Europe: A review of available epidemiological data. J Hepatol. (2013) 58:593–608. doi: 10.1016/j.jhep.2012.12.005
2
Koulaouzidis A Bhat S Karagiannidis A Tan WC Linaker BD . Spontaneous bacterial peritonitis. Postgrad Med J. (2007) 83:379–83. doi: 10.1136/pgmj.2006.056168
3
Tsung PC Ryu SH Cha IH Cho HW Kim JN Kim YS et al . Predictive factors that influence the survival rates in liver cirrhosis patients with spontaneous bacterial peritonitis. Clin Mol Hepatol. (2013) 19:131–9. doi: 10.3350/cmh.2013.19.2.131
4
Wiest R Lawson M Geuking M . Pathological bacterial translocation in liver cirrhosis. J Hepatol. (2014) 60:197–209. doi: 10.1016/j.jhep.2013.07.044
5
Bajaj JS Heuman DM Hylemon PB Sanyal AJ White MB Monteith P et al . Altered profile of human gut microbiome is associated with cirrhosis and its complications. J Hepatol. (2014) 60:940–7. doi: 10.1016/j.jhep.2013.12.019
6
Zhou Z Lv H Lv J Shi Y Huang H Chen L et al . Alterations of gut microbiota in cirrhotic patients with spontaneous bacterial peritonitis: A distinctive diagnostic feature. Front Cell Infect Microbiol. (2022) 12:999418. doi: 10.3389/fcimb.2022.999418
7
Wang Y Zhang S Cheng D Liu S Sun J Cheng J et al . Correlation between gut microbiota dysbiosis index and severity of liver disease in patients with hepatitis B cirrhosis. Chin J Liver Dis (Electronic Version). (2019) 11:8–13. doi: 10.3969/j.issn.1674-7380.2019.03.002
8
European Association for the Study of the Liver . Easl clinical practice guidelines for the management of patients with decompensated cirrhosis. J Hepatol. (2018) 69:406–60. doi: 10.1016/j.jhep.2018.03.024
9
Sun X Chi X Zhao Y Liu S Xing H . Characteristics and clinical significance of intestinal microbiota in patients with chronic hepatitis B cirrhosis and type 2 diabetes mellitus. J Diabetes Res. (2022) 2022:1826181. doi: 10.1155/2022/1826181
10
Albillos A Lario M Álvarez-Mon M . Cirrhosis-associated immune dysfunction: distinctive features and clinical relevance. J Hepatol. (2014) 61:1385–96. doi: 10.1016/j.jhep.2014.08.010
11
Hartmann P Schnabl B . Fungal infections and the fungal microbiome in hepatobiliary disorders. J Hepatol. (2023) 78:836–51. doi: 10.1016/j.jhep.2022.12.006
12
Acharya C Bajaj JS . Altered microbiome in patients with cirrhosis and complications. Clin Gastroenterol Hepatol. (2019) 17:307–21. doi: 10.1016/j.cgh.2018.08.008
13
Pérez-Reytor D Puebla C Karahanian E García K . Use of short-chain fatty acids for the recovery of the intestinal epithelial barrier affected by bacterial toxins. Front Physiol. (2021) 12:650313. doi: 10.3389/fphys.2021.650313
14
Rivera-Chávez F Zhang LF Faber F Lopez CA Byndloss MX Olsan EE et al . Depletion of butyrate-producing clostridia from the gut microbiota drives an aerobic luminal expansion of salmonella. Cell Host Microbe. (2016) 19:443–54. doi: 10.1016/j.chom.2016.03.004
15
Rios-Covian D Salazar N Gueimonde M de Los Reyes-Gavilan CG . Shaping the metabolism of intestinal bacteroides population through diet to improve human health. Front Microbiol. (2017) 8:376. doi: 10.3389/fmicb.2017.00376
16
Quintanilla ME Santapau D Diaz E Valenzuela Martinez I Medina N Landskron G et al . Intragastric administration of short chain fatty acids greatly reduces voluntary ethanol intake in rats. Sci Rep. (2024) 14:29260. doi: 10.1038/s41598-024-80228-1
17
Cao X Zolnikova O Maslennikov R Reshetova M Poluektova E Bogacheva A et al . Differences in fecal short-chain fatty acids between alcoholic fatty liver-induced cirrhosis and non-alcoholic (Metabolic-associated) fatty liver-induced cirrhosis. Metabolites. (2023) 13:859. doi: 10.3390/metabo13070859
18
Louca S Polz MF Mazel F Albright MBN Huber JA O’Connor MI et al . Function and functional redundancy in microbial systems. Nat Ecol Evol. (2018) 2:936–43. doi: 10.1038/s41559-018-0519-1
19
Shin NR Whon TW Bae JW . Proteobacteria: microbial signature of dysbiosis in gut microbiota. Trends Biotechnol. (2015) 33:496–503. doi: 10.1016/j.tibtech.2015.06.011
20
Haderer M Neubert P Rinner E Scholtis A Broncy L Gschwendtner H et al . Novel pathomechanism for spontaneous bacterial peritonitis: disruption of cell junctions by cellular and bacterial proteases. Gut. (2022) 71:580–92. doi: 10.1136/gutjnl-2020-321663
21
Liu J Gao Y Wang X Qian Z Chen J Huang Y et al . Culture-positive spontaneous ascitic infection in patients with acute decompensated cirrhosis: multidrug-resistant pathogens and antibiotic strategies. Yonsei Med J. (2020) 61:145–53. doi: 10.3349/ymj.2020.61.2.145
22
Furey C Zhou S Park JH Foong A Chowdhury A Dawit L et al . Impact of bacteria types on the clinical outcomes of spontaneous bacterial peritonitis. Dig Dis Sci. (2023) 68:2140–8. doi: 10.1007/s10620-023-07867-8
23
Fiore M Maraolo AE Gentile I Borgia G Leone S Sansone P et al . Current concepts and future strategies in the antimicrobial therapy of emerging gram-positive spontaneous bacterial peritonitis. World J Hepatol. (2017) 9:1166–75. doi: 10.4254/wjh.v9.i30.1166
24
Maccauro V Airola C Santopaolo F Gasbarrini A Ponziani FR Pompili M . Gut microbiota and infectious complications in advanced chronic liver disease: focus on spontaneous bacterial peritonitis. Life (Basel). (2023) 13:991. doi: 10.3390/life13040991
25
Poppleton DI Duchateau M Hourdel V Matondo M Flechsler J Klingl A et al . Outer membrane proteome of Veillonella parvula: A diderm firmicute of the human microbiome. Front Microbiol. (2017) 8:1215. doi: 10.3389/fmicb.2017.01215
26
Bert F Noussair L Lambert-Zechovsky N Valla D . Viridans group streptococci: an underestimated cause of spontaneous bacterial peritonitis in cirrhotic patients with ascites. Eur J Gastroenterol Hepatol. (2005) 17:929–33. doi: 10.1097/00042737-200509000-00008
27
Saadi T Khoury S Veitsman E Baruch Y Raz-Pasteur A . Spontaneous bacterial peritonitis with a very high leukocyte count in ascitic fluid caused by haemophilus influenzae. Int J Gen Med. (2013) 6:689–91. doi: 10.2147/ijgm.S49658
28
Duah A Nkrumah KN . Prevalence and predictors for spontaneous bacterial peritonitis in cirrhotic patients with ascites admitted at medical block in Korle-Bu teaching hospital, Ghana. Pan Afr Med J. (2019) 33:35. doi: 10.11604/pamj.2019.33.35.18029
29
European Association for the Study of the Liver . Easl clinical practice guidelines on the management of ascites, spontaneous bacterial peritonitis, and hepatorenal syndrome in cirrhosis. J Hepatol. (2010) 53:397–417. doi: 10.1016/j.jhep.2010.05.004
Summary
Keywords
16S rRNA, gut microbiota–derived index, HBV-related cirrhosis, prediction model, spontaneous bacterial peritonitis
Citation
Zhou Z, Sun X, Cheng D and Xing H (2026) From dysbiosis to prediction: a novel gut microbiota–derived index for spontaneous bacterial peritonitis in HBV-related cirrhosis. Front. Immunol. 17:1753063. doi: 10.3389/fimmu.2026.1753063
Received
24 November 2025
Revised
18 January 2026
Accepted
27 January 2026
Published
16 February 2026
Volume
17 - 2026
Edited by
Nar Singh Chauhan, Maharshi Dayanand University, India
Reviewed by
Long Jianfei, Fudan University, China
Naincy Rathee, Maharshi Dayanand University, India
Updates
Copyright
© 2026 Zhou, Sun, Cheng and Xing.
This is an open-access article distributed under the terms of the Creative Commons Attribution License (CC BY). The use, distribution or reproduction in other forums is permitted, provided the original author(s) and the copyright owner(s) are credited and that the original publication in this journal is cited, in accordance with accepted academic practice. No use, distribution or reproduction is permitted which does not comply with these terms.
*Correspondence: Huichun Xing, hchxing@sohu.com
†These authors have contributed equally to this work and share first authorship
Disclaimer
All claims expressed in this article are solely those of the authors and do not necessarily represent those of their affiliated organizations, or those of the publisher, the editors and the reviewers. Any product that may be evaluated in this article or claim that may be made by its manufacturer is not guaranteed or endorsed by the publisher.