 Emily R. Hall
 Kimberly K. Yates
 Katherine A. Hubbard
 Matthew J. Garrett3
- 1Mote Marine Laboratory, Sarasota, FL, United States
- 2U.S. Geological Survey, St. Petersburg Coastal and Marine Science Center, St. Petersburg, FL, United States
- 3Florida Fish and Wildlife Conservation Commission – Fish and Wildlife Research Institute, St. Petersburg, FL, United States
Ocean acidification (OA) driven by eutrophication, riverine discharge, and other threats from local population growth that affect the inorganic carbonate system is already affecting the eastern Gulf of Mexico. Long-term declines in pH of ~ -0.001 pH units yr-1 have been observed in many southwest Florida estuaries over the past few decades. Coastal and estuarine waters of southwest Florida experience high biomass harmful algal blooms (HABs) of the dinoflagellate Karenia brevis nearly every year; and these blooms have the potential to impact and be impacted by seasonal to interannual patterns of carbonate chemistry. Sampling was conducted seasonally along three estuarine transects (Tampa Bay, Charlotte Harbor, Caloosahatchee River) between May 2020 and May 2023 to obtain baseline measurements of carbonate chemistry prior to, during, and following K. brevis blooms. Conductivity, temperature and depth data and discrete water samples for K. brevis cell abundance, nutrients, and carbonate chemistry (total alkalinity, dissolved inorganic carbonate (DIC), pCO2, and pHT were evaluated to identify seasonal patterns and linkages among carbonate system variables, nutrients, and K. brevis blooms. Karenia brevis blooms were observed during six samplings, and highest pCO2 and lowest pHT was observed either during or after blooms in all three estuaries. Highest average pH and lowest pCO2 were observed in Tampa Bay. In all three estuaries, average DIC and pHT were higher and pCO2 was lower during dry seasons than wet seasons. There was strong influence of net community calcification (NCC) and net community production (NCP) on the carbonate system; and NCC : NCP ratios in Tampa Bay, Charlotte Harbor, and the Caloosahatchee River were 0.83, 0.93, and 1.02, respectively. Linear relationships between salinity and dissolved ammonium, phosphate, and nitrate indicate strong influence of freshwater inflow from river input and discharge events on nutrient concentrations. This study is a first step towards connecting observations of high biomass blooms like those caused by K. brevis and alterations of carbonate chemistry in Southwest Florida. Our study demonstrates the need for integrated monitoring to improve understanding of interactions among the carbonate system, HABs, water quality, and acidification over local to regional spatial scales and event to decadal time scales.
1 Introduction
Estuarine ecosystems face the detrimental effects of observed and projected increases of seawater carbon dioxide (CO2) concentrations and temperature due to climate change and complex coastal processes (Feely et al., 2008; Feely et al., 2010; Cai et al., 2011; Robbins et al., 2018; Doney et al., 2020; Hall et al., 2020; Osborne et al., 2022). Most Gulf of Mexico (GOM) waters are expected to be buffered more than other similar systems (Cai et al., 2011). However, coastal regions, which include estuaries, can experience enhanced coastal acidification due to eutrophication, hypoxia, and river discharge (Cai et al., 2011; Wallace et al., 2014; Cai et al., 2021) that is more spatially and temporally heterogeneous compared to open ocean acidification (Yates et al., 2007). The confluence of offshore water and estuarine plumes in the GOM coastal ocean can cause strong stratification, resulting in surface eutrophication and increased pH while promoting strong subsurface respiration/remineralization, inhibited ventilation, and near bottom hypoxia and acidification (Wallace et al., 2014; Zhao et al., 2020). Strong seasonality in sub-tropical regions can also lead to substantial intra-annual variability in the carbonate system in these environments (Cai et al., 2021), and there is evidence that subsurface pH is rapidly declining in stratified systems such as those in the GOM (Cai et al., 2011; Hall et al., 2020; Osborne et al., 2022). Nearly annual high biomass harmful algal blooms (HABs) affect GOM estuaries and may exacerbate acidification conditions resulting from a combination of these processes. At present, no studies have been conducted in Florida estuaries to characterize the effects of HAB events on local acidification.
Insight concerning the effect acidification will have on HABs, or conversely the effect that HABs will have on local carbonate chemistry patterns, remain poorly understood (Turner et al., 2021). Marine dinoflagellates, which have been speculated to benefit from a greater CO2 environment, are likely to become more abundant under certain climate scenarios (Reinfelder, 2011; Brandenburg et al., 2019; Gobler, 2020) and may outcompete other phytoplankton species (Reinfelder, 2011). The eastern GOM and its estuaries already experience frequent, near-annual high biomass HABs of the toxic dinoflagellate Karenia brevis, which produces brevetoxins that cause the human syndrome neurotoxic shellfish poisoning if consumed (Heil et al., 2014; Liu et al., 2016). Bloom dynamics are complex (e.g., onset, duration, spatiotemporal distributions, and intensity) and vary between events (Vargo, 2009; Liu et al., 2016; Tullis-Joyce and Roy, 2021). Impacts from blooms can include episodic hypoxia/anoxia, extensive fish kills and wildlife mortalities, shellfish harvesting area closures, and likely post-bloom acidification, resulting in substantial deleterious impacts to local ecosystems, human health, and economies. Future and continued ocean and coastal acidification (OA) are predicted to lead to the potential extinction or weakening of key marine species and resources (Dupont et al., 2008) or elevating occurrences of HABs (Gobler, 2020), thereby amplifying these threats.
Limited culture studies have shown that K. brevis cellular brevetoxin concentrations did not significantly change when grown at projected levels of elevated CO2 partial pressure (pCO2) (Errera et al., 2014; Hardison et al., 2014; Bercel and Kranz, 2019). However, growth rates increased under elevated pCO2 (Errera et al., 2014) likely due to enhanced acquisition of dissolved inorganic carbon (Bercel and Kranz, 2019), which may lead to a greater prevalence of K. brevis HABs in the future. Evidence has shown there are strong dependencies on CO2 by HAB species (Reinfelder, 2011). For example, K. brevis can regulate cellular CO2 concentrating processes in response to changes in CO2 concentrations, which may increase resiliency to elevated pCO2 environments (Bercel and Kranz, 2019). Ocean and coastal acidification could favor initiation and maintenance of HABs (Wells et al., 2015); however, further research is needed to understand the interaction of OA and HAB dynamics, particularly with respect to their occurrence in the GOM (Riebesell et al., 2018; Wells et al., 2020).
Estuarine regions within the SW Florida sub-tropical region experience frequent and intense K. brevis HAB events. Tampa Bay is Florida’s largest open water estuary and is significantly urbanized, which has resulted in changes in circulation, residence time, and water quality degradation (Beck et al., 2019). Tampa Bay has also been a success story in recovery toward improved water quality conditions and seagrass extent due to estuary-wide nutrient management planning (Greening et al., 2014). However, blooms of K. brevis commonly occur in lower Tampa Bay (Tullis-Joyce and Roy, 2021), with blooms (≥105 cells L-1) recorded in 18 of the last 30 years (FWC, 2023). Additionally, ephemeral acidification events have been documented in Tampa Bay (Yates et al., 2023). Charlotte Harbor forms one of the largest estuarine lagoons in SW Florida, partially separated from coastal waters by a series of barrier islands (Dürr et al., 2011), and it has gone through many of the same land use changes as other estuaries in the region. Charlotte Harbor has experienced nearly annual blooms of K. brevis and is thought to be a nitrogen limited system (Heil et al., 2014; Julian and Osborne, 2018; Weisberg et al., 2019), yet has experienced an increase in nitrogen loading since the 1880s (Turner et al., 2006). The Caloosahatchee River extends southwest from Lake Okeechobee into a subtropical riverine estuary that is connected to Charlotte Harbor and has undergone a number of physical alterations for navigation, flood control and regulatory releases, and has had a decline in water quality over the past few decades with elevated loads of dissolved inorganic phosphorus and nitrogen (Liu et al., 2009; Qiu and Wan, 2013; Dixon et al., 2014; Sun et al., 2016). The Caloosahatchee River catchment contributes a larger freshwater input to the coastal West Florida shelf compared to the Charlotte Harbor watershed, despite the disparity in their geographic size (Doering and Chamberlain, 1999; Steinman et al., 2002; Rumbold and Doering, 2020), as flow from the Caloosahatchee River is managed per the Lake Okeechobee System Operating Manual (LOSOM, 2023). There have been no comprehensive studies of the carbonate system or acidification in Charlotte Harbor or the Caloosahatchee River.
This study combines nutrient, carbonate system, and K. brevis cell abundance data from the Tampa Bay, Charlotte Harbor and the Caloosahatchee River regions to characterize patterns and variability across different scales in concert with environmental drivers and co-stressors, to identify potential linkages among carbonate chemistry, nutrients, and HAB events.
2 Materials and methods
2.1 Sample collection
Discrete water samples were collected quarterly during seasonal estuarine surveys along three transects (Tampa Bay, Charlotte Harbor, and the Caloosahatchee River) from 2020-2023 (Figure 1, Table 1). Transects were designed to sample each region along an estuarine to marine gradient. Samples were collected using either a Niskin rosette package including a conductivity, temperature and depth (CTD) water profiler (SeaBird, SBE55) or single horizontal Niskin with separate CTD profiler (SeaBird SBE19+) within daylight hours. CTD data were processed using SBE Data Processing software (Seasoft V2, 2018), following the software recommendations for compensating for sensor thermal mass, sensor alignment, timing offset (the delay associated with pumped sensors, i.e., conductivity), and changes in instrument velocity (due to ship heave). Data were binned (~0.2m increments) to smooth data variability. Processed and derived data included temperature (°C), salinity (PSU), and dissolved oxygen (mg L-1). Samples for K. brevis cell abundance were collected in 20 mL borosilicate glass vials and immediately preserved with unacidified Lugols and kept in a dark, cool place until analyses (Dixon et al., 2014). Samples for carbonate chemistry were collected in 500mL borosilicate glass bottles with Tygon tubing attached to Niskin bottles, filled to overflow with no aeration using methods of Dickson et al. (2007) prior to collection of other samples. Samples for measurement of total alkalinity (TA) and dissolved inorganic carbon (DIC) were immediately poisoned with mercuric chloride, sealed with Apiezon grease and stored in a cool, dark place until analysis. Samples for dissolved nutrients were filtered immediately using 0.45 μm polyethersulfone membrane filters and stored frozen until analysis. Samples for chlorophyll- a were filtered through a 25 mm GF/F (0.7 µm) within 48 hours of collection and stored frozen at -20°C until analysis.
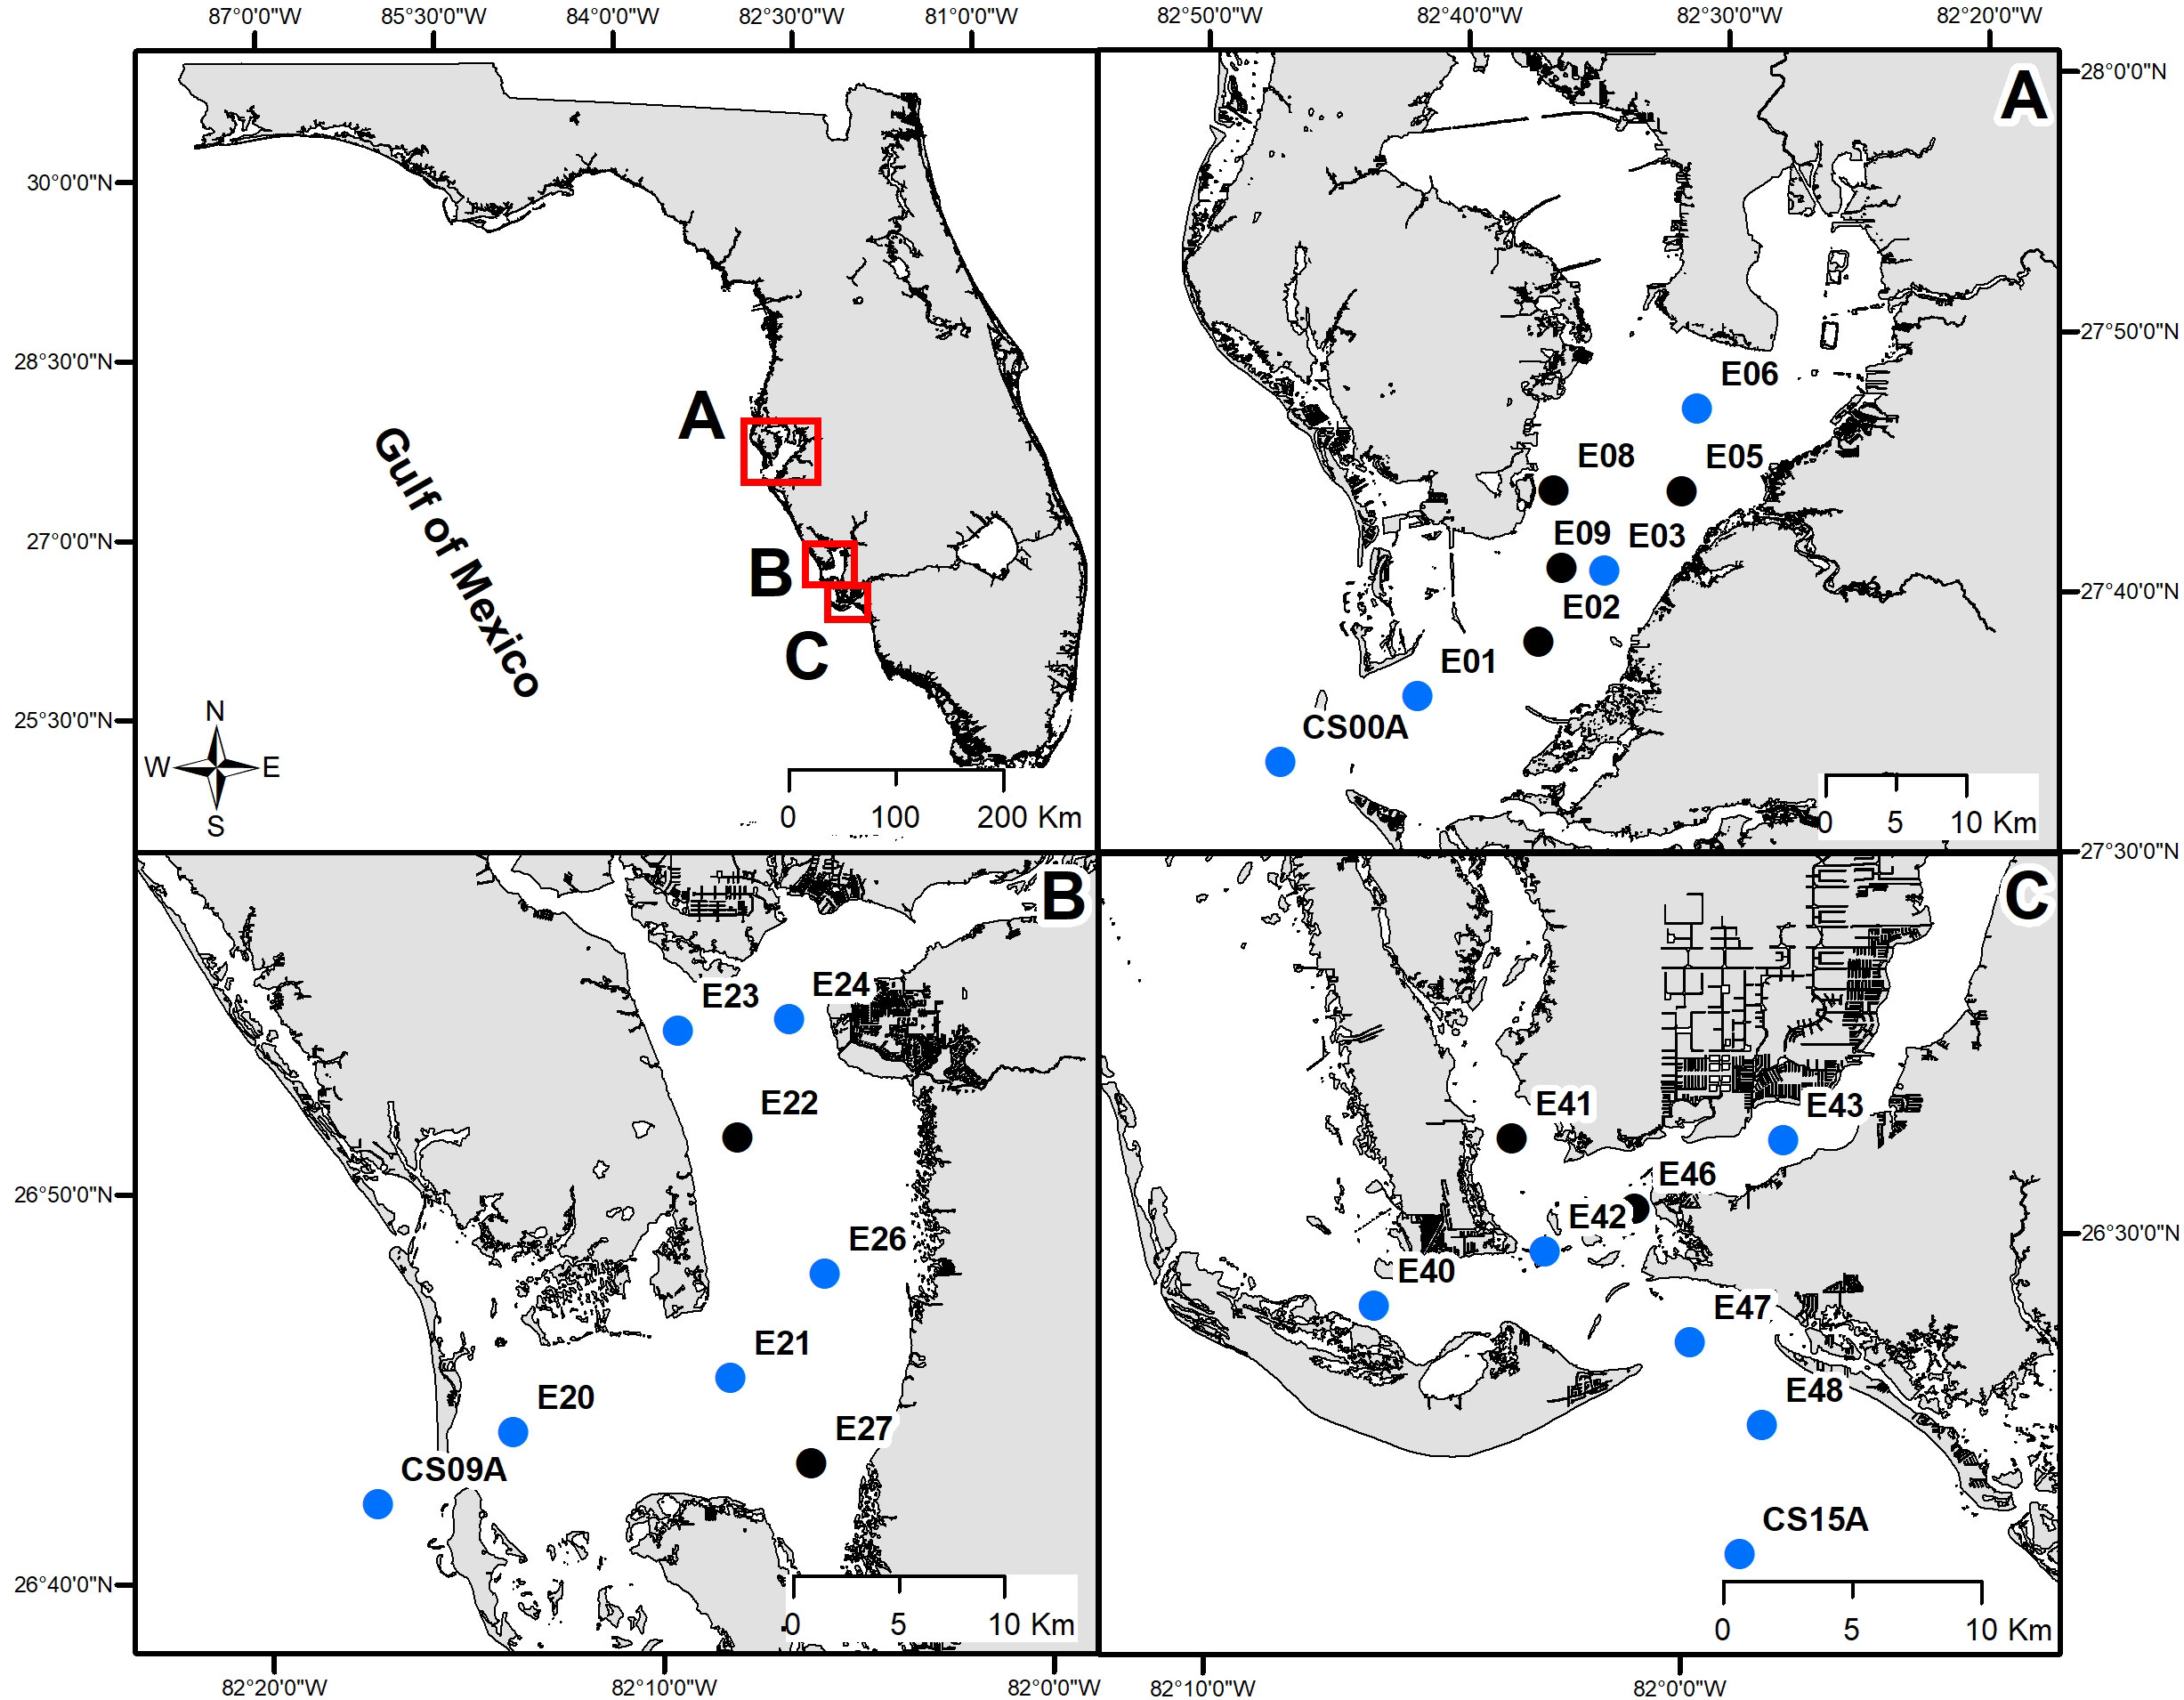
Figure 1 Estuarine (quarterly) sampling stations in (A) Tampa Bay, (B) Charlotte Harbor, and (C) the Caloosahatchee River. Blue dots represent locations where the full suite of carbonate chemistry variables and nutrients were measured, black dots represent locations where only cell counts were collected.
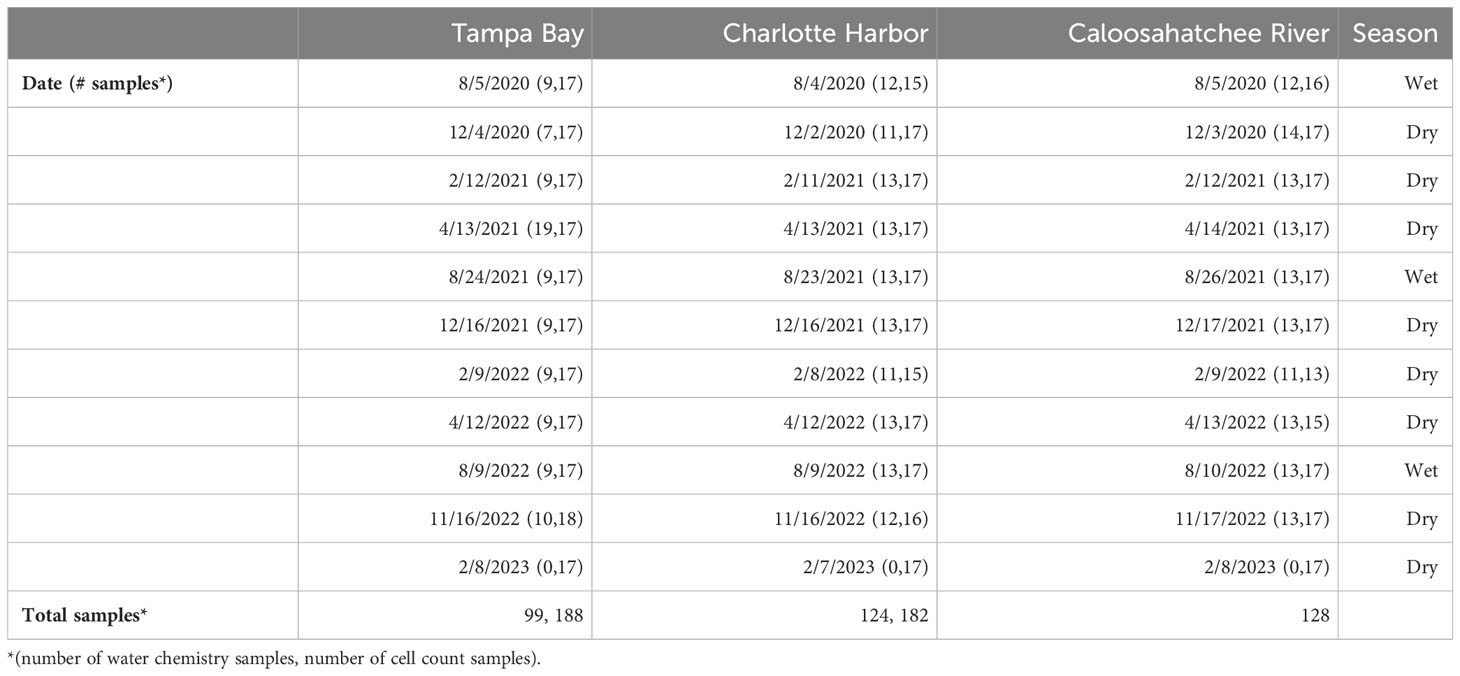
Table 1 Sampling dates and number of discrete samples collected from each estuary for carbonate system, chlorophyll-a, nutrient analyses, and cell counts.
2.2 Karenia brevis cell enumeration
Aliquots (2 mL) of preserved samples from the three transects were examined under 200x – 400x magnification in a 24-well tissue culture plate after an approximate 10 min. settling time, and K. brevis cells were enumerated (with 500 cells L-1 as limit of detection). Samples with observed abundances greater than 106 cells L−1 were enumerated in a Nageotte hemocytometer. These and additional K. brevis cellular abundance data from the same areas and time period were obtained from the Florida Fish and Wildlife Conservation Commission – Fish and Wildlife Research Institute (FWC-FWRI) Harmful Algal Bloom (HAB) Monitoring Database (FWC, 2023).
2.3 Carbonate chemistry analyses
Samples for seawater TA (± 5 μmol kg-1) were analyzed via Gran titration methods using a modification of the open-cell titration method on a Metrohm OMNIS advanced automated titrator using 0.05M HCl in 0.6M NaCl for ~40 g seawater samples (Dickson et al., 2007). Samples were analyzed for DIC(± 5 μmol kg-1) using an Apollo AS-C3 DIC Analyzer (Apollo SciTech, Newark, DE) equipped with a LICOR LI-7000 gas-analyzer following the methods of Dickson et al. (2007). Certified reference materials (CRMs) for TA and DIC analyses obtained from Scripps Institution of Oceanography (A. Dickson) were used to ensure the accuracy of both TA and DIC analyses. Carbonate system variables including pHT (pH on the total scale) were calculated in CO2SYS (Version 3.0_Err; Pierrot et al., 2021) using measured TA and DIC values and constants of Millero (2010).
2.4 Nutrient and chlorophyll-a analyses
Discrete filtered seawater samples collected for nutrient analyses included dissolved ammonia (DNH4-N), dissolved nitrate-nitrite (DNO2,3-N), and dissolved phosphate (DPO4-P). Analyses for dissolved nutrients followed colorimetric, segmented flow, autoanalyzer techniques for a Bran+Luebbe/Seal Autoanalyzer as described in Dixon et al. (2014). Chlorophyll-a samples were analyzed fluorometrically after acetone extractions following EPA 440.0 methods (Arar and Collins, 1997).
2.5 Data processing and statistics
All carbonate system and basic water quality variables were analyzed using Pearson correlation analyses to identify potential linkages among carbonate system variables, temperature, salinity, chlorophyll-a, and K. brevis cell abundance. Correlation strength was defined using the following ranges for correlation coefficients (r): 0.00-0.19 = very weak; 0.20-0.39 = weak; 0.40-0.59 = moderate; 0.60-0.79 = strong; 0.80-1.00 = very strong (Yates et al., 2023). Linear regression analyses were also performed to further examine the relationship between salinity and nutrients.
Total alkalinity and DIC were normalized to salinity by multiplying each variable by the ratio of each estuary’s mean salinity to measured salinity [e.g., nTA = TA * (Smean/Smeasured)] and plotted on nTA-nDIC graphs using methods of Suzuki and Kawahata (2003) and Muehllehner et al. (2016). Graphs of nTA and nDIC were divided into quadrants based on a center point that represents the mean value of nTA and nDIC for each estuary. Lines representing the theoretical impact of photosynthesis (P), respiration (R), calcification (C), and carbonate dissolution (D) on nTA and nDIC were calculated using methods of Suzuki and Kawahata (2003) whereby the PR line is based on the Redfield ratio for C:N:P in marine systems containing macroalgae and seagrass, and the CD line is based on the decrease of two moles of TA for every one mole of DIC during calcification. Linear regressions were used to examine the relation between nTA and nDIC and potential influence of net community production (NCP) and net community calcification (NCC). Data points falling in the lower left quadrant result from positive rates of NCP and NCC; a linear relationship with a slope near 0 indicates NCP dominates over NCC; and a slope of 2.0 indicates NCC dominates over NCP (Muehllehner et al., 2016). The ratio of Net Ecosystem Calcification to Net Ecosystem Production (NCC : NCP) was calculated for each estuary from the slope (m) of a linear regression between nTA and nDIC whereby NCC : NCP = 1/(2/m-1) (Muehllehner et al., 2016). Ratios of NCC : NCP indicate the relative proportion of carbonate production to organic carbon production and can be an important indicator of ecosystem health in areas characterized by calcifying organisms (Takeshita et al., 2016).
Datasets were tested for normality and normality distributions of the data were not found. Datasets were analyzed for significant differences using nonparametric tests (Kruskal-Wallis) between estuaries and seasonally using the software package SigmaPlot 14.0 (SigmaPlot, 2023). Pairwise multiple comparisons (Dunn’s Method) were used to determine significance between factors.
3 Results
3.1 Karenia brevis
Discrete sampling highlighted the variability of K. brevis in each of the estuaries throughout the study period in terms of distribution and magnitude. Sampling captured both a long-lasting bloom (December 2020 through November 2021) when populations persisted throughout summer, a fairly rare occurrence, as well as a comparatively short-lived event that ended in late spring (October 2022-May 2023; Figure 2). However, for five sampling periods that fell in between bloom events, K. brevis was uniformly absent from all estuaries. Along the varied transects, cell concentrations ranged from 500-160,000 cells L-1 for Tampa Bay; 500-1,534,000 cells L-1 for Charlotte Harbor; and 500-3,270,000 cells L-1 for the Caloosahatchee River. For Tampa Bay, 16 of 24 (66%) samples equaled or exceeded 5,000 cells L-1 compared to 38 of 47 (81%) for Charlotte Harbor and 33 of 47 (70%) for the Caloosahatchee River, highlighting the prevalence of this HAB across SW Florida estuaries, even across multiple seasons.
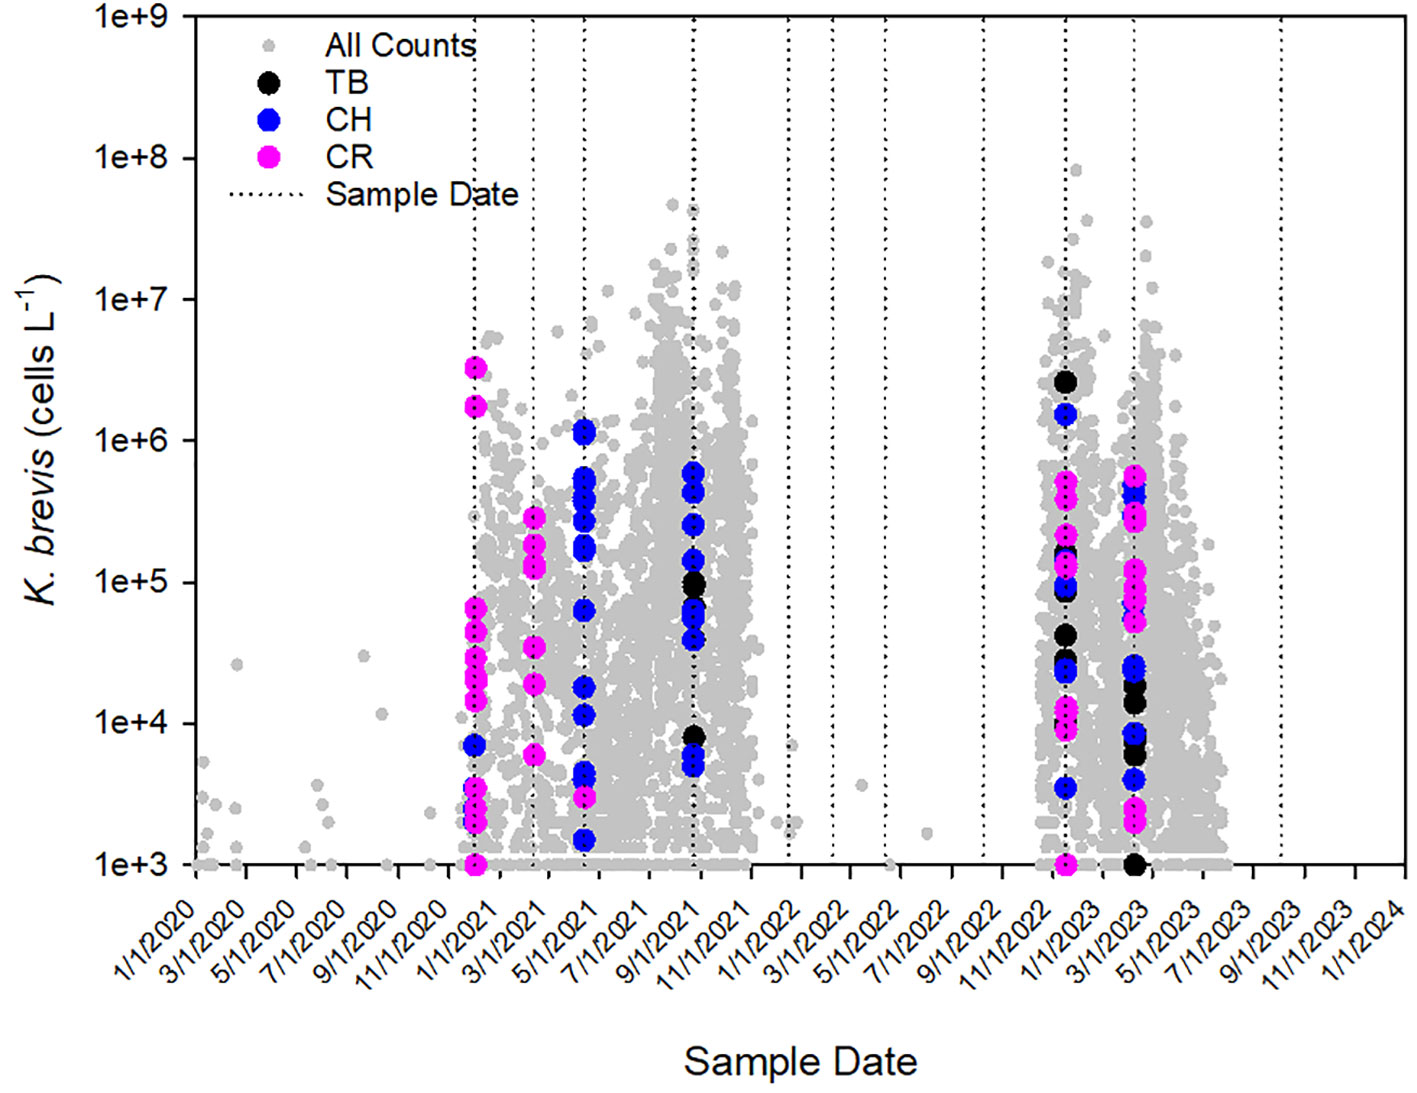
Figure 2 Cell counts of Karenia brevis in Tampa Bay (TB), Charlotte Harbor (CH), and the Caloosahatchee River (CR) during the period January 2020 to August 2023. Small gray symbols represent all K. brevis cell counts collected in the Florida Southwest Region during the same time period. Dotted lines represent sample dates.
3.2 Carbonate chemistry and river discharge
Seawater TA was significantly different between estuaries (p<0.001; Supplementary Table 1) with greatest concentrations in the Caloosahatchee River (2485.06 ± 10.06 µmol kg-1) compared to Tampa Bay (2344.35 ± 9.35 µmol kg-1) and Charlotte Harbor (2231.29 ± 14.41 µmol kg-1) (Supplementary Figure 1; Supplementary Table 2). Tampa Bay and Charlotte Harbor followed similar seasonal trends with greatest TA values observed in April of 2021 and 2022 (Figure 3). The Caloosahatchee River had the most elevated TA in August 2021 when Charlotte Harbor and Tampa Bay had the lowest TA. Dissolved inorganic carbon was also most elevated in the Caloosahatchee River (2270.83 ± 14.04 µmol kg-1) compared to Tampa Bay (2107.05 ± 8.52 µM kg-1) and Charlotte Harbor (2037.21 ± 10.40 µmol kg-1) (Supplementary Figure 1; Supplementary Table 2). Seasonal patterns of TA in the Caloosahatchee River were different than in the other two estuaries where TA was most elevated in September 2021 and November 2022, which coincided with elevated river discharge due to rainfall in the region (Figure 3). Dissolved inorganic carbon followed a similar pattern as that of TA in all three estuaries (Figure 3). pCO2 was significantly greater in Charlotte Harbor than Tampa Bay (p<0.001) and pCO2 was significantly greater in the Caloosahatchee River than in Tampa Bay (p<0.001; Supplementary Figure 1; Supplementary Table 2). In Tampa Bay, the greatest pCO2 and lowest pHT were observed after a K. brevis bloom (Figure 3) that followed a major diatom bloom (Beck et al., 2022a). In Charlotte Harbor, greatest pCO2 and lowest pHT was toward the end of a K. brevis bloom in September 2021 and early on during a bloom in December 2022 (Figure 3). In the Caloosahatchee River, pCO2 concentrations were also greatest and pHT was lowest after a K. brevis bloom (Figure 3). Calculated pHT was significantly greater in Tampa Bay than in Charlotte Harbor or in the Caloosahatchee River (p<0.001; Supplementary Figure 1; Supplementary Table 2). The lowest pHT for all three estuaries occurred in Charlotte Harbor in November 2022, post Hurricane Ian; and the highest pHT was observed in the Caloosahatchee River in February 2022 (Figure 3). In all three estuaries, average DIC and pHT were higher during the dry season than the wet season while average pCO2 was lower during the dry season than in the wet season (Figure 3). In Tampa Bay, dry season average DIC was 2134.22 ± 8.74 and wet season average DIC was 2018.14 ± 6.11, dry season average pHT was 8.01 ± 0.009 and wet season was 7.99 ± 0.013, and dry season average pCO2 was 478.27 ± 10.32 and wet season was 491.65 ± 17.53. In Charlotte Harbor, dry season average DIC was 2066.37 ± 11.24 and wet season was 1971 ± 18.38, dry season average pHT was 7.94 ± 0.01 and wet season was 7.88 ± 0.02, and dry season average pCO2 was 565.10 ± 17.24 and wet season was 685.79 ± 47.92. In the Caloosahatchee River, dry season average DIC was 2275.60 ± 14.60 and wet season was 2258.55 ± 33.61, dry season average pHT was 7.97 ± 0.01 and wet season was 7.92 ± 0.01, and dry season average pCO2 was 599.34 ± 19.32 and wet season was 706.62 ± 48.09. Average TA was higher during dry seasons in Tampa Bay (dry: 2367.69 ± 9.12; wet: 2282.11 ± 19.92) and Charlotte Harbor (dry: 2257.82 ± 16.18; wet: 2171.23 ± 27.41), but higher during wet seasons in the Caloosahatchee River (dry: 2479.58 ± 11.69; wet: 2498.03 ± 19.62) Figure 3).
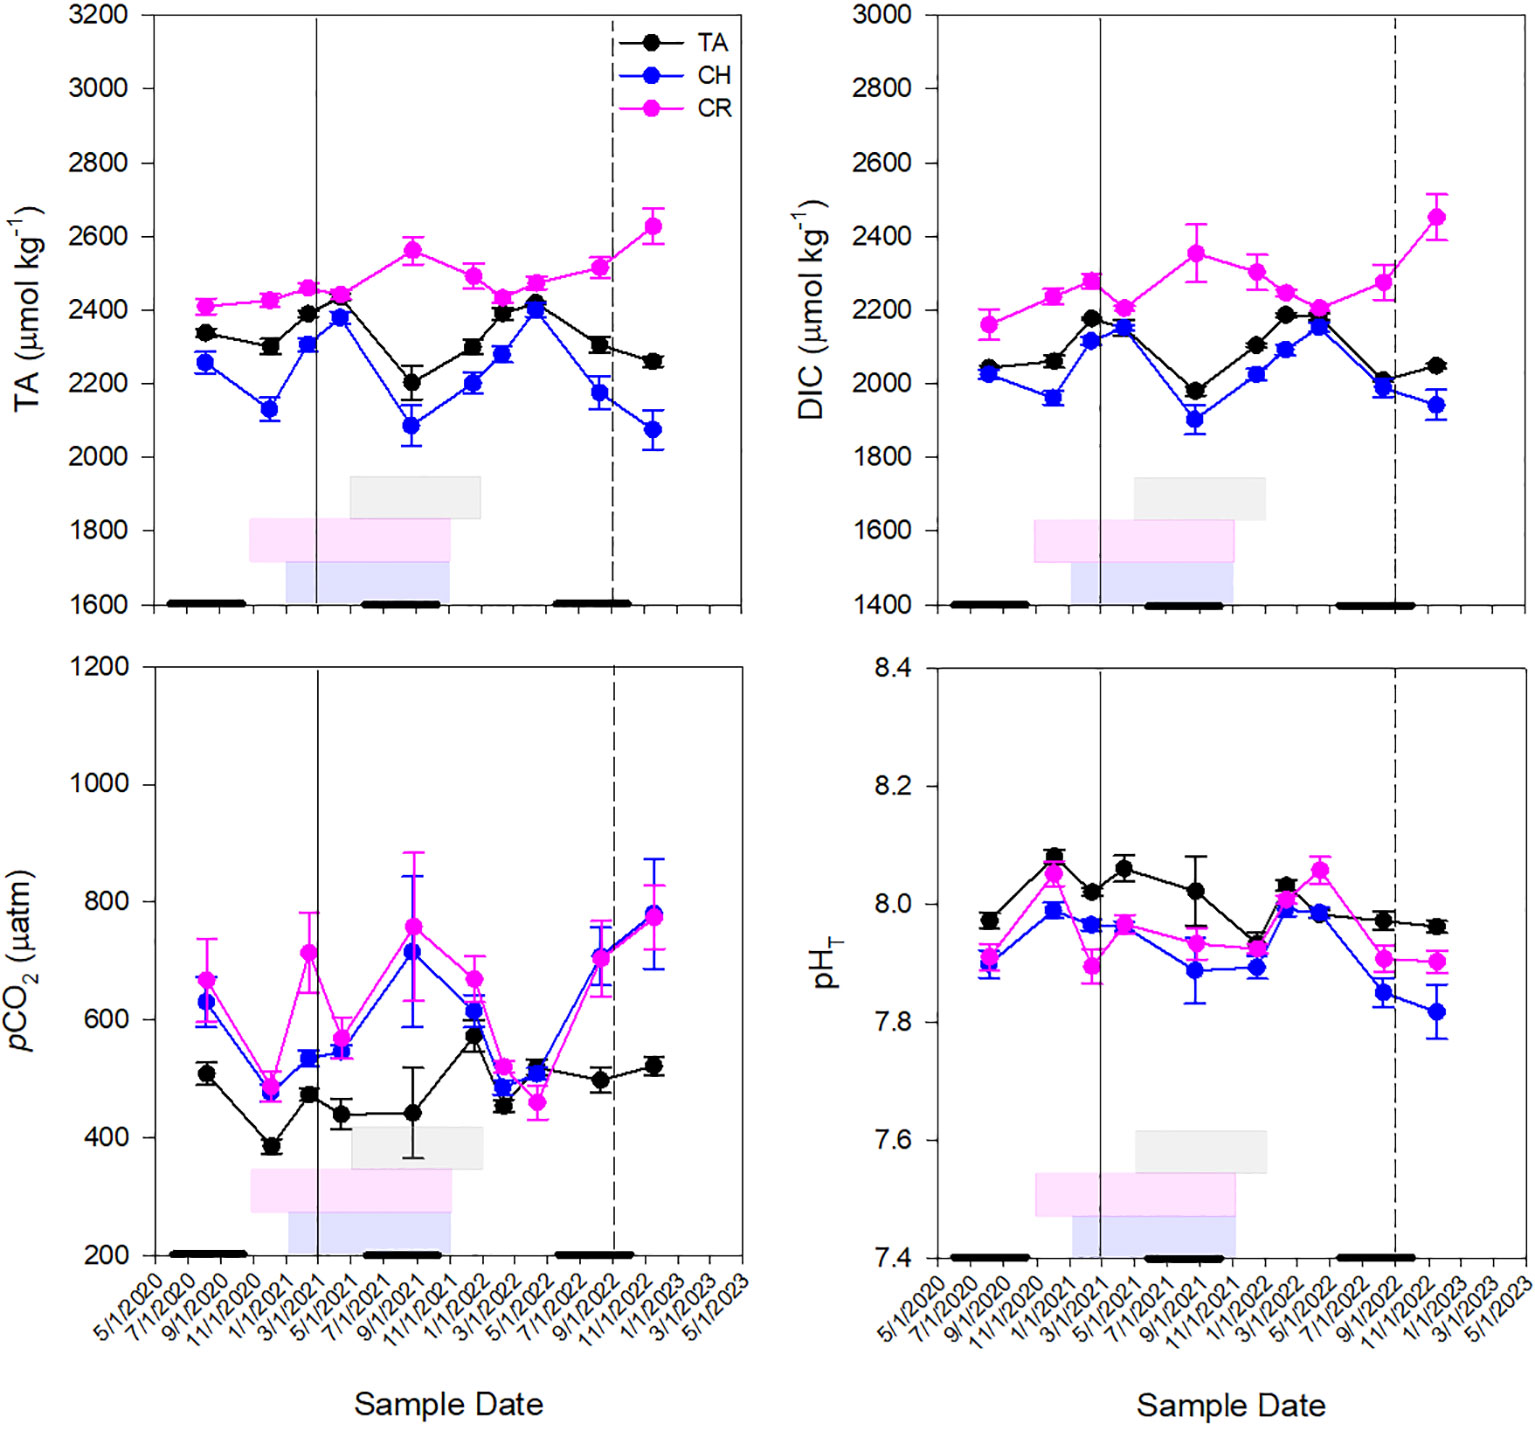
Figure 3 Seasonal patterns of mean pHT, pCO2, dissolved inorganic carbon (DIC) and total alkalinity (TA) concentrations at all stations throughout the sampling period in Tampa Bay [TB; n=99], Charlotte Harbor [CH; n=124], and the Caloosahatchee River [CR; n=128]. Solid vertical lines represent Piney Point legacy mining release (in Tampa Bay, March 2021) and dashed vertical lines represent Hurricane Ian (September 2022). Gray boxes represent K. brevis bloom conditions in TB, pink boxes represent K. brevis bloom conditions in CH and blue boxes represent K. brevis bloom conditions in CR. Thick black lines along the x-axis represent the wet season in the west coast of Florida (June 1-October 31).
Pearson correlation analysis was used to examine trends between carbonate system, salinity, temperature, chlorophyll-a, and K. brevis cell abundance data (Tables 2–4). In Tampa Bay, salinity had a significant moderate correlation with TA and a weak correlation with chlorophyll-a, but no significant correlation with other variables. Temperature had significant weak to very strong correlations with pHT, TA, DIC, and DO, and a moderate correlation with K. brevis abundance (suggesting strong seasonal influence of temperature). Karenia brevis abundance was significantly and strongly correlated with DIC, but not significantly correlated with other carbonate system variables or DO. Chlorophyll-a showed significant moderate correlations with DIC and K. brevis cell abundance and weak correlation with TA; pHT and DO were moderately correlated; and DO and TA were weakly correlated (Table 2). In Charlotte Harbor, salinity had a significant, very strong correlation with TA and DIC, a strong correlation with chlorophyll-a (suggesting strong seasonal influence from river discharge), but a weak correlation with pHT. Temperature had significant, weak correlations with chlorophyll-a, salinity, TA, DIC, and pHT and moderate correlation with DO. Chlorophyll-a had significant, strong correlations with TA, DIC, and salinity, moderate correlation with K. brevis abundance, and weak or no significant correlations with other variables. There was a strong correlation between pHT and DO, and a moderate correlation between chlorophyll-a and K. brevis cell abundance, but no significant correlations between K. brevis cell abundance and pHT, DIC, TA, or DO (Table 3). In the Caloosahatchee River, there were significant, moderate to strong correlations between TA, DIC and salinity, and a significant but weak correlation between salinity and pHT. Temperature had a significant moderate to strong correlation with pH and DO. Chlorophyll-a was very strongly correlated with K. brevis cell abundance but not significantly correlated with all other variables. There were weak but significant correlations between DO and pHT, DIC, and TA; and there were weak but significant correlations between K. brevis cell abundance and pHT and TA, and a moderate correlation between DIC and K. brevis cell abundance (Table 4).
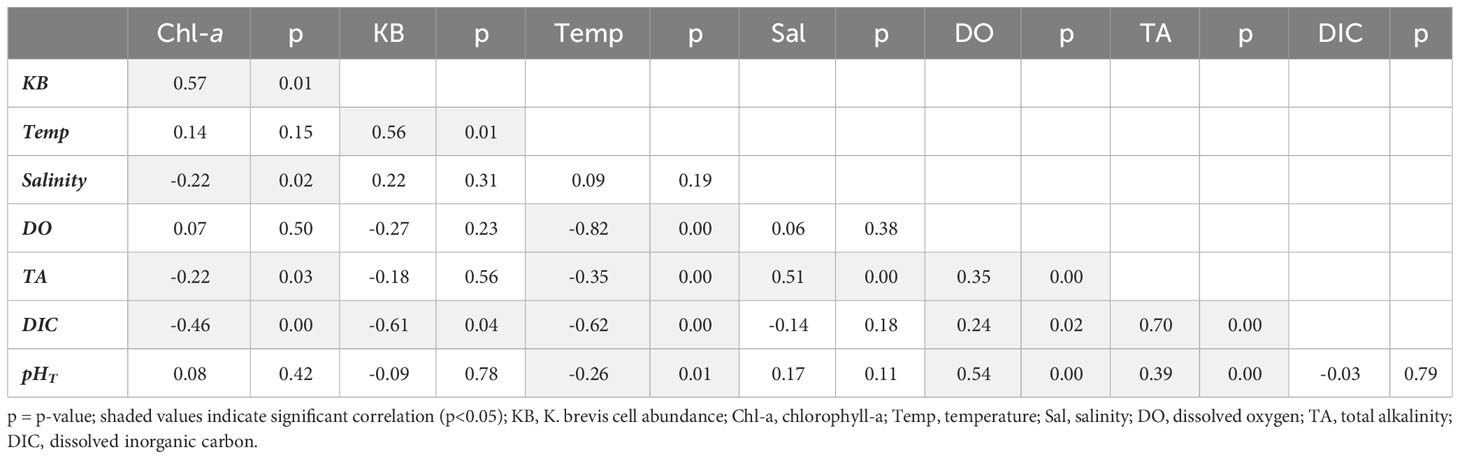
Table 2 Pearson correlation results for Tampa Bay (correlation coefficient (r) and p-value).
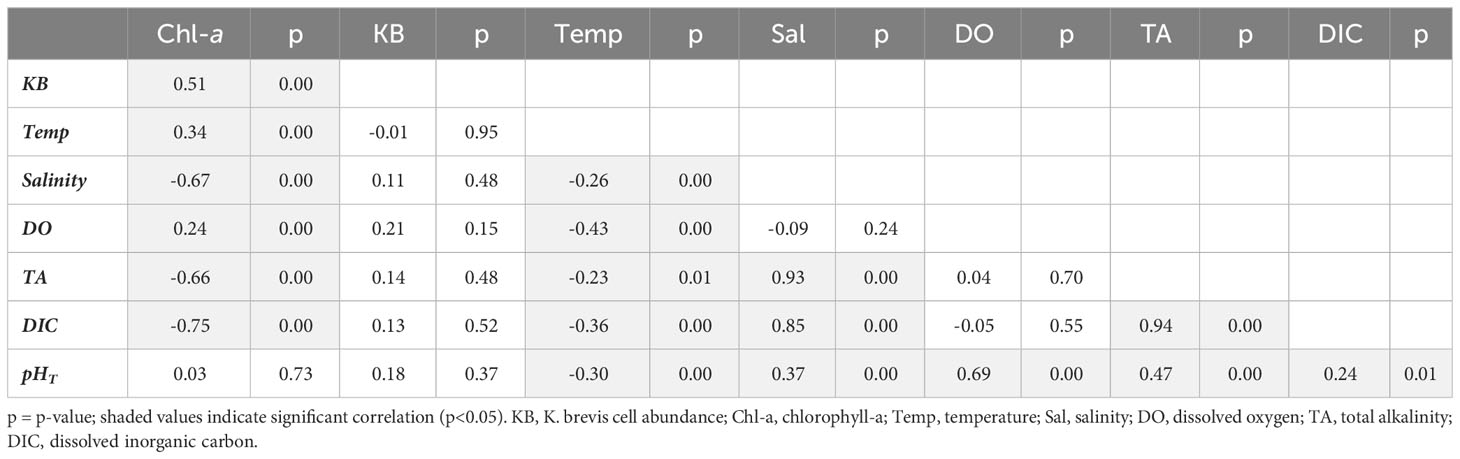
Table 3 Pearson correlation results for Charlotte Harbor (correlation coefficient (r) and p-value).
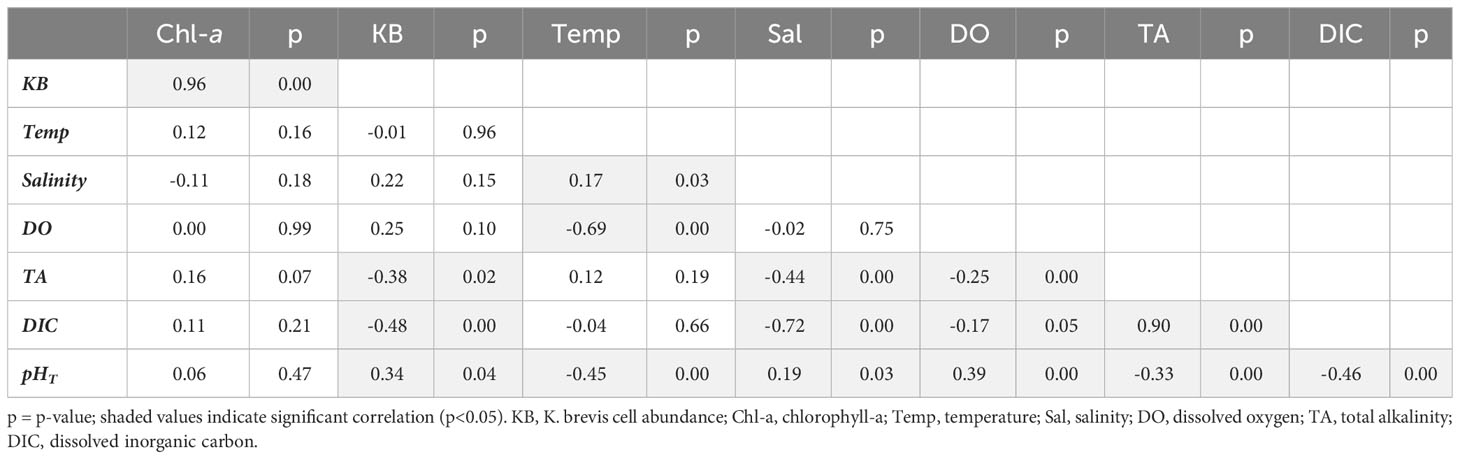
Table 4 Pearson correlation results for the Caloosahatchee River (correlation coefficient (r) and p-value).
3.3 nTA:nDIC
Diagrams of nTA:nDIC for each estuary over the entire sampling period are presented in Figure 4. These diagrams show the effect of CaCO3 production and dissolution, and dissolved and organic matter produced or metabolized, on TA and DIC (Muehllehner et al., 2016). The lower left quadrant of each diagram represents net community calcification and net community production. The upper right quadrant represents net community respiration and net community carbonate dissolution and represents TA and DIC values that are in excess of mean values. In all three estuaries, there were very strong linear relationships between nTA and nDIC (r2 ranging from 0.95 to 0.99), indicating a strong influence NCC and NCP on the carbonate system (Figure 4). Occurrences of net photosynthesis and calcification as dominant processes, and net respiration and dissolution as dominant processes, were observed during both dry and wet seasons. NCP and calcification were dominant processes when K. brevis was present in all three estuaries; however, some occurrences of net respiration and dissolution were observed when K. brevis was present in Charlotte Harbor and the Caloosahatchee River. Tampa Bay had a higher occurrence of production and calcification (n=56) than respiration and dissolution (n=40) throughout the sampling period. Most sample points in Charlotte Harbor and the Caloosahatchee River indicated net production and calcification (CH calcification and production n=74, CH dissolution and respiration n=50; CR calcification and production n=98, CR dissolution and respiration n=29, Figure 4, Table 5). Net community calcification:net community production ratios (NCC : NCP) provide information on the ratio of inorganic carbon production (calcification) or dissolution relative to organic carbon production or remineralization. Tampa Bay had the lowest NCC : NCP ratio (0.826), followed by Charlotte Harbor (0.932) and the Caloosahatchee River (1.022).
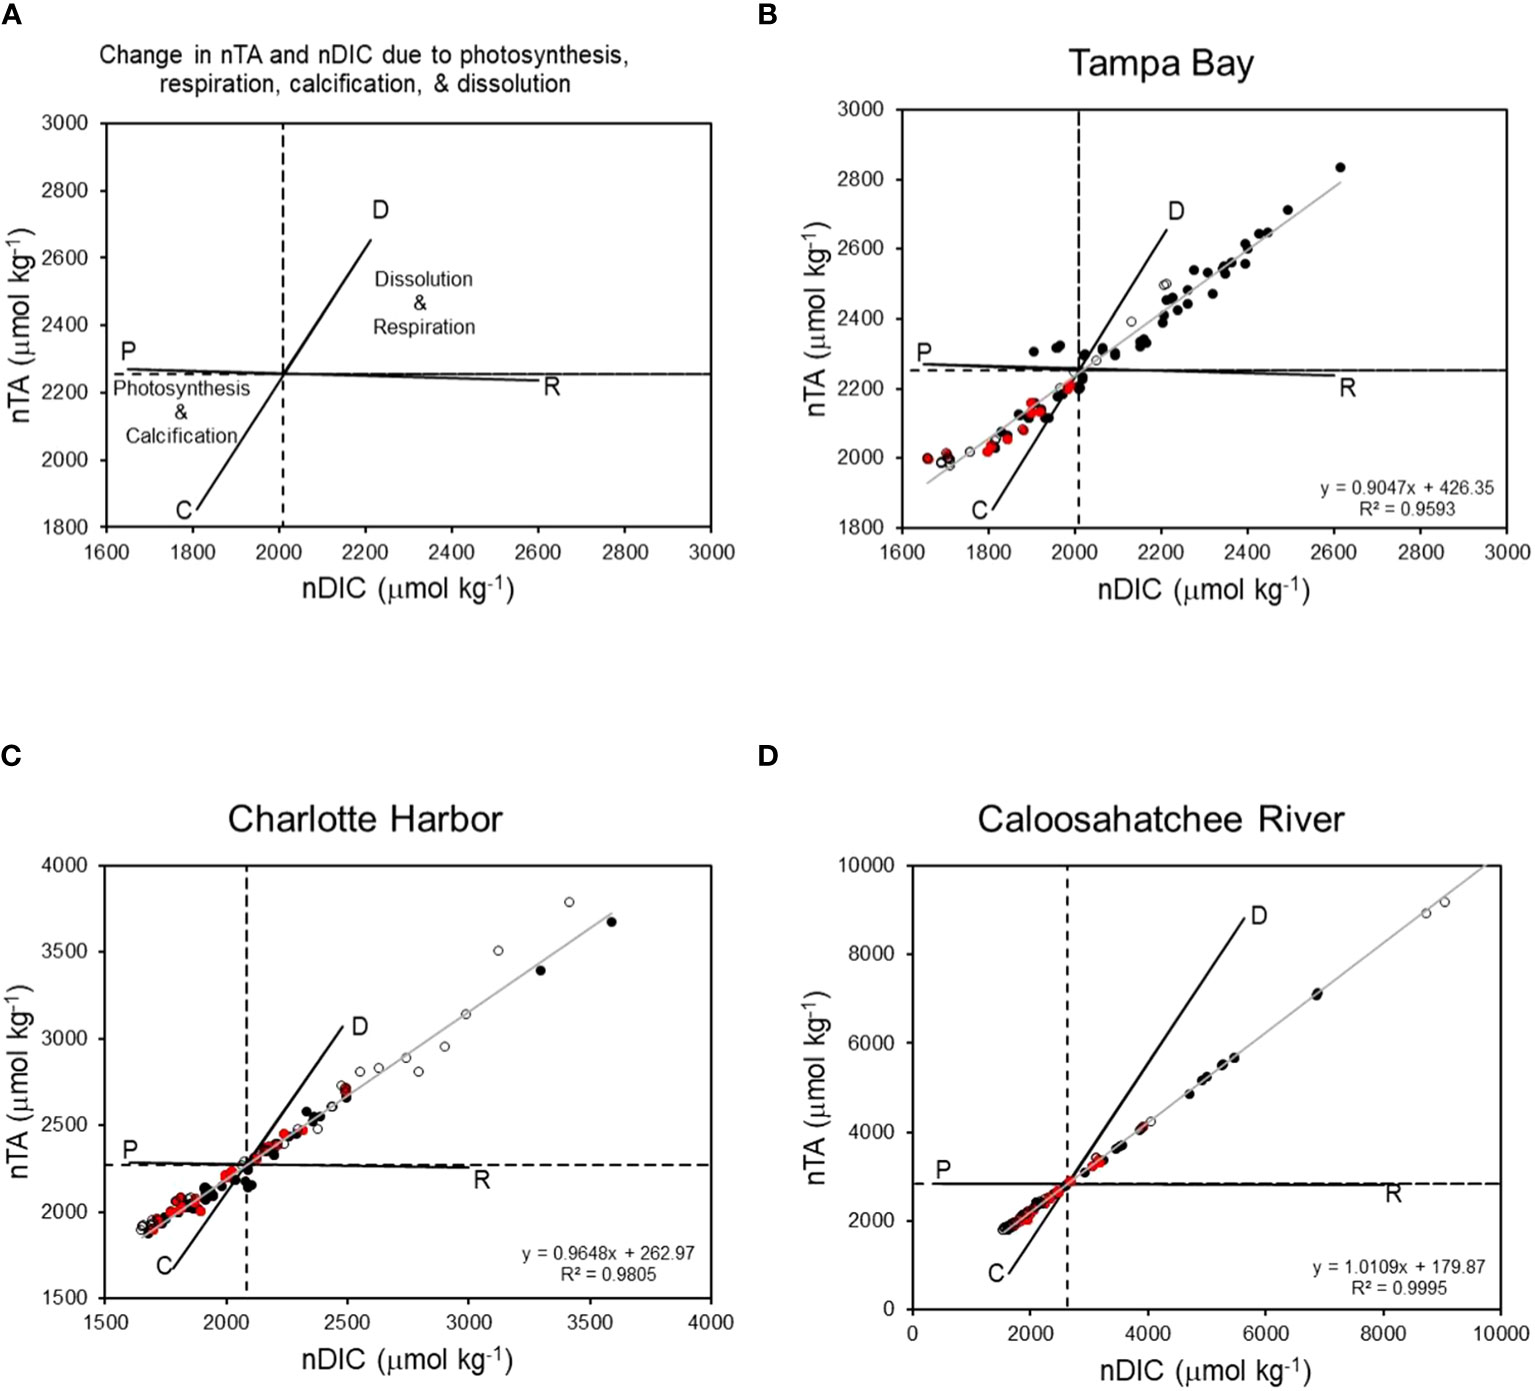
Figure 4 (A) Theoretical change in nTA and nDIC resulting from photosynthesis (P), respiration (R), calcification (C), and dissolution (D). Linear relationships between nTA and nDIC in Tampa Bay (B), Charlotte Harbor (C), and the Caloosahatchee River (D). Points in upper right quadrant indicate carbonate dissolution and respiration were dominant processes. Points in lower left quadrant indicate photosynthesis and calcification were dominant processes. Dashed lines indicate mean nTA and nDIC in each estuary. Gray line indicates linear regression for all data. Solid black circles = dry season; open black circles = wet season; red circles = Karenia brevis present during the dry season (no border) or wet season (black border).
3.4 Nutrients
Conservative mixing of DNH4-N in Tampa Bay was observed throughout the study period, with the exception of elevated concentration as the result of an episodic release of phosphate mining effluent into middle Tampa Bay from the Piney Point facility located along the estuary’s eastern coastline in March and April of 2021. Seasonal periods of source or sink of DNH4-N in Charlotte Harbor occurred, and K. brevis was present whether there was a source or sink of DNH4-N. In periods when K. brevis was present, the source of DNH4-N typically occurred during winter months (November and December sampling events) while a sink of DNH4-N typically occurred during the spring months (February and April; Figure 5). At the northernmost sites in Charlotte Harbor (E23, E24 and E26; Figure 1) elevated bottom concentrations of DNH4-N were observed in November 2022, which was approximately 2 months after the passage of Hurricane Ian (Heidarzadeh et al., 2023). DNH4-N was also most elevated when K. brevis was present in the Caloosahatchee River (Figure 6). When outliers from the legacy mining event and Hurricane Ian were removed, there was a strong linear relationship between DNH4-N and salinity for Tampa Bay, a weak relationship for Charlotte Harbor, and a strong relationship for the Caloosahatchee River. Overall, Charlotte Harbor and the Caloosahatchee River had greater concentrations of DNH4-N compared to Tampa Bay but were not significantly different from each other (Supplementary Tables 3, 4).
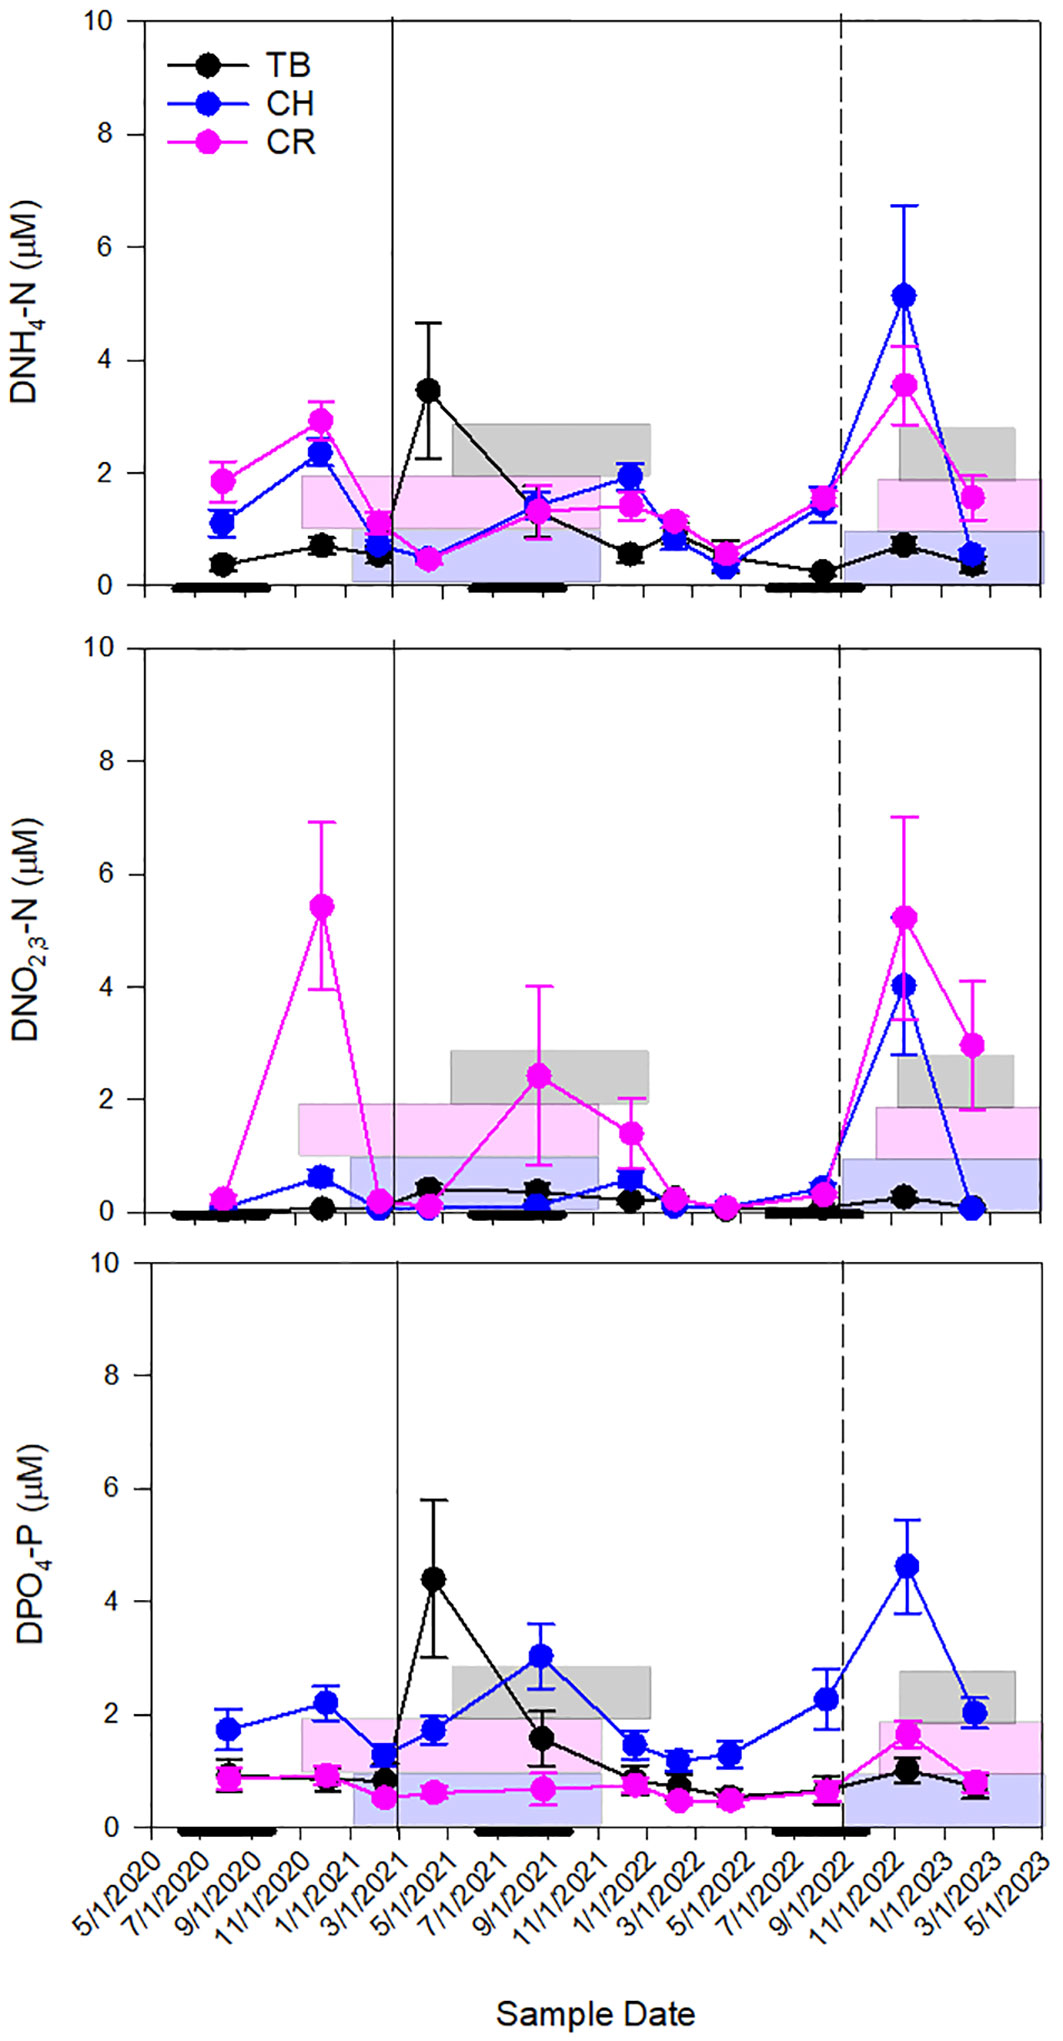
Figure 5 Seasonal patterns of mean dissolved ammonia (DNH4-N), nitrate-nitrite (DNO2,3-N), and phosphate, (DPO4-P) concentrations at all stations throughout the sampling period (TB – Tampa Bay, CH – Charlotte Harbor and CR – the Caloosahatchee River). Error bars are standard error. The solid line represents the mining release event (in Tampa Bay, September 2021) and the dashed line represents Hurricane Ian (September 2022). Gray boxes represent K. brevis bloom conditions in TB, pink boxes represent K. brevis bloom conditions in CH and blue boxes represent K. brevis bloom conditions in CR. Thick black lines along the x-axis represent the wet season in the west coast of Florida (June 1-October 31).
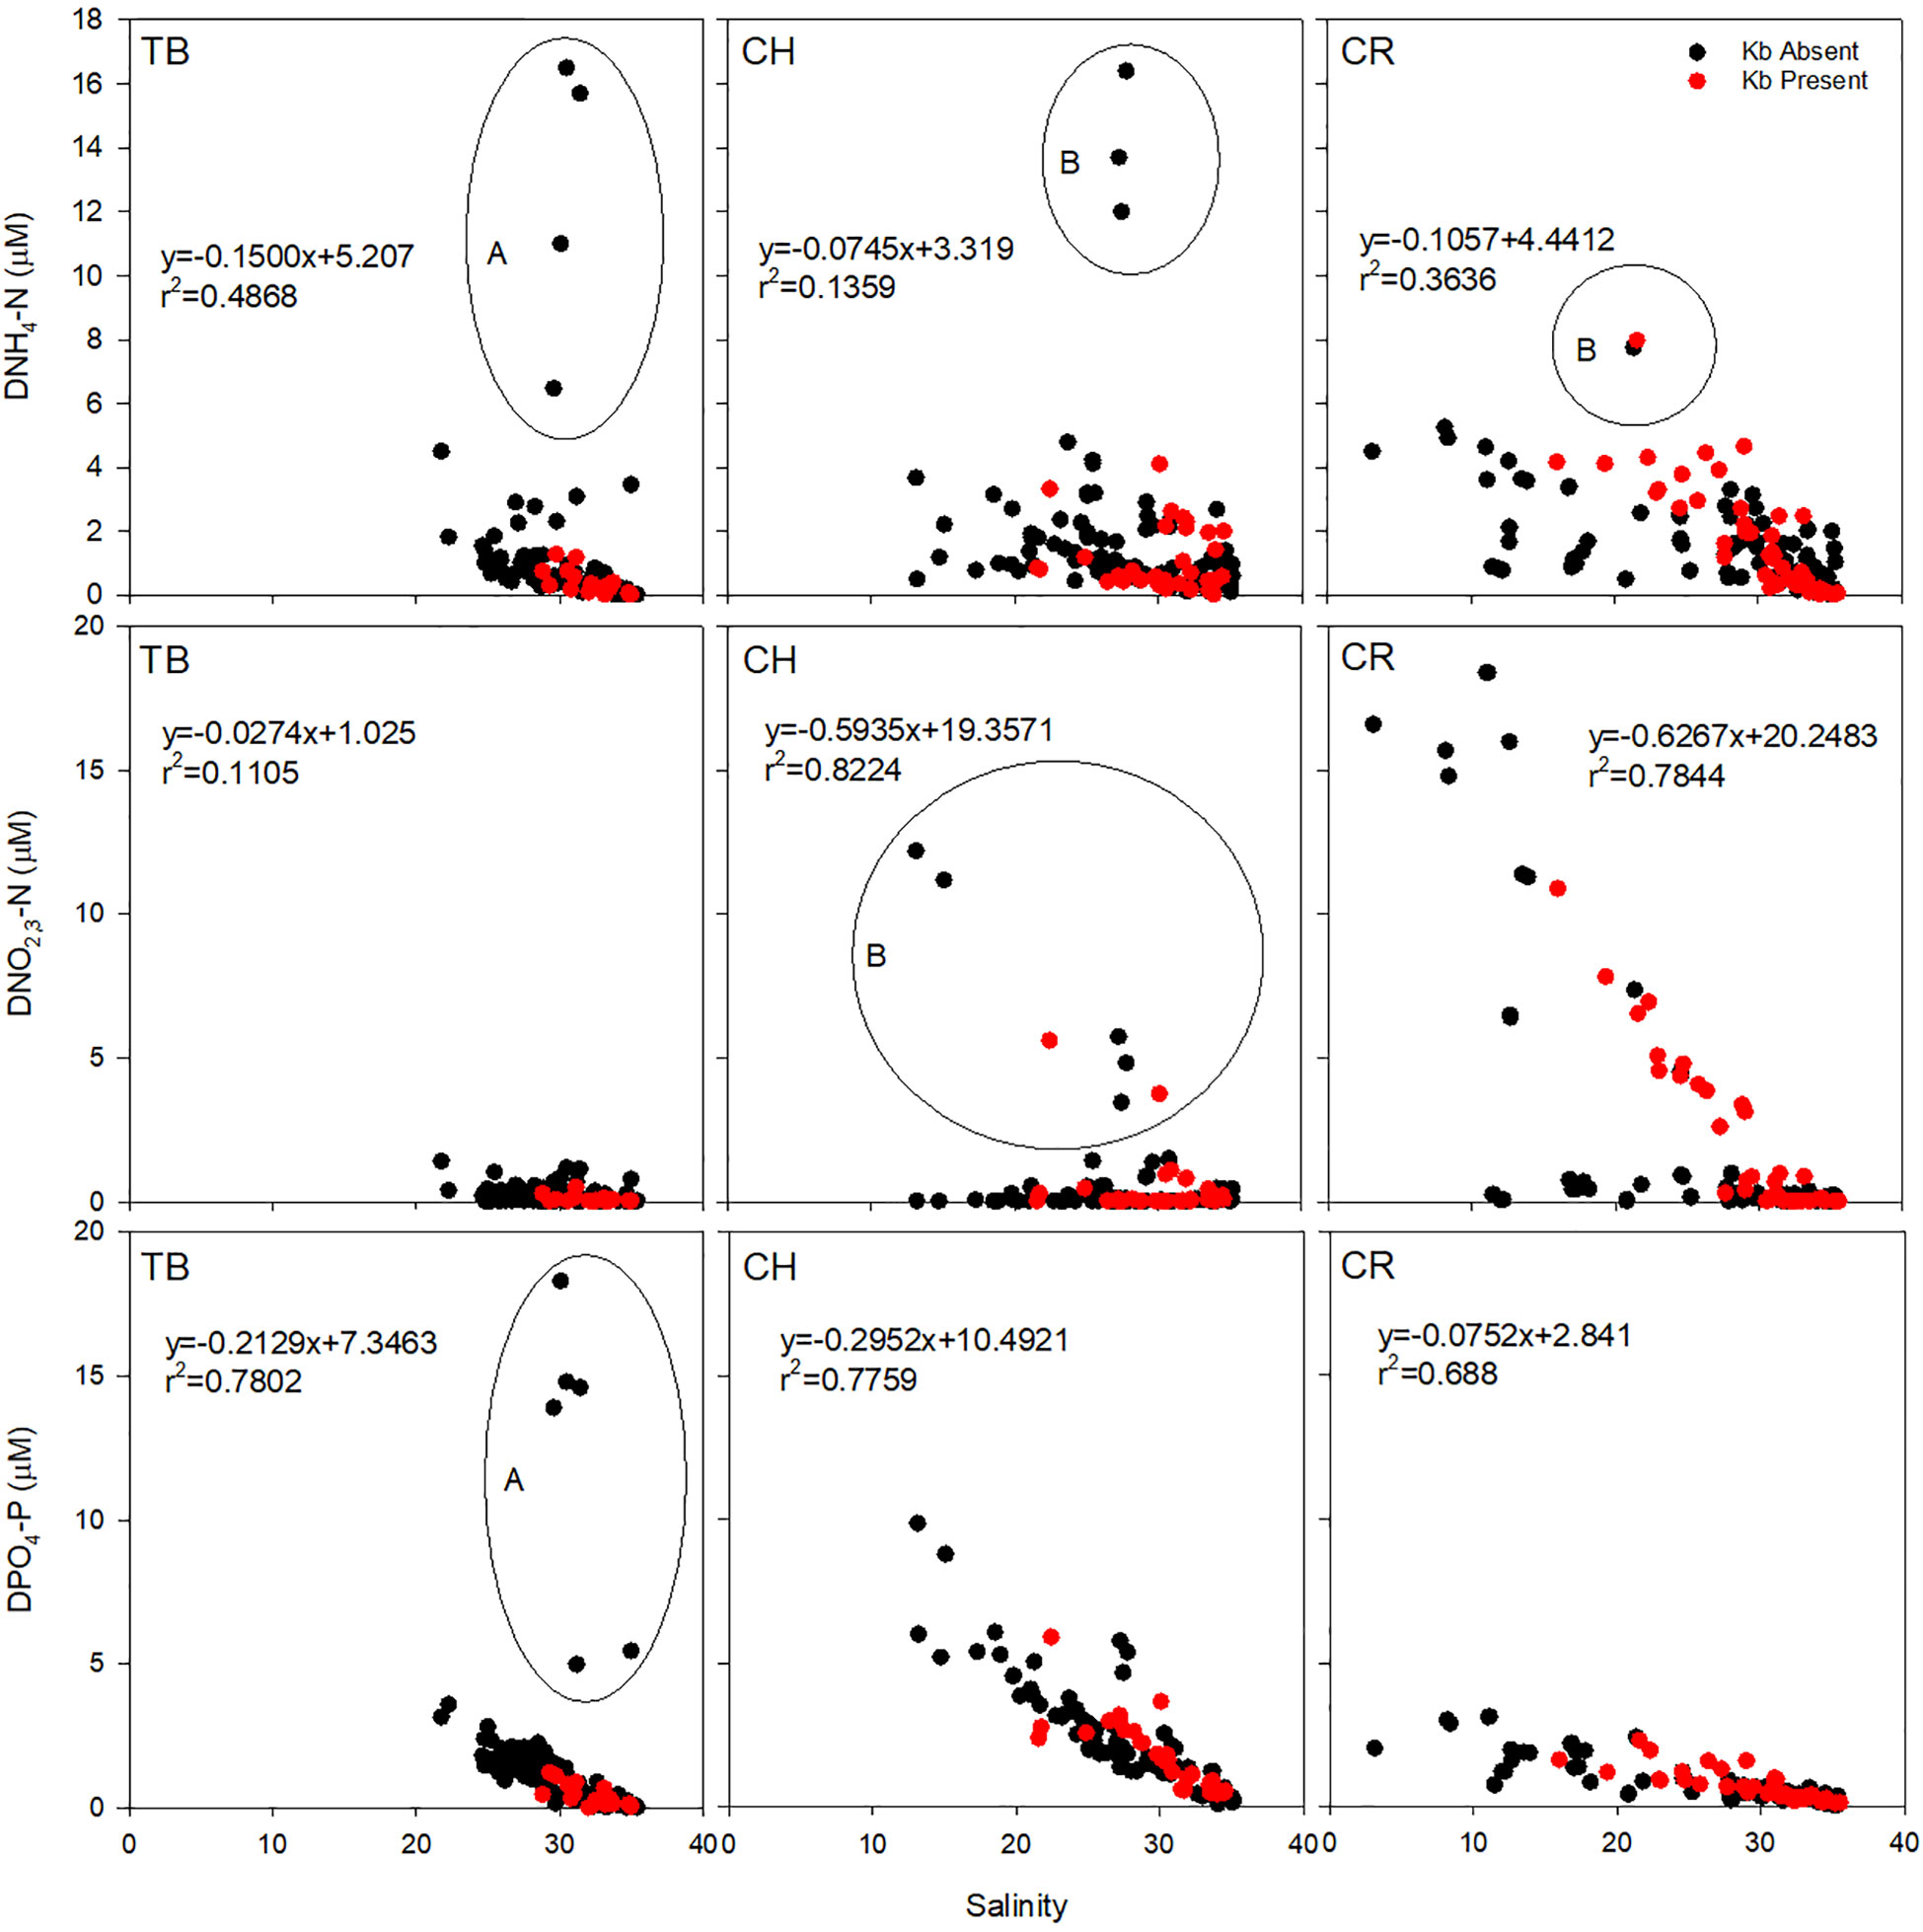
Figure 6 Dissolved ammonia (DNH4-N), nitrate-nitrite (DNO2,3-N), and phosphate (DPO4-P) mixing curves for all three estuaries. Red symbols indicate presence of K. brevis cells (Kb). TB, Tampa Bay, CH, Charlotte Harbor, CR, Caloosahatchee River. Circled outlier data are samples taken shortly after (A) mining release event (in Tampa Bay, March 2021) and (B) Hurricane Ian (September 2022). The r2 data is calculated with outliers removed.
Tampa Bay had the lowest concentrations of DNO2,3-N of all three estuaries (p<0.001; Supplementary Table 4). Concentrations were similar in Charlotte Harbor as in Tampa Bay, except for November 2022, shortly after Hurricane Ian when concentrations were greater than 5 µM and K. brevis was present near the mouth of the estuary. Mixing was generally conservative in the Caloosahatchee River for DNO2,3-N unless samples were at or below detection (Figure 6). There was a very weak to weak relationship between DNO2,3-N and salinity for Tampa Bay, Charlotte Harbor and the Caloosahatchee River. However, the data from Hurricane Ian in Charlotte Harbor and elevated river flows in the Caloosahatchee River show the episodic relationship between DNO2,3-N and salinity were very strong. Overall, the Caloosahatchee River had the greatest concentration of DNO2,3-N compared to Charlotte Harbor and Tampa Bay, but Charlotte Harbor and Tampa Bay were not significantly different from each other (Supplementary Tables 3, 4).
Concentrations of DPO4-P were most elevated after the mining release event in Tampa Bay, likewise there was also elevated DPO4-P in Charlotte Harbor after Hurricane Ian (Figure 6). Tampa Bay and Charlotte Harbor both showed conservative mixing while the Caloosahatchee River was both a source and a sink for DPO4-P. When outliers from the mining event were removed, there was a strong negative relationship between DPO4-P and salinity. There was a strong relationship in Charlotte Harbor and the Caloosahatchee River independent of Hurricane Ian or elevated river flows. Overall, Charlotte Harbor had the greatest concentration of DPO4-N compared to the Caloosahatchee River and Tampa Bay, but the Caloosahatchee River and Tampa Bay were not significantly different from each other (Supplementary Tables 3, 4).
Ratios of DIN : DIP were consistently N-limited for all three estuaries with the exception of two TB stations in February 2022, one CH station in December 2021, and one CR station in April 2022. DIN : DIP ratios were highest in the Caloosahatchee River and were likely driven by the elevated NO2,3-N (p<0.001; Supplementary Figure 2; Supplementary Tables 3, 4).
4 Discussion
The presence of K. brevis is well-documented on the West Florida Shelf and in estuaries within the region (Liu et al., 2016). Acidification events have also been documented in this region (Robbins and Lisle, 2018; Robbins et al., 2018; Yates et al., 2023), yet little is understood about the interaction of acidification, or carbonate patterns in general, with high biomass blooms like those formed by K. brevis (Turner et al., 2021). Laboratory studies show that growth rates of K. brevis could increase under elevated pCO2 (Errera et al., 2014), which may lead to a greater prevalence and intensity of K. brevis bloom events in the future (Errera et al., 2014; Wells et al., 2015; Bercel and Kranz, 2019). This information is limited, however, in response to what might be occurring within the natural ecosystems. The interactions and dynamics between chemical and biological factors during K. brevis blooms can be quite complex.
During this study, two K. brevis blooms occurred from late 2020 to late 2021 (approximately 12 months) and in late 2022 to mid-2023 (approximately 8 months). During the first bloom event, K. brevis was observed in discrete samples in the Caloosahatchee River and Charlotte Harbor, followed by Tampa Bay. During the second bloom event, K. brevis was observed in discrete samples concurrently across all transects. It is important to note that samples for this study were collected quarterly and did not capture the full dynamics of K. brevis from initiation to termination across each transect (e.g., in Tampa Bay which persisted from May through October 2021, Figure 2); thus, the biological system and bloom initiation were influenced by conditions not captured during these monitoring efforts. These concurrent sampling efforts provided information for in situ conditions present only at the time of sampling and did not quantify biological response to evolving environmental conditions or estuarine circulation. During the first bloom event in Tampa Bay, DNO2,3-N, DNH4-N, and DPO4-P were elevated; however, increases in phytoplankton biomass were initially driven by diatoms, cyanobacteria, and finally K. brevis two months later, which was introduced to the bay from a northward moving coastal bloom (Beck et al., 2022a; Morrison et al., 2023). Other studies show that diatoms can also dominate in the region (Badylak et al., 2007; Heil et al., 2007) and show greater uptake rates for available nutrients when compared to K. brevis (Hall et al., 2023).
There were both seasonal and spatial differences in carbonate chemistry and nutrients across the estuaries. Tampa Bay had the most elevated average pHT overall compared to the other two estuaries. Tampa Bay is a success story with respect to pH changes over the past few decades. However, recent seagrass losses attributed to harmful algal blooms and tropical storm impacts have occurred in Tampa Bay (Tomasko et al., 2020; Beck et al., 2022b; Lopez et al., 2023); and decreasing pH has been observed over the past decade (Karlen et al., 2023). Submarine groundwater discharge has been documented in Florida estuaries (Swarzenski et al., 2007; Charette et al., 2013) and may also contribute to localized acidification events. Seagrasses are predicted to benefit from elevated pCO2 and are capable of increasing pH and carbonate mineral saturation states through photosynthesis, which in turn, may buffer against acidification (Sunday et al., 2017; Cyronak et al., 2018; Pacella et al., 2018). Additionally, the dissolution of carbonate sediments may also provide a mechanism for buffering seawater pH. Long-term water quality monitoring in Tampa Bay indicates that seawater pH has increased since the 1980s as the seagrass beds have recovered (Greening et al., 2014). Even so, the remineralization of organic material following a K. brevis HAB event may influence carbonate chemistry patterns that are normally well-buffered (Raven et al., 2020). Lowest pHT and highest pCO2 in Tampa Bay occurred in December 2022, following a series of bloom events which may be representative of an acidification event resulting from the breakdown of organic matter from dead fish or dying algae (Raven et al., 2020). This acidification event in Tampa Bay also occurred during the winter season when low productivity is expected for both seagrasses and algae biomass (Robbins and Bell, 2000). Recent modeling studies suggest that riverine nitrate additions via the Caloosahatchee could influence K. brevis blooms (Medina et al., 2020; Medina et al., 2022), assuming they were co-located, but more work is needed to understand these complex dynamics in the environment. During this study, for example, Tampa Bay only had elevated concentrations of DNH4-N and DPO4-N shortly after the mining release event, in April 2021 (Figure 5), and Beck et al. (2022a) showed elevated concentrations of total nitrogen persisting between this study’s quarterly sampling. Interestingly, pHT showed normal bay conditions (Morrison et al., 2023) during the April 2021 sampling event in Tampa Bay and did not appear to be influenced by the release.
Charlotte Harbor had the lowest TA and pHT of all three estuaries. Interestingly, it is one of the largest estuaries for seagrass in southwest Florida, where seagrass coverage has been relatively stable (Corbett, 2006). It is influenced by two large tidal rivers (the Myakka River and the Peace River), both of which provide high concentrations of dissolved organic matter (Doering and Chamberlain, 1999; Steinman et al., 2002) and are estimated to have increases in nitrogen loading (Turner et al., 2006). This area is also a hotspot for K. brevis blooms (Steidinger, 2009; Liu et al., 2022). This estuarine system is relatively high in dissolved organic matter (McPherson and Miller, 1987; Milbrandt et al., 2010) and breakdown of this organic matter can result in reduced pH compared to other systems with lower concentrations of DOM. Charlotte Harbor had the most frequent occurrences of K. brevis during the study period. In Charlotte Harbor, there wasn’t a distinct acidification event following the K. brevis bloom, as was observed in Tampa Bay. pCO2 was elevated and pHT was lower toward the end of the bloom in 2021 and at the beginning of the bloom in 2022. The second bloom event with increased pCO2 (and reduced pH) was shortly after Hurricane Ian. It is possible that elevated rainfall and freshwater input to the system (Figure 7) influenced carbonate chemistry with rainfall that is typically lower in pH and enhanced respiration from elevated nutrients (Hicks et al., 2022). Dissolved nutrient concentrations were most elevated following Hurricane Ian (Figure 5), which coincided with the start of a K. brevis bloom. This study did not examine the cause of the K. brevis blooms.
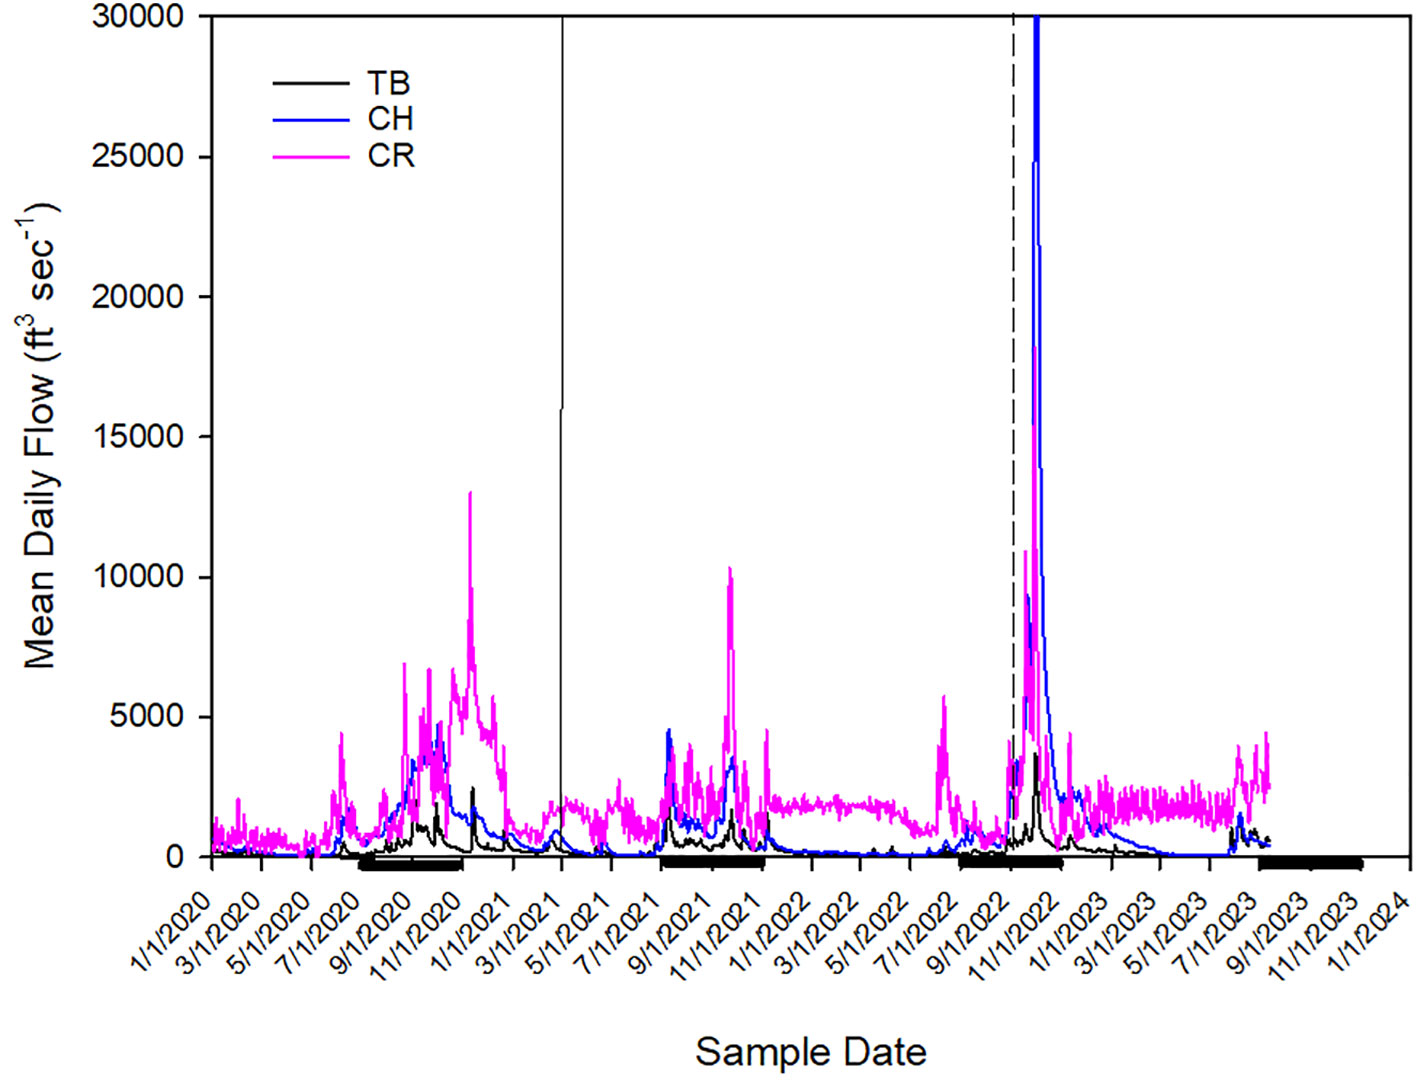
Figure 7 River flows for the Alafia River (representing Tampa Bay - TB), the Peace River (representing Charlotte Harbor - CH) and the Caloosahatchee River (CR). The solid line represents a mining release event (in Tampa Bay, September 2021) and the dashed line represents Hurricane Ian (September 2022). The datapoint for Charlotte Harbor in October 2022 is 49,900 ft3sec-1 and extends beyond the data limit depicted. Thick black lines along the x-axis represent the wet season in the west coast of Florida (June 1-October 31).
The Caloosahatchee River had consistently greater concentrations of TA and DIC and had the most elevated DNO2,3-N compared to Tampa Bay and Charlotte Harbor. During this study period, the Caloosahatchee River was N-limited and had the highest DIN : DIP ratios when K. brevis was present. The Caloosahatchee River is a subtropical estuarine environment that extends approximately 48 miles from the S79 Franklin Locke and Dam (26.72173487, -81.69313699) until it empties into the Gulf of Mexico. The S79 dam separates the freshwater river and upstream lake from the estuary and acts like a salinity barrier. During this sampling period, salinity reached levels below 10 PSU twice in December 2020 and August 2021. Karenia brevis was only present at salinities greater than 15 PSU. River fed estuarine systems in carbonate environments such as South Florida, like the Caloosahatchee River, are often higher in TA and are likely to counteract effects of acidification more readily than non-river-fed systems (Duarte et al., 2013). The elevated TA in the Caloosahatchee River may also provide enough buffer against acidification; however, pCO2 was also greatest in the Caloosahatchee River compared to the other two estuaries. Other estuarine river systems have relatively high pCO2 typically resulting from high rates of respiration and nutrient loading in the upper river system (Cai et al., 1999; Guo et al., 2009; Prasad et al., 2013; Jeffrey et al., 2018). Interestingly, instead of a bloom-led acidification event as seen in Tampa Bay, pCO2 was most reduced following a K. brevis bloom. Concentrations of DNO2,3-N, DPO4-P and DIC were low during this time, and others have shown that river nutrient delivery and eutrophication can lead to strong changes in carbonate chemistry (Borgesa and Gypensb, 2010).
Karenia brevis was present in a majority of samples collected in Tampa Bay when our data indicate NCC and NCP were dominant processes (Figure 4, Table 5). Tampa Bay has primarily siliciclastic sands in the northern areas of the bay with higher concentrations of carbonate sediment toward the mouth of the estuary (Yates et al., 2023), suggesting that there is the possibility for more dissolution in the southern subregion of Tampa Bay than in the northern region. Interestingly, K. brevis cells were present in Charlotte Harbor during periods of net community calcification and production, and during periods of net respiration and carbonate dissolution. The rest of the data also show a relatively even distribution between calcification/dissolution and production/respiration. Similar to Tampa Bay, samples where K. brevis was present in the Caloosahatchee River, net community calcification and net community production dominated; however, the data are evenly split between calcification/production and dissolution/respiration.
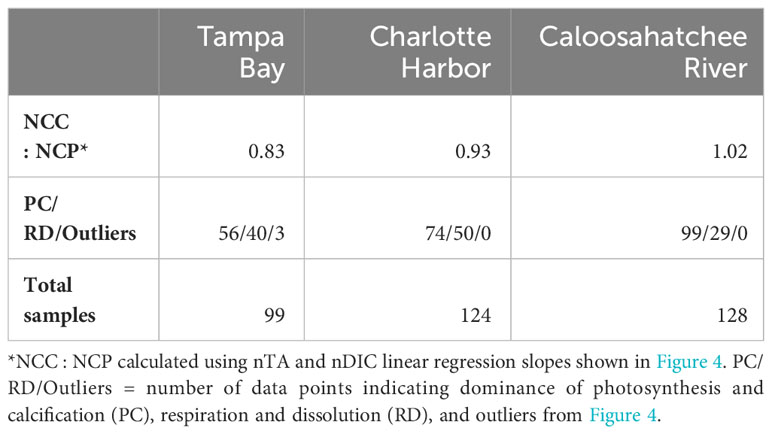
Table 5 Net Community Calcification: Net Community Production ratios (NCC : NCP) for each estuary.
Eutrophication and acidification might amplify patterns of harmful algae, such as K. brevis. The quarterly discrete sampling approach used in this study provided evidence of linkages among seasonal variability in the carbonate system, K. brevis blooms, and other environmental influences. However, long-term datasets including higher resolution time-series observations need to be evaluated to fully understand the drivers and evolution of acidification and HAB events. Studies show that photosynthetic responses to acidification might be small (Mackey et al., 2015), however the growth and death of a harmful algal bloom can intensify or even cause localized acidification events. This study was the first to examine potential linkages between presence of K. brevis blooms and acidification in three large western Florida estuaries: Tampa Bay, Charlotte Harbor, and the Caloosahatchee River. This is a first step towards connecting monitoring networks and observations of K. brevis blooms and carbonate chemistry changes in southwest Florida. Our study demonstrates the variability and complexities associated with understanding interactions among HABs, carbonate chemistry, and acidification, thus illustrating the need for improved spatial and temporal monitoring of the carbonate system along with HAB species to better understand linkages and interactions associated with OA, high biomass HAB events, and environmental conditions. This study also provides critical baseline data to support future comparisons.
Data availability statement
The datasets for this study are publicly available at https://osf.io/tbemw/?view_only=ccbe95f72c554dedbbee358fa98baa68 or in the FWRI HAB Monitoring Database (https://myfwc.com/research/redtide/monitoring/database/) and can be requested by emailing HABdata@MyFWC.com.
Author contributions
EH: Conceptualization, Formal Analysis, Funding acquisition, Investigation, Methodology, Project administration, Supervision, Visualization, Writing – original draft, Writing – review & editing. KY: Formal Analysis, Investigation, Methodology, Validation, Writing – original draft, Writing – review & editing. KH: Conceptualization, Supervision, Writing – review & editing. MG: Data curation, Formal Analysis, Investigation, Writing – review & editing. JF: Data curation, Formal Analysis, Investigation, Methodology, Writing – review & editing.
Funding
The author(s) declare financial support was received for the research, authorship, and/or publication of this article. Funding for this research was provided by the FWC/FWRI-Mote Cooperative Red Tide Research Program, FWC Agreement No. 20034; NSF OCE #2050898; and philanthropy funds to EH.
Acknowledgments
The authors thank all staff who participated in research cruises and sample analyses including Ari Nissanka, Susan Launay, Camia Charniga, David Gordon, Jaci Martinez, Erin Cuyler, Reese Kober, Ryan McGoldrick, Vince Lovko, Val Palubok, Devin Burris, William Scott, Briana Mays, Tristyn Bercel, Sarah Klass, Chloe Manley, Cody Cole, Greg Byrd, and Dean Dougherty. We also thank all student interns who participated including Kelsey Thompson, Lucas Patt, Emmanuel Perry, Olivia Shaffer, Anne Harper and Javier Pujols.
Conflict of interest
The authors declare that the research was conducted in the absence of any commercial or financial relationships that could be construed as a potential conflict of interest.
Publisher’s note
All claims expressed in this article are solely those of the authors and do not necessarily represent those of their affiliated organizations, or those of the publisher, the editors and the reviewers. Any product that may be evaluated in this article, or claim that may be made by its manufacturer, is not guaranteed or endorsed by the publisher.
Author disclaimer
Any use of trade, firm, or product names is for descriptive purposes only and does not imply endorsement by the U.S. Government or the State of Florida.
Supplementary material
The Supplementary Material for this article can be found online at: https://www.frontiersin.org/articles/10.3389/fmars.2024.1331285/full#supplementary-material
References
Arar E. J., Collins G. B. (1997). Method 445.0: In vitro determination of chlorophyll a and pheophytin a in marine and freshwater algae by fluorescence (Cincinnati: United States Environmental Protection Agency, Office of Research and Development, National Exposure Research Laboratory), 22. Available at: https://cfpub.epa.gov/si/si_public_record_report.cfm?Lab=NERL&dirEntryId=309417.
Badylak S., Phlips E. J., Baker P., Fajans J., Boler R. (2007). Distributions of phytoplankton in Tampa Bay estuary, USA 2002–2003. B. Mar. Sci. 80 (2), 295–317.
Beck M. W., Altieri A., Angelini C., Burke M. C., Chen J., Chin D. W., et al. (2022a). Initial estuarine response to inorganic nutrient inputs from a legacy mining facility adjacent to Tampa Bay, Florida. Mar. pollut. Bull. 178, 113598. doi: 10.1016/j.marpolbul.2022.113598
Beck M., Burke M., Sherwood E. (2022b) 2021 Tampa Bay Estuary Nutrient Management Compliance Assessment. Prepared by Tampa Bay Nitrogen Management Consortium St. Petersburg, FL. TBEP Technical Report #04-22. Available at: https://tbep.org/our-work/library/.
Beck M. W., Sherwood E. T., Henkel J. R., Dorans K., Ireland K., Varela P. (2019). Assessment of the cumulative effects of restoration activities on water quality in Tampa Bay, Florida. Estuaries Coasts 42, 1774–1791. doi: 10.1007/s12237-019-00619-w
Bercel T. L., Kranz S. A. (2019). Insights into carbon acquisition and photosynthesis in Karenia brevis under a range of CO2 concentrations. Progr. Oceanogr. 172, 65–76. doi: 10.1016/j.pocean.2019.01.011
Borgesa A. V., Gypensb N. (2010). Carbonate chemistry in the coastal zone responds more strongly to eutrophication than ocean acidification. Limnol. Oceanogr. 55 (1), 346–353. doi: 10.4319/lo.2010.55.1.0346
Brandenburg K. M., Velthuis M., Van de Waal D. B. (2019). Meta-analysis reveals enhanced growth of marine harmful algae from temperate regions with warming and elevated CO2 levels. Global Change Biol. 25 (8), 2607–2618. doi: 10.1111/gcb.14678
Cai W. J., Feely R. A., Testa J. M., Li M., Evans W., Alin S. R., et al. (2021). Natural and anthropogenic drivers of acidification in large estuaries. Annu. Rev. Mar. Sci. 13, 23–55. doi: 10.1146/annurev-marine-010419-011004
Cai W. J., Hu X., Huang W. J., Murrell M. C., Lehrter J. C., Lohrenz S. E., et al. (2011). Acidification of subsurface coastal waters enhanced by eutrophication. Nat. Geosci. 4 (11), 766–770. doi: 10.1038/ngeo1297
Cai W. J., Pomeroy L. R., Moran M. A., Wang Y. (1999). Oxygen and carbon dioxide mass balance for the estuarine-intertidal marsh complex of five rivers in the southeastern US. Limnol. Oceanogr. 44 (3), 639–649. doi: 10.4319/lo.1999.44.3.0639
Charette M. A., Henderson P. B., Breier C. F., Liu Q. (2013). Submarine groundwater discharge in a river-dominated Florida estuary. Mar. Chem. 156, 3–17. doi: 10.1016/j.marchem.2013.04.001
Corbett C. A. (2006). Seagrass coverage changes in Charlotte Harbor, FL. Florida Scientist 69 (00S2), 7–23.
Cyronak T., Andersson A. J., D’Angelo S., Bresnahan P., Davidson C., Griffin A., et al. (2018). Short-term spatial and temporal carbonate chemistry variability in two contrasting seagrass meadows: implications for pH buffering capacities. Estuaries Coasts 41, 1282–1296. doi: 10.1007/s12237-017-0356-5
Dickson A. G., Sabine C. L., Christian J. R. (Eds.) (2007). Guide to Best Practices for Ocean CO2 Measurements Vol. 3 (PICES Special Publication), 191 pp.
Dixon L. K., Kirkpatrick G. J., Hall E. R., Nissanka A. (2014). Nitrogen, phosphorus and silica on the West Florida Shelf: Patterns and relationships with Karenia spp. occurrence. Harmful Algae 38, 8–19. doi: 10.1016/j.hal.2014.07.001
Doering P. H., Chamberlain R. (1999). Water quality and source of freshwater discharge to the Caloosahatchee Estuary, Florida. J. Am. Water Resour. As. 35 (4), 793–806. doi: 10.1111/j.1752-1688.1999.tb04175.x
Doney S. C., Busch D. S., Cooley S. R., Kroeker K. J. (2020). The impacts of ocean acidification on marine ecosystems and reliant human communities. Ann. Rev. Env. Resour. 45, 83–112. doi: 10.1146/annurev-environ-012320-083019
Duarte C. M., Hendriks I. E., Moore T. S., Olsen Y. S., Steckbauer A., Ramajo L., et al. (2013). Is ocean acidification an open-ocean syndrome? Understanding anthropogenic impacts on seawater pH. Estuaries Coasts 36 (2), 221–236. doi: 10.1007/s12237-013-9594-3
Dupont S., Thorndyke M. C., Commission Internationale pour l’Exploration Scientifique de la Mer Mediterranee- CIESM, Monaco (2008). “Ocean acidification and its impact on the early life-history stages of marine animals,” in CIESM Workshop monographs, vol. 36. (Monaco: CIESM), 89–97. Available at: https://ciesm.org/online/monographs/Menton.html.
Dürr H. H., Laruelle G. G., van Kempen C. M., Slomp C. P., Meybeck M., Middelkoop H. (2011). Worldwide typology of nearshore coastal systems: Defining the estuarine filter of river inputs to the oceans. Estuaries Coasts 34, 441–458. doi: 10.1007/s12237-011-9381-y
Errera R. M., Yvon-Lewis S., Kessler J. D., Campbell L. (2014). Reponses of the dinoflagellate Karenia brevis to climate change: pCO2 and sea surface temperatures. Harmful Algae 37, 110–116. doi: 10.1016/j.hal.2014.05.012
Feely R. A., Alin S. R., Newton J., Sabine C. L., Warner M., Devol A., et al. (2010). The combined effects of ocean acidification, mixing, and respiration on pH and carbonate saturation in an urbanized estuary. Estuar. Coast. Shelf S. 88 (4), 442–449. doi: 10.1016/j.ecss.2010.05.004
Feely R. A., Sabine C. L., Hernandez-Ayon J. M., Ianson D., Hales B. (2008). Evidence for upwelling of corrosive” acidified” water onto the continental shelf. Science 320 (5882), 1490–1492. doi: 10.1126/science.1155676
FWC (2023) Florida Fish and Wildlife Conservation Commission – Fish and Wildlife Research Institute (FWC-FWRI) Harmful Algal Bloom (HAB) Monitoring Database. Available at: https://myfwc.com/research/redtide/monitoring/database/ (Accessed 09/25/2023).
Gobler C. J. (2020). Climate change and harmful algal blooms: insights and perspective. Harmful Algae 91, 101731. doi: 10.1016/j.hal.2019.101731
Greening H., Janicki A., Sherwood E. T., Pribble R., Johansson J. O. R. (2014). Ecosystem responses to long-term nutrient management in an urban estuary: Tampa Bay, Florida, USA. Estuar. Coast. Shelf S. 151, A1–A16. doi: 10.1016/j.ecss.2014.10.003
Guo X., Dai M., Zhai W., Cai W. J., Chen B. (2009). CO2 flux and seasonal variability in a large subtropical estuarine system, the Pearl River Estuary, China. J. Geophys. Res. Biogeo 114 (G3). doi: 10.1029/2008JG000905
Hall E. R., Dixon L. K., Kirkpatrick G. J., Nissanka A., Pederson B. A. (2023). Phytoplankton communities of the west coast of Florida – multiyear and seasonal responses to nutrient enrichment. Harmful Algae 130, 10254. doi: 10.1016/j.hal.2023.102547
Hall E. R., Wickes L., Burnett L. E., Scott G. I., Hernandez D., Yates K. K., et al. (2020). Acidification in the US Southeast: causes, potential consequences and the role of the Southeast Ocean and Coastal Acidification Network. Front. Mar. Sci. 7, 548. doi: 10.3389/fmars.2020.00548
Hardison D. R., Sunda W. G., Tester P. A., Shea D., Litaker W. R. (2014). Increased cellular brevetoxins in the red tide dinoflagellate Karenia brevis under CO2 limitation of growth rate: Evolutionary implications and potential effects on bloom toxicity. Limnol. Oceanogr. 59 (2), 560–577. doi: 10.4319/lo.2014.59.2.0560
Heidarzadeh M., Iwamoto T., Šepić J., Mulia I. E. (2023). Normal and reverse storm surges along the coast of Florida during the September 2022 Hurricane Ian: Observations, analysis, and modelling. Ocean Model. 185, 102250. doi: 10.1016/j.ocemod.2023.102250
Heil C. A., Dixon L. K., Hall E., Garrett M., Lenes J. M., O’Neil J. M., et al. (2014). Blooms of Karenia brevis (Davis) G. Hansen & Ø. Moestrup on the West Florida Shelf: Nutrient sources and potential management strategies based on a multi-year regional study. Harmful Algae 38, 127–140. doi: 10.1016/j.hal.2014.07.016
Heil C. A., Revilla M., Glibert P., Murasko S. (2007). Nutrient quality drives differential phytoplankton composition on the southwest Florida shelf. Limnol. Oceanogr. 52 (3), 1067–1078. doi: 10.4319/lo.2007.52.3.1067
Hicks T. L., Shamberger K. E., Fitzsimmons J. N., Jensen C. C., DiMarco S. F. (2022). Tropical cyclone-induced coastal acidification in Galveston Bay, Texas. Commun. Earth Environ. 3 (1), 297. doi: 10.1038/s43247-022-00608-1
Jeffrey L. C., Santos I. R., Tait D. R., Makings U., Maher D. T. (2018). Seasonal drivers of carbon dioxide dynamics in a hydrologically modified subtropical tidal river and estuary (Caboolture River, Australia). J. Geophys. Res. Biogeo. 123 (6), 1827–1849. doi: 10.1029/2017JG004023
Julian P., Osborne T. Z. (2018). From lake to estuary, the tale of two waters: a study of aquatic continuum biogeochemistry. Environ. Monit. Assess. 190, 1–22. doi: 10.1007/s10661-017-6455-8
Karlen D. J., Campbell K., Ash T., Goetting B., Pratt C., Mathiak E., et al (2023). Long-term water quality trends in Tampa Bay, (1974-2020). Florida Scientist 86 (2), 400–408.
Liu Z., Choudhury S. H., Xia M., Holt J., Wallen C. M., Yuk S., et al. (2009). Water quality assessment of coastal Caloosahatchee River watershed, Florida. J. Environ. Sci. Heal. A 44 (10), 972–984. doi: 10.1080/10934520902996872
Liu Y., Weisberg R. H., Lenes J. M., Zheng L., Hubbard K., Walsh J. J. (2016). Offshore forcing on the ‘‘pressure point’’ of the West Florida Shelf: Anomalous upwelling and its influence on harmful algal blooms. J. Geophys. Res. Oceans 121, 5501–5515. doi: 10.1002/2016JC011938
Liu Y., Weisberg R. H., Zheng L., Heil C. A., Hubbard K. A. (2022). Termination of the 2018 Florida red tide event: A tracer model perspective. Estuar. Coast. Shelf Sci. 272 (5), 107901. doi: 10.1016/j.ecss.2022.107901
Lopez C. B., Kaminski S. G., Shankar S., Pribble R., Sherwood E. T., Burke M. C., et al. (2023) Tampa Bay restoration and Pyrodinium bahamense bloom dynamics: Filling knowledge gaps to enhance recovery, a research and application plan. TBEP Technical Report #12-23. Available at: https://drive.google.com/file/d/140oBnV5R2BwOZ7cMuaY-4bu_ftL-YBVJ/view.
LOSOM (2023). Lake Okeechobee System Operating Manual. U.S (Jacksonville, FL: Army Corps of Engineers), 60 pp. Available at: https://usace.contentdm.oclc.org/utils/getfile/collection/p16021coll7/id/24343.
Mackey K. R. M., Morris J. J., Morel F. M. M., Kranz S. A. (2015). Response of photosynthesis to ocean acidification. Oceanography 28 (2), 74–79. doi: 10.5670/oceanog.2015.33
McPherson B. F., Miller R. L. (1987). The vertical attenuation of light in Charlotte Harbor, a shallow, subtropical estuary, south-western Florida. Estuar. Coast. Shelf Sci. 25 (6), 721–737. doi: 10.1016/0272-7714(87)90018-7
Medina M., Huffaker R., Jawitz J. W., Muñoz-Carpena R. (2020). Seasonal dynamics of terrestrially sourced nitrogen influenced Karenia brevis blooms off Florida’s southern Gulf Coast. Harmful Algae 98, 101900. doi: 10.1016/j.hal.2020.101900
Medina M., Kaplan D., Milbrandt E. C., Tomasko D., Huffaker R., Angelini C. (2022). Nitrogen-enriched discharges from a highly managed watershed intensify red tide (Karenia brevis) blooms in southwest Florida. Sci. Total Environ. 827, 154149. doi: 10.1016/j.scitotenv.2022.154149
Milbrandt E. C., Coble P. G., Conmy R. N., Martignette A. J., Siwicke J. J. (2010). Evidence for the production of marine fluorescent dissolved organic matter in coastal environments and a possible mechanism for formation and dispersion. Limnol. Oceanogr. 55 (5), 2037–2051. doi: 10.4319/lo.2010.55.5.2037
Millero F. J. (2010). Carbonate constants for estuarine waters. Mar. Freshw. Res. 61 (2), 139–142. doi: 10.1071/MF09254
Morrison E. S., Phlips E., Badylak S., Chappel A. R., Altieri A. H., Osborne T. Z., et al. (2023). The response of Tampa Bay to a legacy mining nutrient release in the year following the event. Front. Ecol. Evol. 11. doi: 10.3389/fevo.2023.1144778
Muehllehner N., Langdon C., Venti A., Kadko D. (2016). Dynamics of carbonate chemistry, production, and calcification of the Florida Reef Tract, (2009–2010): Evidence for seasonal dissolution. Global Biogeochem. Cy. 30, 661–688. doi: 10.1002/2015GB005327
Osborne E., Hu X., Hall E. R., Yates K., Vreeland-Dawson J., Shamberger K., et al. (2022). Ocean acidification in the Gulf of Mexico: Drivers, impacts, and unknowns. Prog. Oceanogr. 209, 102882. doi: 10.1016/j.pocean.2022.102882
Pacella S. R., Brown C. A., Waldbusser G. G., Labiosa R. G., Hales B. (2018). Seagrass habitat metabolism increases short-term extremes and long-term offset of CO2 under future ocean acidification. P. Natl. Acad. Sci. 115 (15), 3870–3875. doi: 10.1073/pnas.1703445115
Pierrot D., Epitalon J.-M., Orr J. C., Lewis E., Wallace D. W. R. (2021) MS Excel program developed for CO2 system calculations – version 3.0, GitHub repository. Available at: https://github.com/dpierrot/co2sys_xl.
Prasad M. B. K., Kaushal S. S., Murtugudde R. (2013). Long-term pCO2 dynamics in rivers in the Chesapeake Bay watershed. Appl. Geochem. 31, 209–215. doi: 10.1016/j.apgeochem.2013.01.006
Qiu C., Wan Y. (2013). Time series modeling and prediction of salinity in the Caloosahatchee River Estuary. Water Resour. Res. 49 (9), 5804–5816. doi: 10.1002/wrcr.20415
Raven J. A., Gobler C. J., Hansen P. J. (2020). Dynamic CO2 and pH levels in coastal, estuarine, and inland waters: Theoretical and observed effects on harmful algal blooms. Harmful Algae 91, 101594. doi: 10.1016/j.hal.2019.03.012
Reinfelder J. R. (2011). Carbon concentrating mechanisms in eukaryotic marine phytoplankton. Annu. Rev. Mar. Sci. 3, 291–315. doi: 10.1146/annurev-marine-120709-142720
Riebesell U., Aberle-Malzahn N., Achterberg E. P., Algueró-Muñiz M., Alvarez-Fernandez S., Arístegui J., et al. (2018). Toxic algal bloom induced by ocean acidification disrupts the pelagic food web. Nat. Clim. Change 8 (12), 1082–1086. doi: 10.1038/s41558-018-0344-1
Robbins B. D., Bell S. S. (2000). Dynamics of a subtidal seagrass landscape: seasonal and annual change in relation to water depth. Ecology 81 (5), 1193–1205. doi: 10.1890/0012-9658(2000)081[1193:DOASSL]2.0.CO;2
Robbins L. L., Daly K. L., Barbero L., Wanninkhof R., He R., Zong H., et al. (2018). Spatial and temporal variability of pCO2, carbon fluxes, and saturation state of the West Florida Shelf. J. Geophys. Res. Oceans 123, 6174–6188. doi: 10.1029/2018JC014195
Robbins L. L., Lisle J. T. (2018). Regional acidification trends in Florida shellfish estuaries: A 20+ year look at pH, oxygen, temperature, and salinity. Estuar. Coast. 41 (5), 1268–1281. doi: 10.1007/s12237-017-0353-8
Rumbold D. G., Doering P. H. (2020). Water quality and source of freshwater discharge to the Caloosahatchee Estuary, Florida. Florida Scientist 83 (1), 1–20.
Seasoft V2 (2018) Seasoft version 2.4.0. Available at: https://www.seabird.com/software.
SigmaPlot (2023). SigmaPlot for Graphing and Data Visualization version 14.0 (Systat). Available at: https://systatsoftware.com/sigmaplot/.
Steidinger K. A. (2009). Historical perspective on Karenia brevis red tide research in the Gulf of Mexico. Harmful Algae. 8 (4), 549–561.
Steinman A., Havens K., Hornung L. (2002). The managed recession of Lake Okeechobee, Florida: Integrating science and natural resource management. Conserv. Ecol. 6 (2), 17. doi: 10.5751/ES-00417-060217
Sun D., Wan Y., Qiu C. (2016). Three dimensional model evaluation of physical alterations of the Caloosahatchee River and Estuary: Impact on salt transport. Estuar. Coast. Shelf Sci. 173, 16–25. doi: 10.1016/j.ecss.2016.02.018
Sunday J. M., Fabricius K. E., Kroeker K. J., Anderson K. M., Brown N. E., Barry J. P., et al. (2017). Ocean acidification can mediate biodiversity shifts by changing biogenic habitat. Nat. Clim. Change 7 (1), 81–85. doi: 10.1038/nclimate3161
Suzuki A., Kawahata H. (2003). Carbon budget of coral reef systems: an overview of observations in fringing reefs, barrier reefs and atolls in the Indo-Pacific regions. Tellus B 55 (2), 428–444. doi: 10.3402/tellusb.v55i2.16761
Swarzenski P. W., Reich C., Kroeger K. D., Baskaran M. (2007). Ra and Rn isotopes as natural tracers of submarine groundwater discharge in Tampa Bay, Florida. Mar. Chem. 104 (1-2), 69–84. doi: 10.1016/j.marchem.2006.08.001
Takeshita Y., McGillis W., Briggs E. M., Carter A. L., Donham E. M., Martz T. R., et al. (2016). Assessment of net community production and calcification of a coral reef using a boundary layer approach. J. Geophys. Res. Oceans 121 (8), 5655–5671. doi: 10.1002/2016JC011886
Tomasko D., Alderson M., Burnes R., Hecker J., Iadevaia N., Leverone J., et al. (2020). The effects of Hurricane Irma on seagrass meadows in previously eutrophic estuaries in Southwest Florida (USA). Mar. Poll. Bull. 156, 111247. doi: 10.1016/j.marpolbul.2020.111247
Tullis-Joyce P., Roy S. S. (2021). Occurrence of Karenia brevis near Southwest Florida coast 1971 to 2017: a geospatial analysis. J. Coas. Conserv. 25, 1–14. doi: 10.1007/s11852-021-00844-1
Turner E., Ombres E., Bennett-Mintz J., Dortch Q., Broadwater M., Berger H., et al. (2021). NOAA Ocean Acidification Program: Harmful Algal Blooms and Ocean Acidification Workshop: Defining a Research Agenda (NOAA: U.S. Department of Commerce, NOAA Technical Memorandum OAR-OAP-3), 76 p. Available at: https://repository.library.noaa.gov/view/noaa/30908.
Turner R. E., Rabalais N. N., Fry B., Atilla N., Milan C., Lee J. M., et al. (2006). Paleo-indicators and water quality change in the Charlotte Harbor Estuary (Florida). Limnol. Oceanogr. 51, 518–533. doi: 10.4319/lo.2006.51.1_part_2.0518
Vargo G. A. (2009). A brief summary of the physiology and ecology of Karenia brevis Davis (G. Hansen and Moestrup comb. nov.) red tides on the West Florida Shelf and of hypotheses posed for their initiation, growth, maintenance, and termination. Harmful Algae 8 (4), 573–584. doi: 10.1016/j.hal.2008.11.002
Wallace R. B., Baumann H., Grear J. S., Aller R. C., Gobler C. J. (2014). Coastal ocean acidification: The other eutrophication problem. Estuar. Coast. Shelf Sci. 148, 1–13. doi: 10.1016/j.ecss.2014.05.027
Weisberg R. H., Liu Y., Lembke C., Hu C., Hubbard K., Garrett M. (2019). The coastal ocean circulation influence on the 2018 West Florida Shelf K. brevis red tide bloom. Journal of Geophysical Research: Oceans 124 (4), 2501–2512.
Wells M. L., Karlson B., Wulff A., Kudela R., Trick C., Asnaghi V., et al. (2020). Future HAB science: Directions and challenges in a changing climate. Harmful Algae 91, 101632. doi: 10.1016/j.hal.2019.101632
Wells M. L., Trainer V. L., Smayda T. J., Karlson B. S., Trick C. G., Kudela R. M., et al. (2015). Harmful algal blooms and climate change: Learning from the past and present to forecast the future. Harmful Algae 49, 68–93. doi: 10.1016/j.hal.2015.07.009
Yates K. K., Dufore C., Smiley N., Jackson C., Halley R. B. (2007). Diurnal variation of oxygen and carbonate system parameters in Tampa Bay and Florida Bay. Mar. Chem. 104, 110–124. doi: 10.1016/j.marchem.2006.12.008
Yates K. K., Moore C. S., Lemon M. K., Moyer R. P., Tomasko D., Masserini R., et al. (2023). Coastal acidification trends and controls in a subtropical estuary, Tampa Bay, Florida, USA. Florida Scientist 86 (2), 214–228.
Keywords: HABs, acidification, Gulf of Mexico, nitrogen, phosphorus
Citation: Hall ER, Yates KK, Hubbard KA, Garrett MJ and Frankle JD (2024) Nutrient and carbonate chemistry patterns associated with Karenia brevis blooms in three West Florida Shelf estuaries 2020-2023. Front. Mar. Sci. 11:1331285. doi: 10.3389/fmars.2024.1331285
Received: 31 October 2023; Accepted: 12 January 2024;
Published: 25 January 2024.
Edited by:
Adrienne J. Sutton, National Oceanic and Atmospheric Administration (NOAA), United StatesReviewed by:
Reagan M. Errera, National Oceanic and Atmospheric Administration Great Lakes Environmental Research Laboratory, United StatesAllison Savoie, Texas A&M University, United States
Copyright © 2024 Hall, Yates, Hubbard, Garrett and Frankle. This is an open-access article distributed under the terms of the Creative Commons Attribution License (CC BY). The use, distribution or reproduction in other forums is permitted, provided the original author(s) and the copyright owner(s) are credited and that the original publication in this journal is cited, in accordance with accepted academic practice. No use, distribution or reproduction is permitted which does not comply with these terms.
*Correspondence: Emily R. Hall, ZW1pbHk4QG1vdGUub3Jn