 Raul Payri
 Francisco Javier Salvador
 Juan P. Viera
- CMT-Motores Térmicos, Universitat Politècnica de Valencia, Valencia, Spain
Understanding and controlling mixing and combustion processes is fundamental in order to face the challenges set by the ever more demanding pollutant regulations and fuel consumption standards of direct injection diesel engines. The fundamentals of these processes haven been long studied by the diesel spray community from both experimental and numerical perspectives. However, certain topics, such as the influence of nozzle geometry over the spray atomization, mixing, and combustion process, are still not completely well understood and predicted by numerical models. The present study seeks to contribute to the current understanding of this subject, by performing state of the art optical diagnostics to liquid sprays injected through two singe-hole nozzles of different conicity. The experiments were carried out in a nitrogen-filled constant-pressure-flow facility. Back pressures were set to produce the desired engine-like density conditions in the chamber, at room temperature. The experimental setup consists in a diffused back-illumination setup with a fast pulsed LED light source and a high-speed camera. The diagnostics focused on detecting the liquid spray contour and evaluating the influence of nozzle geometry over the time-resolved and quasi-steady response of the spray dispersion, at similar injection conditions. Results show a clear influence of nozzle geometry on spray contour fluctuations, where the cylindrical nozzle seems to produce larger dispersion in both time-resolved fluctuations and quasi-steady values, when compared to the conical nozzle. This evidences that the turbulence and radial velocity profiles originated at the cylindrical nozzle geometry are able to affect not only the microscopic scales inside the nozzle, but also macroscopic scales, such as the steady spray. Observations from this study indicate that the effects of the flow characteristics within the nozzle are carried on to the first millimeters of the spray, in which the rest of the spray formation downstream is pre-defined.
1. Introduction
Internal combustion engines have defined and shaped the world since their introduction approximately a century ago. Over the last three decades, performance, fuel consumption and exhaust emissions have been significantly improved. Nonetheless, increasing concerns in pollutant emissions demand a critical and detailed evaluation of the combustion process, which is largely influenced by fuel-air mixing (Ma et al., 2014; Magno et al., 2014). To this end, computational fluid dynamic (CFD) models offer unmatched advantages over the experimental approach due to the large amount of detailed and localized information they are able to provide. Still, current state of the art models are not completely predictive and consequently, high-fidelity experimental data is still necessary at the boundaries to properly initialize simulations.
The large majority of current spray models introduce boundary/initial conditions at the nozzle exit (Qin et al., 1999; Ning et al., 2008; Som et al., 2011; Battistoni et al., 2012; Montanaro et al., 2014). This way, the smaller scales of nozzle flow characteristics are greatly damped or even lost and the spray development is mainly dictated by momentum and aerodynamics/mixing. However, several authors have shown that the flow inside the nozzle influences the near-nozzle region of the spray in terms of liquid phase break-up, microscopic spray penetration, and spray angle (Koo et al., 1997; Arcoumanis and Gavaises, 1998; Han et al., 2002; Blessing et al., 2003; Suh and Lee, 2008; Som and Aggarwal, 2009, 2010; Som et al., 2009; Liu et al., 2010). Many other studies have also evidenced the effects of nozzle flow characteristics over the macroscopic spray (Morgan et al., 2001; Blessing et al., 2003; Payri et al., 2004a, 2008; Ning et al., 2008; Som et al., 2011; Montanaro et al., 2014). Contrasting these studies, (Badock et al., 1999) and later (Ganippa et al., 2003) presented results claiming that nozzle flow characteristics have negligible influence over the spray formation and that momentum is the only controlling variable for mixing. This contrast, along with the remaining uncertainty of to what extent is the nozzle geometry determinant in mixture formation, combustion performance, pollutant formation, etc, leave room for fundamental questions on the subject.
These fundamental questions could be addressed through properly validated computational models that comprise the complete problem, which offer detailed data of phenomena difficult to observe experimentally. A few authors have published computational models that employ a full grid comprising the nozzle internal geometry and the spray (Battistoni et al., 2014; Desantes et al., 2014; Salvador et al., 2014; Xue et al., 2014, 2015). It is important to point out that the works presented by Desantes et al. (2014) and Xue et al. (2014, 2015) are significantly boosted by the considerable size and quality of the Engine Combustion Network (ECN) open database and efforts [http://www.sandia.gov/ecn/ (Bardi et al., 2012)], which allowed access to very high resolution tomographies of the real inside geometry of the nozzle, along with extensive experimental validation data from different institutions around the world. However, the effects of nozzle geometries on spray formation were still out of the scope of the these studies so these publications do not answer the questions raised about the real effects of nozzle flow characteristics over the macroscopic spray.
This study is a contribution to the current understanding of the effects of nozzle flow characteristics over the macroscopic spray development. The experimental campaign consisted in a high-speed visualization of the isothermal liquid spray. All experiments were performed for two different nozzle geometries: a cylindrical and a conical nozzle. The main goal is to evaluate the influence of nozzle flow characteristics over the macroscopic spray with supporting experimental data employing state of the art experimental techniques that were not feasible in past studies comparable to this, due to technological limitations.
The manuscript is structured in 4 sections. First, the present introduction. Next the experimental methods, materials and setup, with an explanation of the test rig and, the optical hardware and technique utilized. Later, results and analyses are exposed. Finally the main conclusions of the paper are drawn.
2. Materials and Methods
2.1. Hardware
2.1.1. Injection Equipment and Test Rig
A common-rail injection system was utilized (Stumpp and Ricco, 1996). It is constituted by a high pressure pump and a conventional rail with an electronic pressure regulator, allowing fuel injections under high and constant rail pressure, up to 2300 bar. The injector body temperature was kept close to 343 K using a special injector holder designed to have coolant flowing at controlled temperature in direct contact with the injector body. The injector’s return line was pressurized to 6 bar as required for the injectors to work properly. The complete injection system is electronically controlled and all the settings are introduced digitally.
All experiments were performed using n-dodecane as surrogate fuel, which features similar carbon content and boiling characteristics to those of diesel fuels, so it is expected to mimic adequately their mixing behavior. This is one of the reasons why n-dodecane was also selected as the primary fuel of study for the main ECN campaign (Bardi et al., 2012), and it has been extensively characterized in the complete spectrum of experimental diagnostics and numerical performed by the group. It must be pointed out that n-dodecane is not expected to be an adequate surrogate for ignition-related behavior, because of its cetane number (approx. 88), nevertheless, this is out of the scope of this study.
The fuel was injected into a constant-volume chamber filled with nitrogen. The chamber is described in detail by Payri et al. (2004a) and Desantes et al. (2005). It is large enough so that back pressures and ambient temperatures remain constant during a series of injection events, and it is capable of a maximum back pressure of 80 bar.
2.1.2. Nozzles
All experiments were performed for two different nozzles, mounted onto two independent injector bodies. Table 1 summarizes the injectors utilized and their nominal nozzle geometries. The injectors are piezo-electric actuaded Bosch injectors. The nozzles are micro-SAC type single-hole nozzles, with different conicity but equal hydro-grinding (13.5% each) and nominal flow rate (124 cm3/min/100 bar each). Note that Table 1 includes a reference color column which indicates the color that will be used to refer to each nozzle in the results section.

Table 1. Injector hardware utilized and nominal nozzle geometries.
2.2. Isothermal Spray Visualization
Isothermal liquid spray visualization was selected to characterize the macroscopic spray, mainly because even though these conditions simplify a lot the real in-engine spray situation, cold-liquid spray experimental data is usually the first step toward validating spray models, and it is not hard to obtain. Also, the cold-liquid conditions suppress the effects of local temperature gradients on break-up and evaporation, which introduce uncertainty to the mixing response observed. Moreover, it is largely known that the liquid isothermal spray penetration is closely related to the vapor spray penetration (Naber and Siebers, 1996). It has been proven that if spray models predict correctly the vapor penetration, they also predict properly the fuel mixture fraction (Pickett et al., 2011b). These conclusions then confirm that isothermal liquid spray visualization is still a valuable technique to evaluate/calibrate baseline spray models and that the liquid spray formation should evidence the effects of nozzle flow characteristics if such is the case.
2.2.1. Optical Technique and Setup
The optical setup consists of a diffused back-illumination setup, as presented in Figure 1. The light emitted by the source is forced through a diffuser and a field lens before going into the chamber. In the camber, the light eventually travels through the liquid core, which features a refractive index much greater than that of the surrounding gas. This difference in refractive indexes deflects the light strongly, so that beams entering the liquid core are not captured by the camera which, in turn, renders dark spots in the image at those corresponding locations. The diffused back-illumination technique has been long utilized in the diesel spray research community for visualizing liquid sprays (Morgan et al., 2001; Payri et al., 2004a,b; Desantes et al., 2005, 2006). Nevertheless, the recent introduction of a high-speed pulsed light-emitting diode (LED) light source, capable of pulsing at the high frequencies of current state of the art high-speed cameras and very short pulse durations, have inevitably made this optical setup/technique the best choice for liquid spray visualization (Pickett et al., 2011a, 2013; Manin et al., 2012). Current high-speed camera capabilities in combination with a pulsed light source – with a controlled pulsed duration of 50 ns – produce images significantly sharper than any continuous light source or flash type light source option, reducing also the actual timing and spatial uncertainties of the spray image acquired.
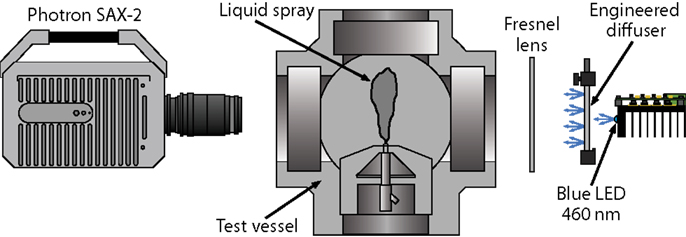
Figure 1. Scheme of the diffused back-illumination optical setup.
In all visualization experiments performed in this study, the acquisition frame rate was set to 160 kfps. The sampling rate was a high priority, but it was also desired to have a field of view (FOV) of at least 60 mm with an acceptable spatial resolution. The final setup features and image of 512 pix × 112 pix with a spatial resolution of 7.1 pix/mm. The shutter time duration was set to 2.5 μs, although this is not determinant since the effective image timing and exposure duration is given by the LED pulse. The effective LED pulse duration was set to 50 ns and the time-phase between the camera clock signal and the LED pulse was fixed at 500 ns, making sure that the complete LED pulse is captured during the camera exposure window.
2.2.2. Image Processing
Each image is processed with a systematic algorithm that permits the detection of the spray boundary and its associated properties. The background is calculated as an average of the first images before the start of injection (SOI). After the start of injection (ASOI), the background is subtracted from each frame and the result is then inverted so that the spray is bright. Finally, the spray contours are detected by binarizing the image as suggested by Siebers (1998), with a pre-selected threshold. The threshold was fixed to 12% of the dynamic range of the image. The procedures followed by the algorithm after the binarization are explained in detail by Payri et al. (2013a).
Note that in the particular case of this study, where no large or local temperature/density gradients are present, the background is practically constant during the complete injection event. This background, in combination with the short light pulse duration, leaves little incertitude on the actual spray boundary criteria in the images collected by the system. Hence, a relatively large threshold was preferred so to ensure that slight perturbations due to beam steering or small local temperature/density gradients in the vicinity of the spray were not picked up, and thus guarantee the quality of the boundary detected in all test conditions. Figure 2-top shows and example of a spray boundary detected by the algorithm plotted over the original image, where the dashed line indicates the actual spray axis. Figure 2-bottom presents the normalized intensity profile along the spray axis. The steep and sharp intensity drop at the spray tip is the result of combining a pulsed light source, with very short pulse duration, low temperatures and temperature gradients, and good optical quality of the acquisition setup.
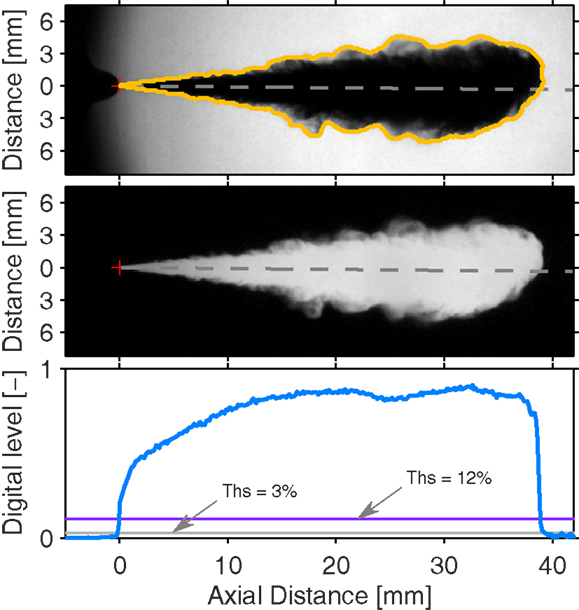
Figure 2. Original image with the spray boundary detected (top), actual image as processed (center) and normalized intensity profile along the spray axis (bottom). The image as processed (center) comes from the background subtraction and the inversion. The red cross indicates the nozzle outlet location. The particular frame shown is at 352 μs ASOI, the nozzle k0, injection pressure is Pinj = 1500 bar, and back pressure is Pb = 20 bar, which corresponds to an ambient density of 22.8 kg/m3.
It is then necessary to understand the spatial uncertainty in spray boundary detection due to the threshold criteria. Figure 2-bottom shows the actual intensity thresholds calculated in that particular image for 12% (purple dashed line) and 3% (light gray dash-dot line) of the dynamic range. The points at which these lines cross the intensity profile near the spray tip correspond to the spray boundary location detected for those threshold criteria. It is important to note that the 12% purple dashed line crosses the intensity profile near the point where the slope starts to decrease, as the curve starts to become tangent to zero. The objective is to maximize sensitivity by lowering the threshold, but at the same time, to set a value that that permits the robust detection of the first real physical trace of the liquid phase and not to pick up artificial signals. If the threshold is not set high enough, background camera sensor noise or beam steering – both which may affect the estimated intensity profile near the bottom-right area – could bias the spray boundary detection, rendering an over-estimated liquid spray penetration. Therefore, a compromise must be met, and evaluated for all test conditions, which resulted in the selection of 12% as a well suited value.
2.2.3. Spray Visualization Test Plan
The test plan is presented in Table 2, it consists of four injection pressures and three back pressures (thus, ambient densities), for each nozzle. The energizing time was fixed to 2500 μs in order to have an injection event long enough so to be able to study the stabilized spray. Note that high injection pressures (i.e., 1500 and 2000 bar) combined with low back pressures (i.e., 20 and 30 bar) are expected to produce conditions that choke the mass flow rate in the cylindrical nozzle k0 due to strong cavitating regimes (Payri et al., 2004a, 2008; Desantes et al., 2010). Still, this nozzle is expected to cavitate well before the mass flow rate choke conditions (Payri et al., 2013b).
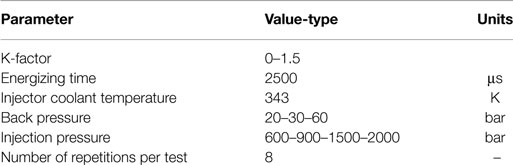
Table 2. Spray visualization test plan.
3. Results
3.1. Spray Tip Penetration
The spray tip penetration is one of the typical macroscopic characteristics studied in diesel sprays. Figure 3 depicts a subset of the complete result matrix obtained from the experiments. Note that the different test conditions are indicated by symbols in both the top and bottom parts of Figure 3. Each curve depicted in the figure is the result of the repetition average, following the same rolling-average algorithm described by Payri et al. (2013a), utilizing a window size of 56 μs. The algorithm is very similar to an Savitzky–Golay digital filter but accounting for multiple digital signals (the multiple test repetitions performed).
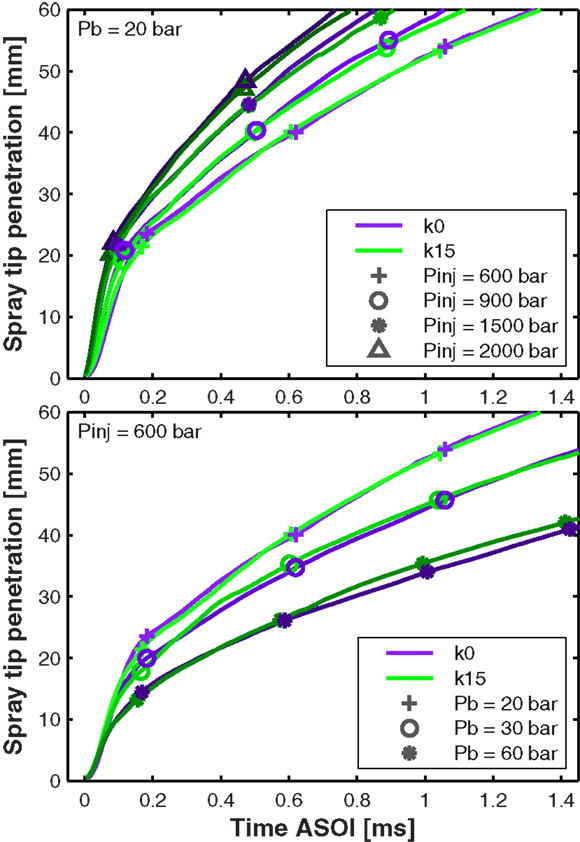
Figure 3. Spray tip penetration for different injection pressures at a back pressure of 20 bar (top) and different back pressures at an injection pressure of 600 bar (bottom). The three different back pressures result in ambient densities of 22.8, 33.0, and 66.3 kg/m3, respectively.
Thanks to the nozzle being a single-hole axial nozzle, the high acquisition rate employed in the experiments, and the short illumination pulse provided by the fast LED, the spray could be precisely detected in the very early stages of the penetration curve; in average, penetrations as low as 0.3 mm were detected. This permitted a good estimation of the SOI timing with respect to the trigger signal (start of energizing, SOE), by performing a linear fit to the raw data set found in the first 5 mm of the penetration curves of all repetitions, for a given set of test conditions. A good estimation of the actual SOI for each test condition facilitates the time-phasing of the penetration curves for comparison.
With the curves aligned in time, the top part of Figure 3 demonstrates how, for this type of injector and nozzle, the effect of the injection pressure is noticeable from the very beginning of the spray penetration curve. This can be observed not only for the instantaneous tip penetration rate but also for the instantaneous tip acceleration. On the other hand, the back pressure effect – in turn, ambient density – shown in the bottom part of Figure 3, has very little influence on the spray momentum at the nozzle outlet, and a much greater effect on the aerodynamic interaction between the spray and the ambient gas. This momentum exchange, however, becomes evident after the spray has penetrated deeper into the chamber and ambient gas is entrained. Hence, the curves representing the different back pressures start to spread later in the injection event.
Finally, it is important to point out that the results presented in Figure 3 do not show a strong influence of the nozzle geometry on the spray tip penetration. The small differences observed between the penetration curves produced by each nozzle are well within the shot-to-shot dispersion found for each test conditions, which is not presented to conserve the clarity of the figure. Still, if only the repetition-averaged behavior is considered, as shown in Figure 3, lines depicted in the top plot show slightly faster penetration rates for the cylindrical nozzle k0 at the top end of the penetration curve, which could be attributed to higher momentum flux at the outlet orifice due to its slightly larger diameter. With high injection pressures and low ambient densities, the spray – in terms of spray tip penetration – is mainly controlled by the momentum at the outlet orifice, and less so by the aerodynamic interaction between the liquid and the entrained gas. As injection pressure is decreased and ambient density is increased, as per Figure 3-bottom, there is a tendency for the cylindrical nozzle k0 to penetrate slower at the end of the penetration curve. These conditions give time for the aerodynamic interactions to develop, and turbulent velocity profiles in the outlet orifice become more important in the gas entrainment process, liquid break-up is enhanced and the smaller droplets exchange momentum more efficiently with the ambient gas. Note that similar results for different nozzles where obtained previously (Som et al., 2011; Montanaro et al., 2014). In both studies, authors perform numerical simulations of the liquid spray for cylindrical and conical nozzles, showing that the penetration curves start to diverge between the different nozzles after a certain time has passed and aerodynamic interaction has played its part, even though the effect of nozzle geometry is just introduced as boundary conditions at the orifice interface. Also, it is important to point out that (Montanaro et al., 2014) observed the same trend in their experimental results, presented in the same paper.
3.2. Near Field Spreading Angle
Although a strong influence of the nozzle geometry through the complete spectrum of test conditions studied is not evident in terms of macroscopic spray tip penetration, further analysis can be made to reach a better understanding of the effects of the nozzle geometry over the spray formation. For example, Figure 4 presents the near field spreading angle for two particular test repetitions. The angle reported is the angle included between two linear fits performed to the spray contour detected between 1.5 and 9 mm axially measured from the outlet orifice. Note that in this case, contrary to the spray tip penetration results presented in Figure 3, no repetition-average behavior is presented, but instead two random selected test repetitions are shown. This permits the evaluation of not just average trends but also time-resolved fluctuations that would be filtered when averaging all repetitions.
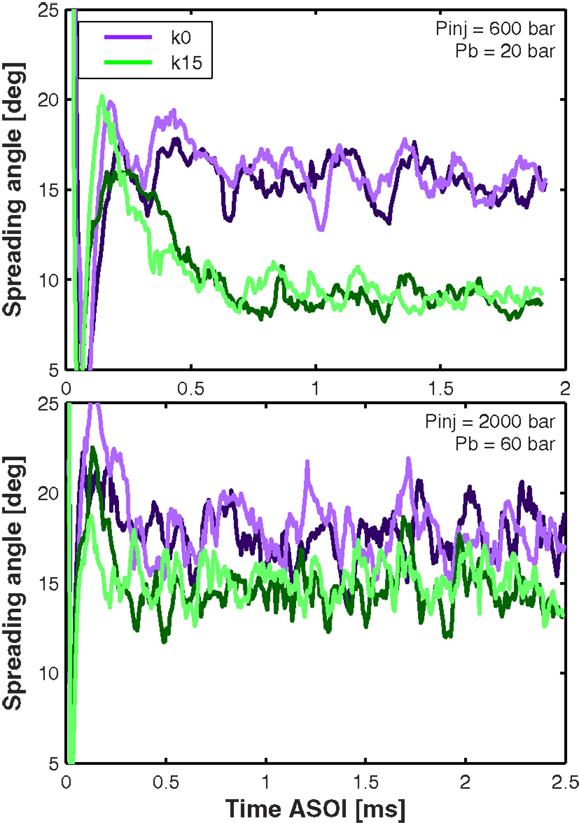
Figure 4. Near field spreading angle for two particular test repetitions at Pinj = 600 bar, Pb = 20 bar (top), and at Pinj = 1500 bar, Pb = 60 bar (bottom). For each test condition and nozzle, two different test repetitions are shown, distinguished by color shades of the base nozzle color.
Figure 4 shows a clear difference in the near field spreading angle behavior produced by the two nozzles. Note that, for both test conditions presented, each nozzle tends to produce steady near field spreading angles of different magnitudes. Note also that all signals fluctuate significantly, which is the result of the turbulent interaction between the liquid spray and the surrounding gas. The steady state behavior of these signals can be summarized in terms of time-averages of spreading angles, and the fluctuations can be quantified in terms of the SD. It is important to point out that the two linear fits, utilized to measure the angle reported, are not forced to go through the nozzle outlet. Although this is common practice when measuring large penetration-scaled angles (Payri et al., 2004a, 2012; Desantes et al., 2005), this approach attenuates local fluctuations, which are intended to show in this analysis.
In general, the cylindrical nozzle k0 features larger steady state near field spreading angles and spreading angle fluctuations throughout the complete test matrix. In particular, the top part of Figure 4 shows one of the scenarios where the difference is largest – 40.1% difference between the two nozzles for the steady angles and 45.7% for the fluctuations – while the bottom part of Figure 4 presents one of the cases where the difference is smallest – still, 16.8% for the steady angles and 17.7% for the fluctuations. Similar results have been reported previously. (Han et al., 2002) studied the effect of nozzle geometry over the microscopic spray development, showing that cylindrical nozzles produce larger fluctuations in spreading angle when compared to conical nozzles. Unfortunately, details on how the angle reported is measured and the repetition-average behavior are not given. (Blessing et al., 2003) also presented spreading angles of the microscopic spray, showing that cylindrical nozzles (and also, diverging nozzles) produce larger micro-spreading angles than conical nozzles, but the acquisition rate utilized for the study is not sufficient to properly detect or quantify fluctuations. On the other hand, (Payri et al., 2004a) presented penetration-scaled spreading angles showing also that cylindrical nozzles render larger spreading angles in comparison to conical nozzles. Interestingly, both studies also show an effect of the nozzle geometry over the macroscopic spray tip penetration, but since the penetration rates presented are very similar between the different nozzle, and the differences reported are very small, this trend may be strongly influenced by the correct detection of the SOI timing and the time-phasing of each penetration curve, which is more uncertain at the acquisition rates of 20 kHz utilized in both cases. A comparable result was also presented by Liu et al. (2010), in which two cylindrical nozzles – with and without hydro-grinding – are compared and their results show larger micro-spreading angles for the nozzle without hydro-grinding. Even though each one of these studies is different, with particular aims, nozzles, and optical techniques, one conclusion remains: turbululent velocity profiles, caused by geometrical features inside the nozzle, indeed affect the liquid spray in terms of dispersion, which includes spreading angle and fluctuations. Note that this is also backed by the numerical results published by Som et al. (2011), already discussed in section 1, where the cylindrical nozzle penetrates slower at the late part of the penetration curve, where turbulence has played a key role in momentum exchange.
Following the analysis of the time-averaged steady spreading angles, a wider scope analysis can be made if these time-averaged values are synthesized into one single figure. Figure 5 shows the time-averaged spreading angle values for the complete test matrix. The percentage differences reported previously correspond, then, to just two pairs of points within this figure. Note that, the effect of the nozzle geometry is stronger than the effect of a considerable increase in ambient density, which is well known to be a determinant parameter controlling spreading angle (Desantes et al., 2006; Payri et al., 2011a). The trends clearly show that the cylindrical nozzle k0 renders larger spreading angles throughout the test matrix, as affirmed before. In comparison to the conical nozzle k15, the nozzle k0 seems to responds differently to changes in back pressure: the angles are not completely scaled with back pressure but, for the two lower cases, the opposite. This could be attributed to the fact that, in these cases where the ambient densities are close, cavitation and radial velocity profiles caused by turbulence inside the nozzle play a more important role in the final spreading angle produced (Andriotis and Gavaises, 2009; Desantes et al., 2010; Payri et al., 2011b) than the actual density. On the other hand, the spreading angles produced by the conical nozzle k15 area properly scaled with back pressure (thus, ambient density). Finally, it must be noted that the injection pressure was not found to significantly influence the fixed-field spreading angle reported here, which has also been seen previously by other authors (Delacourt et al., 2005; Payri et al., 2011a; Mohan et al., 2014a,b). Still, it must be pointed out that in cases, such as these, detailed time-resolved numerical simulations of this problematic would surely help to better understand the observed trends, especially when comparing the response of each nozzle to the different pressure differentials.
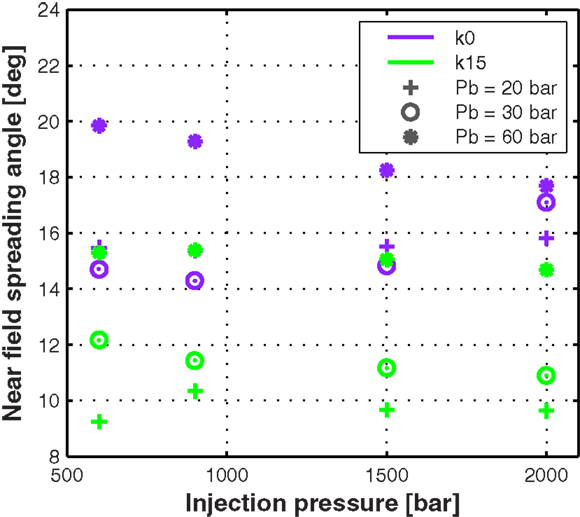
Figure 5. Near field steady spreading angle values for the complete test matrix. The values reported are calculated by averaging the raw data from all test repetitions from 0.8 ms to the end of the signals.
The same kind of analysis can be made for the dispersion of the signals from which the time-averaged steady state values presented in Figure 5 are obtained, as depicted in Figure 6. These points are, therefore, measurements of the fluctuations of the near field spreading angle at each test condition and nozzle. The results show that the cylindrical nozzle k0 presents higher fluctuations throughout the test matrix around the mean spreading angle values. However, its response along the test matrix – both for injection and back pressures – is not entirely clear from the results. For this nozzle, the highest back pressure or ambient density case renders the largest fluctuations, but the other two cases present several different behaviors depending on the test condition. To this end, it must be pointed out that since these sprays are strongly turbulent, this kind of signals are seldom self similar and, therefore, the SD measurements may need longer signal lengths than those utilized here, to better show the trends for the cavitating nozzle. The behavior of the conical nozzle k15 seems to be more consistent along the injection and back pressure spectrum: fluctuations do not seem to be strongly affected by injection pressure, while increasing back pressure – mainly, chamber density – indeed increases the fluctuations. This is an interesting result because it suggests that, even though the injection pressure increases velocities at the outlet orifice – and thus, the Reynolds number – it seems not to end up playing a key role in the spray angle magnitude and fluctuations. This is one of the many cases where detailed nozzle-spray numerical simulations can provide valuable information on the driving mechanisms.
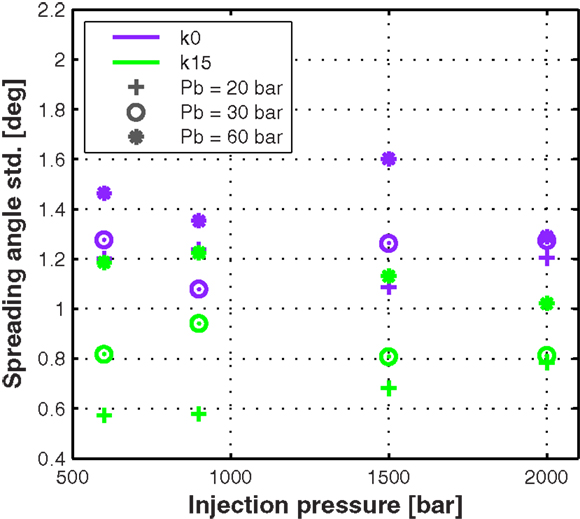
Figure 6. Near field steady spreading angle SD values for the two nozzles through the complete test matrix. The values reported are the SD of the means calculated by averaging the raw data from all test repetitions from 0.8 ms to the end of the signals.
3.3. Further Analysis on the Spray Fluctuations
Qualitatively, the spray images show these fluctuations. For a given set of test conditions, the spray produced by the cylindrical nozzle k0 seems more irregular and turbulent structures are more noticeable and of larger scale. To put this into metrics, spray contour fluctuation maps were constructed. The map – shown in Figure 7 for the two nozzles – is calculated as the SD between all binary images of the detected sprays (Payri et al., 2013a) from a given test. This is done past 0.8 ms ASOI to guarantee that the spray is in steady state. Therefore, a black pixel corresponds to non-fluctuating regions: the spray never occupies that pixel or the pixel is always considered to be within the spray for the time window taken. On the other hand, the brighter the pixel the more likely it is for fluctuations to occur at that region and, as expected, this happens near the spray boundary.
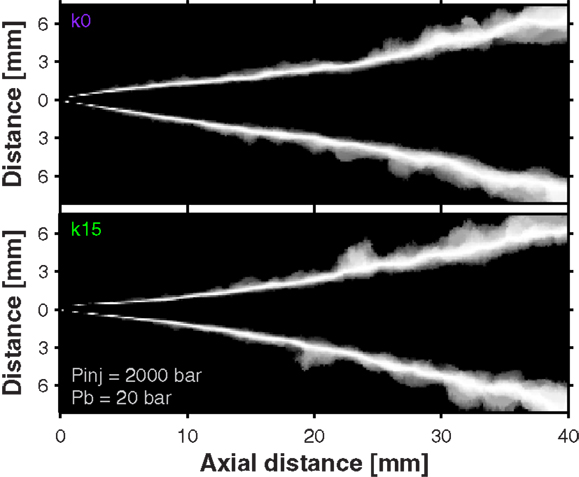
Figure 7. Spray contour fluctuation maps comparing the response of each nozzle to a given set of test conditions.
Figure 7 shows quite a lot of information. First and most easily noticeable, are the different shapes of the sprays produced by each nozzle. The cylindrical nozzle k0 (Figure 7-top) produces a spray that spreads quickly after the fuel has just exited the nozzle, while the spray produced by the conical nozzle k15 (Figure 7-bottom) spreads progressively but at a lower rate. This is directly related to the higher turbulence levels and radial velocity profiles within the nozzle, caused by the cylindrical nozzle geometry, as (Koo et al., 1997) demonstrate in their fundamental study. In terms of spray width, nozzle k0 produces a spray that is, in average, wider up to approximately 15 mm, point after which both sprays start to converge to similar widths. The spray width profile along the axial direction for cavitating nozzles was discussed by Payri et al. (2011b), while the shape of sprays that spread progressively has recently been analyzed by Pickett et al. (2013) (note that in this study, the nozzle features a K-Fator of 1.5). These studies, along with the results presented here, provide evidence to the fact that nozzle geometry indeed plays a key role not only in the near field spray formation but also in the macroscopic spray. The nozzle geometry influences the behavior of the steady spray in the first millimeters which, in turn, affect the strength of the aerodynamic interactions and momentum exchange downstream.
Moreover, the fluctuation maps presented in Figure 7 also give insight to the spray boundary fluctuations, which are also function of turbulence, velocity profiles within the nozzle (Koo et al., 1997), and the aerodynamic interaction between the spray and the ambient gas. It is important to note that, even though spreading angle fluctuations (Figure 6) may, at first, seem to be a similar metric to what the fluctuation maps show, they are somewhat independent: it is possible to have a spray with a very diffuse fluctuation map and, at the same time, a spreading angle with negligible SD – i.e., the contour fluctuating over parallels. In average, up to 15 mm, the cylindrical nozzle k0 seems to produce a more diffuse fluctuation map in comparison to the conical nozzle k15, which means that its line-of-sight liquid phase spray boundary fluctuates more. As stated earlier, this could be qualitatively observed in the raw images. Downstream, where the aerodynamic interactions have had time to shape the sprays, the fluctuations are larger and the difference between nozzles, in terms of boundary fluctuations, is diminished. The information given by these maps may imply that the differences in spray tip penetration observed in the later part of the penetration curve [and also observed by Som et al. (2011) and Montanaro et al. (2014)] are originated in the near-nozzle region part of the steady spray – where the spray produced by the cylindrical nozzle exchanges momentum with the ambient gas at a higher rate – but are evidenced later downstream, where the difference in the remaining spray momentum is appreciable.
Still, observing these two-dimensional maps directly is difficult if there is interest in comparing the two nozzles quantitatively. Therefore, an overall metric that includes the fluctuation area and strength is calculated, as the integral of these maps in the area contained between 1.5 and 9 mm axially measured from the outlet orifice. This will be referred to as “fluctuation power,” since it comprises both fluctuation area and strength, and it is presented in Figure 8 for the complete test matrix. Again, it can be quickly noted that the nozzle geometry is the most important parameter determining the fluctuation power, followed by the back pressure/ambient density which, for some select cases, can match the effect of nozzle geometry. The effect of the injection pressure seems negligible for the range of values obtained and certainly not clear from the trends shown. Interestingly, the same trend was found for the spreading angle values and fluctuations and, as stated in Section 2, detailed time-resolved numerical simulations of these experiments would give more insight to the physics behind these trends.
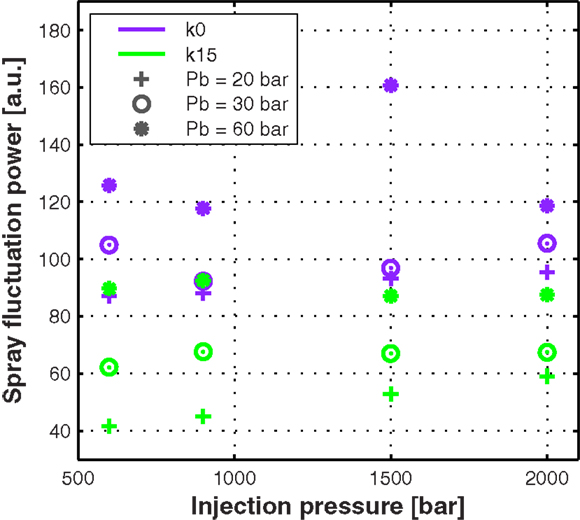
Figure 8. Spray fluctuation power for the two nozzles through the complete test matrix.
4. Conclusion
In the present work, the effects of nozzle geometry and flow characteristics over the macroscopic spray development where studied. The experimental campaign consisted in a high-speed visualization of the isothermal liquid spray using state of the art fast imaging techniques. All experiments were performed for two different nozzle geometries. From the results, a main list of conclusions can be drawn:
The implementation of a high-speed pulsed light-emitting diode (LED) light source, capable of pulsing at the high frequencies of current state of the art high-speed cameras and very short pulse durations of 50 ns enhanced considerably the quality of the images: the spray is frozen and there is very little uncertainty on the actual spray boundary. Due to the fast acquisition rate and the short effective illumination times, it was possible to detect the spray as early as 0.3 mm and have good data in the first millimeters. This allowed for a good estimation of the actual SOI timing and the correct time-phasing of the penetration curves.
For the nozzles tested, the nozzle geometry was not found to be strongly determinant to spray development in terms of macroscopic spray tip penetration. This is particularly true for high spray momentum conditions where the sprays reach the visualization limit with still quite high momentum, so the possible difference in momentum due to in-nozzle flow characteristics is difficult to observe. In some of these high-momentum conditions, even a faster penetration of the cylindrical nozzle k0 was observed, which could be linked to this nozzle featuring higher momentum flux at the outlet orifice due to its slightly larger diameter. When injection pressure is decreased and ambient density is increased, the momentum exchange process has more time to take place as the spray crosses the visualization window, and the penetration rates between nozzles start to diverge. In these cases, the conical nozzle k15 penetrates faster due to the higher turbulence and larger radial velocity profiles produced within the cylindrical nozzle k0, which enhance liquid break-up and momentum exchange.
Spreading angle results were presented, both in time-resolved and a time-averaged formats. The angles were measured between 1.5 and 9 mm axially from the outlet orifice. The cylindrical nozzle k0 was found to produce larger spreading angle values and fluctuations in comparison to the conical nozzle k15.
Spray boundary fluctuation maps where constructed from the binary images of the detected sprays. These maps give valuable information in both the spray shape produced by each nozzle and the spray boundary fluctuations produced by turbulence. An integral of this map was calculated between 1.5 and 9 mm axially from the outlet orifice and the corresponding fluctuation power values were presented. Again, the cylindrical nozzle k0 featured higher spray boundary fluctuation power in comparison to the conical nozzle k15. Downstream, the difference between nozzles – in terms of spray boundary fluctuations – is reduced.
In conclusion, results from this study indicate that the nozzle geometry indeed plays a key role in the overall spray formation, in terms of typical metrics and spray dispersion or fluctuations. The effects of the flow characteristics within the nozzle are carried on to the first millimeters of the spray, in which the rest of the spray formation downstream is pre-defined. To better understand these mechanisms, the propagation of turbulent structures from the nozzle to the spray, and to have a wider scope of all the effects that nozzle geometry may potentially have over spray formation, detailed time-resolved numerical simulations of these problems could be of unmatched value. The authors will also evaluate the response of other fuels to these test conditions and nozzles, to further assess the effect of nozzle geometry over the macroscopic spray formation.
Conflict of Interest Statement
The authors declare that the research was conducted in the absence of any commercial or financial relationships that could be construed as a potential conflict of interest.
Acknowledgments
This work was sponsored by Ministerio de Economía y Competitividad of the Spanish Government in the frame of the Project “Comprensión de la influencia de combustibles no convencionales en el proceso de inyección y combustión tipo diesel,” Reference TRA2012-36932. Additionally, the optical equipment used for the project was purchased with funding from Ministerio de Economía y Competitividad FEDER-ICTS-2012-06. The authors would finally like to thank José Enrique Del Rey and María del Carmen Tomás for their collaboration in the setup of the experiments and laboratory work.
References
Andriotis, A., and Gavaises, M. (2009). Influence of vortex flow and cavitation on near-nozzle diesel spray dispersion angle. Atomization Sprays 19, 247–261. doi: 10.1615/AtomizSpr.v19.i3.30
Arcoumanis, C., and Gavaises, M. (1998). Linking nozzle flow with spray characteristics in a diesel fuel injection system. Atomization Sprays 8, 307–347. doi:10.1615/AtomizSpr.v8.i3.50
Badock, C., Wirth, R., and Tropea, C. (1999). The influence of hydro grinding on cavitation inside a diesel injection nozzle and primary break-up under unsteady pressure conditions. Proc. 15th ILASS-Europe 99, 5–7.
Bardi, M., Payri, R., Malbec, L. M., Bruneaux, G., Pickett, L. M., Manin, J., et al. (2012). Engine Combustion Network: comparison of spray development, vaporization, and combustion in different combustion vessels. Atomization Sprays 22, 807–842. doi:10.1615/AtomizSpr.2013005837
Battistoni, M., Grimaldi, C., and Mariani, F. (2012). Coupled Simulation of Nozzle Flow and Spray Formation Using Diesel and Biodiesel for CI Engine Applications. SAE Technical Paper, 2012-01-1267.
Battistoni, M., Xue, Q., Som, S., and Pomraning, E. (2014). Effect of off-axis needle motion on internal nozzle and near exit flow in a multi-hole diesel injector. SAE Int J Fuels Lubr 7, 167–182. doi:10.4271/2014-01-1426
Blessing, M., Knig, G., Krger, C., Michels, U., and Schwarz, V. (2003). Analysis of Flow and Cavitation Phenomena in Diesel Injection Nozzles and its Effects on Spray and Mixture Formation. SAE Technical Paper, 2003-01-1358.
Delacourt, E., Desmet, B., and Besson, B. (2005). Characterisation of very high pressure diesel sprays using digital imaging techniques. Fuel 84, 859–867. doi:10.1016/j.fuel.2004.12.003
Desantes, J., Payri, R., Salvador, F., and Gil, A. (2006). Development and validation of a theoretical model for diesel spray penetration. Fuel 85, 910–917. doi:10.1016/j.fuel.2005.10.023
Desantes, J., Payri, R., Salvador, F., and la Morena, J. D. (2010). Influence of cavitation phenomenon on primary break-up and spray behavior at stationary conditions. Fuel 89, 3033–3041. doi:10.1016/j.fuel.2010.06.004
Desantes, J. M., Payri, R., Gimeno, J., and Aldaravi, P. M. (2014). Simulation of the First Millimeters of the Diesel Spray by an Eulerian Spray Atomization Model Applied on ECN Spray A Injector. SAE Technical Paper, 2014-01-1418.
Desantes, J. M., Payri, R., Salvador, F. J., and Soare, V. (2005). Study of the Influence of Geometrical and Injection Parameters on Diesel Sprays Characteristics in Isothermal Conditions. SAE Technical Paper, 2005-01-0913.
Ganippa, L. C., Andersson, S., Chomiak, J., and Matsson, A. (2003). Combustion characteristics of diesel sprays from equivalent nozzles with sharp and rounded inlet geometries. Combust Sci Technol 175, 1015–1032. doi:10.1080/00102200302350
Han, J.-S., Lu, P.-H., Xie, X.-B., Lai, M.-C., and Henein, N. A. (2002). Investigation of Diesel Spray Primary Break-Up and Development for Different Nozzle Geometries. SAE Technical Paper, 2002-01-2775.
Koo, J. Y., Hong, S. T., Shakal, J. S., and Goto, S. (1997). Influence of Fuel Injector Nozzle Geometry on Internal and External Flow Characteristics. SAE Technical Paper, 970354.
Liu, Z., Im, K.-S., Wang, Y., Fezzaa, K., Xie, X.-B., Lai, M.-C., et al. (2010). Near-Nozzle Structure of Diesel Sprays Affected by Internal Geometry of Injector Nozzle: Visualized by Single-Shot X-Ray Imaging. SAE Technical Paper, 2010-01-0877.
Ma, G., Tauzia, X., and Maiboom, A. (2014). One-dimensional combustion model with detailed chemistry for transient diesel sprays. Proceedings of the Institution of Mechanical Engineers Part D-Journal of Automobile Engineering 228, 457–476.
Magno, A., Mancaruso, E., and Vaglieco, B. M. (2014). Experimental investigation in an optically accessible diesel engine of a fouled piezoelectric injector. Energy 64, 842–852. doi:10.1016/j.energy.2013.10.071
Manin, J., Bardi, M., and Pickett, L. (2012). “Evaluation of the liquid length via diffused back-illumination imaging in vaporizing diesel sprays,” in The Eighth International Conference for Modeling and Diagnostics for Advanced Engine Systems (COMODIA 2012). Fukuoka.
Mohan, B., Yang, W., Tay, K. L., and Yu, W. (2014a). Experimental study of spray characteristics of biodiesel derived from waste cooking oil. Energy Convers. Manag. 88, 622–632. doi:10.1016/j.enconman.2014.09.013
Mohan, B., Yang, W., Tay, K. L., and Yu, W. (2014b). Macroscopic spray characterization under high ambient density conditions. Exp Therm Fluid Sci 59, 109–117. doi:10.1016/j.expthermflusci.2014.08.003
Montanaro, A., Migliacco, M., Allocca, L., Friaoli, V., Lee, S.-Y., Zhang, A., et al. (2014). Schlieren and Mie Scattering Visualization for Single Hole Diesel Injector Under Vaporizing Conditions with Numerical Validation. SAE Technical Paper, 2014-01-1406.
Morgan, R., Wray, J., Kennaird, D. A., Crua, C., and Heikal, M. R. (2001). The Influence of Injector Parameters on the Formation and Break-Up of a Diesel Spray. SAE Technical Paper 2001-01-0529.
Naber, J. D., and Siebers, D. L. (1996). Effects of Gas Density and Vaporization on Penetration and Dispersion of Diesel Sprays. SAE Technical Paper, 960034.
Ning, W., Reitz, R. D., Diwakar, R., and Lippert, A. M. (2008). A Numerical Investigation of Nozzle Geometry and Injection Condition Effects on Diesel Fuel Injector Flow Physics. SAE Technical Paper, 2008-01-0936.
Payri, F., Bermúdez, V., Payri, R., and Salvador, F. (2004a). The influence of cavitation on the internal flow and the spray characteristics in diesel injection nozzles. Fuel 83, 419–431. doi:10.1016/j.fuel.2003.09.010
Payri, R., Molina, S., Salvador, F., and Gimeno, J. (2004b). A study of the relation between nozzle geometry, internal flow and sprays characteristics in diesel fuel injection systems. KSME Int J 18, 1222–1235. doi:10.1007/BF02983297
Payri, R., Gimeno, J., and Viera, J. P. (2012). “Effect of partial needle lift on the hydraulic and evaporative performance characteristics of a common rail diesel fuel injector,” in THIESEL 2012 Conference on Thermo-And Fluid Dynamic Processes in Direct Injection Engines. Valencia.
Payri, R., Gimeno, J., Viera, J. P., and Plazas, A. H. (2013a). Needle lift profile influence on the vapor phase penetration for a prototype diesel direct acting piezoelectric injector. Fuel 113, 257–265. doi:10.1016/j.fuel.2013.05.057
Payri, R., Salvador, F., Gimeno, J., and Venegas, O. (2013b). Study of cavitation phenomenon using different fuels in a transparent nozzle by hydraulic characterization and visualization. Exp Therm Fluid Sci 44, 235–244. doi:10.1016/j.expthermflusci.2012.06.013
Payri, R., Salvador, F., Gimeno, J., and Novella, R. (2011a). Flow regime effects on non-cavitating injection nozzles over spray behavior. Int. J. Heat Fluid Flow 32, 273–284. doi:10.1016/j.ijheatfluidflow.2010.10.001
Payri, R., Salvador, J., Gimeno, J., and la Morena, J. D. (2011b). Analysis of diesel spray atomization by means of a near-nozzle field visualization technique. Atomization Sprays 21, 753–774. doi:10.1615/AtomizSpr.2012004051
Payri, R., Salvador, F., Gimeno, J., and Zapata, L. (2008). Diesel nozzle geometry influence on spray liquid-phase fuel penetration in evaporative conditions. Fuel 87, 1165–1176. doi:10.1016/j.fuel.2007.05.058
Pickett, L. M., Genzale, C. L., Manin, J., Malbec, L., and Hermant, L. (2011a). Measurement uncertainty of liquid penetration in evaporating diesel sprays. ILASS2011-111.
Pickett, L. M., Manin, J., Genzale, C. L., Siebers, D. L., Musculus, M. P. B., and Idicheria, C. A. (2011b). Relationship between diesel fuel spray vapor penetration/dispersion and local fuel mixture fraction. SAE Int J Engines 4, 764–799. doi:10.4271/2011-01-0686
Pickett, L. M., Manin, J., Payri, R., Bardi, M., and Gimeno, J. (2013). Transient Rate of Injection Effects on Spray Development. SAE Technical Paper, 2013-24-0001.
Qin, J.-R., Dan, T., Lai, M.-C., Savonen, C., Schwartz, E., and Brkyzik, W. (1999). Correlating the Diesel Spray Behavior to Nozzle Design. SAE Technical Paper, 1999-01-3555.
Salvador, F. J., Gimeno, J., Pastor, J. M., and Mart- Aldarav, P. (2014). Effect of turbulence model and inlet boundary condition on the diesel spray behavior simulated by an Eulerian spray atomization (ESA) model. Int J Multiphase Flow 65, 108–116. doi:10.1016/j.ijmultiphaseflow.2014.06.003
Som, S., and Aggarwal, S. (2010). Effects of primary breakup modeling on spray and combustion characteristics of compression ignition engines. Combust Flame 157, 1179–1193. doi:10.1016/j.combustflame.2010.02.018
Som, S., and Aggarwal, S. K. (2009). “Modeling diesel spray flame lift-off using detailed chemistry and a new primary breakup model,” in 47th AIAA Aerospace Sciences Meeting Including the New Horizons Forum and Aerospace Exposition, Orlando, Florida, 5–8 January.
Som, S., Ramirez, A., Aggarwal, S., Kastengren, A., El-Hannouny, E., Longman, D., et al. (2009). Development and Validation of a Primary Breakup Model for Diesel Engine Applications. SAE Technical Paper, 2009-01-0838.
Som, S., Ramirez, A. I., Longman, D. E., and Aggarwal, S. K. (2011). Effect of nozzle orifice geometry on spray, combustion, and emission characteristics under diesel engine conditions. Fuel 90, 1267–1276. doi:10.1016/j.fuel.2010.10.048
Stumpp, G., and Ricco, M. (1996). Common Rail – An Attractive Fuel Injection System for Passenger Car DI Diesel Engines. SAE Technical Paper, 960870.
Suh, H. K., and Lee, C. S. (2008). Effect of cavitation in nozzle orifice on the diesel fuel atomization characteristics. Int. J. Heat Fluid Flow 29, 1001–1009. doi:10.1016/j.ijheatfluidflow.2008.03.014
Xue, Q., Battistoni, M., Powell, C., Longman, D., Quan, S., Pomraning, E., et al. (2015). An Eulerian CFD model and X-ray radiography for coupled nozzle flow and spray in internal combustion engines. Int J Multiphase Flow 70, 77–88. doi:10.1016/j.ijmultiphaseflow.2014.11.012
Keywords: diesel, spray, nozzle, mixing, injection
Citation: Payri R, Salvador FJ, Gimeno J and Viera JP (2015) Experimental analysis on the influence of nozzle geometry over the dispersion of liquid n-dodecane sprays. Front. Mech. Eng. 1:13. doi: 10.3389/fmech.2015.00013
Received: 19 August 2015; Accepted: 28 September 2015;
Published: 12 October 2015
Edited by:
Ming Jia, Dalian University of Technology, ChinaCopyright: © 2015 Payri, Salvador, Gimeno and Viera. This is an open-access article distributed under the terms of the Creative Commons Attribution License (CC BY). The use, distribution or reproduction in other forums is permitted, provided the original author(s) or licensor are credited and that the original publication in this journal is cited, in accordance with accepted academic practice. No use, distribution or reproduction is permitted which does not comply with these terms.
*Correspondence: Raul Payri, cnBheXJpQG1vdC51cHYuZXM=