 Mayura Halbe1
 Brad Pietrzak2
 David Fain2
 Aswin Ramesh2
 Greg Shaver2*
 James E. McCarthy Jr.3Mike Ruth1Edward Koeberlein1
- 1Cummins Inc., Columbus, IN, USA
- 2Purdue University, West Lafayette, IN, USA
- 3Eaton, Marshall, MI, USA
Cylinder deactivation (CDA) is a technology that can improve the fuel economy and exhaust thermal management of compression ignition engines (diesel and natural gas), especially at low loads and engine idling conditions. The reduction in engine displacement during CDA improves fuel efficiency at low loads primarily through a reduction in pumping work. During deactivation of a given cylinder, the drop in pressure inside the cylinder could possibly lead to the transport of oil from the crankcase into the cylinder owing to the reduced pressure difference between the crankcase and the cylinder. In addition, CDA might inhibit the first fire readiness of a reactivating cylinder as a result of reduced wall, head, and piston temperatures. Both of these potential issues are quantitatively studied in this article. This article describes a strategy to estimate in-cylinder oil accumulation during CDA, and first fire readiness following CDA, through comparison of individual heat release profiles before and after CDA. Cylinder cool-down and oil accumulation during deactivation could possibly result in misfire or degraded combustion upon an attempt to reactivate a given cylinder. Fortunately, experiments described in this article demonstrate no cases of misfire at any speed/load conditions for the CDA durations tested, specifically 100 ft-lb load at 800 rpm and 1,200 rpm with deactivation intervals of 0.5, 5, 10, and 20 min. Although pilot heat release in the reactivated cylinders was delayed by approximately 1 CAD after 5 min of CDA, the main heat release was very similar to the heat release of a continuously activated cylinder. As such, results show no first fire readiness issues at the conditions tested. The duration of time the engine could be operated in CDA mode without significant oil accumulation and other methods to minimize oil accumulation during CDA have also been proposed.
1. Introduction
Strategies to improve engine performance and efficiency include advanced combustion techniques and variable valve actuation. The experimental apparatus used for this study incorporates a fully flexible variable valve actuation (VVA) system mounted on a modern diesel engine. The VVA system enables cylinder-independent, cycle-by-cycle control of the engine valve events including opening timing, closing timing, and lift for the intake and exhaust valves for all six cylinders. This effort utilizes the VVA to achieve and study cylinder deactivation (CDA).
Cylinder deactivation (CDA) involves the deactivation of the valve motions and fuel injection for 1, 2, or more cylinders in the engine (McCarthy, 2016). CDA reduces the amount of air inducted into the engine, reducing the pumping losses and thereby improving fuel efficiency at low loads. CDA is also useful for exhaust aftertreatment thermal management via reduced air/fuel ratios (Ding, 2014). However, since there is no combustion to maintain elevated pressures in a deactivated cylinder during the deactivation period, lubricating oil from the crankcase can enter the combustion chamber (Ma, 2010). The oil includes sulfur that will damage aftertreatment components. In addition, the oil accumulation and cylinder cooling could possibly lead to misfire or degraded combustion upon reactivation.
CDA is a promising technology for improved diesel engine fuel economy and exhaust thermal management (Leone and Pozar, 2001; Magee, 2013). Mo et al. (2014) studied the effect of CDA on engine performance through the simulation of a six-cylinder, 7.3-L turbocharged diesel engine and showed the brake-specific fuel consumption by 0–17.25% when the MEP was below 3.5 bar at 1,700 and 900 rpm. In addition, fuel efficiency increases of up to 26.8% were obtained at idle.
Benefits of CDA for exhaust thermal management have also been shown by Ding (2014) and Ding et al. (2015a,b) using experimental results on a six-cylinder Cummins engine utilizing a VVA. CDA was found particularly useful for cold start and extended idle operation, when the exhaust aftertreatment including the SCR and DOC have not reached the desired light-off temperatures. For example, CDA was shown capable of increasing exhaust temperatures from 190 to 310°C at a loaded idle condition by reducing the air flow through the engine, without additional fuel penalty.
Prior research efforts as discussed above indicate the potential merit of CDA for fuel economy and exhaust thermal management especially at low loads. However, the issue of in-cylinder oil accumulation during CDA needs to be understood.
Ma (2010) identified that the primary reason for oil accumulation in a deactivated cylinder is leakage through the top ring gap and ring groove as a result of the lower cylinder gas pressure. Strategies for reducing the ring/groove clearances and sizes of the ring gaps and designing the structure of the piston-lands to enhance downward oil flow have been discussed in the study by Ma (2010).
Yilmaz et al. (2004) identified several sources of oil consumption by using laser-induced fluorescence (LIF). Major sources of oil consumption included entrainment in blow-by gas, evaporation due to differences in volatility, as well as transport through the valve guides, with reverse gas flow, and along the pistons. Yilmaz et al. concluded that at loads less than 50% of the maximum, oil consumption is mainly due to oil transport past the piston rings and increased as load increased.
Ariga (1996) stressed the importance of developing oil reduction strategies specifically pointing out that the current levels of oil-derived particulate emissions in a heavy duty diesel engine is approximately 0.02 g/bhp-hr under the US FTP transient emissions test procedure. This is 25% of the 0.1 g/bhp-hr particulate standard. It is expected in the near future that the particulate standard will be further reduced. In such a case, controlling oil-derived particulates will be imperative.
This article describes a strategy to estimate oil accumulation during CDA and first fire readiness upon reactivation of the cylinders in section 3. The article also provides detailed results of experiments carried out by the authors to calculate the amount of oil accumulated inside the combustion chamber of a deactivated cylinder for two different engine speeds in section 5. First fire readiness upon cylinder reactivation is also described. Three out of six cylinders of the engine were deactivated for a variety of time durations—specifically, 0.5, 5, 10, and 20 minutes.
2. Experimental Testbed
The experimental testbed used in this study is built around a 6-cylinder Cummins diesel engine with a common rail injection system, variable geometry turbine (VGT), an air-to-water charge air cooler, and high-pressure EGR. A schematic of the engine architecture is shown in Figure 1A. Kistler 6067C in-cylinder pressure transducers are used along with an AVL 621 IndiCom high-speed data acquisition system, which records cycle-by-cycle in-cylinder pressure data for each cylinder and calculates the apparent heat release rate for each cycle for the respective cylinder. The engine lubricating oil used in this engine is Valvoline 15W-40 oil for heavy duty diesel engines.
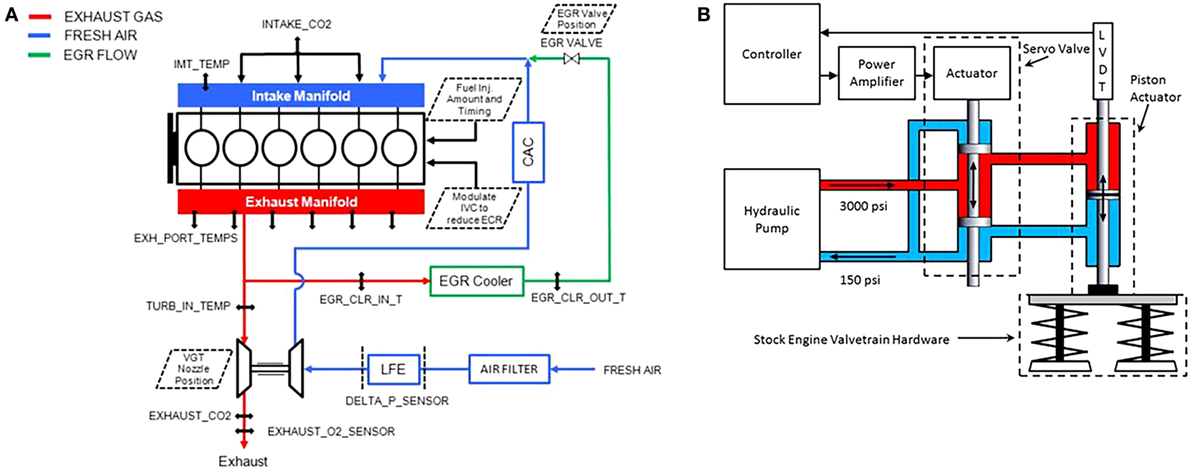
Figure 1. (A) Schematic of engine testbed. (B) Schematic of fully flexible electrohydraulic variable valve actuator.
A unique feature of this testbed is that it is outfitted with a fully flexible electrohydraulic variable valve actuation (VVA) system. Figure 1B is a schematic of the VVA system. The VVA system allows cycle-to-cycle, cylinder-independent control of valve events, including opening timing, closing timing, and valve lift for all 12 intake and exhaust valve pairs. Valve motions are deactivated in a coordinated manner with fueling to enable CDA.
The next section presents a detailed analysis of in-cylinder oil accumulation and first fire readiness characteristics of cylinder deactivation (CDA). Results of experiments conducted by the authors to measure oil accumulated in the combustion chamber of deactivated cylinders are discussed. Analysis of first fire readiness based on heat release profiles of reactivated cylinders is also presented. The section concludes by comparing the calculated oil mass values at two different engine speeds and showing the relation between CDA duration and accumulated oil mass. No first fire readiness issues were observed for any of the cylinders at the two operating conditions considered, 800 rpm 100 ft-lb and 1,200 rpm 100 ft-lb, following up to 20 minutes of deactivation.
3. In-Cylinder Oil Accumulation Characteristics of CDA
Engine lubricating oil from the crankcase is expected to enter the combustion chamber of a deactivated cylinder as a result of reduced in-cylinder pressure during the deactivation period. Previously, the authors have explored methods of oil accumulation during CDA through measurement of hydrocarbon emissions using a Cambustion Hydrocarbon Analyzer in the existing experimental testbed. This method required the oil to be in vapor phase. However, operating the sample line of the analyzer at temperatures high enough to vaporize oil was not possible without damaging the analyzer. As such, a new method was developed in which cycle-by-cycle heat release data were recorded for each cylinder during the transition from CDA to normal six-cylinder operation mode. These heat release profiles were used to estimate oil accumulated in the deactivated cylinders and also to check whether the reactivated cylinders fire as desired.
3.1. Methodology for Measuring Oil Accumulation
The strategy developed to estimate oil accumulation during CDA is outlined below:
1. Operate the engine in CDA mode for N cycles at the desired engine speed and load.
2. Exit from CDA mode by inducting fresh charge and fire the reactivated cylinder as per the firing order of the engine.
3. Combust a known amount of air/fuel mixture added to the reactivated cylinder as well as the accumulated oil during the period of cylinder deactivation. It is assumed that any deviation in the heat release of a reactivated cylinder compared to the heat release of the same cylinder when it is actively firing is solely due to the combustion of oil accumulated during CDA.
4. Estimate the oil mass accumulated in the cylinder over N cycles of deactivation.
3.2. Important Considerations in the Development of an Algorithm for Transition from CDA to Six-Cylinder Mode
Control algorithms for the VVA and fuel injection systems were developed specifically to study oil accumulation and first fire readiness issues of CDA. Important characteristics of the algorithm developed for transition from CDA mode to six-cylinder mode are discussed below.
3.2.1. Sequence of Valve Events during Cylinder Reactivation
Transition from CDA mode to six-cylinder firing mode can be executed using different techniques of valve events (Ding, 2014; Ding et al., 2015a,b). Opening the exhaust valve first during transition to six-cylinder mode would let the accumulated in-cylinder oil escape into the exhaust stream. Since the objective of experiments described in this article is to estimate in-cylinder oil accumulation during CDA using heat release-based analysis, the sequence of valve events during transition from CDA to six-cylinder mode was chosen such that the combustion of the possible oil accumulated during CDA could be captured. The sequence of events during transition from CDA to six-cylinder mode during the experiment is as below:
– intake valve lift,
– fuel injection, and then
– exhaust valve lift.
This sequence of valve events results in the combustion of a known amount of air/fuel mixture added to the reactivated cylinder as well as the accumulated oil during the period of cylinder deactivation. Consequently, any deviation in the heat release of a reactivated cylinder compared to the heat release of the same cylinder when it is actively firing can be analyzed, and the oil accumulated during CDA can be estimated.
Figure 2 shows an example of the sequence of valve and fuel injection events during transition from CDA to six-cylinder mode. Cylinders 1, 2, and 3 were deactivated for 20 min at 800 rpm, 100 ft-lb during the test. The figure shows the valve events during reactivation of cylinder 1 that includes intake valve opening and fuel injection followed by exhaust valve opening.
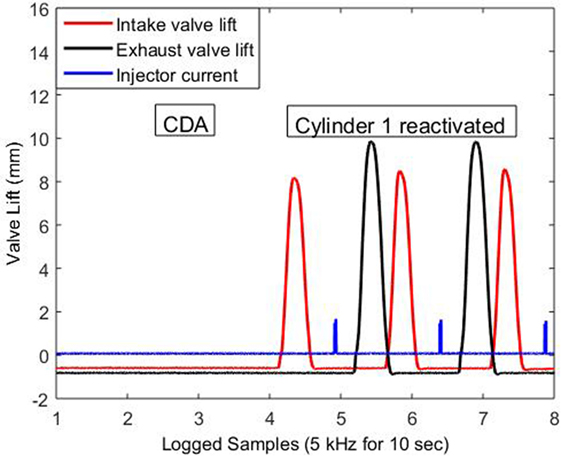
Figure 2. Sequence of events during transition of cylinder 1 from deactivated to normal firing mode.
3.2.2. Maintaining Torque Relatively Constant during Transition from CDA to Six-Cylinder Mode
The valve control algorithm was modified such that the torque during transition from CDA to normal 6-cylinder operation remains relatively constant for the purpose of calculating oil accumulated during CDA in this study. To achieve this, fueling to each of the firing cylinders is approximately doubled in CDA mode. Fueling in each of the six cylinders is x mg/str when normal six-cylinder mode is resumed at the same speed/load condition. Figure 2 shows an example of change in fueling from 2x mg/str in the active cylinders 4, 5, and 6 to x mg/str per cylinder in all of the six cylinders during the normal six-cylinder mode.
3.3. Heat Release-Based Analysis of Oil Accumulation
The basic strategy followed to measure oil accumulation in the combustion chamber of a deactivated cylinder is to calculate the extra hydrocarbon burned upon reactivating that cylinder. The fundamental equation that describes the combustion of accumulated oil and injected fuel in a reactivated cylinder is shown in equation (1).
where is the gross heat release rate as a function of crank angle for a cylinder reactivated after N minutes of CDA and Qgross,deactive is the cumulative gross heat released for a reactivated cylinder. mfuel is the known quantity of fuel injected in the reactivated cylinder, and moil is the mass of oil combusted after reactivation of the same cylinder. LHVfuel is the lower heating value of diesel fuel, and LHVoil is the lower heating value of oil, approximated as LHVoil = 40.2 MJ/kg (Garg et al., 2006). Likewise, the gross heat release rate of the same cylinder during normal operation is
If the same cylinder’s Qgross,baseline is known during a case of no oil accumulation, equations (1) and (2) can be combined to give
where Qgross,baseline is the gross cumulative heat released when a cylinder is actively firing (no oil accumulation case) and is referred to as the baseline heat release for that cylinder. Qgross,deactive is the gross cumulative heat release when the same cylinder is reactivated after N minutes of CDA. The term (Qgross,deactive − Qgross,baseline) thus gives the heat released due to combustion of the extra hydrocarbon from oil accumulated during deactivation of that cylinder. Dividing this extra heat released by the lower heating value of oil LHVoil gives the mass of oil accumulated in a cylinder that has been deactivated for N minutes. The moil calculated in equation (3) shows calculation for one engine cycle after the cylinder is reactivated. If oil combustion is evident in more than one cycle after reactivation, the total mass of oil burned after a cylinder is reactivated, which is given by equation (4).
where i is the engine cycle number after the cylinder is reactivated and n is the number of engine cycles for which oil combustion is evident, which is for those cycles in which Qgross,deactive is larger than Qgross,baseline.
3.4. Calculation of Gross Heat Release Rate
Gross heat release rate is calculated here since it represents the heat released within the cylinder during combustion and includes the impact of heat lost through the cylinder walls. Standard calculations of gross heat release rate have been used:
where is the net heat release rate and is the rate of heat transfer through the cylinder walls. The term is calculated using AVL IndiCom from the in-cylinder pressure measurements recorded on a cycle-by-cycle basis every time data are collected for 100 engine cycles during CDA to 6-cylinder transition. Equation 6 is used to calculate rate of heat transfer through the cylinder walls during cylinder deactivation.
where A(θ) is the inside surface area of the cylinder as a function of crank angle, h(θ) is the instantaneous heat transfer coefficient, T is the bulk temperature of the contents of the cylinder, and Twall is the temperature of the cylinder walls. The heat transfer coefficient h(θ) is calculated using Woschni model.
3.5. Test Plan to Measure Oil Accumulation during CDA
The control algorithm described in the previous section was implemented in Matlab/Simulink and communicated through dSPACE. During engine tests, the intake valve profiles, exhaust valve profiles, fuel injector currents, and in-cylinder pressure for each cylinder were monitored in real time. The in-cylinder pressure and calculated apparent heat release rate during combustion were used to calculate oil accumulation during CDA. The test plan developed for oil accumulation measurement experiments at two engine speeds and various CDA durations is illustrated in Table 1.
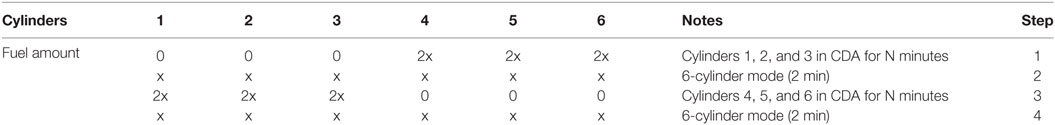
Table 1. Test plan for experiments to measure oil accumulation during CDA.
During the experiment, three cylinders were deactivated at a time, cylinders 1, 2, and 3 or cylinders 4, 5, and 6 considering the firing order of the cylinders is 1-5-3-6-2-4. The first step in Table 1 shows cylinders 1, 2, and 3 deactivated for N minutes. As already described in the previous section, to maintain torque relatively constant, fueling in each of the active cylinders 4, 5, and 6 was 2x mg/str. During transition from CDA in step 1 to six-cylinder mode in step 2, 100 cycles of in-cylinder pressure data were recorded using an AVL IndiCom high-speed data acquisition system. From inspection of the data, following cylinder reactivation, the integrated heat release from a given cycle converges to the heat release of an actively firing cylinder in no more than 100 cycles. That observation, during preliminary analysis, was the basis for including results in this article for the first 100 cycles after cylinder reactivation. These data during 100 cycles were used to calculate baseline heat release Qgross,baseline for the active cylinders 4, 5, and 6 and Qgross,deactive for deactivated cylinders 1, 2, and 3. In the next test, cylinders 4, 5, and 6 were deactivated, and the same process of adjustment of fueling and recording heat releases was repeated. The heat release data in this test was used to calculate Qgross,baseline for active cylinders 1, 2, and 3 and the Qgross,deactive for deactivated cylinders 4, 5, and 6. Using the test plan illustrated in Table 1, experiments were conducted at engine operating condition of 800 rpm, 100 ft-lb and 1,200 rpm, 100 ft-lb with CDA durations of 0.5, 5, 10, and 20 min.
4. First Fire Readiness Analysis of CDA
After prolonged deactivation, it is possible for a cylinder to cool down to the extent it is reactivated, and it is not hot enough to immediately combust the fuel properly and give the expected amount of work output. Specifically, cylinder cool-down of deactivated cylinders may delay combustion or in worst case result in misfire. In-cylinder oil accumulation following prolonged CDA could also be a potential cause for first fire readiness issue of CDA. First fire readiness analysis in this article is focused on assessing.
– Any misfire upon reactivation
– Any abnormalities in combustion during first and subsequent firings
The control algorithm and experiments used to study first fire readiness issue of CDA are the same as conducted for the oil accumulation characterizing, as described in Section 3.
5. Results and Discussion of In-Cylinder Oil Accumulation and First Fire Readiness
Experiments using the test plan outlined in the previous section (per Table 1) and analysis of in-cylinder oil accumulation and first fire readiness was conducted at two operating conditions 800 rpm, 100 ft-lb and 1,200 rpm, 100 ft-lb with CDA durations of 0.5, 5, 10, and 20 min. To ensure repeatability, the test plan outlined in Table 1 was executed second time on two different days, resulting in two data sets of the same test conditions.
Values of Qgross,baseline and Qgross,deactive were calculated for 100 cycles of heat release data as discussed in Section 3 for all cylinders and for different CDA durations at 800 rpm, 100 ft-lb. Oil masses calculated for the complete data sets 1 and 2 at 800 rpm, 100 ft-lb are shown in Figures 3A,B respectively. Values of calculated oil mass for each cylinder for CDA durations 0.5, 5, 10, and 20 min are shown. Figures 3A,B indicate that cylinder 2 showed the highest oil accumulation compared to other cylinders for all CDA durations. Higher oil accumulation in cylinder 2 could possibly result in misfire or degraded combustion when reactivated. Hence, results of oil accumulation and first fire readiness for cylinder 2 are discussed in detail in sections 5.1 and 5.2 while analysis of the trends in the entire data set is presented in Sections 5.3 and 5.4.
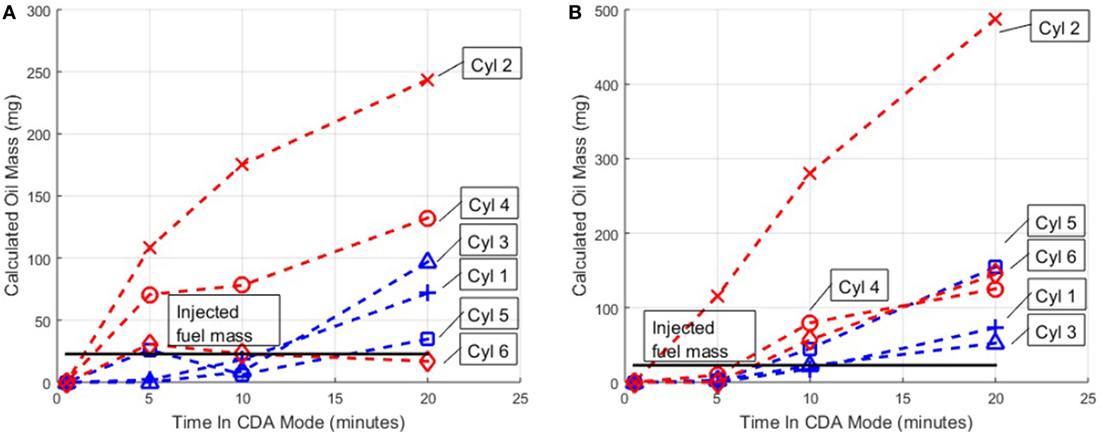
Figure 3. (A) Calculated oil mass in all cylinders for data set 1 at 800 rpm, 100 ft-lb. (B) Calculated oil mass in all cylinders for data set 2 at 800 rpm, 100 ft-lb.
5.1. Oil Accumulation
5.1.1. Analysis for 5 min of CDA
Figure 4 shows an example of cumulative heat release plotted on a cycle-by-cycle basis for cylinder 2 following 5 min of deactivation at 800 rpm, 100 ft-lb. The gray line in the figure represents baseline cumulative heat release per cycle when cylinder 2 was actively firing and is fairly constant for all engine cycles at this speed/load condition. The black line is the cumulative heat release per cycle for cylinder 2 prior to and following reactivation. Error bars represent two standard deviations of a 30 cycle mean for Qgross,baseline. Cycles 1, 2, 3, and 4 are the cumulative heat release of cylinder 2 when it was deactivated. The transition of cylinder 2 from CDA to firing mode occurs at cycle 5 as shown in Figure 4.
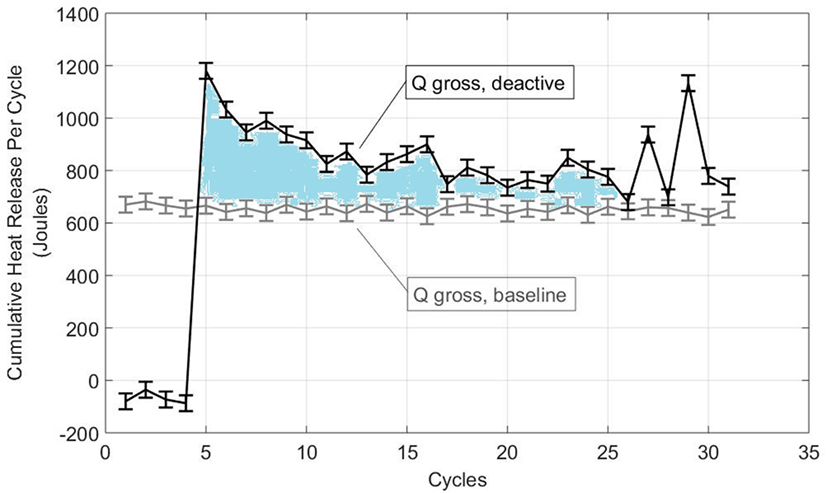
Figure 4. Cumulative heat release per cycle for cylinder 2 after 5 min of deactivation in data set 1 at 800 rpm, 100 ft-lb.
It is clearly seen that the cumulative heat release in cylinder 2 is much higher in the first cycle after reactivation (cycle 5), compared to the gray-colored baseline value. Since the ECM commanded total fueling was identical for baseline and reactivating cases, the difference between black and gray lines is the result of the combustion of accumulated oil. In addition, the difference in Qgross,baseline and Qgross,deactive persists for the next few cycles as well, indicating that the accumulated oil does not combust completely in the first cycle after reactivation. In this analysis, oil combustion is assumed to be complete in the cycle when the error bars overlap for the first time. As such, the area shaded in blue in Figure 4 represents the energy released through the combustion of accumulated oil:
Through the combination of equations (7) and (4), the mass of accumulated oil can be estimated using equation (8),
resulting in a value of 108.41 mg of oil accumulated inside cylinder 2 following 5 min of deactivation at 800 rpm, 100 ft-lb.
The corresponding heat release profiles for cylinder 2 are shown in Figure 5A. In this figure, the heat release profile in gray is the baseline (when cylinder 2 was actively firing for many prior cycles). Baseline heat release for 10 engine cycles is plotted to visualize cyclic dispersion. Heat release profiles for the first, third, and fifth cycle after reactivation of cylinder 2 have also been shown in Figure 5A. The integral of heat release shown by the solid blue line in Figure 5A corresponds to the cumulative heat release of cycle 5 (the first cycle after reactivation) in Figure 4. The solid blue line deviates from baseline heat release, particularly between 370 CAD and 400 CAD, indicating combustion of extra hydrocarbon on account of oil accumulation. The heat release profiles of the third and fifth cycle after reactivation show similar deviation from baseline. This is consistent with the higher Qgross,deactive due to combustion of accumulated oil seen in the cycle numbers 7 and 9 in Figure 4.
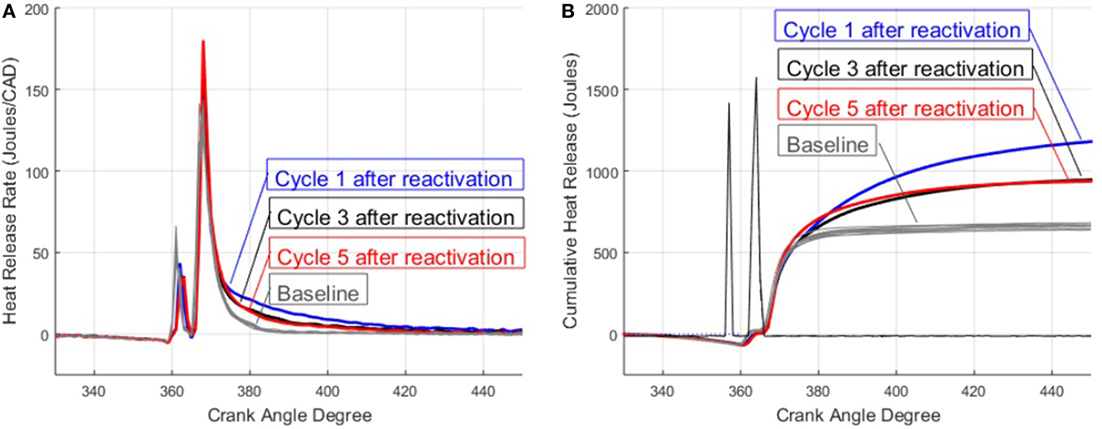
Figure 5. (A) Heat release rate for cylinder 2 after 5 min of deactivation in data set 1 at 800 rpm, 100 ft-lb. (B) Cumulative heat release for cylinder 2 after 5 min of deactivation in data set 1 at 800 rpm, 100 ft-lb.
Figure 5B shows the cumulative heat release calculated by taking a running integral of the apparent heat release profiles in Figure 5A. The gray plots in Figure 5B represent ten cycles of baseline heat release of cylinder 2. Cumulative heat release for the first, third, and fifth cycle after reactivation of cylinder 2 is also shown for reference. The values of cumulative heat release in Figure 4 correspond to the final values in Figure 5B.
5.1.2. Analysis for 10 and 20 min of CDA
Continuing heat release-based analysis of oil accumulation in cylinder 2, the experiment was repeated for CDA durations of 10 min, 20 min, and 30 s.
Cumulative heat release on a cycle-by-cycle basis for cylinder 2 following 10 and 20 min of deactivation are shown in the in Figures S1A,B in Supplementary Material, respectively. Using equation (8), the oil mass accumulated in the combustion chamber of cylinder 2, after being deactivated for 10 min, was calculated as 175.4and 243.65 mg, an increase relative to the 108.4 mg accumulated after 5 min of deactivation.
5.1.3. Analysis for 30 s of CDA
Figure 6 shows cycle-by-cycle cumulative heat release for cylinder 2 after 30 s of CDA. Qgross,deactive is very close to Qgross,baseline for all cycles after reactivation, indicating negligible oil accumulation after 30 s of CDA. This is consistent with the heat release profiles of cylinder 2 after reactivation being similar to baseline as shown in Figure 7.
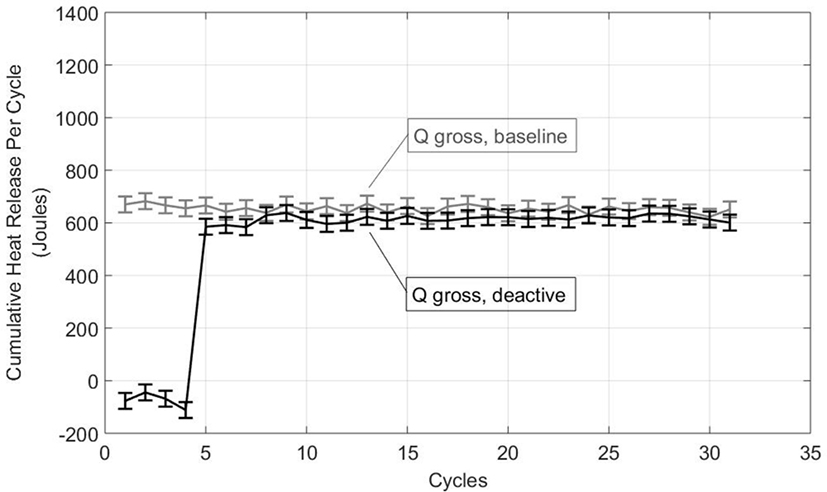
Figure 6. Cumulative heat release per cycle for cylinder 2 after 30 s of deactivation in data set 1 at 800 rpm, 100 ft-lb.
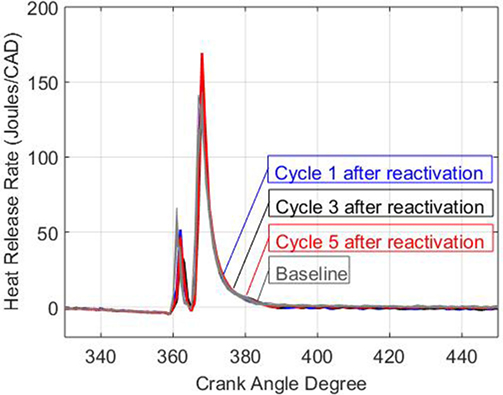
Figure 7. Heat release rate for cylinder 2 after 30 s of deactivation in data set 1 at 800 rpm, 100 ft-lb.
5.2. First Fire Readiness
Higher oil accumulation in cylinder 2 could possibly result in misfire or degraded combustion when reactivated. While first fire readiness analysis was conducted for all cylinders, results of the analysis for cylinder 2 are discussed below.
5.2.1. Analysis for 5 min of CDA
Figures 5A,B also enable analysis of first fire readiness for cylinder 2 following 5 min of deactivation. As shown, there is no misfire and only a delay of approximately 1 CAD in the pilot-injected fuel combustion. Figure 8 is the same as Figure 5A with the X-axis changed so that the delayed pilot heat release for cylinder 2 following 5 min of deactivation is more clearly seen. The main heat release is very similar to baseline. As discussed above, heat release is distorted later in the profile (between 370 and 400 CAD) due to combustion of oil accumulated in the cylinder. In sum, Figure 8 demonstrates that cylinder 2 is first fire ready after 5 min of deactivation.
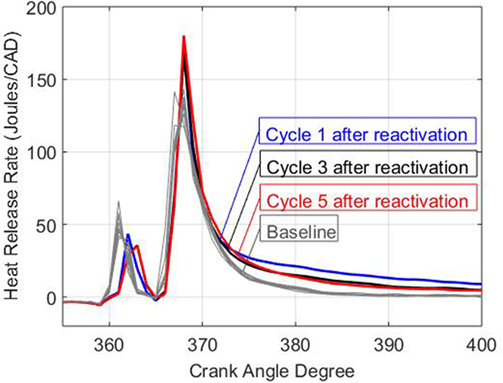
Figure 8. Heat release rate for cylinder 2 after 5 min of deactivation showing delayed pilot combustion (zoomed-in version of Figure 5A).
5.2.2. Analysis for 10 and 20 min of CDA
The instantaneous heat release profiles for cylinder 2 after 10 min of deactivation and 20 min of deactivation are shown in the in Figures S2A,B in Supplementary Material, respectively. The results are very similar to the results following 5 min of deactivation, namely
– pilot fuel combustion delayed by approximately 1 CAD,
– distortion in the main combustion event after ~370 CAD as a result of combustion of accumulated oil, and
– first fire ready.
5.2.3. Analysis for 30 s of CDA
Figure 7 indicates that heat release profile of cylinder 2 following 30 s of deactivation is very similar to baseline heat release when cylinder 2 was actively firing. Hence, there are no first fire readiness issues upon reactivation of after cylinder 2 after 30 s of CDA.
5.3. Complete Data Set 1 at 800 rpm, 100 ft-lb
In Figure 3A, cylinders 1, 2, 3, and 4 clearly show an increase in oil accumulation as CDA duration increases, which is the expected outcome, more oil accumulated for a longer deactivation period. However, cylinders 5 and 6 do not show a clear trend in oil mass accumulation as CDA duration increases.
In the heat release based analysis shown in section 3.3, it is assumed that any deviation in the heat release of a reactivated cylinder compared to the heat release of the same cylinder when it is actively firing is solely due to the combustion of oil accumulated during CDA. Thus, the oil mass values estimated in this section represent lower bounds on accumulated oil mass since it is possible that some portion of the oil does not burn completely after transition to six-cylinder mode. The cycle-by-cycle cumulative heat release after 20 min of CDA for cylinders 5 and 6 are shown in Figures 9 and 10 respectively. Both figures indicate very modest amount of oil burning after the first cycle of reactivation. There is a probability that some portion of the accumulated oil escapes into the exhaust stream without burning. This would result in a lower calculated oil mass for such cases.
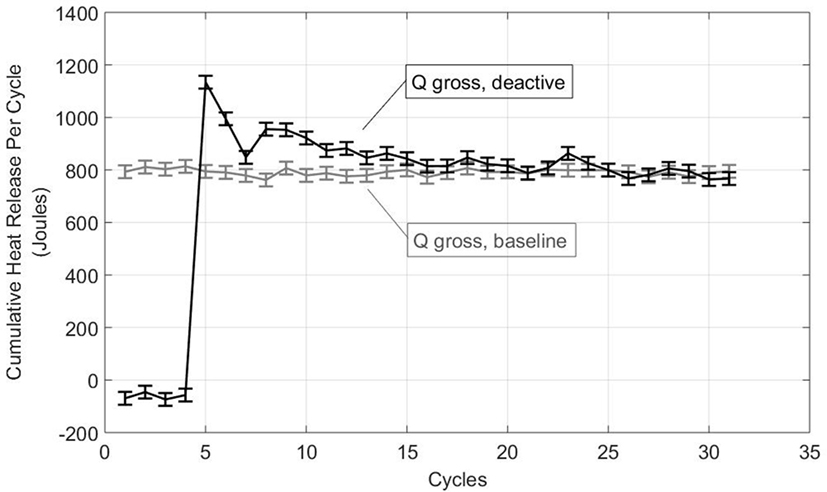
Figure 9. Cumulative heat release per cycle for cylinder 5 after 20 min of deactivation in data set 1 at 800 rpm, 100 ft-lb.

Figure 10. Cumulative heat release per cycle for cylinder 6 after 20 min of deactivation in data set 1 at 800 rpm, 100 ft-lb.
Cylinders 2 and 4 show higher oil accumulation than the other cylinders for all CDA durations. This suggests that these two cylinders have a less than ideal piston ring seal.
Overall, Figure 3A shows that at least half of the number of cylinders showed elevated oil accumulation after 5 min of deactivation. No first fire readiness issues were observed for any of the cylinders for any of the CDA durations tested (corresponding additional plots not shown).
5.4. Complete Data Set 2 at 800 rpm, 100 ft-lb
Similar to data set 1, an increase in oil accumulation was seen as CDA duration increases in data set 2 shown in Figure 3B. The corresponding calculated oil mass for different CDA durations are very similar to data set 1, except for cylinder 2. Compared to data set 1, values of calculated oil mass for cylinder 2 in data set 2 are notably higher following 10 and 20 min of deactivation.
While cylinder 5 shows the expected trend in oil accumulation in data set 2, higher oil accumulation is calculated for 10and 20 min CDA duration compared to data set 1. This is evident in Figure 11 where Qgross,deactive continues to be higher Qgross,baseline for several engine cycles after reactivation, indicating that the accumulated oil burns in many cycles after reactivation. As such, the calculated oil mass for cylinder 5 after 10and 20 min CDA is also higher compared to data set 1. Similar reasoning applies to higher calculated oil mass for cylinder 6 after 10and 20 min CDA in data set 2. Calculated oil accumulation in cylinders 4, 5, and 6 after 5 min of CDA is lower in data set 2 compared to data set 1. Similar to Figures 9 and 10, there is a probability that some portion of the accumulated oil escapes into the exhaust stream without burning. This would result in a lower calculated oil mass for such cases.
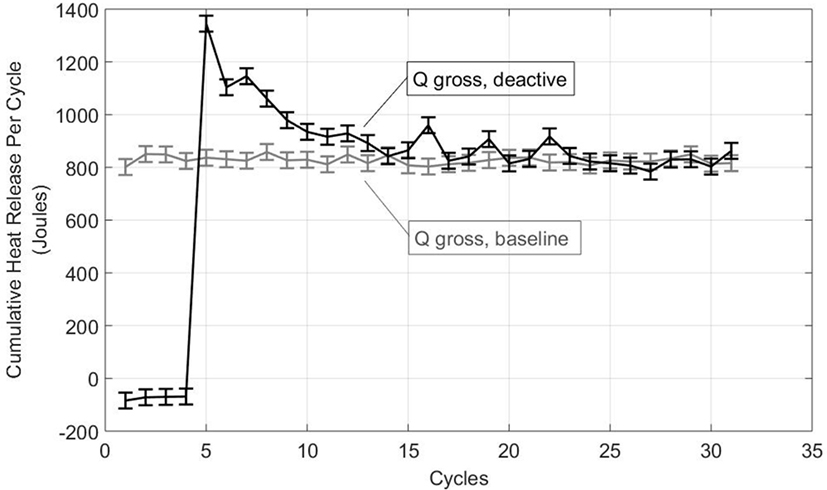
Figure 11. Cumulative heat release per cycle for cylinder 5 after 10 min of deactivation in data set 2 at 800 rpm, 100 ft-lb.
No first fire readiness issues were observed for any cylinder in data set 2 at 800 rpm, 100 ft-lb.
5.5. Complete Data Sets 1 and 2 at 1,200 rpm, 100 ft-lb
The effect of engine speed on oil accumulation was studied by implementing the test plan in Table 1 at 1,200 rpm, 100 ft-lb for CDA durations of 0.5, 5, 10, and 20 min. Figures 12A,B show calculated oil mass values for all cylinders for different CDA durations at 1,200 rpm, 100 ft-lb. The calculated oil masses do not show a consistent increase in oil mass with deactivation duration. Comparing Figures 12A,B with oil masses at 800 rpm shown in Figures 3A,B, the calculated oil mass for all cylinders is much lower at 1,200 rpm than at 800 rpm.
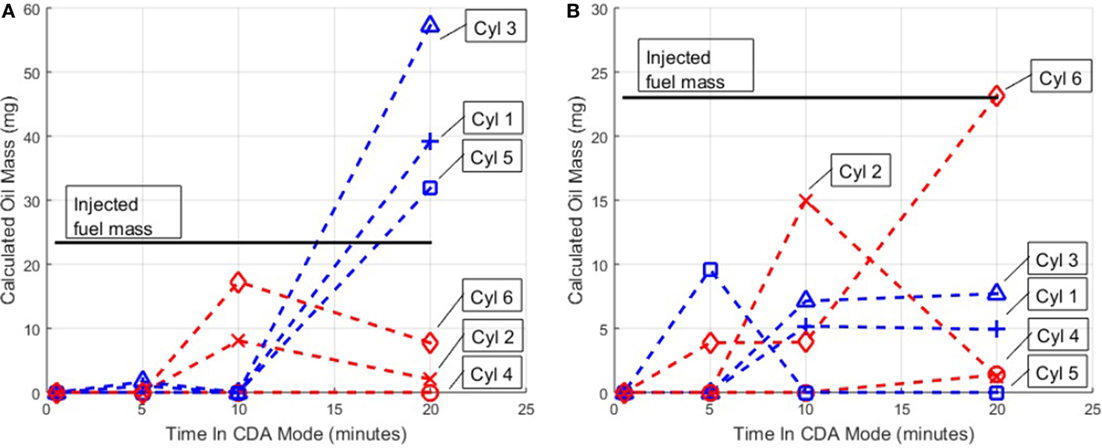
Figure 12. (A) Calculated oil mass in all cylinders for data set 1 at 1,200 rpm, 100 ft-lb. (B) Calculated oil mass in all cylinders for data set 2 at 1,200 rpm, 100 ft-lb.
Figure 13A illustrates the pressure inside cylinder 2 during normal operation and also toward the end of a 10-min deactivation period, for 1,200 rpm, 100 ft-lb and 800 rpm, 100 ft-lb. Figure 13A shows that after 10 min of deactivation, the in-cylinder pressure drops to nearly one-tenth compared to the actively firing cylinder. As explained previously, this is the cause of oil transport from the crankcase into the combustion chamber of a deactivated cylinder. Although the pressure during CDA at 1,200/100 is higher than at 800/100, the difference is not large enough to result in a significant change in oil accumulation. In addition, a similar trend is not seen for all CDA cases, including cylinder 4 in Figure 13B. Lower oil accumulation at 1,200 rpm could also be a result of piston ring liner dynamics being different at a higher engine speed. The exact cause of lower calculated oil mass at 1,200/100 is not known.
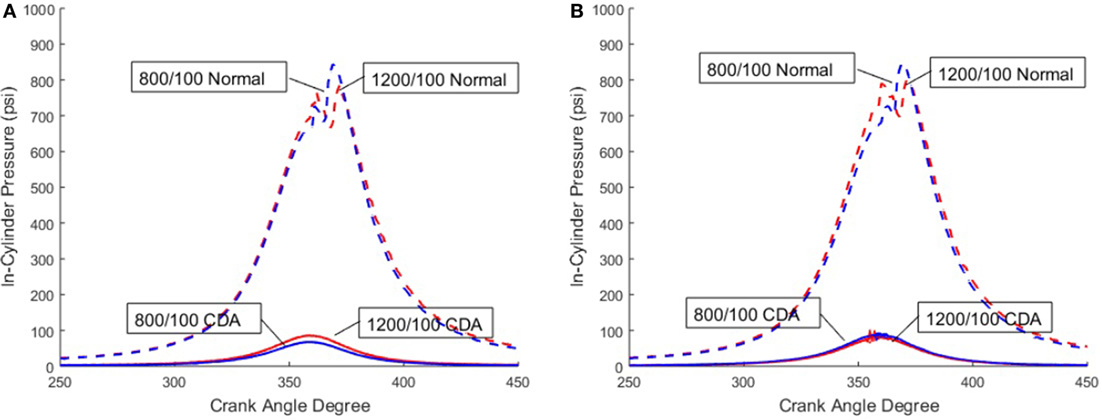
Figure 13. (A) Comparison of pressure in cylinder 2 after 10 min of deactivation at 1,200/100 and 800/100. (B) Comparison of pressure in cylinder 4 after 10 min of deactivation at 1,200/100 and 800/100.
Numerical values for calculated oil mass in each cylinder for data sets 1 and 2 at 800 rpm, 100 ft-lb are shown in the in Tables S1 and S2 in Supplementary Material respectively and for data sets 1 and 2 at 1,200 rpm, 100 ft-lb are shown in the in Tables S3 and S4 in Supplementary Material, respectively.
6. Summary
Oil accumulation and first fire readiness analysis of CDA done in this article can be summarized as below:
1. Oil accumulation during and first fire readiness following CDA has been studied by comparing heat release profiles of reactivated cylinders with baseline heat release, for all cylinders in both data sets at 800 rpm/100 ft-lb and 1,200 rpm/100 ft-lb, with CDA durations 0.5, 5, 10, and 20 min.
2. An increase was seen in oil accumulation as CDA duration increased for most of the cylinders, at both speed/load conditions.
3. Values of calculated oil mass were consistent for most of the cases in both the data sets at 800/100 operating condition. Cylinder 2 showed the highest oil accumulation of 487.77 mg possibly due to a less than ideal piston ring seal. In some cases, there is a possibility of the accumulated oil escaping into the exhaust stream before combusting over multiple cycles after reactivation, resulting in a lower calculated oil mass.
4. Calculated oil mass for all cylinders at 1,200/100 was much lower than at the corresponding CDA durations at 800/100. The exact cause of this behavior is unknown.
5. Misfire was not observed at either speed/load condition for any CDA duration tested. Although pilot combustion was delayed by 1 CAD after 5, 10, and 20 min of CDA, the main heat release appeared close to baseline heat release. As such, all cylinders are first fire ready following prolonged deactivation of 20 min.
6. The heat release was mainly distorted later in the profile as oil accumulated. This is distinctly seen for 10 and 20 min of CDA, which is consistent with higher oil accumulation in the combustion chamber.
7. Future Work
The estimated values of oil accumulated during CDA serve as a proxy for the time the engine can be operated in CDA mode without significant increase in in-cylinder oil accumulation. Piston ring seals of cylinders showing high oil accumulation can be inspected to minimize oil accumulation. A recharge event consisting of an intake valve lift followed by exhaust valve opening can be performed more frequently during prolonged CDA mode. As such, a recharge event increases the pressure inside a deactivated cylinder and is expected to reduce oil accumulation during CDA. A recharge event can also include a small amount of fuel injection such that the combustion increases pressure in a deactivated cylinder and minimizes in-cylinder oil accumulation during CDA. An interesting idea shared by one of the reviewers of this article is the development of a phenomenological model for oil transport using in-cylinder and crank case pressures.
Author Contributions
MH: co-lead on experiments and analysis and lead on writing the manuscript. BP: co-lead on experiments and analysis. DF: assisted with many of the experiments. AR: assisted with all of the experiments. GS: PI for the research effort and graduate advisor for the first three authors. JM, MR, and EK: research sponsor who helped motivate and scope the research.
Conflict of Interest Statement
The authors declare that the research was conducted in the absence of any commercial or financial relationships that could be construed as a potential conflict of interest.
Funding
Cummins Inc. and Eaton jointly funded this effort at Purdue University.
Supplementary Material
The Supplementary Material for this article can be found online at http://journal.frontiersin.org/article/10.3389/fmech.2017.00001/full#supplementary-material.
References
Ariga, S. (1996). Observation of transient oil consumption with in-cylinder variables. SAE Tech. Pap. 961910. doi:10.4271/961910
Ding, C. (2014). Thermal Efficiency and Emission Analysis of Advanced Thermodynamic Strategies in a Multi-Cylinder Diesel Engine Utilizing Valve-Train Flexibility. Ph.D. thesis. West Lafayette, Indiana: Purdue University.
Ding, C., Lu, S., Shaver, G., Holloway, E., McCarthy, J., Shute, R., et al. (2015a). Impact of cylinder deactivation on diesel engine aftertreatment thermal management and efficiency at highway cruise conditions. Front. Engine Automot. Eng. 1:9. doi:10.3389/fmech.2015.00009
Ding, C., Roberts, L., Fain, D., Ramesh, A., and Shaver, G. (2015b). Fuel efficient exhaust thermal management for compression ignition engines during idle via cylinder deactivation and flexible valve actuation. Int. J. Engine Res. 17, 619–630. doi:10.1177/1468087415597413
Garg, A., Kazunari, K., and Pulles, T. (2006). IPCC Guidelines for National Greenhouse Gas Inventories. Vol. 2, Chap. 1.
Leone, T., and Pozar, M. (2001). Fuel economy benefit of cylinder deactivation-sensitivity to vehicle application and operating constraints. SAE Tech. Pap. doi:10.4271/2001-01-3591
Ma, Z. (2010). Oil transport analysis of a cylinder deactivation engine. SAE Tech. Pap. doi:10.4271/2010-01-1098
Magee, M. (2013). Exhaust Thermal Management using Cylinder Deactivation. Master’s thesis. West Lafayette, Indiana: Purdue University.
McCarthy, J. Jr. (2016). “Cylinder deactivation for optimizing conventional engines,” in Driving Automotive Innovation Conference (Washington, DC). Available at: http://www.theicct.org/events/driving-automotive-innovation
Mo, H., Huang, Y., Mao, X., and Zhou, B. (2014). The effect of cylinder deactivation on the performance of a diesel engine. J. Automob. Eng. 228, 199–205. doi:10.1177/0954407013503627
Keywords: diesel engine, cylinder deactivation, variable valve actuation, combustion, multicylinder
Citation: Halbe M, Pietrzak B, Fain D, Ramesh A, Shaver G, McCarthy JE Jr., Ruth M and Koeberlein E (2017) Oil Accumulation and First Fire Readiness Analysis of Cylinder Deactivation. Front. Mech. Eng. 3:1. doi: 10.3389/fmech.2017.00001
Received: 04 September 2016; Accepted: 14 February 2017;
Published: 06 March 2017
Edited by:
Stephen Anthony Ciatti, Argonne National Laboratory (DOE), USAReviewed by:
Robert Gary Prucka, Clemson University, USAKalyan Srinivasan, Mississippi State University, USA
Copyright: © 2017 Halbe, Pietrzak, Fain, Ramesh, Shaver, McCarthy, Ruth and Koeberlein. This is an open-access article distributed under the terms of the Creative Commons Attribution License (CC BY). The use, distribution or reproduction in other forums is permitted, provided the original author(s) or licensor are credited and that the original publication in this journal is cited, in accordance with accepted academic practice. No use, distribution or reproduction is permitted which does not comply with these terms.
*Correspondence: Greg Shaver, Z3NoYXZlckBwdXJkdWUuZWR1