 Víctor A. Acosta Santamaría
 María Flechas García
 Jérôme Molimard
 Stephane Avril
- 1SaInBioSE, INSERM, U1059, Saint Etienne, France
- 2Mines Saint-Etienne, Saint Etienne, France
- 3Université de Lyon, Saint Etienne, France
Optical coherence tomography (OCT) combined with digital volume correlation (DVC) is a suitable technique to investigate the biomechanical behavior of biological tissues at the microscale. However, to characterize the whole thickness of large human or porcine arteries, the use of osmotic tissue clearing agents, such as propylene glycol (PG), is unavoidable due to intrinsic tissue scattering of light. The mechanical response of biological tissues immersed in tissue clearing agents has been poorly investigated so far. Nevertheless, understanding the mechanisms of tissue clearing could be helpful for developing safe optical-clearing methods for possible in vivo applications. The goal of the present work is to combine OCT and DVC to measure displacement and strain fields in porcine aortic tissues immersed in PG and subjected to stress-relaxation uniaxial tension. Displacement and strain fields are measured across the whole thickness of the porcine aortic wall for the first time. Measurement uncertainties and optimal OCT-DVC parameters are determined to define useful technical recommendations for future similar analyses. It is known that the main effect of PG is a significant increase in collagen fibril packing density due to important loss of water (dehydration). It results in a pronounced stiffening of the aortic tensile response when compared to the response of the same tissue immersed in phosphate buffered saline (PBS). This effect is reversible when the aortic tissue is removed from PG polypropylene glycol and immersed again in PBS. Another effect is a dramatic reduction in the Poisson’s effect during tensile loading. But the OCT-DVC-measured strain fields also reveal heterogeneities of this effect among the different layers of the aorta. It appears that the reduced Poisson’s effect is concentrated in the media layer, whereas the adventitia and intima layer keep a usual Poisson’s effect of nearly incompressible tissues. It is concluded that further work should be conducted on how the smooth muscle cells highly present in the media layer are affected by PG polypropylene glycol immersion for a better understanding of these effects.
Introduction
Optical coherence tomography (OCT) is an imaging modality of micrometric scale permitting the visualization of tissue microstructure at different sub-surface levels (high-resolution and cross-sectional images acquisition with a near-infrared light) (Yang et al., 2006; Huang et al., 2009; Tucker-Schwartz and Skala, 2012; Real et al., 2013; Ling et al., 2016; Mahdian et al., 2016). It is continuously under development, with for instance recent real time acquisitions (Schmitt et al., 1994; Boppart et al., 1999; Yabushita et al., 2002; Yang et al., 2006; Tucker-Schwartz and Skala, 2012).
As an optical imaging technique, OCT has been used for medical application studies (in vivo) and for biomedical and bioengineering research (in vitro). OCT was applied to characterize soft and hard human tissues such as vessels (aorta and coronary arteries), respiratory tract, gastrointestinal tissues (stomach and esophagus), cartilage, skin, nervous systems, cornea and retinal tissues, fatty tissue, cancellous and cortical bone, human enamel, etc. For medical applications, this technique has been employed to detect and characterize the morphological alterations of microstructure and structure of human tissues undergoing pathologic changes such as: atherosclerotic plaques, thoracic aortic aneurysms, airways dysfunctions (asthma and bronchiectasis), gastrointestinal tumor tissue, articular cartilage degenerative changes, retinal vascular diseases, microfractures and inflammations in oral tissues, etc. It has also been used on biomaterials such as dental implants, three-dimensional (3D) porous scaffolds applied in tissue engineering and hydrogels, among others (Brezinski et al., 1996; Wang, 2002; Wang and Elder, 2002; Yabushita et al., 2002; Yang et al., 2006, 2007; Huang et al., 2009; Prati et al., 2010; Williamson et al., 2011; Li et al., 2012; Real et al., 2013; Jia et al., 2015; Liba et al., 2016; Mahdian et al., 2016; Nebelung et al., 2016; Alibhai et al., 2017).
Additionally, the OCT technique can be applied to evaluate and determine the mechanical properties of biological tissues (Rogowska et al., 2004; Palanca et al., 2016). For experimental biomechanics, mechanical characterization may be achieved by a full-field measurement of displacements and strains (Fu et al., 2013; Palanca et al., 2016). Due to the complex anisotropic structure and non-linear response of biological tissues, the strain gradients can fluctuate significantly through the thickness of the tissue. In this context, a 3D full-field deformation measurement is required (Fu et al., 2013; Palanca et al., 2016). The digital volume correlation (DVC) is a 3D extension of the 2D digital image correlation (DIC) method. For DIC, the strain measurements are limited to evaluate the specimen’s surface. However, the DVC method provides 3D full-field measurements across the specimen microstructure (Rogowska et al., 2004; Liu and Morgan, 2007; Fu et al., 2013; Hild et al., 2013; Bouterf et al., 2014; Gillard et al., 2014). To achieve a correct correlation between the reconstructed volumes, it is necessary to define an adequate speckle contrast. Additionally, parameters such as the uncertainty of the measured displacements and the spatial resolution depend on the texture of the analyzed images and should be adjusted for each study (Leclerc et al., 2011; Fu et al., 2013).
Different studies have been conducted so far using DIC to characterize the mechanical and structural properties on aortic tissue. Zhang et al. (2002) used a tensile test and measured displacement and strain fields on bovine aorta (intima and media layers). Genovese and Humphrey (2015) applied a pressure test to assess the full-field surface deformations and regional wall thickness on a porcine aortic arch. In a previous study of our group, Trabelsi et al. (2015) applied a bulge inflation test to characterize stress and strain distributions and estimate the rupture stresses of human ascending thoracic aortic aneurysms. Additionally, and regarding the characterization of aortas, few studies have applied the OCT technique (Real et al., 2013). Fu et al. (2013) applied a tensile test in conjunction with the OCT and DVC methods to obtain measurements of depth-resolved deformations on silicone gels. Real et al. (2013) studied human aorta aneurysms (in vitro), in order to define structure abnormalities. However, no reference of a combined OCT/DVC approach could be found on aortic tissue.
This lack of study on aortic tissue can be explained by the main limitations of OCT, which are its penetration depth and image contrast. The penetration depth across aortic tissue is usually less than 500 µm, whereas human or porcine aortas have a thickness of about 2 mm. These limitations of OCT are related to the scattering properties of biological tissues, defined as the spectral and angular characteristics of light interacting with the heterogeneous features of the tissue. Additionally, the refractive index is affected by the structural composition of the tissue (intra and extracellular fluids, cell organelles, and fiber structures) (Boppart et al., 1999; Welzel, 2001; Wang, 2002; Pancrazio et al., 2007; Sudheendran et al., 2011; Larin et al., 2012; Tucker-Schwartz and Skala, 2012; Puhakka et al., 2015; Dao Luong et al., 2016).
To overcome these intrinsic limitations, different ways have been investigated. In vivo, OCT, and large gold nanorods were combined in a non-invasive method to acquire images at high spatial resolution, containing both rich anatomical structure and insight into functional biology (Liba et al., 2016). Photothermal OCT is another non-invasive technique that uses an amplitude-modulated laser to achieve spatial resolution and imaging depth with minimal effects on the tissue properties (Tucker-Schwartz and Skala, 2012; Tucker-Schwartz et al., 2012). In several in vitro studies, the tissues were immersed in different types of media in order to keep the sample hydrated and/or to maximize light penetration and minimize refraction during OCT measurements. Media such as PBS, normal saline, pure water, or distilled water have been applied in numerous cases (Brezinski et al., 1996; Yabushita et al., 2002; Yang et al., 2006, 2007; Shimamura et al., 2011; Mahdian et al., 2016; Nebelung et al., 2016). Wang et al. (2002) applied a tissue clearing technique to increase the OCT imaging contrast and depth capability on human stomach and esophagus tissues. To improve the optical scattering properties, the authors compared two optical clearing agents (OCAs): glycerol and propylene glycol PG. Glycerol replaces the interstitial extracellular fluid via osmotic forces. As a highly hyperosmotic agent, PG induces tissue dehydration. The result is a more homogeneous refractive index. Moreover, OCAs reduce the scattering coefficient. Other OCAs have been applied in different studies (glucose, mannitol, dextrose, fructose, and polyethylene glycol) (Welzel, 2001; Wang, 2002; Wang and Elder, 2002; Khan et al., 2004; Proskurin and Meglinski, 2007; Larina et al., 2008; Sudheendran et al., 2011; Larin et al., 2012).
The mechanical response of biological tissues immersed in tissue clearing agents has been poorly investigated so far. Nevertheless, understanding the mechanisms of tissue clearing could be helpful for developing safe optical-clearing methods for possible in vivo applications.
The goal of the present work is to combine OCT and DVC to measure displacement and strain fields in porcine aortic tissues immersed in a tissue clearing agent (PG) and subjected to stress-relaxation uniaxial tension. We first introduce the experimental protocol, delivering useful technical recommendations for measuring displacement and strain fields across the whole thickness of porcine aortic walls. The obtained OCT–DVC strain fields show interesting inhomogeneities across the different layers of the aorta. Results are discussed in the light of how immersion in PG can modify the biomechanical response of the aorta.
Materials and Methods
Sample Preparation
Two longitudinal samples of a descending thoracic aorta were collected from a healthy female pig (Large White × Landrace breed weighing 80–90 kg). The Veterinary School of Lyon (Institut Claude Bourgelat) supplied the aortic tissue in accordance with the recommendations of the ethics committee of VetAgro Sup (C2EA No 18), and following the animal testing regulation – Directive 2010/63/EU. The study and the protocol were reviewed and approved by the ethics committee of VetAgro Sup (project approved under No 1546). The samples were stored frozen at −20°C until the measurements were performed. About the freezing effects in porcine thoracic aorta samples, Matsumoto et al. (2009) showed that the mechanical properties were similar for samples stored at −23°C in comparison to fresh specimens at 37°C. Before the OCT acquisition, the tissue was placed into an osmotically active solution of 85% (v/v) PG in PBS, at 37°C for 2 h (Lomas et al., 2003). The sample was located and immersed in a chamber with the osmotic solution during OCT measurements (Figure 1). This hydrophilic agent dehydrates the tissue, extracting the interstitial and intracellular water content. This effect decreases the volume fraction of the scattering centers. The tissue becomes translucent, and the light penetration through the sublayers increases, improving the optical scattering properties, contrast and depth capability acquisition. In the vessel walls, the scattering origin is attributed to the long collagen and elastin fibers and the extracellular medium which have a different refractive index than interstitial and intracellular water and lipidic cell membranes (Wang, 2002; Wang and Elder, 2002; Larin et al., 2012). For the 3D images acquisition, the OCT lens was focused on the outer surface of the intima layer (corresponding to OCT B-scans) (Real et al., 2013). The sample geometries must present an intermediate flat zone (Table 1).
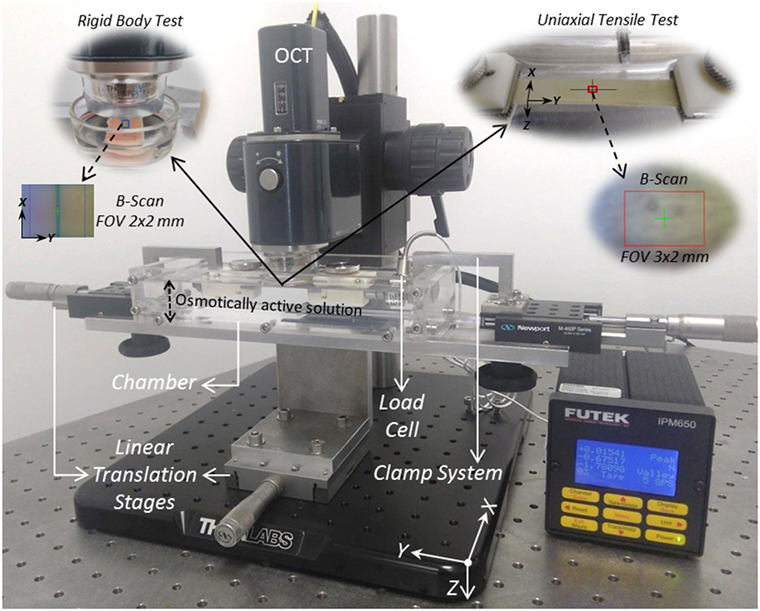
Figure 1. Experimental setup used for the rigid body translation test and for the stress-relaxation uniaxial tensile test.
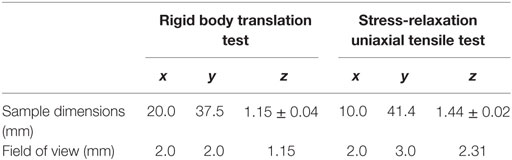
Table 1. Details of the aortic tissue samples and tests.
Experimental Protocols
For the mechanical characterization of the aortic tissue, an OCT experimental setup was developed to apply two different experimental protocols: a rigid body translation (RB) test and a stress-relaxation uniaxial tensile (UT) test (Figure 1). The objective for the RB test was to calibrate the optical scattering parameters that allow full-field measurements in the aortic wall tissue, applying the OCT technique in conjunction with the DVC method. In order to define the optimal field of view (FOV), a full thickness measurement was considered (corresponding to OCT A-scans) (Table 1). To determine the necessary spatial resolution and achieve the full-field displacement measurement through the tissue, OCT acquisitions were performed with different pixel sizes (3, 4, 5, and 6 µm) (Table 2). For each pixel size three displacement increments were applied (20, 40, and 60 µm), with a linear translation stage (Figure 1). The displacements were defined only on the X-axis (corresponding to OCT B-scans), and a free boundary condition was maintained during the test (Figure 1). Four OCT acquisitions were performed for each pixel size.
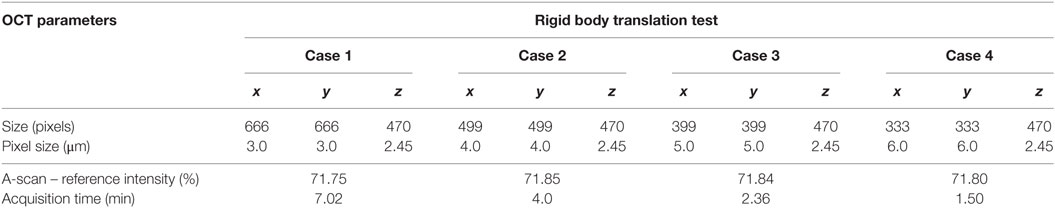
Table 2. Definition of optical coherence tomography (OCT) parameters for the rigid body translation test.
Once the optical scattering properties and the correlation parameters were defined, the UT test was performed (Figure 1). The experiment started with a preconditioning of 5% of deformation (with respect to the unloaded length of the sample), followed by 40 min of relaxation. The purpose of preconditioning was to activate the tissue fibers and ensure a flat and taut sample for the OCT acquisitions (Fu et al., 2013). After that, a stepwise stress-relaxation ramp was applied with nine controlled displacements and a relaxation period between increments of 30 min (required time to achieve the equilibrium of the swelling effect). The criterion for a complete equilibrium was a relaxation rate of <100 Pa/min (Korhonen et al., 2002). The displacement ramp was defined on the longitudinal direction of the tissue (Y-axis, corresponding to OCT B-scans) and was applied in two directions simultaneously (±Y-axis), in such a way as the zone of interest deforms without significant rigid body motion (Figure 1). The displacement range of the pulling translation stages was defined between 0 and 6.3 mm and each increment was 0.7 mm (0.35 mm in each direction). A final deformation of 16.5% was approximately reached. The load history generated during the experiment was monitored with a load cell of 22 N (rated output ±1.57 mV/V) conditioned with a Futek IPM650 panel mount display (input range up to ±500 mV/V) (Figure 2). An OCT acquisition was performed for each displacement increment. The experiment lasted 6 h.
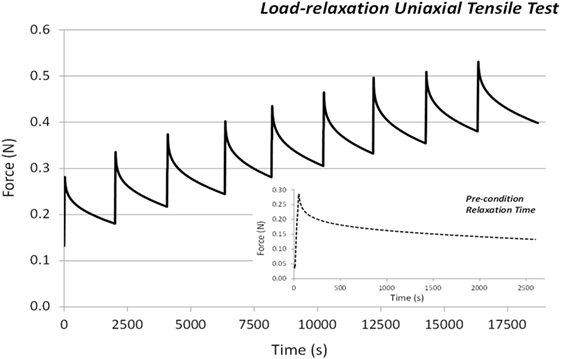
Figure 2. Stepwise stress-relaxation as a function of time and typical behavior of aortic wall in a uniaxial tensile test.
OCT – Acquisition System
For the 3D volume image sequence acquisition, the aortic wall reflectivity measurements were obtained with an OCT system (Thorlabs OCT-TEL220C1) (Figure 1). The system features were as follows: a center wavelength of 1,300 nm, lateral resolution 7 µm, focal length 18 mm, maximum sensitivity range 111 dB (at 5.5 kHz), imaging depth 2.6 mm (in water), axial resolution 4.2 µm in water and 5.5 µm in air, and 5 for A-scan averaging. The PG refractive index is 1.432. Additionally, and during the experiments, the OCT illumination tube was in full-contact with the osmotic solution. About the RB test, the OCT parameters were different for each experiment (Table 2). The OCT acquisition data were saved as TIFF format. The TIFF virtual stack was imported using ImageJ® software. The data were rescaled and converted to eight bits for intensity levels digitalization (Real et al., 2013; Keyes et al., 2016). Finally, the data were exported as RAW image format. With the RAW data, and applying the DVC method, the full-field displacements were measured.
DVC – Assessment of Measurement Performance
The correlation quality (between the reference and deformed configurations) determines the displacement measurements reliability. Moreover, a sufficient contrast is required in order to determine a displacement vector and reduce the measurements uncertainties (Fu et al., 2013; Madi et al., 2013). The full-field measurements of displacement were obtained using DaVis® (LaVision). The software applied the local correlation algorithm (LA-DVC) (Fu et al., 2013; Hild et al., 2013; Keyes et al., 2016). The measurements were acquired with a direct correlation. A sub-volume discretization and multi-pass approach were used to achieve the maximum cross-correlation coefficient and considering the gray-level distributions (Hussein et al., 2012; Fu et al., 2013; Hild et al., 2013; Madi et al., 2013). The reference configuration (f) can be represented by the gray-level function f(x,y,z), and the deformed state (g) as g(x + u,y + v,z + w), where (x,y,z) represents the coordinates and (u,v,w) the offset in each direction. Considering (u,v,w) as the displacement mapping, the continuity of the gray-level can be assumed as f(x,y,z) = g(x + u,y + v,z + w) (Gillard et al., 2014; Keyes et al., 2016). More details about LA-DVC are exposed in the studies by Fu et al. (2013), Madi et al. (2013), and Gillard et al. (2014).
For the RB test, the defined correlation parameters were as follows: a required valid voxel per subset of 40%. Initially, a double-pass approach was defined for various subset sizes (96, 76, 48, 24, and 12 voxels). In the last pass, the final subset size was eight voxels with 75% overlap, and eight passes were applied. For each evaluated subset size and the four increments of displacement (including the reference configuration), three correlations were obtained. About the UT test, the subset size was the only parameter that was modified (128, 96, 64, 32, 16, and 8 voxels). A total of nine correlations were obtained, taking into account the reference configuration (precondition) and the nine defined displacement increments. Moreover, in order to define the different criteria in the reference and deformed states, a sum of differential operation was considered for both experiments. Finally, for each displacement step, the full-field measurements of displacement and strain were obtained. The displacement mean values (MVs), SDs, and the components of the Green–Lagrange strain tensor were calculated with MatLab® after fitting the displacement fields with tricubic functions. The SD defined the measurements of uncertainties of the proposed method.
Results
Optical Effect of Propylene Glycol
Two additional OCT acquisitions were performed in different types of media (air and water). The optical scattering parameters applied were the maximum frequency – and therefore sensitivity – (5.5 kHz) (Choma et al., 2003), the related refractive index per media (1.0 and 1.33, respectively), an FOV of 2 mm × 2 mm × 1.6 mm and a pixel size of 3 µm × 3 µm × 2.64 µm. In comparison with these media, PG obviously improved the contrast, depth capability acquisition, and permitted a full thickness measurement for the aortic wall tissue (Figure 3).
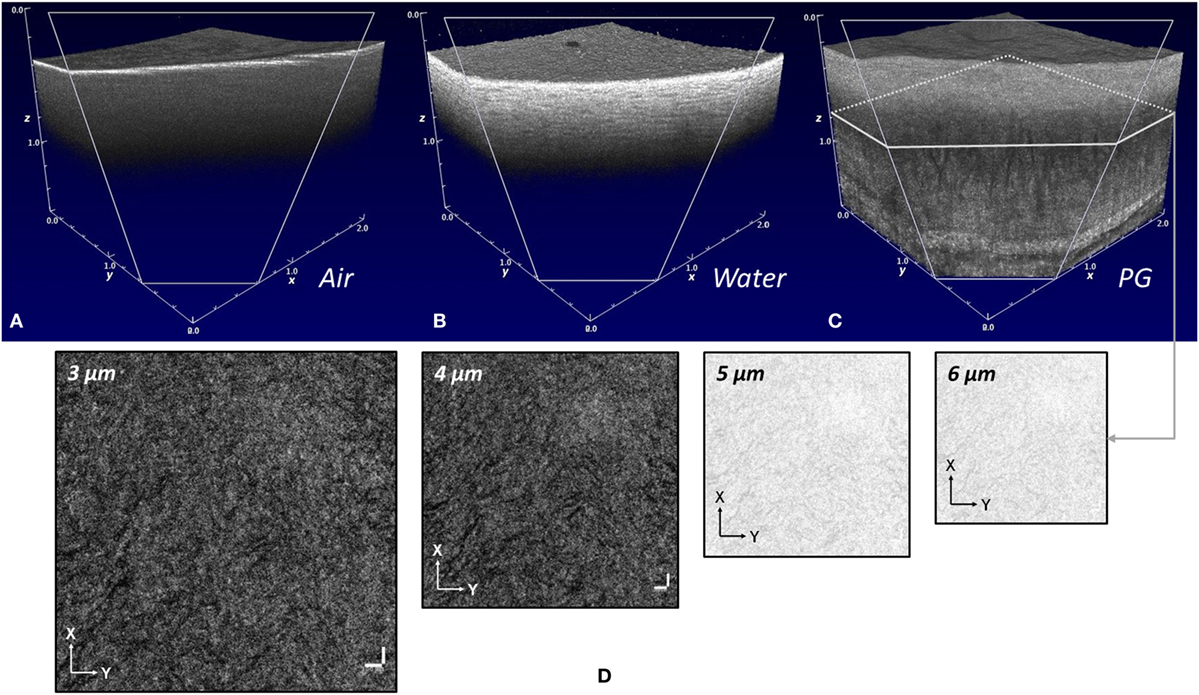
Figure 3. Optical coherence tomography (OCT) measurements on porcine aortic tissue with different types of contrast media. (A) Using air as contrast media. (B) Water as contrast media. (C) Osmotically active solution – propylene glycol. (D) Definition of the spatial resolution with different pixel sizes (e.g., OCT image corresponding to the aortic media layer).
With the tissue clearing technique, a gray level pattern across the aortic wall at different sub-surface levels was obtained. However, a specific attention had to be paid to the voxel size as the spatial resolution worsens when the voxel size increases. We tested voxel sizes from 3 to 6 µm, showing significant effects on the gray-level distributions. Figure 3D shows an example of the obtained images for the same FOV but with voxel size ranging from 3 to 6 µm. Images with voxel size of 3 or 4 µm show highly visible diffraction patterns, whereas the diffraction patterns disappear for larger pixel size. The airy disk radius commonly gives a theoretical limit of the optical resolution, which is inversely proportional to the numerical aperture and proportional to the light wavelength. In the particular case of this OCT set-up, the light wavelength is higher than in classical visible optics and explains this unusual value.
Optimal Settings of OCT-DVC
Subsequently, for each voxel size we performed full-field measurements for the different displacements assigned to the sample during the RB experiment. For the following displacement values: 0.02, 0.04, and 0.06 mm, an error estimate is reported in Table 3. Regarding u displacement (along the X-axis in the OCT B-scans), the difference increased with respect to the experimental values when the displacement increased. These trends were reported by the MV ± SD (Table 3). Case 3 (5 µm voxel size) showed the maximum difference with a relative error of 17% for the first target, 34.5 and 25% for the second and third targets, respectively. The highest correlation was obtained for 6 µm voxel size with relative errors of 8.5% for the first and second targets and 9% for the third one (Figure 4). However, with the lowest SD, the smallest errors were obtained for case 1 (3 µm pixel size) (Table 3).
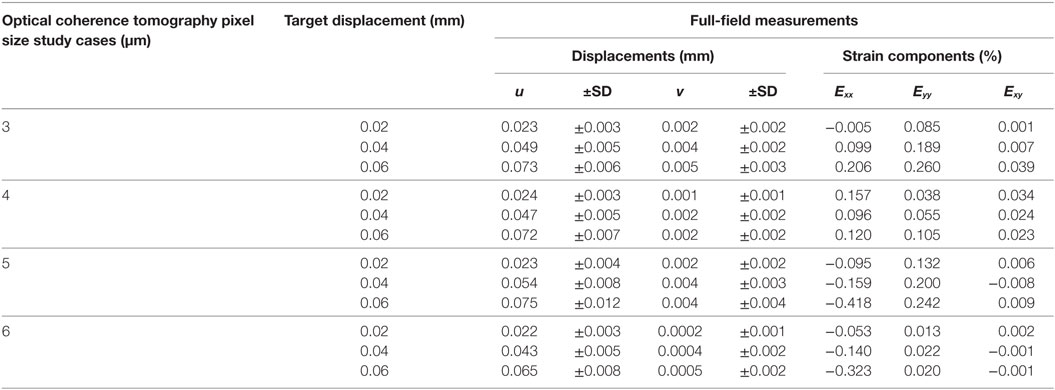
Table 3. Average values derived from full-field measurements for the rigid body translation test.
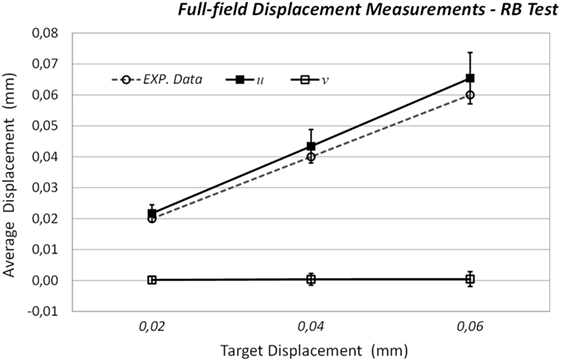
Figure 4. Full-field displacement measurements defined for the rigid body translation test.
In the RB test, a translation was applied only along the X-axis; thus, the displacement fields should be zero for v (corresponding to the Y-axis for the OCT B-scans). As for the u displacement correlations, the difference increases (MV ± SD data) (Table 3). The highest difference was reported for 3 µm voxel size, with relative errors of 0.18, 0.35, and 0.45% (corresponding target displacements). Moreover, the maximum correlation and the minor uncertainties were achieved for 6 µm voxel size, with relative errors of 0.018, 0.040, and 0.045%, respectively (Figure 4). For the aortic wall tissue, and taking into account the full-field displacement measurements, the optimal correlation was enhanced with the 6 µm voxel size.
Additionally, the Green–Lagrange strain components (Exx,Eyy,Exy) were calculated for all cases (Table 3). A null strain was expected across the FOV, as it is the case for a RB test (Fu et al., 2013). The smallest root mean square values were obtained for case 4 (6 µm voxel size).
Uniaxial Tensile Response of a Porcine Aortic Sample Immersed in Propylene Glycol
After determining the optimal acquisition and correlation settings with the RB test, the optical properties and correlation parameters were fixed, and the UT test was carried out (Table 4). In order to involve more information in the 3D image sequence acquisition by tracking constitutive patterns, the FOV size was increased (2 × 3 × 2.31) (Figure 5). According to the experimental setup, the displacement was applied along the Y-axis. For all the loading stages, displacement maps were evaluated using the Davis® software (Figure 6). The vector directions and the displacement gradients showed trends that are characteristics of uniaxial tension. The vector magnitude increased with the loading stages. Artifacts appeared close to the right and to the bottom edges of the FOV; they were caused by a mismatch between the initial FOV and the successive current FOV at each loading stage. These artifacts were filtered out for the further strain reconstructions.
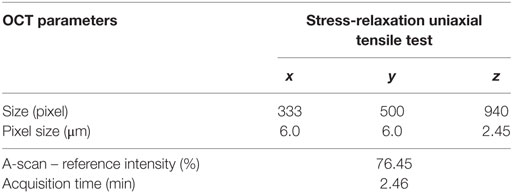
Table 4. Definition of optical coherence tomography (OCT) parameters for the stress-relaxation uniaxial tensile test.
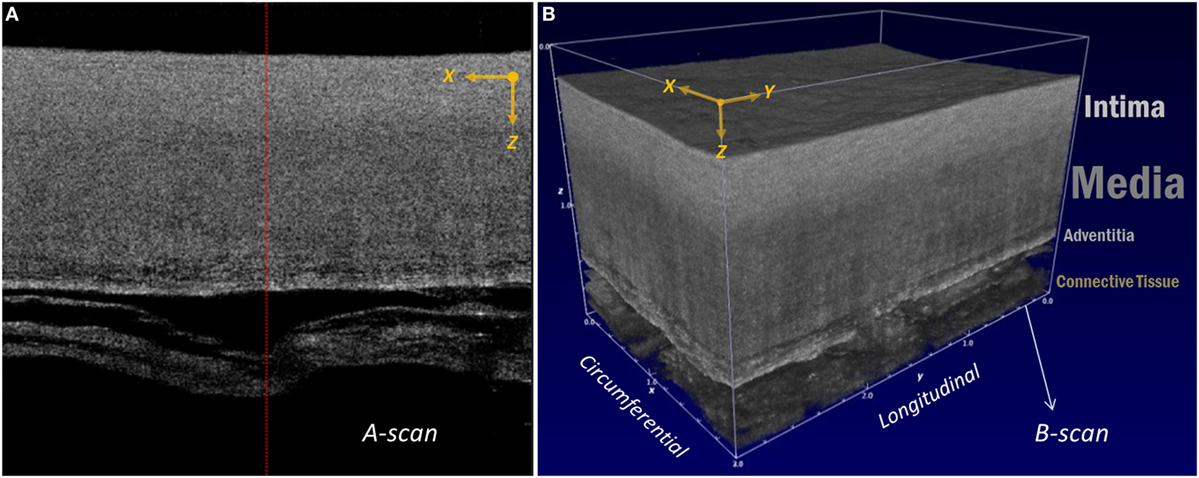
Figure 5. Whole-thickness measurement using the tissue clearing technique and the stress-relaxation uniaxial tensile test. (A) Typical A-scan. (B) three-dimensional image sequence acquisition.
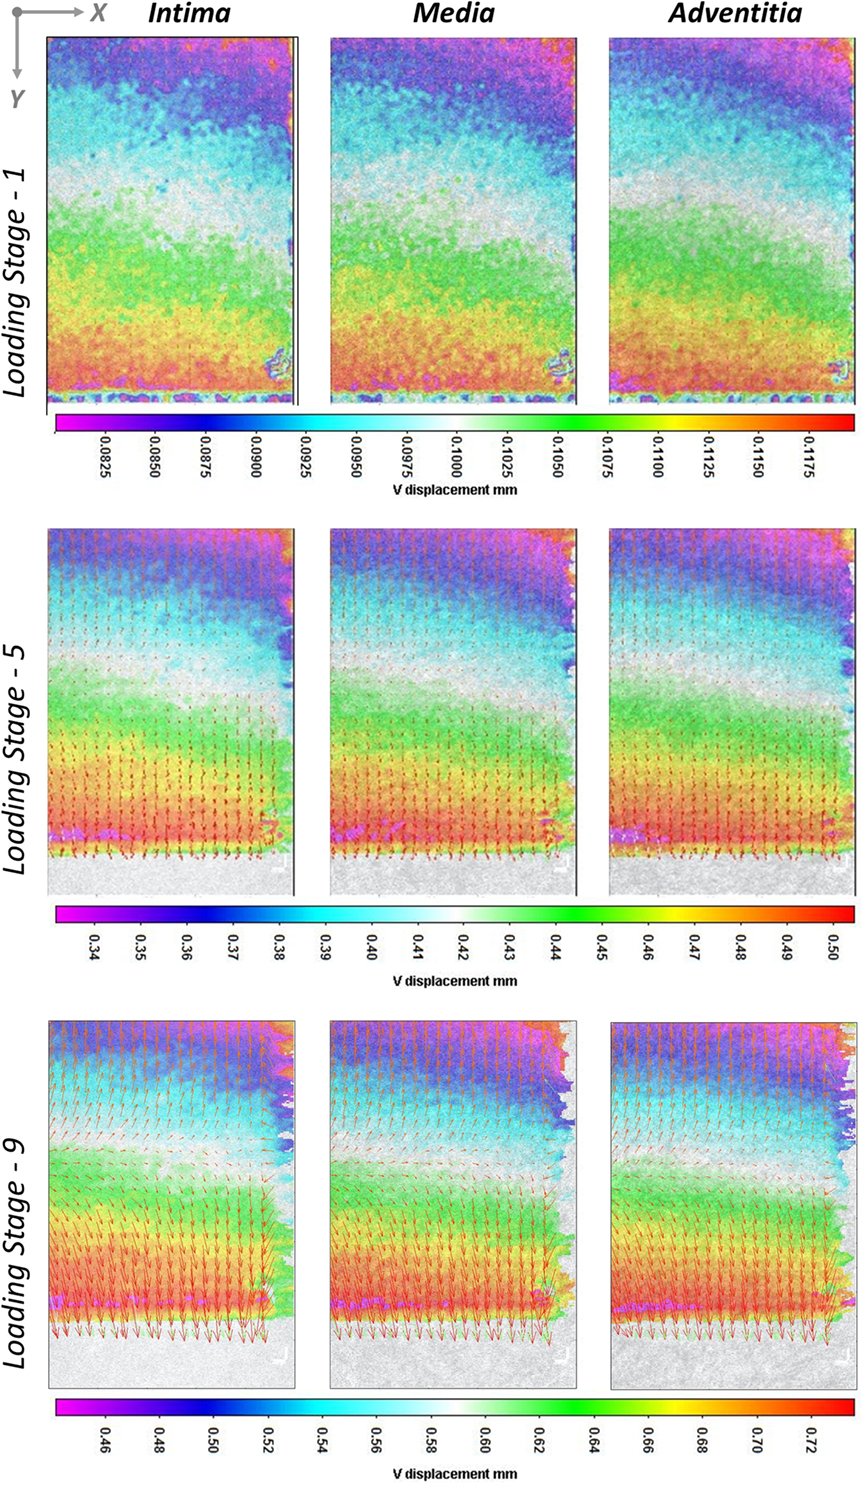
Figure 6. Displacement maps obtained at different aortic layers (intima, media, and adventitia) and for different loading stages. The backgrounds represent the displacement measurements and the vectors display the displacements relative to average.
The six components of the Green-Lagrange strain fields are shown in Figure 7 for the largest deformation (12.64%). The strain fields were reconstructed independently for each layer (intima, media, and adventitia) for comparing their potentially different responses.
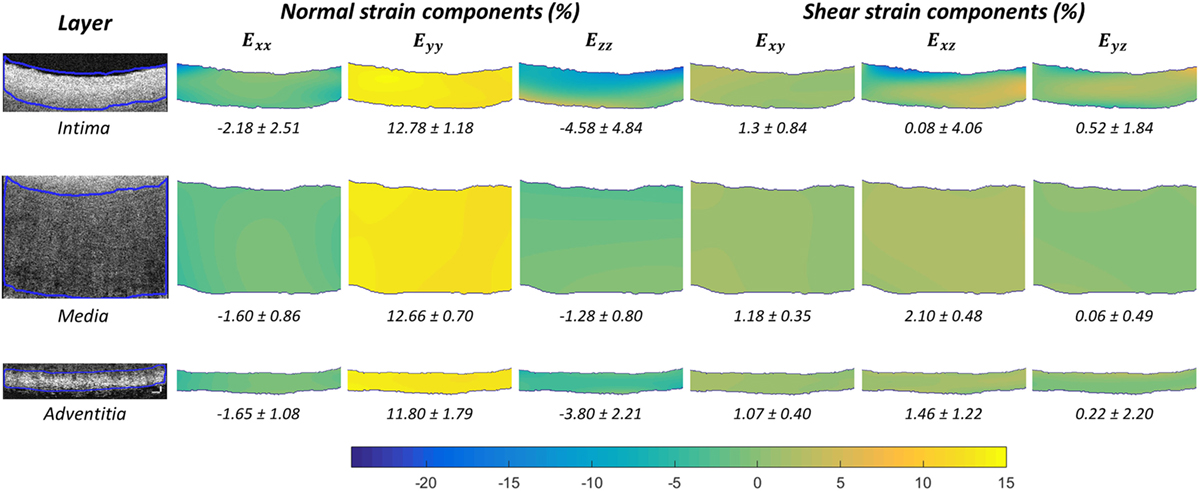
Figure 7. Measured fields of Green-Lagrange strain components for the maximum load in the uniaxial tensile test. The slice corresponds to the field of view middle zone, respect to the Y-axis (optical coherence tomography B-scans).
As expected, the shear strain components (Exy,Exz,Eyz) were significantly lower than their normal counterparts, see average values in Table 5. Regarding the normal strain components (Exx,Eyy,Ezz) and the global behavior of the tissue, the reported data were consistent with strain fields commonly expected in uniaxial tension, see Figure 8. The Eyy values, along the tensile axis, showed a consistent trend with the assigned deformation (Table 5). Regarding the Poisson’s effects, Exx and Ezz reached average absolute strain values of 1.91 and 2.13%, respectively (Table 5). The trace of the strain matrix Exx + Eyy + Ezz, which can be related to the volume change in infinitesimal deformations, constantly increases with the tensile loading and reaches 8% for the final stage. This indicates a significant volume increase, which is not characteristic of the incompressible behavior of soft biological tissue. This must be a consequence of dehydration induced by the immersion in PG.
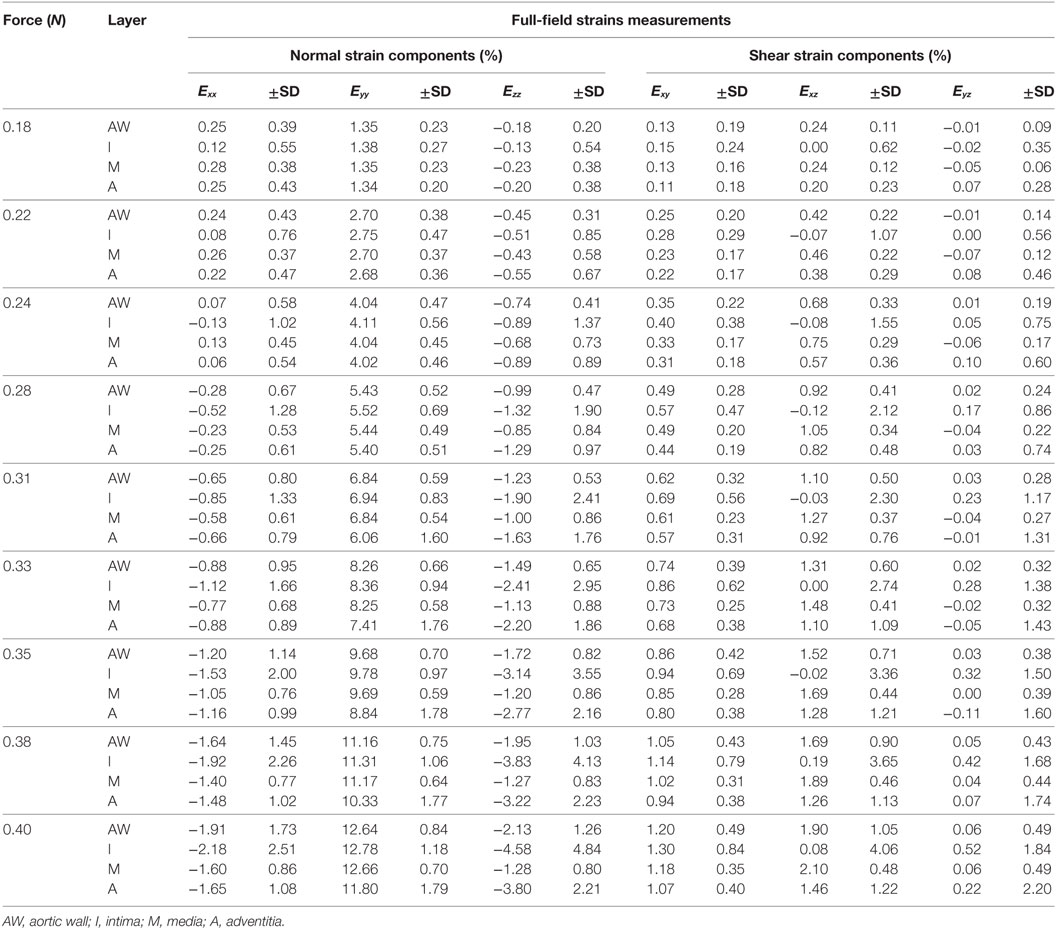
Table 5. Average values derived from full-field measurements for the stress-relaxation uniaxial tensile test.
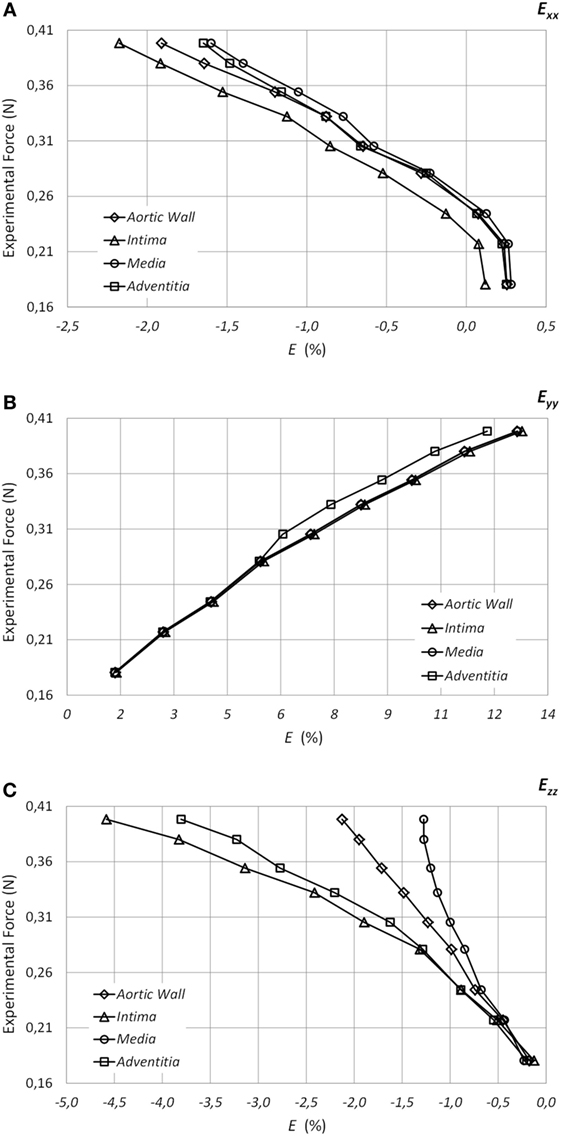
Figure 8. Evolution of the average values of each normal strain components [(A) Exx, (B) Eyy, and (C) Ezz] across the whole aorta and across each aortic layer (intima, media, and adventitia).
The OCT-DVC measured strain fields also revealed major heterogeneities among the different layers of the aorta. Whereas Eyy was rather uniform, Exx and Ezz showed a complex behavior with large compressive values close to the borders (intima and adventitia), see Figure 8. The intima and the adventitia showed the major Poisson’s effect on the mechanical behavior in Ezz with corresponding strains of 4.58 and 3.80%, respectively (which are values expected for a nearly incompressible material). Conversely, the media layer reported a very small Poisson’s effect (strain value of 1.28%) (Table 5). We hypothesize that the swelling effect of the tissue and the osmotic stress generated by the OCAs have a major effect to account for the heterogeneities in the strain distribution.
Discussion
OCT-DVC Is a Suitable Technique to Characterize the Biomechanical Behavior of Porcine Aortas In Vitro
To characterize the uniaxial tensile response across the whole thickness of a porcine aorta, an OCT high-contrast acquisition was required. With the tissue clearing technique, and using the PG as OCA, the scattering properties were improved. The depth capability and the contrast of the images allowed measurements across the full thickness.
Considering the large number of acquisition and processing parameters, the OCT-DVC method must be preliminarily optimized according to the optical properties (contrast and spatial resolution), and the correlation parameters (optimal sub-volume voxel size). Fu et al. applied a stationary and RB test to characterize the OCT-DVC method. The authors defined four different subset sizes to evaluate the spatial resolution and the uncertainties variation. The analysis focused on determining the minimum strain and its corresponding deviation (Fu et al., 2013). However, in the present work, subset size is minimized with a multiscale correlation approach; consequently the spatial resolution – in voxels – is optimized (eight voxels). Ideal correlation conditions were reached directly in the 3D OCT image sequence acquisition (different voxel sizes) and using a RB test. The voxel size was used as a key parameter to reduce the uncertainties of the full-field measurements. The 6 µm voxel size showed the best compromise. A speckle-like noise due to diffraction is visible with high optical resolution: this noise being unstable during loading, it increases the noise on displacement. Increasing the pixel size averages this noise and makes it disappear. Of course, this operation should not average the tissue structure that provides the optical contrast necessary to correlation. Additionally, the OCT acquisitions can be affected by pool surfaces and misalignments (Real et al., 2013).
To study the aortic tissue microstructure at different sub-surface levels, the spatial resolution needed small voxel sizes (OCT acquisition). The correlation can be validated with histological studies (Wang et al., 2001; Wang, 2002; Wang and Elder, 2002). However, for the mechanical characterization of the aortic tissue it was necessary to increase the voxel size to achieve the full-field measurements with the DVC method. Finally, maximum correlation coefficients (CI), which yield the most reliable measures, are obtained for highest degree of similarity in the gray-level distribution (Fu et al., 2013). For the applied loading stages and the aortic layers, CI was reported between 0.7 and 0.9. As the displacement increases, CI became closer to 0.9.
Global Mechanical Effects of Tissue Clearing
It was known that OCAs can change reversibly the light scattering properties of biological tissues (Larin et al., 2012). Nevertheless, the incidence on the mechanical properties needed is still a topic of important research. Lomas et al. (2003) preserved cadaveric skin allografts with these osmotic solutions. The authors observed that a high glycerol concentration did not generate significant detrimental effects on the structure and the biocompatibility properties of the tissue. However, the use of PG as a preservation agent requires further development (Lomas et al., 2003). Ling et al. (2016) studied the effects on elastic properties in tissues fixed and preserved with a proposed Thiel embalming method (fixed between 0 and 6 months). The elastic modulus remained constant during the first month and small fluctuations only appeared after this period. Water, glycol, and salts are the main components of Thiel embalming fluid (Ling et al., 2016). Yeh and Hirshburg (2006) analyzed the molecular interactions for different OCAs. Nonreactive chemical agents, as glycerol, induced a dissociation of collagen fibrils into microfibrils (collagen Type I). However, the effects were reversible structurally and mechanically. The effects on the mechanical properties have been characterized using stress–strain measurements (Yeh and Hirshburg, 2006). Furthermore, Wells et al. (2006) demonstrated that glycerol is also an effective means for optical clearing (immersed condition). This medium protects cleared tissue by increasing its thermal stability and minimizing the mechanical properties alterations. The mechanical changes induced by the glycerol are fully reversible (Wells et al., 2006).
These previous studies needed to be completed by a characterization of the effect of PG effect on the mechanical properties of arteries. For the purpose of the present study, additional experimental tests were considered (immersed stress-relaxation uniaxial tensile tests). Four porcine aortic wall samples were evaluated (41.4 mm × 10 mm × 1.92 ± 0.19 mm). A preconditioning of 5% of deformation was applied followed by 40 min of relaxation. A stress-relaxation ramp was defined with four controlled displacement of 1.4 mm and 30 min of relaxation between each displacement increment. Approximately, 0.18 strain was reached during the test. One sample was tested with the immersion protocol defined in the present work [osmotically active solution of 85% (v/v) PG in PBS]. Once the experiment was completed, the sample was relaxed in PBS (1 h) to recover and preserve the physiological conditions of the tissue (Acosta Santamaría et al., 2013). After that, to evaluate the structurally and mechanically reversible effect of the OCA, an additional test was carried out using the same sample but a different immersion media (PBS). The immersion order was inverted for the second sample, first PBS and subsequently the PG (PBS-PG). Finally, two control samples were tested on air (without immersion media). To avoid tissue dehydration during these tests, an ultrasonic humidifier was used (Peña et al., 2015). For each experiment, the reported forces at the maximum relaxation periods were used to define the stress–strain values (Figure 9).
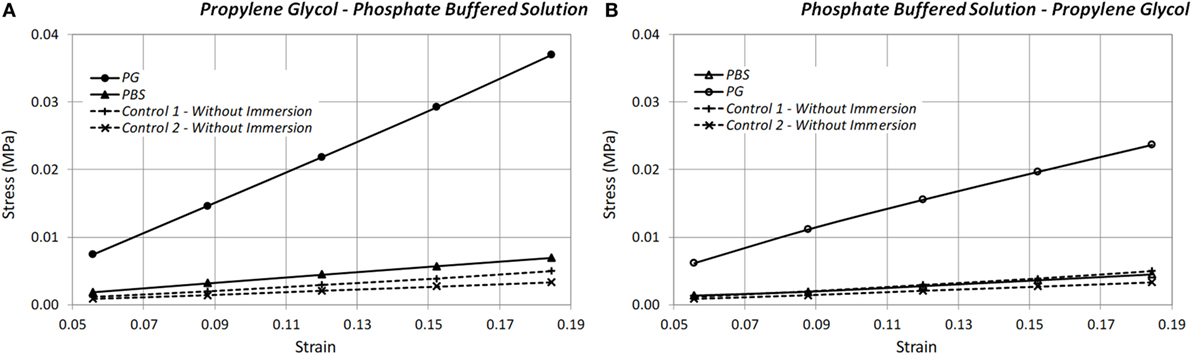
Figure 9. Stress–strain curves under two different immersion protocols and for stress-relaxation uniaxial tensile tests. (A) First protocol: immersion in propylene glycol (PG) and a subsequent immersion in phosphate buffered saline (PBS). (B) Second protocol: immersion in PBS and a subsequent immersion in PG.
For the control samples, the linear elastic moduli were 0.03 and 0.02 MPa (control 1 and control 2, respectively). Considering the exposed immersion cases, and with respect to the control samples, the PG increases the elastic modulus of the tissue. The elastic modulus MV was increased by a factor of 0.13 (PG = 0.183 MPa). Also, the modulus was increased by 28.70%, using the PBS as an immersion media (PBS = 0.032 MPa). The reversible effect was demonstrated by evaluating the mechanical behavior of the tissue immersed in different media (PG and PBS) (Figure 9). In addition, the stress-relaxation test was applied to evaluate the viscoelastic behavior of the tissue. Wang et al. (2016) reported for the aortic tissue the dynamic elastic modulus (0.039 ± 0.01 MPa). This result validates the reported data for the controls and the samples immersed in PBS.
The obtained results open a discussion on the incidence of the hyperosmotic agents in the mechanical properties of the evaluated tissue. For collagen-based tissues, the relationship between the OCAs and the tissue swelling effect could involve a change in the supramolecular structure. Additionally, due to the induction of osmotic stress, a high concentration of the hyperosmotic agents can induce cell apoptosis, local hemostasis, and/or tissue necrosis (Larin et al., 2012). Therefore, it is relevant to define an appropriate OCA concentration to minimize its impact on the tissue structure and define optical scattering properties (Sudheendran et al., 2011).
Local Mechanical Effects of Tissue Clearing Revealed by OCT-DVC
The full-field measurements performed on the aortic wall immersed in PG highlight the complexity of the different effects induced by tissue clearing. The biomechanical behavior of arterial walls is known to be complex and anisotropic due to its fibrous nature (elastin and collagen) and due to its layered structure (intima, media, and adventitia). An original aspect of the local mechanical behavior revealed by OCT-DVC was the heterogeneity of Poisson’s effects across the thickness. The intima and the adventitia showed the major Poisson’s effect on the mechanical behavior in Ezz with corresponding strains of 4.58 and 3.80%, respectively (which are values expected for a nearly incompressible material). Conversely, the media layer reported a very small Poisson’s effect (strain value of 1.28%).
Measuring strains in the through-thickness direction is something completely original for arteries tested in vitro. Peña et al. (2015) reported the thickness ratios (layer thickness to total wall thickness) for the adventitia, media, and intima layers (0.33, 0.50, and 0.15, respectively) of distal porcine aorta. With the clearing technique used in the present work, we could track the thickness variations of each layer under tensile conditions (Figure 10). However, tracking thickness variations does not permit to evaluate the transverse strains with enough accuracy, showing that strain measurements obtained with OCT-DVC, as reported in Table 5, have a strong potential for characterizing through-thickness deformations in arteries.
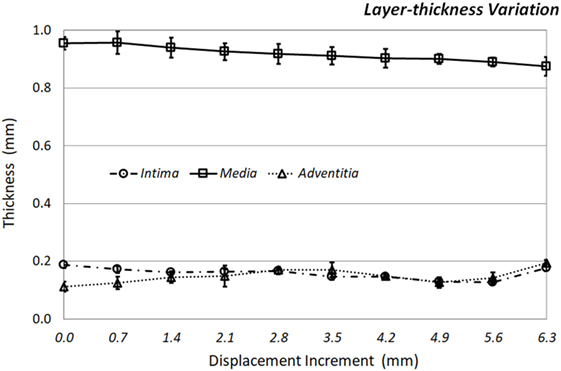
Figure 10. Aortic layer-thickness variation during the uniaxial tensile test immersed in propylene glycol.
Limitations and Future Work
Numerous improvements can still be considered to the proposed methodology and to the characterization of mechanical effects of PG. The FOV may be increased to involve more information of the tissue structure (tracking patterns). Lesions could also be artificially induced in the tissue with enzymes such as collagenase or elastase to study how PG affects independently collagen and/or elastin fibers. Lomas et al. (2003) have already established that PG was compatible with collagenase digestion. Finally, we observed that the effect of PG induced dehydration had a stringer impact on the Poisson’s effect of the media layer. Further work should be conducted on how the smooth muscle cells highly present in the media layer are affected by PG immersion for a better understanding of these effects.
Conclusion
In this paper, we have developed and evaluated a novel methodology to characterize the mechanical response of porcine or human aortas in vitro at different sub-surface levels and with a sub-millimeter spatial resolution. The technique relies on OCT-DVC and requires the use of a tissue clearing agent, namely propylene glycol. Tissue dehydration caused by immersion in propylene glycol induced interesting mechanical effects revealed by OCT-DVC, such as a heterogeneous Poisson’s effect across the layers of the aorta. It is still necessary to understand the effect of the immersion on the mechanical behavior of major components of the tissue such as elastin, collagen, and smooth muscle cells for potential future applications of the methodology.
Ethics Statement
The present study used animal tissue supplied by the Veterinary School of Lyon (Institut Claude Bourgelat – Investigation Pré-Clinique, Biomedicale et Analytique – http://icbl.vetagro-sup.fr/) which performed the excision. The animals were sacrificed for the purpose of other studies, and the porcine aortic wall was donated for the goal of the present work.
Author Contributions
All the authors were fully involved in the study and preparation of the manuscript. All the authors have made substantial contributions to all of the following: (1) the conception and design of the study, acquisition of data, analysis, and interpretation of data, (2) revising the article critically for important intellectual content, and (3) final approval of the version to be submitted.
Conflict of Interest Statement
The authors declare that the research was conducted in the absence of any commercial or financial relationships that could be construed as a potential conflict of interest.
Acknowledgments
The authors are grateful to the European Research Council for grant ERC-2014-CoG BIOLOCHANICS.
References
Acosta Santamaría, V. A., García Aznar, J. M., Ochoa, I., and Doblare, M. (2013). Effect of sample pre-contact on the experimental evaluation of cartilage mechanical properties. Exp. Mech. 53, 911–917. doi: 10.1007/s11340-012-9698-x
Alibhai, A. Y., Moult, E. M., Shahzad, R., Rebhun, C. B., Moreira-Neto, C., McGowan, M., et al. (2017). Quantifying microvascular changes using OCT angiography in diabetic eyes without clinical evidence of retinopathy. Ophthalmol. Retin. doi:10.1016/j.oret.2017.09.011
Boppart, S. A., Herrmann, J., Pitris, C., Stamper, D. L., Brezinski, M. E., and Fujimoto, J. G. (1999). High-resolution optical coherence tomography-guided laser ablation of surgical tissue. J. Surg. Res. 82, 275–284. doi:10.1006/jsre.1998.5555
Bouterf, A., Roux, S., Hild, F., Adrien, J., Maire, E., and Meille, S. (2014). Digital volume correlation applied to X-ray tomography images from spherical indentation tests on lightweight gypsum. Strain 50, 444–453. doi:10.1111/str.12101
Brezinski, M. E., Tearney, G. J., Bouma, B. E., Izatt, J. A., Hee, M. R., Swanson, E. A., et al. (1996). Optical coherence tomography for optical biopsy. Circulation 93, 1206–1213. doi:10.1161/01.CIR.93.6.1206
Choma, M. A., Sarunic, M. V., Yang, C., and Izatt, J. (2003). Sensitivity advantage of swept source and Fourier domain optical coherence tomography. Opt. Express 11, 2183–2189. doi:10.1364/OE.11.002183
Dao Luong, M. N., Shimada, Y., Turkistani, A., Tagami, J., Sumi, Y., and Sadr, A. (2016). Fractography of interface after microtensile bond strength test using swept-source optical coherence tomography. Dent. Mater. 32, 862–869. doi:10.1016/j.dental.2016.03.019
Fu, J., Pierron, F., and Ruiz, P. D. (2013). Elastic stiffness characterization using three-dimensional full-field deformation obtained with optical coherence tomography and digital volume correlation. J. Biomed. Opt. 18, 121512. doi:10.1117/1.JBO.18.12.121512
Genovese, K., and Humphrey, J. D. (2015). Multimodal optical measurement in vitro of surface deformations and wall thickness of the pressurized aortic arch. J. Biomed. Opt. 20, 046005. doi:10.1117/1.JBO.20.4.046005
Gillard, F., Boardman, R., Mavrogordato, M., Hollis, D., Sinclair, I., Pierron, F., et al. (2014). The application of digital volume correlation (DVC) to study the microstructural behaviour of trabecular bone during compression. J. Mech. Behav. Biomed. Mater. 29, 480–499. doi:10.1016/j.jmbbm.2013.09.014
Hild, F., Roux, S., Bernard, D., Hauss, G., and Rebai, M. (2013). “On the use of 3D images and 3D displacement measurements for the analysis of damage mechanisms in concrete-like materials,” in 8th International Conference on Fracture Mechanics of Concrete and Concrete Structures, Toledo.
Huang, Y.-P., Zheng, Y.-P., Wang, S.-Z., Chen, Z.-P., Huang, Q.-H., and He, Y.-H. (2009). An optical coherence tomography (OCT)-based air jet indentation system for measuring the mechanical properties of soft tissues. Meas. Sci. Technol. 20, 1–11. doi:10.1088/0957-0233/20/1/015805
Hussein, A. I., Barbone, P. E., and Morgan, E. F. (2012). Digital volume correlation for study of the mechanics of whole bones. Procedia IUTAM 4, 116–125. doi:10.1016/j.piutam.2012.05.013
Jia, Y., Bailey, S. T., Hwang, T. S., McClintic, S. M., Gao, S. S., Pennesi, M. E., et al. (2015). Quantitative optical coherence tomography angiography of vascular abnormalities in the living human eye. Proc. Natl. Acad. Sci. U.S.A. 112, E2395–E2402. doi:10.1073/pnas.1500185112
Keyes, S. D., Gillard, F., Soper, N., Mavrogordato, M. N., Sinclair, I., and Roose, T. (2016). Mapping soil deformation around plant roots using in vivo 4D X-ray computed tomography and digital volume correlation. J. Biomech. 49, 1802–1811. doi:10.1016/j.jbiomech.2016.04.023
Khan, M. H., Choi, B., Chess, S., Kelly, K. M., McCullough, J., and Nelson, J. S. (2004). Optical clearing of in vivo human skin: implications for light-based diagnostic imaging and therapeutics. Lasers Surg. Med. 34, 83–85. doi:10.1002/lsm.20014
Korhonen, R. K., Laasanen, M. S., Töyräs, J., Rieppo, J., Hirvonen, J., Helminen, H. J., et al. (2002). Comparison of the equilibrium response of articular cartilage in unconfined compression, confined compression and indentation. J. Biomech. 35, 903–909. doi:10.1016/S0021-9290(02)00052-0
Larin, K. V., Ghosn, M. G., Bashkatov, A. N., Genina, E. A., Trunina, N. A., and Tuchin, V. V. (2012). Optical clearing for OCT image enhancement and in-depth monitoring of molecular diffusion. IEEE J. Sel. Top. Quantum Electron. 18, 1244–1259. doi:10.1109/JSTQE.2011.2181991
Larina, I. V., Carbajal, E. F., Tuchin, V. V., Dickinson, M. E., and Larin, K. V. (2008). Enhanced OCT imaging of embryonic tissue with optical clearing. Laser Phys. Lett. 5, 476–479. doi:10.1002/lapl.200810019
Leclerc, H., Périé, J.-N., Roux, S., and Hild, F. (2011). Voxel-scale digital volume correlation. Soc. Exp. Mech. 51, 479–490. doi:10.1007/s11340-010-9407-6
Li, C., Guan, G., Reif, R., Huang, Z., and Wang, R. K. (2012). Determining elastic properties of skin by measuring surface waves from an impulse mechanical stimulus using phase-sensitive optical coherence tomography. J. R. Soc. Interface 9, 831–841. doi:10.1098/rsif.2011.0583
Liba, O., SoRelle, E. D., Sen, D., and de la Zerda, A. (2016). Contrast-enhanced optical coherence tomography with picomolar sensitivity for functional in vivo imaging. Sci. Rep. 6, 23337. doi:10.1038/srep23337
Ling, Y., Li, C., Feng, K., Duncan, R., Eisma, R., Huang, Z., et al. (2016). Effects of fixation and preservation on tissue elastic properties measured by quantitative optical coherence elastography (OCE). J. Biomech. 49, 1009–1015. doi:10.1016/j.jbiomech.2016.02.013
Liu, L., and Morgan, E. F. (2007). Accuracy and precision of digital volume correlation in quantifying displacements and strains in trabecular bone. J. Biomech. 40, 3516–3520. doi:10.1016/j.jbiomech.2007.04.019
Lomas, R. J., Cruse-Sawyer, J. E., Simpson, C., Ingham, E., Bojar, R., and Kearney, J. N. (2003). Assessment of the biological properties of human split skin allografts disinfected with peracetic acid and preserved in glycerol. Burns 29, 515–525. doi:10.1016/S0305-4179(03)00137-2
Madi, K., Tozzi, G., Zhang, Q. H., Tong, J., Cossey, A., Au, A., et al. (2013). Computation of full-field displacements in a scaffold implant using digital volume correlation and finite element analysis. Med. Eng. Phys. 35, 1298–1312. doi:10.1016/j.medengphy.2013.02.001
Mahdian, M., Salehi, H. S., Lurie, A. G., Yadav, S., and Tadinada, A. (2016). Tissue characterization using optical coherence tomography and cone beam computed tomography: a comparative pilot study. Oral Surg. Oral Med. Oral Pathol. Oral Radiol. 122, 98–103. doi:10.1016/j.oooo.2016.03.021
Matsumoto, T., Fukui, T., Tanaka, T., Ikuta, N., Ohashi, T., Kumagai, K., et al. (2009). Biaxial tensile properties of thoracic aortic aneurysm tissues. J. Biomech. Sci. Eng. 4, 518–529. doi:10.1299/jbse.4.518
Nebelung, S., Brill, N., Müller, F., Tingart, M., Pufe, T., Merhof, D., et al. (2016). Towards optical coherence tomography-based elastographic evaluation of human cartilage. J. Mech. Behav. Biomed. Mater. 56, 106–119. doi:10.1016/j.jmbbm.2015.11.025
Palanca, M., Tozzi, G., and Cristofolini, L. (2016). The use of digital image correlation in the biomechanical area: a review. Int. Biomech. 3, 1–21. doi:10.1080/23335432.2015.1117395
Pancrazio, J. J., Wang, F., and Kelley, C. A. (2007). Enabling tools for tissue engineering. Biosens. Bioelectron. 22, 2803–2811. doi:10.1016/j.bios.2006.12.023
Peña, J. A., Martínez, M. A., and Peña, E. (2015). Layer-specific residual deformations and uniaxial and biaxial mechanical properties of thoracic porcine aorta. J. Mech. Behav. Biomed. Mater. 50, 55–69. doi:10.1016/j.jmbbm.2015.05.024
Prati, F., Regar, E., Mintz, G. S., Arbustini, E., Di Mario, C., Jang, I. K., et al. (2010). Expert review document on methodology, terminology, and clinical applications of optical coherence tomography: physical principles, methodology of image acquisition, and clinical application for assessment of coronary arteries and atherosclerosis. Eur. Heart J. 31, 401–415. doi:10.1093/eurheartj/ehp433
Proskurin, S. G., and Meglinski, I. V. (2007). Optical coherence tomography imaging depth enhancement by superficial skin optical clearing. Laser Phys. Lett. 4, 824–826. doi:10.1002/lapl.200710056
Puhakka, P. H., te Moller, N. C. R., Afara, I. O., Mäkelä, J. T. A., Tiitu, V., Korhonen, R. K., et al. (2015). Estimation of articular cartilage properties using multivariate analysis of optical coherence tomography signal. Osteoarthr. Cartil. 23, 2206–2213. doi:10.1016/j.joca.2015.05.034
Real, E., Eguizabal, A., Pontón, A., Díez, M. C., Fernando Val-Bernal, J., Mayorga, M., et al. (2013). Optical coherence tomography assessment of vessel wall degradation in thoracic aortic aneurysms. J. Biomed. Opt. 18, 126003. doi:10.1117/1.JBO.18.12.126003
Rogowska, J., Patel, N. A., Fujimoto, J. G., and Brezinski, M. E. (2004). Optical coherence tomographic elastography technique for measuring deformation and strain of atherosclerotic tissues. Heart 90, 556–562. doi:10.1136/hrt.2003.016956
Schmitt, J. M., Knüttel, A., Yadlowsky, M., and Eckhaus, M. A. (1994). Optical-coherence tomography of a dense tissue: statistics of attenuation and backscattering. Phys. Med. Biol. 39, 1705–1720. doi:10.1088/0031-9155/39/10/013
Shimamura, Y., Murayama, R., Kurokawa, H., Miyazaki, M., Mihata, Y., and Kmaguchi, S. (2011). Influence of tooth-surface hydration conditions on optical coherence-tomography imaging. J. Dent. 39, 572–577. doi:10.1016/j.jdent.2011.06.004
Sudheendran, N., Mohamed, M., Ghosn, M. G., Tuchin, V. V., and Larin, K. V. (2011). Assessment of tissue optical clearing as a function of glucose concentration using optical coherence tomography. J. Innov. Opt. Health Sci. 3, 169–176. doi:10.1142/S1793545810001039
Trabelsi, O., Davis, F. M., Rodriguez-Matas, J. F., Duprey, A., and Avril, S. (2015). Patient specific stress and rupture analysis of ascending thoracic aneurysms. J. Biomech. 48, 1836–1843. doi:10.1016/j.jbiomech.2015.04.035
Tucker-Schwartz, J., and Skala, M. (2012). Contrast Enhancement in Optical Coherence Tomography. SPIE Newsroom Biomedical Optics & Medical Imaging, 2–4. doi:10.1117/2.1201212.004626
Tucker-Schwartz, J. M., Meyer, T. A., Patil, C. A., Duvall, C. L., and Skala, M. C. (2012). In vivo photothermal optical coherence tomography of gold nanorod contrast agents. Biomed. Opt. Exp. 3, 2881. doi:10.1364/BOE.3.002881
Wang, R. K. (2002). “Tissue clearing as a tool to enhance imaging capability for optical coherence tomography”, in Proc. SPIE 4619, Coherence Domain Optical Methods in Biomedical Science and Clinical Applications VI. doi:10.1117/12.470494
Wang, R. K., and Elder, J. B. (2002). Propylene glycol as a contrasting agent for optical coherence tomography to image gastrointestinal tissues. Lasers Surg. Med. 30, 201–208. doi:10.1002/lsm.10013
Wang, R. K., Xiangqun, X., Tuchin, V. V., Elder, J. B., Xu, X., Tuchin, V. V., et al. (2001). Concurrent enhancement of imaging depth and contrast for optical coherence tomography by hyperosmotic agents. J. Opt. Soc. Am. B 18, 948–953. doi:10.1364/JOSAB.18.000948
Wang, Z., Golob, M. J., and Chesler, N. C. (2016). “Viscoelastic properties of cardiovascular tissues,” in Viscoelastic and Viscoplastic Materials (InTech). doi:10.5772/64169
Wells, P. B., Yeh, A. T., and Humphrey, J. D. (2006). Influence of glycerol on the mechanical reversibility and thermal damage susceptibility of collagenous tissues. IEEE Trans. Biomed. Eng. 53, 747–753. doi:10.1109/TBME.2006.870232
Welzel, J. (2001). Optical coherence tomography in dermatology: a review. Skin Res. Technol. 7, 1–9. doi:10.1034/j.1600-0846.2001.007001001.x
Williamson, J. P., McLaughlin, R. A., Noffsinger, W. J., James, A. L., Baker, V. A., Curatolo, A., et al. (2011). Elastic properties of the central airways in obstructive lung diseases measured using anatomical optical coherence tomography. Am. J. Respir. Crit. Care Med. 183, 612–619. doi:10.1164/rccm.201002-0178OC
Yabushita, H., Bouma, B. E., Houser, S. L., Aretz, H. T., Jang, I. K., Schlendorf, K. H., et al. (2002). Characterization of human atherosclerosis by optical coherence tomography. Circulation 106, 1640–1645. doi:10.1161/01.CIR.0000029927.92825.F6
Yang, Y., Bagnaninchi, P. O., Ahearne, M., Wang, R. K., and Liu, K.-K. (2007). A novel optical coherence tomography-based micro-indentation technique for mechanical characterization of hydrogels. J. R. Soc. Interface 4, 1169–1173. doi:10.1098/rsif.2007.1044
Yang, Y., Dubois, A., Qin, X., Li, J., El Haj, A., and Wang, R. K. (2006). Investigation of optical coherence tomography as an imaging modality in tissue engineering. Phys. Med. Biol. 51, 1649–1659. doi:10.1088/0031-9155/51/7/001
Yeh, A. T., and Hirshburg, J. (2006). Molecular interactions of exogenous chemical agents with collagen – implications for tissue optical clearing. J. Biomed. Opt. 11, 14003. doi:10.1117/1.2166381
Keywords: aortic wall, optical coherence tomography, digital volume correlation, tissue clearing technique, uniaxial tensile test
Citation: Acosta Santamaría VA, Flechas García M, Molimard J and Avril S (2018) Three-Dimensional Full-Field Strain Measurements across a Whole Porcine Aorta Subjected to Tensile Loading Using Optical Coherence Tomography–Digital Volume Correlation. Front. Mech. Eng. 4:3. doi: 10.3389/fmech.2018.00003
Received: 28 August 2017; Accepted: 02 February 2018;
Published: 05 March 2018
Edited by:
Gianluca Tozzi, University of Portsmouth, United KingdomReviewed by:
Hari Arora, Imperial College London, United KingdomBrian Bay, Oregon State University, United States
Pablo Daniel Ruiz, Loughborough University, United Kingdom
Copyright: © 2018 Acosta Santamaría, Flechas García, Molimard and Avril. This is an open-access article distributed under the terms of the Creative Commons Attribution License (CC BY). The use, distribution or reproduction in other forums is permitted, provided the original author(s) and the copyright owner are credited and that the original publication in this journal is cited, in accordance with accepted academic practice. No use, distribution or reproduction is permitted which does not comply with these terms.
*Correspondence: Víctor A. Acosta Santamaría, dmljdG9yLmFjb3N0YUBlbXNlLmZy