 Oriol Rios
 Mario Miguel Valero
 Elsa Pastor
 Eulàlia Planas
- Department of Chemical Engineering, Centre for Technological Risk Studies, Universitat Politècnica de Catalunya, Barcelona, Spain
While full-physics fire models continue to be unsuitable for wildfire emergency situations, the so-called operational fire spread simulators are incapable of providing accurate estimations of the macroscopic fire behavior while quickly reacting to a change of governing spread mechanisms. A promising approach to overcome these limitations are data-driven simulators, which assimilate observed data with the aim of improving their forecast with affordable computation times. Although preliminary results obtained by several data-driven simulators are promising, this scheme needs intensive validation. Detailed studies of the particular aspects related to data assimilation are essential to gain insight about the applicability of this approach to operational wildfire simulation. This paper presents the validation of the simulator presented in Rios et al. (2014b, 2016, 2018) with a large scenario of real complexity with intricate terrain. The study case corresponds to a wildfire of significant repercussions occurred in Catalonia in March 2014. We employed as reference data the event reconstruction performed by the Catalan Fire Service and validated with operational observations. Detailed information about fuel and meteorology was collected by the fire brigades and allowed reconstructing the fire development with Farsite, a widely employed simulator. Subsequently, our simulator was tested without a detailed description of the fuel and wind parameters, i.e., imitating its intended deployment conditions. It proved capable of automatically estimating them and correctly simulating the fire spread. Additionally, the effect of the assimilation window on the forecast accuracy was analyzed. These results showed that the simulator is able to correctly handle complex terrain and wind situations to successfully deliver a short-term fire-front forecast in those real and complex scenarios.
1. Introduction
Wildfires are a global phenomenon that have a dramatic impact in terms of human lives, property, and environmental losses. Moreover, they exhibit an increasing trend in both burned area and fire severity. In order to face them, better tools to tackle and envisage fire propagation are required. Fire spread is determined by a number of physico-chemical phenomena intimately interconnected. The complex mathematical description of these underlying phenomena has prevented, so far, scientists from successfully modeling forest fire spread with acceptable computation resources and meaningful lead times. Simulators based on Computational Fluid Dynamics require hardware and computing times far beyond the current available capacity. Consequently, operational fire spread simulation is, at present, performed using semi-empirical models (e.g., Rothermel's, 1972) that are highly sensitive to input parameter's uncertainty and thus, cannot be applied universally. The expectable heterogeneities in fuel, terrain, and wind properties, added to the intrinsic difficulty to measure such parameters in a wildfire scenario, usually lead to an important decrease in the accuracy of these models.
To address this issue, Mandel et al. (2009) pioneered the application of data assimilation concepts into the wildfire modeling problem by using Kalman filters to assimilate fire locations and predict flame temperature using an atmosphere-coupled wildfire model. While the results were promising they also raised concerns on spurious fire corrections and the needed computing time. Following those ideas, Rochoux et al. (2014a,b, 2015) implemented a data-driven system based on a level-set description of Rothermel (1972) model and studied the difference between parameters and state assimilations. The system was further used in an interesting application to reproduce the front location of a three-hectare field-scale tests (Zhang et al., 2018) and a simulation recreating of a medium-scale (800 x 400 m) wildfire test (Zhang et al., 2017). The later case used a spatially-distributed parameter estimation to tackle the issue of spatial heterogeneity of the resolved parameters. Despite the strategy showed improved capacity to reproduce observations, the extrapolation to forecast application is not clear as assimilated parameters remain valid on their pre-stated observables region.
In parallel to those developments, we explored a data-driven system based on marker-tracking implementation of Rothermel model (Rios et al., 2014b, 2016). This tool integrates data assimilation techniques in order to calibrate a semi-empirical fire behavior model on-line. By matching modeled and observed fire evolution, fuel and wind properties are estimated and periodically updated. In addition to the observed fire spread, our simulator accounts for terrain and spatially distributed wind. For the terrain interaction, Digital Elevation Model maps (DEM) are used to compute the Rate of Spread corrected by slope projection according to Rothermel's model (Rothermel, 1972). For the wind input, we considered high-resolution simulated wind fields that interact with the fire spread according to the correction of Rothermel's model proposed by André and Gonçalves (2013). Additionally, wind fields that account for topography are generated with WindNinja (Forthofer et al., 2009; Wagenbrenner et al., 2016). This software projects overall values of wind speed and direction onto the DEM in order to output a detailed wind field at low height (1.5 m in our case).
A significant drawback of the computation of high-resolution topographic wind fields is its high computational cost. For instance, a 800 x 800 cell domain needs about 20 min to be resolved in a single core machine. Recent works conducted by Sanjuan et al. (2016a,b,c) made use of advanced parallelization computing techniques to reduce this time to the order of several minutes using multicore machines. However, those are still unaffordable times in a data-driven approach where hundreds of iterations are typically required. As the wind speed and direction are part of the key parameters to be resolved by the assimilation process, every time that a new parameter set is estimated, the wind field needs to be updated. In order to work around this limitation, our modeling system integrates the interpolation approach described in Rios et al. (2018). This strategy makes use of a set of pre-run wind field maps within the fire domain and all new values of wind magnitude and direction are automatically interpolated. This approach allows delivering updated maps with low computational time (in the order of 1E-3 seconds).
After the correct validation of the concept with flat experiments (Rios et al., 2016), this data-driven modeling system needs validation against a case as close as possible to real wildfire conditions. In order to be applied in a real fire scenario, our simulator should ideally be coupled with a real-time fire monitoring system. Previous studies have proposed intelligent computer vision algorithms to process aerial infrared imagery automatically with this purpose (Valero M. et al., 2017; Valero M. M. M. et al., 2017; Valero et al., 2018). However, there is at present no airborne system that can be deployed operationally to track the fire perimeter in real time with a high temporal resolution. Currently, quantitative information about the fire spread is usually limited to scattered observations of the approximate fire front positions at temporal resolutions in the order of hours. We overcame this difficulty using the simulated reconstruction of a recent wildfire, which had been previously validated, as synthetically observed fire evolution. The usage of reconstruction data implies that the validation is not performed on the overall system but on the assimilation step and capacity to reproduce a set of fire perimeter with a given initialization data. Whereas, the validation of the whole system is needed (with real data usage), this particular validation of the assimilation step can also be useful to detect weaknesses and strengths while enabling the further upgrade of the embedded fire spread model while keeping the overall system unchanged.
This paper presents the validation of the simulator presented in Rios et al. (2014b, 2016, 2018) in a large-scale wildfire scenario of real complexity with intricate terrain. We employed, as reference data, the event reconstruction performed by the Catalan Fire Service and validated with operational observations. Point observations of the fire evolution were collected by the fire brigades and allowed, together with detailed information about fuel and meteorology, the reconstruction of the fire development. Subsequently, our simulator was tested based on this synthetic observations and using the data potentially available in a real operation, i.e., rough and general fuel information and domain averaged wind measurements. The rest of the paper is structured as follows: firstly, section 2 provides background information about the real fire incidence as well as its simulation; section 3 explains the data driven system employed in the present study and the results are presented and discussed in sections 4.
2. Vall-llobrega Wildfire
Detailed information about fuel and meteorology was collected by the fire brigades and allowed reconstructing the fire development with Farsite, a widely employed simulator. This reconstruction was validated using observed data about the burned perimeter evolution by L. Castell (personal communication, 2016).
The fire started near the village of Vall-llobrega, on the northern shore of Catalunya (see origin sign in Figure 1) at 13:04 h of 16th march 2014 and it ended burning 359 ha. The extinguishing operation involved more that 50 fire engines, 7 aerial means, and more than 150 fire fighters. The fire took place off-season but showed similar behavior to summer fires (Figure 2) in terms of propagation speeds and fire intensity. The main and secondary runs together with observable spotting propagation were reported by the emergency responders and displayed in Figure 1. Reasons were twofold: the severe drought regime present at the time [see drought index values (Turner, 1972) displayed in Figure 3] and the presence of large dead fuel on the ground due to an uncommon snowfall in a precedent year (2010), which provided additional available fuel.
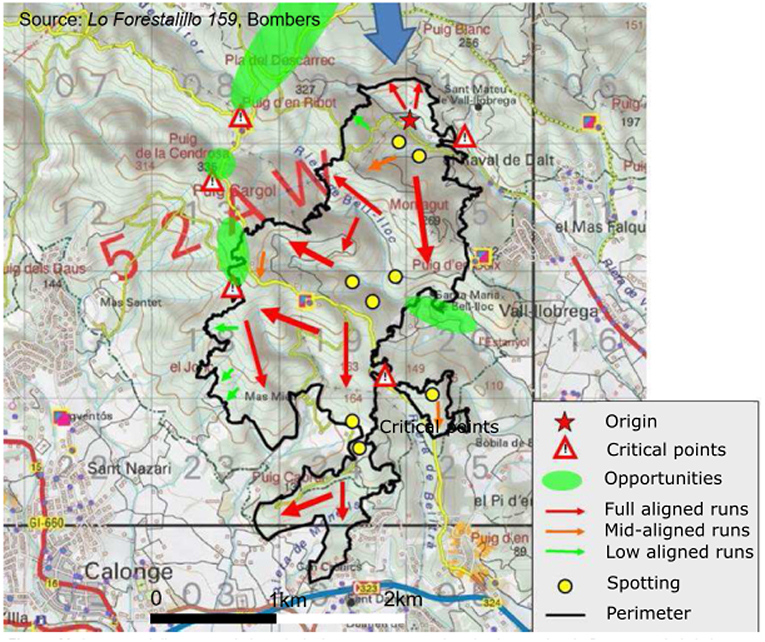
Figure 1. Vall-llobrega fire development and final perimeter. Source: GRAF (2014), adapted.
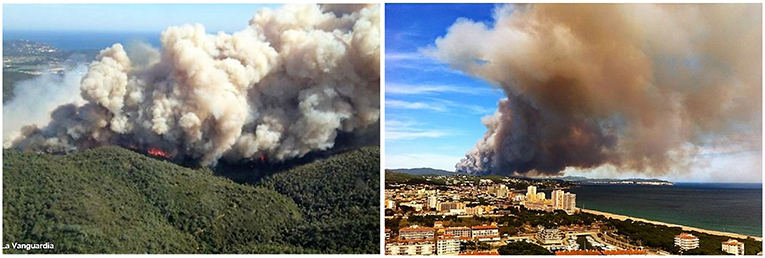
Figure 2. Aerial images of the Vall-llobrega wildfire. Source: La Vanguardia.
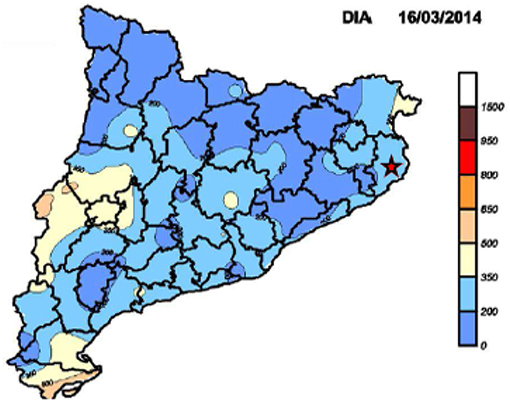
Figure 3. Drought index values on 16/03/14 over Catalunya. The star symbol marks Vall-llobrega location. Source: GRAF (2014).
The weather conditions were dry and windy. When the fire was initiated, the relative humidity was of 20% and the wind was blowing from north at a speed over 36 km h−1with reported wind gusts of 80 km h−1. Data logged by the automatic weather station located at 10 km from the fire are reported in Figure 4.
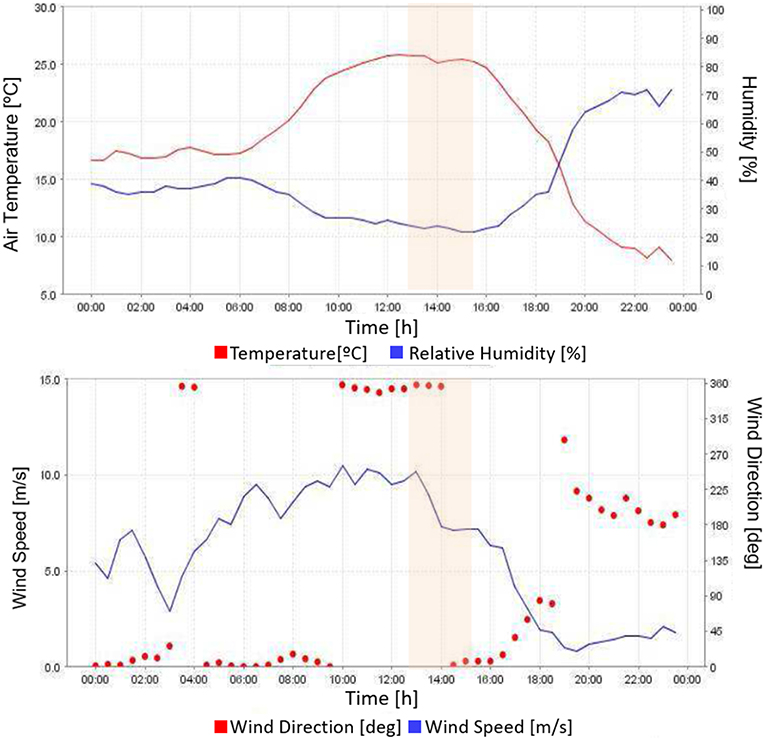
Figure 4. Wind, temperature and relative humidity data logged at the automatic station of La Bisbal d'Empordà (10 km from the fire) on the 16/03/2014. Shaded area corresponds to the period of interest. Source: Servei Meteorològic de Catalunya.
3. Methodology: Data Assimilation
3.1. SmartQFire Tool
SmartQFire is a data-driven wildfire spread modeling system explained in detail in Rios et al. (2014a, 2016, 2018). The system is based on the Rothermel (1972) model to estimate the Rate of Spread of a fire front given the fuel, terrain, and wind characteristics. The fire front is generated by coupling the rate of spread with the Huygens wave principles for elliptical expansion by means of the partial differential equations established by Richards (1995). The equations are integrated in a discretized form implemented in a Lagrangian markers tracking approach. The enveloping front produced by those equations is filtered with algorithms to prevent loop entanglements, sharp edges, and homogeneously distributed markers along the entire fire front perimeter.
The version used in this paper includes a built-in fuel structure to adapt the standard fuel model classification developed by Scott and Burgan (2005a) to a simplified implementation that reduces the number of fuel parameters to 5: Fine Fuel Load (W), Surface-area-to-volume ratio (SAV), Moisture content (Mf), Moisture of extinction (Mx), and Fuel Bed Depth (D). The reduction methodology was proposed and evaluated in Rios (2018). This reducing strategy allows for a simplified description of the standard fuel model (Scott and Burgan, 2005a) which uses those five parameters for each of the five fuel particle classes, namely, 1, 10, 100 h, live herbaceous, live woody. The equivalent parameter set is build up by means of numerical optimization within all families of fuel models that contain the same fuel particle classes.
Additionally, the data driven system at hand includes topographic wind simulations that are being run at each iteration step. The wind maps are generated by means of the interpolation framework presented in Rios et al. (2018), which uses the diagnoses software WindNinja (Forthofer et al., 2009; Wagenbrenner et al., 2016) to generate base maps. This strategy proved to be computationally efficient and accurate enough for operational wildfire simulations.
3.2. Optimization Strategy
The cost function used to perform the optimization process is based on the Shape Dissimilarity Index (SDIa) stated by Cui and Perera (2010). The original index was corrected by subtracting the area of the front used to initialize the assimilation to avoid the bias given by this already contained area. The SDIa index can then be expressed as:
Where Mi and Oi are, respectively, the modeled and observed fronts' burned areas in a given time and Ia is the initial front area used to perform the first perimeter expansion.
The optimization step is performed by means of the active set method as this algorithm was found to overperform other existing line-search based methods in terms of computing efficiency and capacity to find the closest solution to the global minimum. Active-set methods can be applied to both convex and non-convex problems and have been the most widely used methods since 1970s (Nocedal and Wright, 1999). They are based on a trust-region strategy. This technique establishes a sub-domain near the current objective function evaluation point (trust region) where the cost function is approximated using a quadratic model. Then, the constrained problem is solved using a sequence of parametrized unconstrained optimizations, which in the limit converge to the constrained problem. The method can be mathematically formulated with the Kuhn-Tucker equations (Kuhn and Tucker, 1951). Lagrange multipliers are necessary to balance the deviations in magnitude of the objective function and constraint gradients. Particular care on the implementation of this algorithm must be taken regarding Maratos effect. This effect states that bounds and equalities might be violated to find the fastest way to the minimum. In our present problem, this is important in two of the parameter bounds. Lower wind speed (i.e., 0 ms−1) and the inequality Mf ≤ Mx. If any of those constraints is violated, negative and complex values of Rate of Spread are output producing an error in the spread algorithm. To solve this issue (and prevent the optimization from halting) the spread model must be tweaked to handle those scenarios and produce a NaN output that can be further interpreted by the optimization method.
3.3. Reference Data for Model Validation
The fire described in section 2 was recreated using Farsite (Finney, 1998) by members of the Catalan Fire Department closely involved with the emergency response operations developed during the fire. The Farsite input files, together with the adjustment factors, were manually tuned to closely reassemble the 2 h 50 min initial development of the fire. Those are depicted in Figure 5.
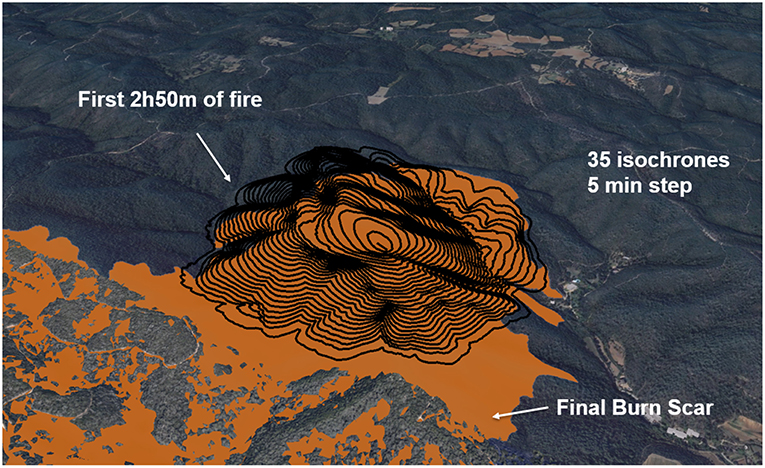
Figure 5. Farsite validated reconstruction of Vall-llobrega fires for the initial 170 min. Black lines are 35 isochrones at 5 min frequency. Orange solid contour is the satellite-based final scar (source: ICGC, 2018).
Taking those 35 isochrones as ground-truth, three cases are run varying the number of isochrones used for assimilation and forecast validation. Those allocations are gathered below. The corresponding time is given in parentheses.
• Case A: 5 assimilated fronts (20 min), 29 forecast (145 min)
• Case B: 10 assimilated fronts (45 min), 24 forecast (120 min)
• Case C: 22 assimilated fronts (105 min), 12 forecast (60 min)
To initialize SmartQFIRE software, the 7 parameters to be optimized were estimated with the values gathered in Table 1. This could be a blind estimation done in real situations as it only requires a rough idea on the scenario conditions. As example, for the case at hand, the fuel characteristics had been paired to the fuel model TU5 Very High Load, Dry Climate Timber-Shrub (Scott and Burgan, 2005b) as fire responders already knew that packed and dead under-story was present. Similarly, a representative wind speed and direction was taken from a nearby station at the time of fire initiation (see Figure 4).
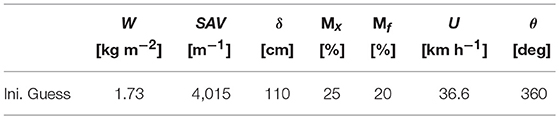
Table 1. Values of the parameters estimated to initialize the assimilation run.
4. Results and Discussion
4.1. Assimilation Results
The results of the assimilated fronts for the three cases explored are plotted in Figure 6. Dashed-green lines in this figure correspond to the estimated propagation with the values in Table 1. Black lines correspond to the observed fronts whereas red dashed lines are the calibrated fire spread. In the three cases, it is clear that the front generated with the initialization values highly differs from observations. On the contrary, the assimilation process converges into a situation that closely resembles the observations, especially in the cases where 5 and 10 fronts are assimilated. In particular, the topographic effect in both flanks is well-resolved. The 10 front case, however, shows some divergence on the tail as converged fronts spread slightly further than observations. This effect is more remarkable in the third case, (Figure 6C) where this overspread is larger. In this case, however, flanks and fronts are still correctly resolved. The difficulty to properly simulate the tail part of the fire may lie on the fact that backwards spread (fire spreading against wind and topography) is not well-characterized yet. A dedicated sub-model should be implemented once theoretically available, to improve this weakness.
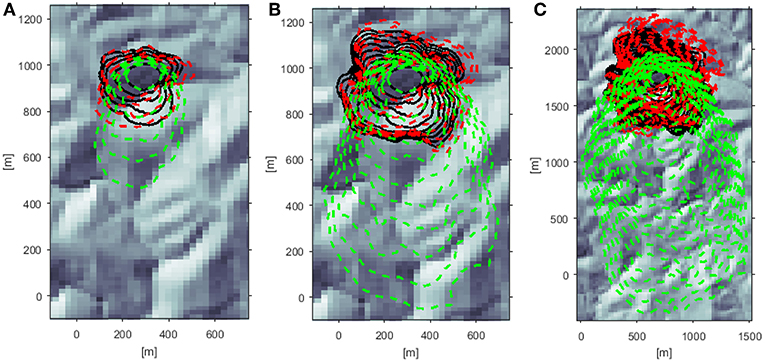
Figure 6. Three different assimilations runs. North direction is toward the top of the image. Black solid lines are observations, dashed green lines are initial run, and dashed red lines are the optimized fronts at the end of the assimilation period. Background image is the hillshade representation of the domain. (A) 5 fronts. (B) 10 fronts. (C) 22 fronts.
4.2. Parameters Convergence
To assess the convergence of the assimilation process we analyzed, on one side, the convergence of the simulated fronts and, on the other, the convergence of the seven assimilated parameters. Figure 7 shows those two convergences for the first case presented here (20 min of assimilation). As the optimization engine made use of the active-set strategy, each of the iterations indicated in the Figure make use of multiple evaluations of the forward model in order to define the following step direction. The mean area cost value depicted in the left panel of Figure 7 is the absolute areal difference between each of the observed and simulated fire perimeters averaged by the number of simulated fronts. It is remarkable that in the 9th iteration this value diverges rising to 240 m2. The explanation for this behavior might lie on the fact that despite the optimization is constrained, the active-set converging process could exceed the boundaries of the optimization domain before the parameters are forced to fall back into the valid range. Those processes have been sometimes identified to produce this local divergence of the optimization process.
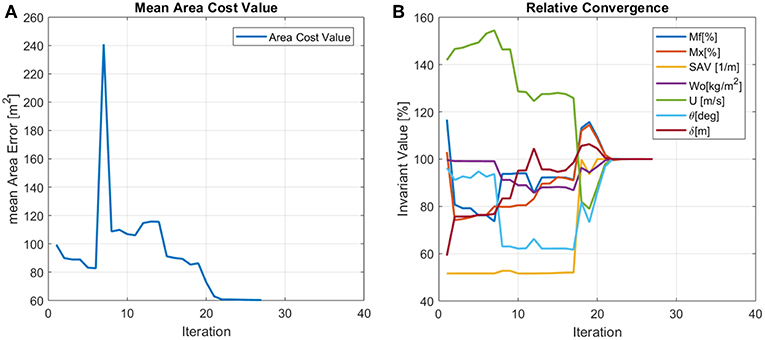
Figure 7. Convergence of the assimilation process for Case A (20 min of assimilation). (A) Mean area error between observed and assimilated fronts. (B) Relative convergence for each of the 7 optimized parameters.
The relative parameters value convergence (Figure 7B) is expressed as a percentage of the final converged value. Thus, all parameters converge to 100%. We can identify here that the convergence is not smooth and steady as there are large jumps (SAV and u at iteration 17 for example). This supports the finding identified in Rios et al. (2017): the optimization problem at hand is not a smooth problem and, thus, simple linear search algorithms do not provide an acceptable solution.
Converged values for each parameter and case are gathered in Table 2. Analyzing them one-by-one we find that all three cases generated here mostly converge toward the same set of parameters, except for the wind speed in case C, which is considerably lower than the other cases. The fine fuel load (w) is reduced for all cases with respect to the initial value as well as the moisture content. This could provide a larger fire spread, which would be inexplicable regarding the fronts produced with the initial guess (see green dashed lines in Figure 6), but the dramatic wind reduction prevents this. Indeed, for all cases the domain representative wind speed is lowered below 10 ms−1. The wind direction pivots around the 360° value, i.e, wind blowing from north. It is worth to recall here that the direction (θ) is internally expressed in radians and values are always projected into [π - 3π] bounds for numerical reasons (see Table 3). Another remarkable output is the converged value of the surface-area-to-volume ratio (SAV). In all cases, it increases largely, and even in case A, it gets close to the upper bound (stated at 7,270 m−1). These values indicate that from our simulator standpoint, mostly the thinner fuel is the principal contributor to fire spread. To validate this results, post-fire data would be needed to assess the principal fuels involved in the fire. Despite the lack of this information, the observations of high intense fire behavior and its high propagation speed support this outcome.
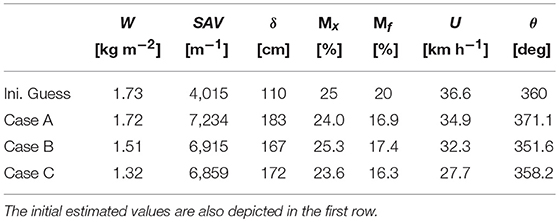
Table 2. Final absolute values for all seven parameters after the assimilation process.
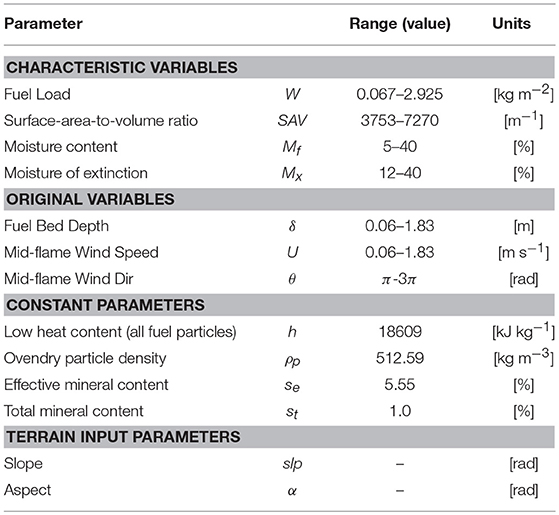
Table 3. Summary of the proposed fuel model variables, ranges, and constant values.
4.3. Fire Spread Forecast
Once the seven parameters are calibrated by means of the assimilation process, the forecast is launched and compared to the ground-truth fronts that remain available in each case. These results are depicted in Figure 8. For all cases, the last assimilated perimeter is the one used to initiate the forecast model run.
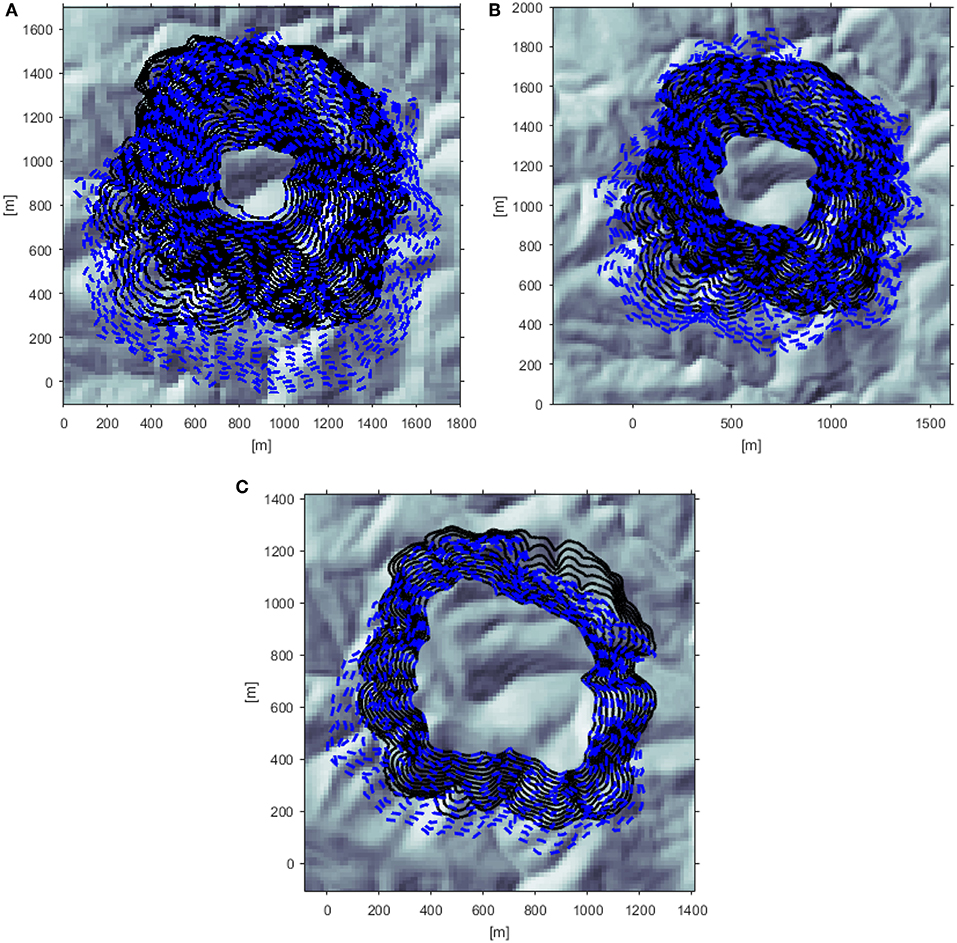
Figure 8. Forecast run (blue dashed lines) vs. observations (black solid lines) for the three cases. (A) 5 assimilated fronts, 29 forecast fronts. (B) 10 assimilated fronts, 24 forecast fronts. (C) 22 assimilated fronts, 12 forecast fronts.
As it could be expected, case A (with the shortest assimilation window) performs poorer than the other two cases. This case correctly forecasts the back of the fire and the right flank after 145 min (2 h 25 min) (Figure 8A), however it over-predicts the position of the front part of the perimeter by approximately 200 m. Case B also manages to forecast the back of the fire and it matches correctly the front and the flanks. The last three isochrones show a burst on the rear part of the right flank. This might be due to bad terrain handling, as it seems that this part of the front accelerates suddenly. Contrary to the previous cases, case C, which is the one that has more fronts assimilated, under-predicts the back of the fire and slightly over-predicts the front. Nevertheless, the right flank is better resolved than in the previous cases.
To help in the analysis of the forecast performance of each case, the SDIa index for each forecast perimeter is plotted in Figure 9. Each marker in the Figure corresponds to a single SDIa value for a given time. One can observe, for example, that the best 110 min-forecast is provided in case C. However, this is probably due to the fact that case C was initialized at minute 90 so it is actually a forecast at 20 min horizon. Indeed, as time passes by case C performs worse than case B. Case A delivers an acceptable forecast during the first 30 min. Beyond this time, performance decreases with time until reaching rather unacceptable values for the last 50 min. As the whole systems is build up on finding representative parameters that are assumed constant over time, there is a trade-off between the assimilating time and this averaging effect. Ideally, once enough validations are performed, the optimal assimilation windows for a given case could be defined and it should be shifted over time (without increasing the number of assimilated fronts) as the emergency evolves. As this window might depend on the overall fire behavior, different window length could be set based on some index, as head front Rate of Spread. The study of this optimal assimilation window linked to scenario (observed fire behavior, domain characteristics, parameters values, etc.) should be further investigated with more validation cases as it is one of the key aspects to render this tool operational.
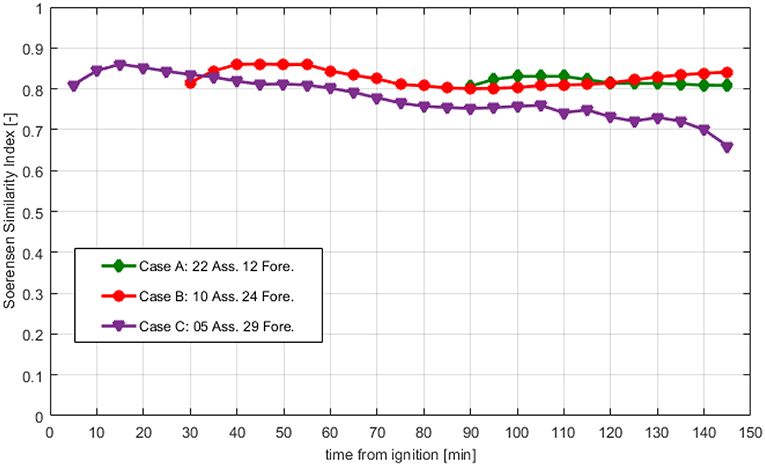
Figure 9. Similarity index (SDIa) performance for all forecast fronts and the three different strategies explored. Ass, assimilated fronts; Fore, forecasted fronts.
Finally, the computation time needed to perform all assimilation and forecast runs for each case are reported in Table 4. In all cases, the lead time (time between the results delivery and the forecast time) exceeds 50 min. This aspect, together with an accuracy estimation to set the reliable forecasting horizon, are key aspects if SmartQFIRE is to be employed in operational situations.
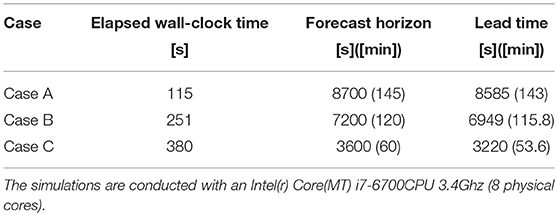
Table 4. Running times and lead times for all cases.
5. Conclusions
The data driven system SmartQFIRE was tested with the reconstruction of a real wildfire in order to explore its potential performance in a real emergency scenario. The a-posteriori simulation of a real fire had been generated with Farsite and validated by operational responders with in-situ point observations. This simulation was used in the present study as synthetic observed fire evolution. Synthetic fire spread was used instead of real observations in order to decouple the data-assimilation problem from the fire-spread-simulation scheme. Whereas comparison of this simulator against real data will be essential, the measurement of its performance in a real scenario would complicate the identification of the forecast error sources. Operational fire spread simulators are based on semi-empirical models which are built upon strong simplifications and do not fully describe fire dynamics. Consequently, the inaccuracies of a data-driven simulator when compared against observed data could be a result of deficient data-assimilation performance just as well as inherent physical limitations of the forward models.
By decoupling both problems, this study aimed to assess our data assimilation system independently from the fire spread model employed. We achieved this by using, as synthetic ground-truth data, simulation results obtained with Farsite. Farsite implements Rothermel's fire spread model, which is also incorporated in SmartQFIRE. Therefore, results obtained in this study can be understood as a direct assessment of the accuracy of our data assimilation system.
The evaluation was performed with the initial 2 h and 50 min of isochrones with a frequency of 5 min. Three different assimilation cases were studied. They could be representative of different times where the assimilating system could be deployed. The algorithm showed great potential to handle complex wind and terrain entangled scenarios. The coupling with WindNinja enhanced successfully delivered realistic fronts that could closely match observation without jeopardizing the operational application due to computing time. Indeed, for all cases studied, the lead time exceeded the 50 min. It was found that, in general terms, more assimilated fronts provides better results although the analysis also showed that it exists a trade-off on the averaging calibration parameters and correct forecast. More research is needed to determine the ways to establish the correct assimilation window that optimizes the forecasting results.
Finally, one of the identified limitations of this approach is the lack of spatial variation of the fuel parameters that are being resolved by means of the assimilation. In most real situations and long lasting wildfires, the canopy cover affected will be heterogeneous and thus, the present system will not be capable of correctly resolving a single set of fuel parameters for the entire domain. A possible solution lies on the ability to pre-classify the entire domain into different sub-domains with certain homogeneity. If this division is possible (for example, employing available canopy cover information coming from lidar sensors) then, it is possible to resolve the parameters independently for each of the sub-domains. An initial exploration of this concept was performed by Zhang et al. (2017) although in their case the aim was to capture wind heterogeneity (already considered in the system at hand) and the division was not based on canopy cover but structured in a grid shape. Thus, this upgrade is a necessary future work to be conducted prior to the deployment of the system into real scenarios.
Data Availability
All datasets generated for this study are included in the manuscript.
Author Contributions
All authors listed have made a substantial, direct and intellectual contribution to the work, and approved it for publication.
Funding
The authors thank the Spanish Ministry of Economy and Competitiveness (project CTQ2017-89990-R) founded with FEDER funds, the Spanish Ministry of Education, Culture and Sport (Formación de Profesorado Universitario Program) and the Autonomous Government of Catalonia (project no. 2017-SGR-413).
Conflict of Interest Statement
The authors declare that the research was conducted in the absence of any commercial or financial relationships that could be construed as a potential conflict of interest.
Acknowledgments
The authors would like to thank the GRAF division of the Catalan Fire Service (Bombers de la Generalitat de Catalunya) for sharing the data to conduct this validation.
References
André, J., and Gonçalves, J. (2013). Angular variation of fire rate of spread. Int. J. Wildland Fire 1991, 970–979. doi: 10.1071/WF12028
Cui, W., and Perera, A. H. (2010). Quantifying spatio-temporal errors in forest fire spread modelling explicitly. J. Environ. Informatics 16, 19–26. doi: 10.3808/jei.201000174
Finney, M. (1998). FARSITE: Fire Area Simulator: Model Development and Evaluation. Technical report, USDA Forest Service, Ogden, UT.
Forthofer, J., Shannon, K., and Butler, B. (2009). “Simulating diurnally driven slope winds with WindNinja,” in Proceedings of 8th Symposium on Fire and Forest Meteorological Society (Kalispell, MT), 13.
GRAF (2014). Incendis, Estratègies i Ecologia del foc Forestal. N159. 2014: Incendis tot l'any, Llamps i pluja a l'Estiu i Cremes a la Tardor. Technical Report 159, Bombers de Catalunya. Unitat tècnica GRAF.
Kuhn, H. W., and Tucker, A. (1951). “Nonlinear Programming,” in Proceedings of the Second Symposium on Mathematical Statistics and Probability (Berkeley, CA), 481–492.
Mandel, J., Beezley, J. D., Coen, J. L., and Kim, M. (2009). Data assimilation for wildland fires. Control Syst. IEEE 29, 47–65. doi: 10.1109/MCS.2009.932224
Nocedal, J. and Wright, S. J. (1999). Numerical Optimization. Springer Series in Operations Research and Financial Engineering. New York, NY: Springer-Verlag.
Richards, G. D. (1995). A general mathematical framework for modeling two-dimensional wildland fire spread. Int. J. Wildland Fire 5, 63–72.
Rios, O. (2018). Inverse Modelling in Wildfire Spread Forecasting: Towards a Data-driven System. Ph.D thesis, Polytechnic University of Catalunya.
Rios, O., Jahn, W., Pastor, E., Valero, M. M., and Planas, E. (2018). Interpolation framework to speed up near-surface wind simulations for data-driven wildfire applications. Int. J. Wildland Fire 27, 257–270. doi: 10.1071/WF17027
Rios, O., Jahn, W., and Rein, G. (2014b). Forecasting wind-driven wildfires using an inverse modelling approach. Nat. Hazards Earth Syst. Sci. 14, 1491–1503. doi: 10.5194/nhess-14-1491-2014
Rios, O., Pastor, E., Tarragó, D., Rein, G., Planas, E., and Viegas, D. X. (2014a). “Short term forecasting of large scale wind-driven wildfires using thermal imaging and inverse modelling techniques,” in Advances in Forest Fire Research (Coimbra: Imprensa da Universidade de Coimbra), 949–960.
Rios, O., Pastor, E., Valero, M., and Planas, E. (2016). Short-term fire front spread prediction using inverse modelling and airborne infrared images. Int. J. Wildland Fire 20, 1015–1032. doi: 10.1071/WF16031
Rios, O., Valero, M., Pastor, E., and Planas, E. (2017). “Optimization strategy exploration in a wildfire propagation data driven system,” in International Conference on Computational Science, ICCS 2017 (Zurich).
Rochoux, M., Emery, C., Ricci, S., Cuenot, B., and Trouvé, A. (2015). Towards predictive data-driven simulations of wildfire spread– Part II: ensemble Kalman Filter for the state estimation of a front-tracking simulator of wildfire spread. Nat. Hazards Earth Syst. Sci. 15, 1721–1739. doi: 10.5194/nhess-15-1721-2015
Rochoux, M., Emerya, C., and Riccia, S. (2014a). “A comparative study of parameter estimation and state estimation approaches in data-driven wildfire spread modeling,” in VII International Conference on Forest Fire Research, ed D. Viegas (Coimbra: Rochoux), 1–12.
Rochoux, M., Ricci, S., Lucor, D., Cuenot, B., and Trouvé, A. (2014b). Towards predictive data-driven simulations of wildfire spread – Part I: Reduced-cost Ensemble Kalman Filter based on a Polynomial Chaos surrogate model for parameter estimation. Nat. Hazards Earth Syst. Sci. 14, 2951–2973. doi: 10.5194/nhess-14-2951-2014
Rothermel, R. (1972). A Mathematical Model for Predicting Fire Spread in Wildland Fuels. Research Paper INT-115. Technical report, USDA Forest Service. Intermountain Forest and Range Experiment Station, Odgen, UT.
Sanjuan, G., Margalef, T., and Cortés, A. (2016a). Applying domain decomposition to wind field calculation. Parallel Comput. 57, 484–490. doi: 10.1109/HPCSim.2015.7237080
Sanjuan, G., Margalef, T., and Cortés, A. (2016b). Hybrid application to accelerate wind field calculation. J. Comput. Sci. 17, 576–590. doi: 10.1016/j.jocs.2016.07.011
Sanjuan, G., Tena, C., Margalef, T., and Cortés, A. (2016c). Applying vectorization of diagonal sparse matrix to accelerate wind field calculation. J. Supercomput. 73, 240–258. doi: 10.1007/s11227-016-1696-9
Scott, J. H., and Burgan, R. E. (2005a). “Standard fire behavior fuel models: a comprehensive set for use with Rothermel's surface fire spread model,” in The Bark Beetles, Fuels, and Fire Bibliography (Fort Collins, CO: USDA), 72.
Scott, J. H., and Burgan, R. E. (2005b). Standard Fire Behavior Fuel Models: A Comprehensive Set for Use with Rothermel's Surface Fire Spread Model. Technical report.
Turner, J. (1972). The Drought Code Component of the Canadian Forest Fire Behavior System. Technical Report 1316, Canadian Forestry Service, Ottawa, ON.
Valero, M., Rios, O., Pastor, E., and Planas, E. (2017). An integral system for automated tactical monitoring and data-driven spread forecasting of wildfires. Fire Safety J. 91, 835–844. doi: 10.1016/j.firesaf.2017.03.085
Valero, M., Rios, O., Planas, E., and Pastor, E. (2018). Automated location of active fire perimeters in aerial infrared imaging using unsupervised edge detectors. Int. J. Wildland Fire 27, 241–256. doi: 10.1071/WF17093
Valero, M. M., Verstockt, S., Rios, O., Pastor, E., Vandecasteele, F., and Barcelonatech, D. C. (2017). “Flame filtering and perimeter localization of wildfires using aerial thermal imagery,” in SPIE 10214, Thermosense: Thermal Infrared Applications XXXIX (Anaheim, CA).
Wagenbrenner, N. S., Forthofer, J. M., Lamb, B. K., Shannon, K. S., and Butler, B. W. (2016). Downscaling surface wind predictions from numerical weather prediction models in complex terrain with WindNinja. Atmos. Chem. Phys. 16, 5229–5241. doi: 10.5194/acp-16-5229-2016
Zhang, C., Collin, A., Moireau, P., Trouvé, A., and Rochoux, M. C. (2018). “Front shape similarity measure for data-driven simulations of wildland fire spread based on state estimation: application to the RxCADRE field-scale experiment,” in Proceedings of the Combustion Institute, 1–9. doi: 10.1016/j.proci.2018.07.112
Zhang, C., Rochoux, M., Tang, W., Gollner, M., Filippi, J. B., and Trouvé, A. (2017). Evaluation of a data-driven wildland fire spread forecast model with spatially-distributed parameter estimation in simulations of the FireFlux I field-scale experiment. Fire Safety J. 91, 758–767. doi: 10.1016/j.firesaf.2017.03.057
Keywords: wildfire, front spread, Rothermel, forecast, Wind-Ninja
Citation: Rios O, Valero MM, Pastor E and Planas E (2019) A Data-Driven Fire Spread Simulator: Validation in Vall-llobrega's Fire. Front. Mech. Eng. 5:8. doi: 10.3389/fmech.2019.00008
Received: 22 January 2019; Accepted: 04 March 2019;
Published: 28 March 2019.
Edited by:
Michael John Gollner, University of Maryland, College Park, United StatesReviewed by:
Arnaud C. Trouve, University of Maryland, College Park, United StatesWei Tang, National Institute of Standards and Technology (NIST), United States
Copyright © 2019 Rios, Valero, Pastor and Planas. This is an open-access article distributed under the terms of the Creative Commons Attribution License (CC BY). The use, distribution or reproduction in other forums is permitted, provided the original author(s) and the copyright owner(s) are credited and that the original publication in this journal is cited, in accordance with accepted academic practice. No use, distribution or reproduction is permitted which does not comply with these terms.
*Correspondence: Elsa Pastor, ZWxzYS5wYXN0b3JAdXBjLmVkdQ==