 Jason Liu
 James Peck
 Kazuaki Yazawa
 Timothy S. Fisher
 Tom I-P. Shih
- 1School of Aeronautics and Astronautics, Purdue University, West Lafayette, IN, United States
- 2Birck Nanotechnology Center, Purdue University, West Lafayette, IN, United States
- 3Department of Mechanical and Aerospace Engineering, University of California, Los Angeles, Los Angeles, CA, United States
Surface coolers are heat exchangers with fins on the air side. When air approaches the fins, a portion is diverted away (bypass) because of the adverse pressure gradients induced by the fins. Also, for the air that does flow between the fins, a portion exits (loss) because of pressure rise along the fins due to friction Both bypass and loss reduce the effectiveness of surface coolers to transfer heat to the air. In this study, steady RANS with the SST model (with and without conjugate heat transfer) were performed to examine how geometric and operating parameters affect bypass, loss, pressure drop, and heat transfer in two surface coolers commonly used in aircraft applications. Of the surface coolers, one has continuous fins, and the other has staggered or non-staggered segmented fins. Geometric parameter examined include: spacing between the fins (S/H = 0.2, 0.4, 0.6, 0.8), thickness of the fins (t/H = 0.1, 0.2, 0.4), length of the fins (L/H = 1, 5, 10), and the height of the channel, where the surface cooler is placed (C/H = 2.5, 5, 10, 20, 40 cm), where H is the height of the fin, and C is the half the height of the channel. Operating parameters examined include: velocity (Vin = 32.5, 65, 97.5, and 135 m/s) and temperature (Tin = 300 and 473 K) of flow approaching the surface cooler, the fins' wall temperature (Tw = 300, 320, 350, 375, 400, 493 K). Results obtained show C/H to significantly affect bypass and loss until C/H reaches about 20. Bypass, loss, and pressure drop all increase monotonically as the blockage created by the fins, t/(S + t), increases. The ratio of the Nusselt number to the pressure coefficient is a maximum when t/(S + t) = 0.33 for the conjugate cases and 0.5 for the isothermal cases. Vin, Tin, and Tw were found to have negligible effects on bypass, but have appreciable effects on loss when spacing between the fins is small. For the geometries studied, segmenting the fins was found to increase loss, resulting in the worst heat-transfer rate and highest pressure drop.
Introduction
Aircraft have many components and fluids that need to be cooled. These include any surface that is exposed to the “hot-gas path” in a gas turbine engine as well as the coolants used to cool avionics and the oils used to lubricate the gears/bearings. There are three major sources available for cooling. The first is the air that enters the engine, which can be quite cold during cruise at high altitudes, even if extracted after the fan. The second is the fuel. However, the fuel can only absorb a limited amount of thermal energy because its temperature must be kept below where coking starts unless fuel underwent deoxygenation. The third is using a refrigeration cycle.
All aforementioned sources require heat exchangers. One type of heat exchanger widely used to cool oils that lubricate engine gears and bearings on aircraft is the surface cooler; see Figure 1. As shown in Figure 1, surface coolers use the cooler air that enters the engine and has fins that protrude into the cooler air.
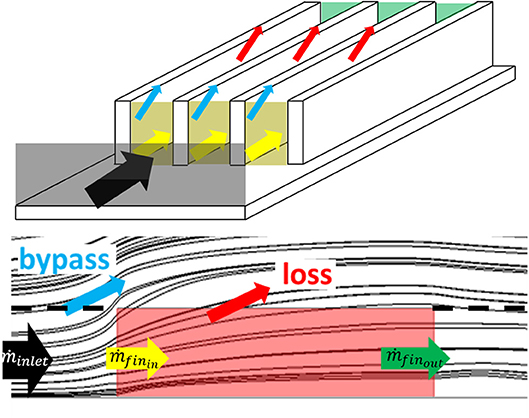
Figure 1. Schematic of surface cooler with depiction of bypass and loss.
The literature on heat exchangers with fins is quite extensive (see e.g., Kays and London, 1964; Afgan and Schlunder, 1974; Webb, 1994; Rohsenow et al., 1997; Nagarani et al., 2014). Work has been done to explore different fins shapes (Kays and London, 1964; Afgan and Schlunder, 1974; Metzger et al., 1984; Sparrow and Grannis, 1991; Webb, 1994; Chen et al., 1997; Rohsenow et al., 1997; Nagarani et al., 2014) and their arrangements (Kays and London, 1964; Afgan and Schlunder, 1974; Metzger et al., 1984; Sparrow and Grannis, 1991; Webb, 1994; Rohsenow et al., 1997; Nagarani et al., 2014). Work has also been done to optimize fin shapes (Metzger et al., 1984; Sparrow and Grannis, 1991; Chen et al., 1997) and arrangement of fins for a wide range of operating conditions (Sparrow and Beckey, 1981; Metzger et al., 1984; Sparrow and Grannis, 1991; Wirtz et al., 1994; Lee, 1995; Sata et al., 1996; Chen et al., 1997; Jonsson and Palm, 1998). Most of the literature on surface coolers are connected to the cooling of electronics, where the flow speeds are typically low (M << 1 and Re < 5,000), and the clearance between the fin tip and the channel is small (typically no more than the height of the fin). If there is a clearance, then flow can “bypass” the fins (i.e., flow over the fins instead of through the fins). With less flow through the fins, heat transfer from fins are greatly reduced. Sparrow and Beckey (1981) studied the effects of spacings between fins and clearances. They showed that the frictional loss between the fins is relatively unaffected by the clearance if it is less than the fin height. Wirtz et al. (1994) studied the effects of fin height and spacing on heat transfer. Though bypass was mentioned, it was not quantified. Jonsson and Palm (1998) developed correlations to predict the thermal resistance and pressure drop for heat sinks with bypass, recognizing the role of fin height and duct aspect ratio. Lee (1995); Sata et al. (1996); Simons and Schmidt (1997); Khan et al. (2008) developed models to predict the amount of bypass. However, these models require experimental input to predict the impact of bypass for each heat sink design. In all of the aforementioned studies, bypass and the flow through the fins were treated together via a pressure drop and an effective discharge coefficient. Bypass was never quantified.
The literature on surface coolers for aircraft applications is considerably less. Surface coolers for aircraft applications differ from surface coolers for electronic cooling in two ways. First, flow rates in electronic cooling are low, whereas the flow rates for aircraft applications can be quite high (Mach number can approach unity). Second, the clearance for electronic cooling is typically quite low (less than the fin height), whereas it can be 20 or more times the fin height in aircraft applications. When the clearance is small, most of the flow is guaranteed to enter between the space between fins. However, when the clearance is large, considerable amount of the flow approaching the surface cooler could be diverted away or bypass it. Furthermore, a portion of the flow that enters the space between the fins will leave the space between the fins before reaching the end of the surface cooler. This flow that leaves the space between the fins is referred to as “loss.”
For surface coolers in aircraft applications, Villafañe et al. (2011) developed a transonic wind tunnel to reproduce aero-engine flow conditions with M = 0.7. Surface coolers with both continuous and segmented fins were studied (Sousa et al., 2014; Villafañe and Paniagua, 2018). Results were obtained for heat transfer and how fin arrays disturbed the flow. Bypass and loss were not measured, so their effects on heat transfer were not studied. Kim et al. (2014) performed an experimental and computational study on surface coolers for aircraft operating at M = 0.6. They measured bypass and the flow rates through the spacings between the fins with focus on heat transfer for one configuration under three operating condition: ground idle, cruise, and flight idle. Kim et al. (2016) studied the effects of segmenting fins on heat transfer by comparing a continuous fin with a segmented fin. They examined the effects of pitch between the segmented fins in the streamwise and spanwise directions. In their study, they showed that mass flow rate through the spacing between the fins decreases along the length of the fin, which is the first reference to loss. Kim et al. (2018) studied the effects of slanting one continuous and one segmented fin configuration with clearance up to 30 times the fin height on frictional losses and heat transfer.
As noted, few studies have been performed on surface coolers for aircraft applications. Though two studies to date have shown that bypass and loss can occur in surface coolers and that they affect frictional losses and heat transfer, bypass and loss were not quantified. More importantly, the detailed fluid mechanics of bypass and loss and how they affect heat transfer have not been examined. For aircraft applications, bypass and loss can be significant. The objective of this paper is to use computational methods to study how geometry and operating conditions affect bypass and loss in surface coolers for aircraft applications.
Since bypass and loss reduce the mass-flow rate of air through the fins for heat transfer, bypass and loss need to be quantified. In this study, bypass and loss are defined as follows:
where ṁinlet is the mass-flow rate of the air intercepted by the frontal cross-sectional area of the surface cooler with the fins far upstream of it; ṁfinin is the mass-flow rate that enters the surface cooler at its leading edge; and ṁfinout is the mass-flow rate that exits the surface cooler at its trailing edge (see Figure 1).
Description of the Problem
In this study, two surface coolers widely used in aircraft applications were studied (Figure 2). Both surface coolers have fins of height H = 1 cm and thickness t, but one has fins that extend across the entire surface cooler (referred to as continuous fins), and the other has a series of fins along the surface cooler arranged in either a staggered or non-staggered fashion (referred to as segmented fins). Also, both surface coolers have length L and are located 14 H from the inlet and 32 H from the outlet. For both surface coolers, they are taken to be planar (no curvature). Note that the surface at y = C is a symmetry plane so that the distance between surface coolers in y direction (clearance) is 2(C-H).
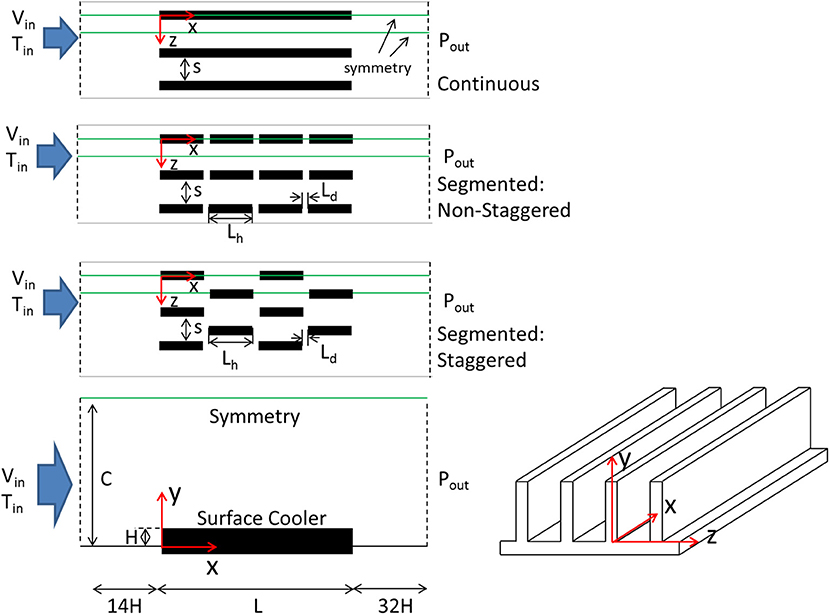
Figure 2. Schematics of the surface coolers studied.
For surface coolers with continuous fins, the following parameters were examined: spacing between fins (S/H = 0.2, 0.4, 0.6, 0.8), thickness of fins (t/H = 0.1, 0.2, 0.4), length of fins (L/H = 1, 5, 10), and clearance (C/H = 2.5, 5, 10, 20, 30, 40). For surface coolers with segmented fins, the length of the fins (Lh/H) is 1, and the distance between the segmented fins in the x-direction (Ld/H) is 0.5.
The flow that approaches the surface cooler at x = −14H is air and has uniform velocity of Vin in the x-direction (Vin = 32.5, 64, 96, and 135 m/s) and uniform temperature of Tin (Tin = 300, 473 K). The pressure at the outlet (x = 42H) is Pb = 2 atm. The surface at y = 0 is adiabatic, whereas all fin surfaces are maintained at a constant temperature, Tw, given by:
where Δ T is either 0, 20, 50, 75, or 100K.
To examine if bypass and loss could be affected by conjugate heat transfer, a variation of the problem was studied, where conjugate heat transfer was accounted for, where the surface cooler is made of aluminum. For this variation, the following surface are adiabatic: y = 0 and x ∈ [−14H, 0] and [10H, 42H]; x = 0 and y ∈ [−0.2H, 0]; and x = L and y ∈ [−0.2H, 0]. The surface at y = −0.2H and x ∈ [0, 10H] is maintained at a constant temperature, Tw.
Table 1 summarizes all simulations performed to study the effects of geometry and operating conditions on bypass, loss, pressure drop, and heat transfer.
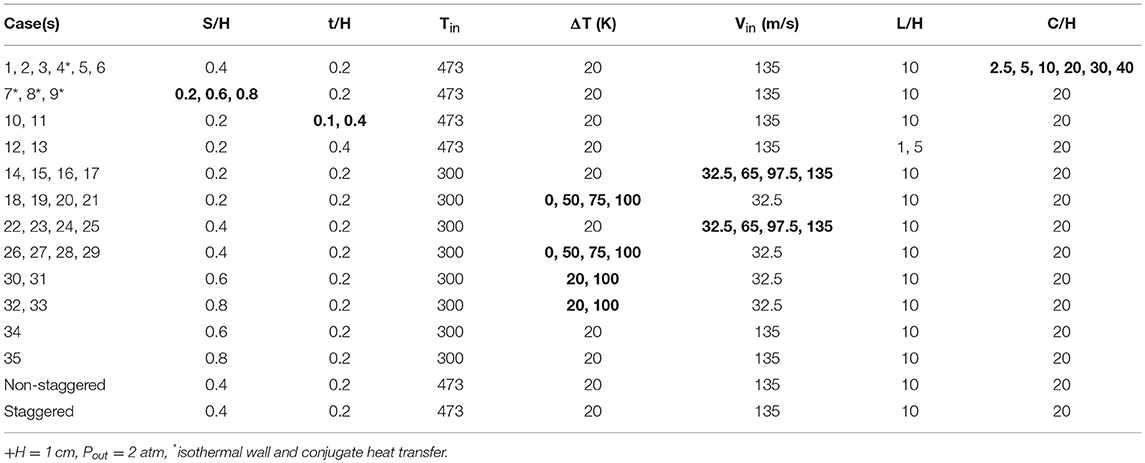
Table 1. Summary of cases studied+.
Problem Formulation and Numerical Method of Solution
The air that flows over and through the surface-cooler described in the previous section was modeled by the time-averaged continuity, compressible Navier-Stokes, and total energy equations (RANS) for thermally perfect gas with temperature dependent properties. The Reynolds stresses that result from the time averaging was closed by the shear-stress transport (SST) model of Menter (1994). In this study, the turbulence is assumed to occur from the leading edge of the fin because the laminar region is <10% of L for the worst-case scenario, where by-pass transition is assumed to take place.
At the inflow boundary (x = −14H), uniform velocity and temperature were specified. At the outflow boundary (x = L + 32H), the pressure Pb was specified. All walls are no-slip. Also, all walls leading up to and after the surface cooler are adiabatic. For studies where conjugate heat transfer is not accounted for, all walls at y = 0 are adiabatic, and all fin surfaces are maintained at Tw. For simulations that account for conjugate heat transfer, the temperature at y = −0.2H is maintained constant at Tw so the wall at y = 0 is no longer adiabatic from x = 0 to x = L. Symmetry was invoked wherever possible as shown in Figure 2, namely, at y = C, z = 0, and z = (S + t)/2. At symmetry planes, symmetry boundary conditions were imposed.
For the conjugate studies, the solid aluminum that make up the fins and the plate of the surface cooler was modeled by the thermal energy equation and the Fourier law of conduction with temperature-dependent thermal conductivity. The boundary conditions imposed were isothermal wall at y = −0.2H and x ∈ [0, 10H] and adiabatic wall at x = 0 and y ∈ [−0.2H, 0] and at x = L and y ∈ [−0.2H, 0]. At all interfaces where the solid and the air meet, temperature and heat flux are the same for the solid and the air.
Solutions were obtained by using Version 17.1 of the ANSYS CFX software1. For the equations governing the air phase, fourth-order Rhie-Chow interpolation was used to convert staggered to non-staggered for pressure-velocity coupling. Second-order upwind differencing was used for advection terms, and second-order central differencing was used for all diffusion terms. For the equations that govern the solid phase, second-order central differencing was used. Since only steady-state solutions were of interest, iterations were continued until the residuals plateaued. At convergence, residuals are <10−5, 10−5, 10−6, and 10−5 for continuity, momentum, energy, and turbulence, respectively.
All grids used were structured and consisted of hexahedral elements. The total number of grid points ranged from 1.8 to 3 million, depending on the geometry. Also, y+ of all grid points next to walls is less than unity. A grid-sensitivity study was performed to ensure that the grid employed to generate solutions has sufficient resolution to produce meaningful results. Case 7 in Table 1 was chosen for this study because this case has the highest maximum velocity. Figure 3 shows the three grids employed. Table 2 gives the number of grid points between fins (S), across the fin height (H), and over the fin length (L). This table also gives the total number of grid points employed, the computed bypass, loss, heat-transfer rate, average heat flux (q”), and difference between inlet and outlet pressure. Figure 4 shows the velocity profile as a function of z at (x = 0.01 L, y = H/2), generated by using the three grids. From Table 2 and Figure 4, it can be seen that the baseline grid with 2.695 million nodes and fine grid with 11.586 million nodes yielded results that differ by <1%. Thus, the baseline grid was used for the rest of the study.
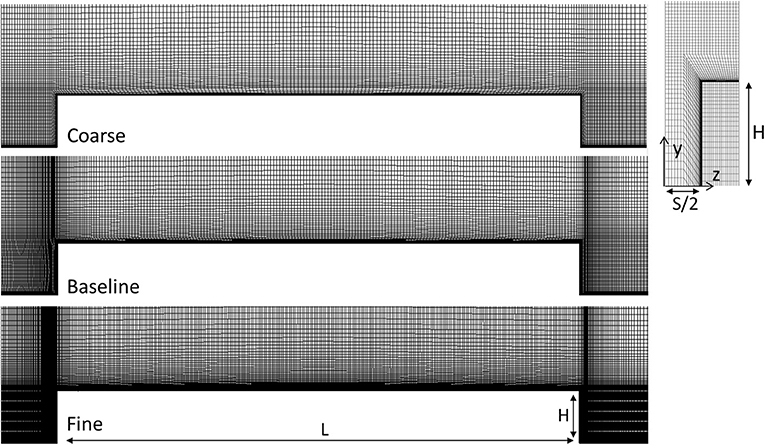
Figure 3. Grids used in grid-sensitivity study.
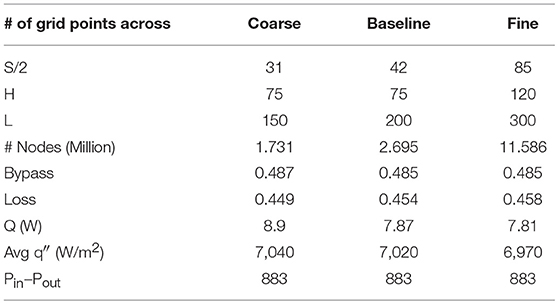
Table 2. Grid-sensitivity study.
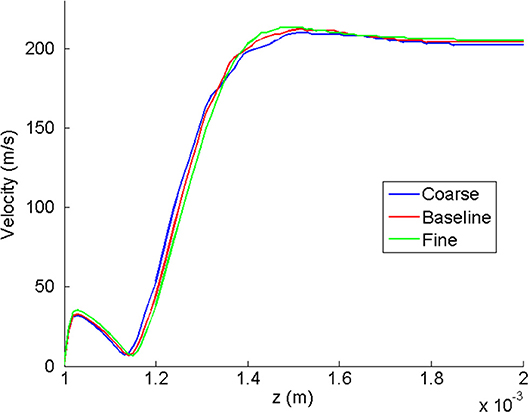
Figure 4. Velocity profile for three grids (case 4).
Results
In this section, the results obtained to show how geometry and operating conditions affect bypass, loss, pressure drop, and heat transfer on surface coolers with continuous and segmented fins are described.
Continuous Fins
This section describes results obtained for surface coolers with continuous fins.
Figure 5 shows bypass, loss, and heat-transfer rate as a function of C/H. From Figure 5A, it can be seen that bypass and loss increase as the height of the channel increases. However, beyond C/H ≈ 20, further increases in C has minimal effect on bypass, loss (<3%). The behavior of the heat-transfer correlates with bypass and loss. When bypass and loss are low, heat-transfer rate is high, and when bypass and loss are high, heat-transfer rate is low (Figures 5C,D). Also, increasing C/H beyond 20 results in no additional decrease in the heat-transfer rate. Since bypass, loss, and heat-transfer rate are essentially independent of C/H when C/H ≥ 20, C/H was henceforth set equal to 20 for the rest of the studies. Note that since y = C is a symmetry plane, C/H = 20 implies the clearance must be 2(C-H) = 2H(C/H−1) = 2H(19) = 38H to have no effects from the flow on the opposite wall. This condition is typically satisfied in aircraft applications.
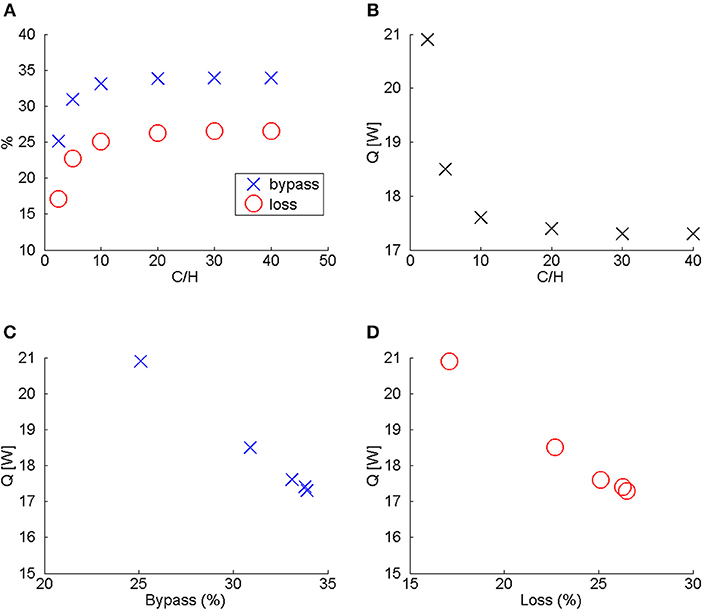
Figure 5. Effects of C/H on bypass, loss, and heat-transfer rate (Cases 1-6). (A) Bypass and loss as a function of C/H. (B) Heat-transfer rate (Q) as a function of C/H. (C) Heat-transfer rate (Q) as a function of bypass. (D) Heat-transfer rate (Q) as a function of loss.
To understand the effects of C/H, start with C/H = 1. When C/H = 1, there is no bypass or loss since the surface coolers on the two opposite walls will be touching each other. If C/H > 1, then there will be space between the two surface coolers for bypass and loss to take place. When C/H is greater than unity but less than some critical value (≈ 20 for the configurations studied), the two surface coolers still affect each other and impedes bypass and loss. However, once C/H exceeds about 20, the effects of the displacement thicknesses created about each surface cooler no longer affect the bypass and loss on the other surface cooler.
Figure 6A shows that bypass and loss are relatively unaffected by conjugate heat transfer, since conjugate and isothermal-wall simulations yielded essentially the same results for a range of air and wall temperatures (<<1% relative difference for cases 4, 7–9). Therefore, remaining simulations were performed with isothermal walls when examining bypass and loss. Heat-transfer rate from the fins is, however, strongly affected by conduction in the solids since the temperature on the fin surfaces decreases along y, and this will be discussed later.
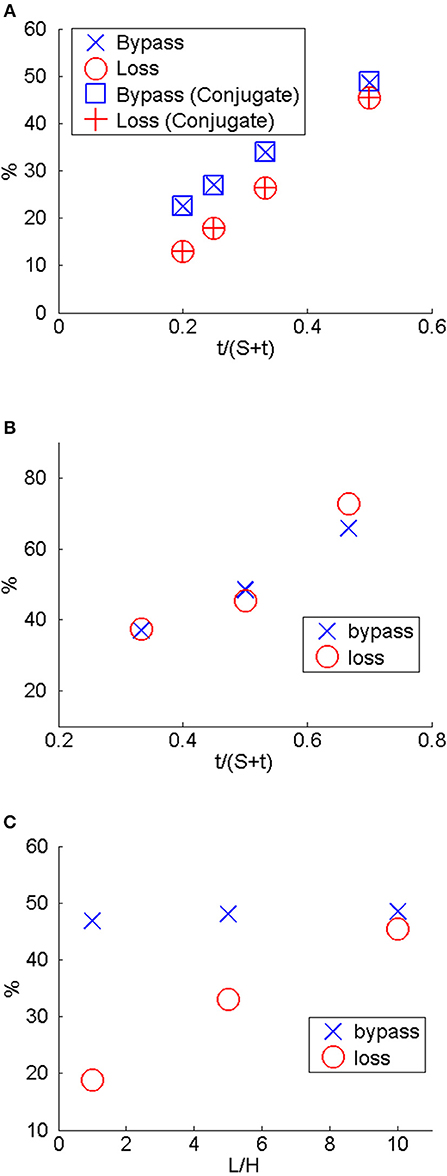
Figure 6. Bypass and loss as a function of: (A) S/H and conjugate vs. isothermal (Cases 4, 7–9). (B) t/H (Cases 7, 10, 11). (C) L/H (Cases 7, 12, 13).
Figure 6A also shows bypass and loss for different spacing between fins (cases 4 and 7–9). In this figure, it can be seen that the further the fins are to one another, the lower is the bypass and loss. The decrease in bypass is expected because the area available for the air to flow between the fins increases. The reason for the decrease in loss is more complicated and will be explained when examining how pressure changes with fin spacing in connection with Figure 9. Figure 6B shows the effect of fin thickness on bypass and loss. From this figure, it can be seen that increasing the fin thickness increases bypass and loss. This is because increasing t for a given S increases the blockage for the oncoming flow. Figure 6C shows the effects of L/H on bypass and loss. From this figure, it can be seen that L/H has a small effect on bypass. This is because bypass is dominated by the stagnation region induced by the fin's leading edge. L/H, however, does affect loss. As length increases, the loss also increases. This is because for sufficiently long L, all flow that entered the region between the fins will exit the fins at y = H because of pressure rise from viscous forces. If bypass, loss, and pressure drop were plotted as a function of t/(S + t), which is a measure of the blockage created by the fins of the surface cooler, then all increase monotonically with t/(S + t).
Figure 7 shows the effect of S/H on the flow around the leading edge of the fins. This figure shows streamlines colored by velocity on a plane at y = H/2. From this figure, it can be seen that the flow separates around the leading edge. This separation bubble at the leading edge increases in size as S/H increases. Also for the range of parameters studied, as S/H increases, the maximum velocity between the fins decreases because bypass and loss are less and because the vena contracta effect diminishes.
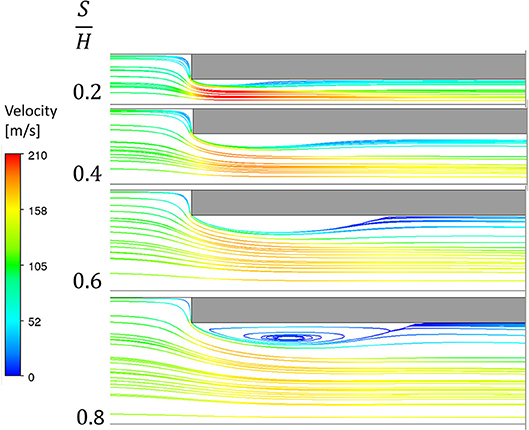
Figure 7. Streamlines colored by velocity at y = H/2 (Cases 4, 7–9).
Figure 8 shows the heat-transfer rate to the fins, Q, and the pressure drop across surface cooler from the inlet to the exit, Pin–Pb as a function of fin spacing, S/H. As noted, although bypass and loss are relatively unaffected by conjugate heat transfer, heat transfer is strongly affected by whether conjugate heat transfer is accounted for, and this can be seen in Figure 8A. Also from this figure, it can be seen that Q increases as S/H increases until S/H ≈ 0.4. For S/H > 0.4, further increases in spacing have minimal effect on the heat-transfer through the fins. As S/H increases from 0.2 to 0.4, Q per fin increased greatly from 12.8 to 14.3 W because bypass and loss greatly decreased from 48.5 to 26.3% for bypass and 54.4 to 26.3% for loss. The reason that Q did not increase more when S/H increased from 0.2 to 0.4 is because the size of the separation bubble that forms at the leading edge of the fin increases in size as S/H increases. As S/H exceed 0.4 for the operating conditions being studied, though bypass and loss continue to reduce—albeit at a much slower rate—the separation bubble also continues to increase in size. The net effect is essentially little increase in Q. This indicates that the fin's leading edge should be designed to eliminate or reduce the size of the separation bubble at its leading edge to fully benefit from the reduction in bypass and loss. By plotting Q as a function of fin blockage, t/(S+t), Q reaches a maximum of 17.6 W when t/(S+1) = 0.25 if isothermal wall and a maximum of 7.31 W when t/(S+1) = 0.25 if conjugate heat transfer is accounted for. This shows that there is an optimal blockage from the heat-transfer perspective.
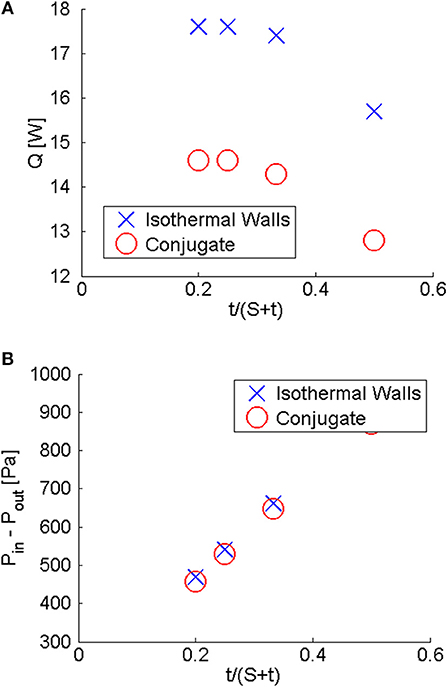
Figure 8. Effects of S/H on heat-transfer rate (Q) and pressure drop (Pin-Pout) (Cases 4, 7–9). (A) Heat-transfer rate as a function of S/H. (B) Pressure drop as a function of S/H.
On pressure drop, Figure 8B shows that, like bypass and loss, it is relatively unaffected by conjugate heat transfer. This figure also shows that pressure drop decreases as S/H increases, and the rate of decrease is less at higher S/H. Pressure drop decreases as S/H increases is primarily due to the number of fins per unit area and the interactions of the boundary layers on the fin surfaces that face each other. When S/H is small, the boundary-layer increases are strong which increases pressure drop. As S/H increases, those interactions reduce and the number of fins per unit area dominates in determining the pressure drop.
Figure 9 show the effects of S/H and t/H on pressure and velocity magnitude. From this figure, it can be seen that the fin creates a stagnation region upstream of its leading edge (x = 0), where the pressure reaches its highest value and the velocity magnitude approaches zero. This region of high pressure and low velocity magnitude extends considerably upstream of the fin's leading edge as well as spanwise to the region between the fins. The degree of the fin's upstream and spanwise influence is a strongly affected by S/H and t/H. The smaller the S/H, or greater the t/H, the stronger is the effect. As the flow approaches the fin, part of it is diverted away from the fin by the stagnation region (bypass). For the part that enters into the region between the fins, it accelerates because of the reduced cross section area and because of the vena contracta effect from separation at the leading edge of the fin. At the vena contracta, the velocity magnitude is the maximum and the pressure is the minimum. Note that the maximum pressure created by the flow approaching the fin and the minimum pressure created by the flow accelerating in the region between the fins creates a net force that has a component in the y direction. Thus, once the flow enters the region between the fins, a portion exits the fins at y = H (loss). The loss is highest near the fin's leading edge and decreases steadily.
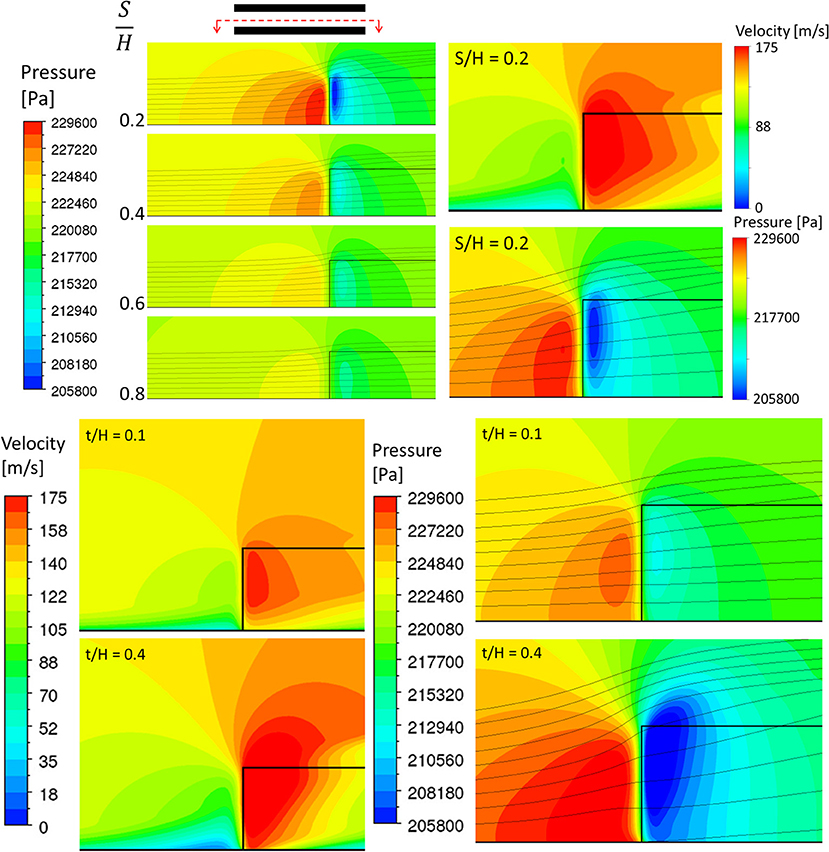
Figure 9. Effects of S/H and t/H on pressure and velocity magnitude with streamlines near fin's leading edge (Case 4, 7–9).
Figure 10 shows bypass and loss as a function of inlet velocity, temperature difference between the inlet and the surface cooler walls, and inlet temperature. These parameters were found to have minimal effects on bypass. However, for the smallest spacing between fins, these three parameters do affect loss. This is because the temperature and velocity at the inlet affect the boundary layer thickness approaching the fin. When the boundary layer is thicker, the pressure at the base of the fin is higher. This increases the component of the pressure gradient in the Y-direction, which increases loss.
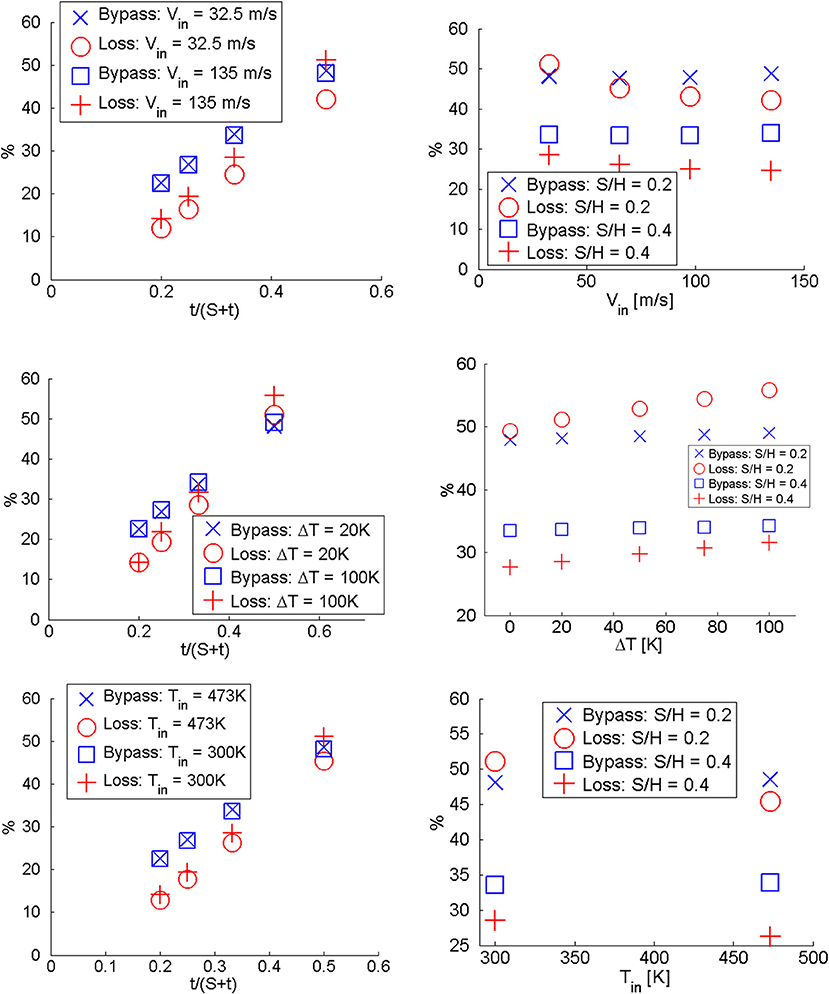
Figure 10. Effects of S/H, Tin, ΔT, Vin on bypass and loss. Top: Vin (Left: cases 14, 17, 26, 29, 30, 32, 34, 35. Right: cases 14–17, 22–25). Mid: ΔT (Left: cases 14, 21, 22, 29, 30–33. Right: cases 14, 18–21, 22, 26–29). Bottom: Tin (Left: cases 4, 7–9, 17, 25, 34, 35. Right: cases 7, 8, 17, 25).
Based on results of this study, bypass was shown to be a function of the ratio of the frontal area of the fin to the total area (t/(t + S)) and the clearance (C/H). When C/H > 20, bypass is very well modeled by simply considering the blockage area as shown by Equation (4). However, for C/H < 20, the effect of C must be accounted. Equation 5 is found from using power regression to the data generated to a curve and provides a method for estimating the bypass as a function of fin thickness, spacing, and channel height for rectangular fins. Figure 11 shows the CFD results plotted against Equations 4, 5. From that figure, it can be seen that Equations 4, 5 match the CFD results well with relative error <5%.
A dimensionless parameter to assess the performance of surface coolers is needed. Since the ideal surface cooler design is one with high heat-transfer rate and low pressure drop, the ratio of Nusselt number (Nu) to the pressure coefficient (Cp) could be useful in evaluating performance. Nu and Cp are defined by
where
Figure 12 shows how spacing between the fins affects Nu/Cp. From this figure, it can be seen that with conjugate heat transfer considered, Nu/Cp reaches a maximum at S/H ≈ 0.4, which corresponds to t/(S+t) ≈ 0.33 for a given H. When S/H exceeds 0.4 or correspondingly when t/(S+t) is smaller than 0.33, Nu/Cp decreases. By plotting Nu/Cp as a function of fin blockage, t/(S+t), Nu/Cp reaches a maximum of 7,500 when t/(S+t) = 0.5 if isothermal wall and a maximum of 6,210 when t/(S+t) = 0.33 if conjugate heat transfer is accounted for. This shows that there is an optimal blockage from the heat-transfer and pressure drop perspective.
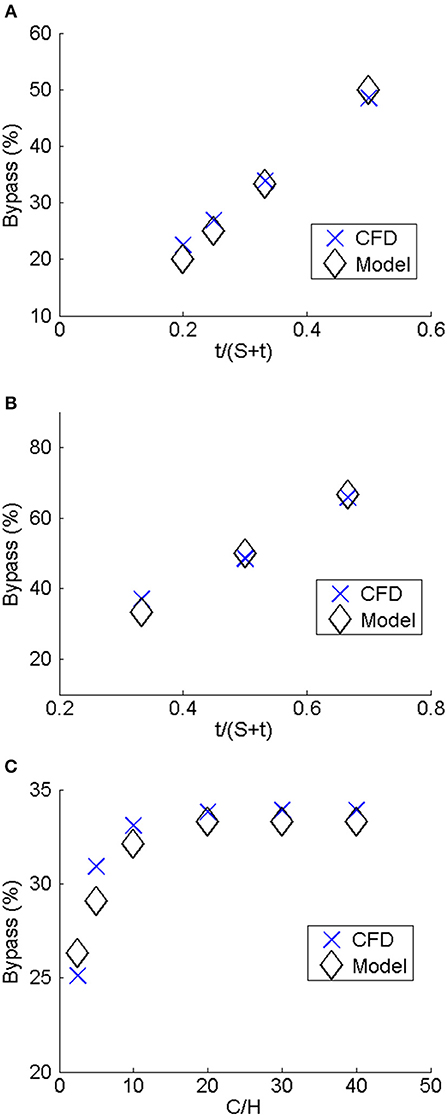
Figure 11. CFD results compared to model given by Equations 4 and 5. (A) S/H (cases 4, 7–9). (B) t/H (cases 7, 10, 11). (C) C/H (cases 1–6).
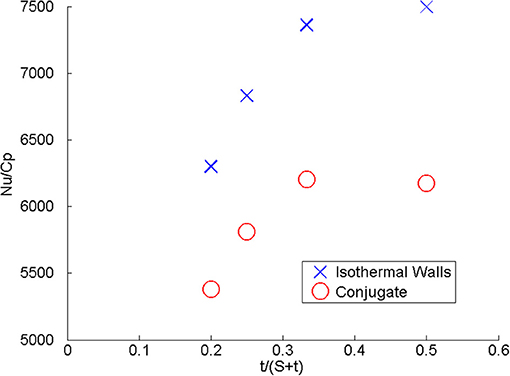
Figure 12. Effects of S/H on Nu/Cp (cases 4, 7–9).
Segmented Fins
Figure 13A shows the effects of segmenting the fin, both staggered and non-staggered arrangements, on bypass and loss. As can be seen in this figure, segmenting the fins has a small effect on bypass when compared to continuous fins. This is because the stagnation region induced by the fin's leading edge for segmented fins is nearly identical to that for continuous fins. However, for segmented fins, bypass occurs at the leading edge of each fin downstream of the first fin. Thus, the loss for segmented fins is substantially higher than those for continuous fins. For segmented fins, staggering the fins produce even more loss than non-staggered fins. Figure 13B shows the heat-transfer rate of segmented fins when compared to continuous fins. From this figure, it can be seen that Q is lower when the fins are segmented. This is because segmented fins have significantly higher loss as well as lower surface area. On pressure drop, Figure 13C shows that it increases when the fins are segmented, and is substantially higher when the segmented fins are staggered. This is because when the fins are segmented, each fin's leading edge creates huge disturbances in the flow field. Thus, the spacing between fins in the streamwise direction is a design parameter that needs to be examined. In particular, the spacing between fins should be designed to minimize flow disturbance and still enable the restart of the boundary layer to enhance surface heat transfer at the leading edge of each segmented fin. Figure 13D shows the effect of segmenting the fins on Nu/Cp. From this figure, for the geometries studied, segmenting the fins, and especially staggering the segmented fins, resulted in the worst surface cooler.
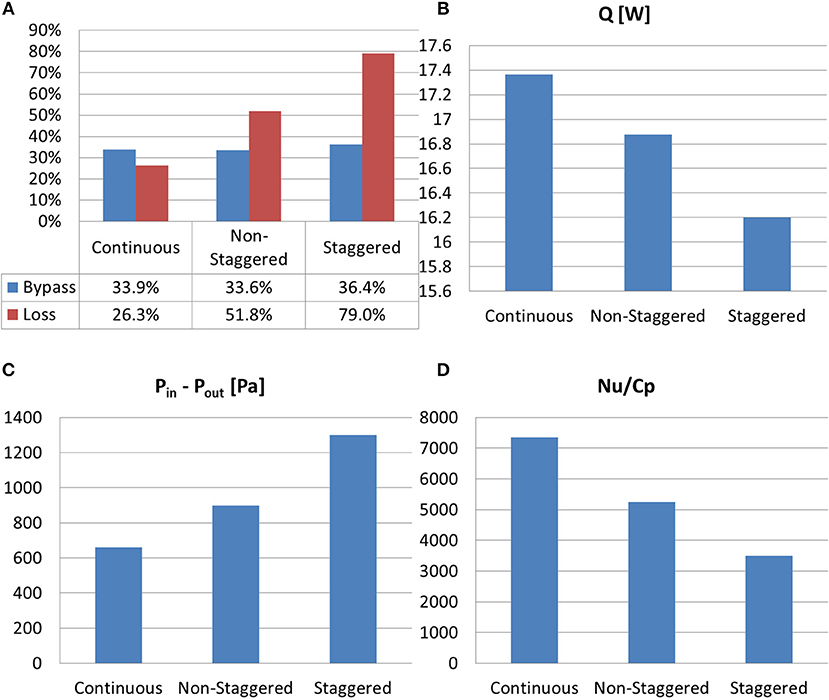
Figure 13. Continuous (case 4) vs. segmented (staggered and non-staggered) fins. (A) Bypass and loss. (B) Heat-transfer rate (Q) through the fins. (C) Pressure drop (ΔP). (D) Nu/Cp.
Summary
Steady RANS based on the SST model was used to study bypass and loss and their effects on heat transfer and pressure drop for two surface coolers, one with continuous fins and the other with segmented fins that are arranged in either staggered or non-staggered fashion. For continuous fins, this study found the clearance to have significant effects on bypass and loss up to a clearance of 38 times the height of the fin. The ratio of the frontal area of the fin (fin thickness) to the total area (fin thickness and the spacing between the fins) was also found to have a significant effect on bypass and loss. Bypass is dominated by the stagnation region in front of the fins' leading edge. Thus, the leading edge of fins should be designed to minimize the size of the stagnation region and reduce/minimize flow separation downstream of it. The temperature and velocity approaching the surface cooler has an effect on the boundary layer thickness and thereby affects the loss when the spacing between the fins is small. A model was developed for predicting bypass as a function of fin thickness, spacing between the fins, and the clearance. It was found that when the clearance is sufficiently high, bypass is very well modeled by considering the blockage area. Segmenting the fins was found to have little effect on the bypass, because the stagnation region induced by the fin's leading edge is nearly the same for segmented and continuous fins. However, segmenting the fins greatly increases loss because each of the downstream segmented fin's leading edge creates huge disturbances in the flow field. Thus, the spacing between fins should be designed to minimize flow disturbance and still enable the restart of the boundary layer to enhance surface heat transfer at the leading edge of each segmented fin. When bypass and loss are high, heat-transfer rate is low and pressure drop is high. Thus, decreasing bypass and loss is essential for improved heat transfer and reduced pressure drop. By using the parameter Nu/Cp, it was found that for the conditions studied, t/(S + t) = 0.33 gave the highest heat transfer per pressure drop when conjugate heat transfer is accounted for.
Author Contributions
JL carried out all aspects of the research, including the simulations and analysis of the results. JP assisted in the analysis of the results in the early stage of the work. TF and KY assisted in the interpretation and analysis of the results. TS framed the problem and provided guidance on all aspects of the research.
Funding
This work was supported by the Center for Integrated Thermal Management in Aerospace Vehicles and its member companies (Boeing, Honeywell, Lockheed Martin, Northrop Grumman, Raytheon, and Rolls-Royce).
Conflict of Interest Statement
The authors declare that the research was conducted in the absence of any commercial or financial relationships that could be construed as a potential conflict of interest.
Footnotes
1. ^CFX Version 17.1 ANSYS CFX-Solver Theory Guide, Ansys, Inc. (2016).
References
Chen, Z., Li, Q., Meier, D., and Warnecke, H. J. (1997). Convective heat transfer and pressure loss in rectangular ducts with drop-shaped pin fins. Heat Mass Transfer. 33, 219–224. doi: 10.1007/s002310050181
Jonsson, H., and Palm, B. (1998). “Thermal and hydraulic behavior of plate fin and strip fin heat sinks under varying bypass conditions,” in ITherm'98. Sixth Intersociety Conference on Thermal and Thermomechanical Phenomena in Electronic Systems (Cat. No.98CH36208) (Seattle, WA), 96–103. doi: 10.1109/ITHERM.1998.689525
Khan, W. A., Culham, J. R., and Yovanovich, M. M. (2008). Optimization of pin-fin heat sinks in bypass flow using entropy generation minimization method. ASME. J. Electr. Pack. 130, 031010-031010-7. doi: 10.1115/1.2965209
Kim, M., Ha, M. Y., and Min, J. K. (2016). A numerical study on various pin–fin shaped surface air–oil heat exchangers for an aero gas-turbine engine. Int. J. Heat Mass Transfer 93, 637–652. doi: 10.1016/j.ijheatmasstransfer.2015.10.035
Kim, M., Ha, M. Y., and Min, J. K. (2018). A numerical study on the aero-thermal performance of a slanted-pin-fin cooler under a high-speed-bypass condition. Int. J. Heat Mass Transfer. 119, 791–812. doi: 10.1016/j.ijheatmasstransfer.2017.12.010
Kim, S., Min, J. K., Ha, M. Y., and Son, C. (2014). Investigation of high-speed bypass effect on the performance of the surface air–oil heat exchanger for an aero engine. Int. J. Heat Mass Transfer 77, 321–334. doi: 10.1016/j.ijheatmasstransfer.2014.05.025
Lee, S. (1995). “Optimum design and selection of heat sinks,” in IEEE Transactions on Components, Packaging, and Manufacturing Technology: Part A, Vol. 18, 812–817. doi: 10.1109/95.477468
Menter, F. R. (1994). Two-equation eddy-viscosity turbulence models for engineering applications. AIAA J. 32, 1598–1605. doi: 10.2514/3.12149
Metzger, D. E., Fan, C. S., and Haley, S. W. (1984). Effects of pin shape and array orientation on heat transfer and pressure loss in pin fin arrays. ASME. J. Eng. Gas Turbines Power. 106, 252–257. doi: 10.1115/1.3239545
Nagarani, N., Mayilsamy, K., Murugesan, A., and Sathesh Kumar, G. (2014). Review of utilization of extended surfaces in heat transfer problems. Renew. Sust. Energy Rev. 29, 604–613. doi: 10.1016/j.rser.2013.08.068
Rohsenow, W. M., Hartnett, J. P., and Cho, Y. I. (1997). Handbook of Heat Transfer. New York, NY: McGraw-Hill.
Sata, Y., Iwasaki, H., and Ishizuka, M. (1996). “Development of prediction technique for cooling performance of finned heat sink in uniform flow,” in InterSociety Conference on Thermal Phenomena in Electronic Systems, I-THERM V (Orlando, FL), 108–114. doi: 10.1109/ITHERM.1996.534551
Simons, R., and Schmidt, R. (1997). A simple method to estimate heat sink air flow bypass. Electr. Cooling 3, 36–37.
Sousa, J., Villafañe, L., and Paniagua, G. (2014). Thermal analysis and modeling of surface heat exchangers operating in the transonic regime. Energy 64, 961–969. doi: 10.1016/j.energy.2013.11.032
Sparrow, E. M., and Beckey, T. J. (1981). Pressure drop characteristics for a shrouded longitudinal-fin array with tip clearance. ASME. J. Heat Transfer. 103, 393–395. doi: 10.1115/1.3244472
Sparrow, E. M., and Grannis, V. B. (1991). Pressure drop characteristics of heat exchangers consisting of arrays of diamond-shaped pin fins. Int. J. Heat Mass Transfer 34, 589–600. doi: 10.1016/0017-9310(91)90108-Q
Villafañe, L., and Paniagua, G. (2018). Aerodynamic impact of finned heat exchangers on transonic flows. Exp. Thermal Fluid Sci. 97, 223–236. doi: 10.1016/j.expthermflusci.2018.04.012
Villafañe, L., Paniagua, G., Kaya, M., Bajusz, D., and Hiernaux, S. (2011). Development of a transonic wind tunnel to investigate engine bypass flow heat exchangers. Proc. Inst. Mech. Eng. G 225, 902–914. doi: 10.1177/0954410011400127
Wirtz, R. A., Chen, W., and Zhou, R. (1994). Effect of flow bypass on the performance of longitudinal fin heat sinks. ASME. J. Electron. Pack. 116, 206–211. doi: 10.1115/1.2905687
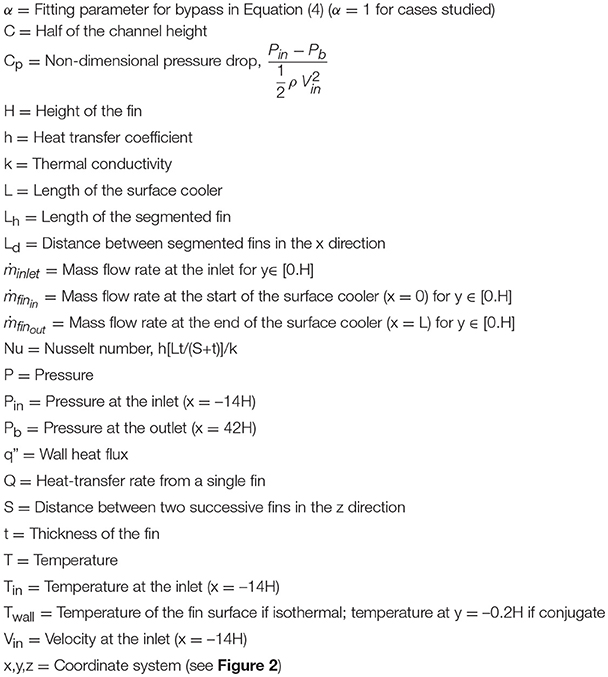
Nomenclature
Keywords: convective heat transfer, heat transfer, heat exchanger, surface cooler, fins, pressure loss
Citation: Liu J, Peck J, Yazawa K, Fisher TS and Shih TI-P (2019) Bypass, Loss, and Heat Transfer in Aircraft Surface Coolers. Front. Mech. Eng. 5:46. doi: 10.3389/fmech.2019.00046
Received: 31 December 2018; Accepted: 12 July 2019;
Published: 06 August 2019.
Edited by:
David B. Go, University of Notre Dame, United StatesReviewed by:
Seongkyun Im, University of Notre Dame, United StatesAlejandro Guajardo-Cuéllar, Escuela de Ingeniería y Ciencias, Tecnologico de Monterrey, Mexico
Copyright © 2019 Liu, Peck, Yazawa, Fisher and Shih. This is an open-access article distributed under the terms of the Creative Commons Attribution License (CC BY). The use, distribution or reproduction in other forums is permitted, provided the original author(s) and the copyright owner(s) are credited and that the original publication in this journal is cited, in accordance with accepted academic practice. No use, distribution or reproduction is permitted which does not comply with these terms.
*Correspondence: Jason Liu, bGl1MjRAcHVyZHVlLmVkdQ==