 Agostino Gambarotta
 Viola Papetti
 Panayotis Dimopoulos Eggenschwiler
- 1Department of Engineering and Architecture, Center for Energy and Environment - CIDEA, University of Parma, Parma, Italy
- 2Laboratory of Automotive Powertrain Technologies, EMPA - Swiss Federal Laboratories for Materials Science and Technology, Dübendorf, Switzerland
Today restrictions on pollutant emissions require the use of catalyst-based after-treatment systems as a standard both in SI and in Diesel engines. The application of monolith cores with a honeycomb structure is an established practice: however, to overcome drawbacks such as weak mass transfer from the bulk flow to the catalytic walls as well as poor flow homogenization, the use of ceramic foams has been recently investigated as an alternative showing better conversion efficiencies (even accepting higher flow through losses). The scope of this paper is to analyse the effects of foam substrates characteristics on engine performance. To this purpose a 0D “crank-angle” real-time mathematical model of an I.C. Engine developed by the authors has been enhanced improving the heat exchange model of the exhaust manifold to take account of thermal transients and adding an original 0D model of the catalytic converter to describe mass flows and thermal processes. The model has been used to simulate a 1.6l turbocharged Diesel engine during a driving cycle (EUDC). Effects of honeycomb and foam substrates on fuel consumption and on variations of catalyst temperatures and pressures are compared in the paper.
Introduction
In the last decades the constant need to reduce pollutant emissions from Internal Combustion Engines (ICEs) led OEMs both to enhance existing subsystems (e.g., fuel injection, valve actuation systems, etc.) and to introduce innovative solutions (with particular reference to after-treatment devices). As a matter of fact, in order to allow these technologies to be really effective, a proper and concurrent design of plant layout, control systems and management strategies is needed.
The complexity of systems and the large number of control variables require a deep understanding of processes that determine the behavior of the controlled powertrain as a system as a whole. The design of system architecture and of its control devices definitely need a solid theoretical support from physical models to outline system overall behavior, which is mostly non-linear and therefore difficult to predict. Mathematical models are powerful tools to estimate the influence of system layout and control strategies on the final result thus shortening the way from design specifications to on-road testing (Guzzella and Onder, 2010).
The application of fast mathematical models in the design of powertrains and related management systems is well-known for more than a decade and several examples can be found in the literature (Gambarotta and Lucchetti, 2011). A comprehensive scenario is outlined in (Guzzella and Onder, 2010). Typically Filling-and-Emptying (F&E) and Quasi-Steady Flow (QSF) approaches are used to build up 0D, lumped parameter models that are used both for the intake and exhaust systems and for in-cylinder processes, while still allowing for “real-time” simulations (Gambarotta et al., 2011; Gambarotta and Lucchetti, 2013). Even if chemical and physical processes taking place in the cylinder are very complex, “fast” models require simplified 0D single-zone approaches where combustion is considered through the definition of a proper fuel burning function (Heywood, 1988) and pollutant formation reactions through simplified mechanisms or—more often—with black-box models (Guzzella and Onder, 2010). Most commercial tools are based on these methodologies (as reviewed in Gambarotta and Lucchetti, 2011, 2013).
This scenario highlights the significant role of fast mathematical models in the simulation of complex systems, whose overall behavior arises from the interactions of different components and processes in a complex and not trivial way. Following this consideration, and in order to investigate the effects of different catalyst substrates on powertrains performance, a model of the after-treatment system has been developed and coupled with a “crank-angle” engine model (Gambarotta and Lucchetti, 2013). Particular attention has been given to foams as an innovative material for substrates (Bach and Dimopoulos Eggenschwiler, 2011). Obtained results are shown in the paper.
Open cell foams are cellular materials composed by interconnected solid struts arranged in cells that enclose void regions, and open window or pores. Such foams can be readily manufactured with different technologies and materials ranging from polymers, ceramics (Al2O3, cordierite, or SiC) and metals (Santoliquido et al., 2017). Open cell foams are innovative substrates characterized by high porosity, low density and high mechanical strength. In recent years they have been considered for various industrial applications like filters, thermal insulators, mechanical energy absorbers, silencers, heat exchangers, and catalytic reactors. As catalyst substrates they present several advantages over honeycomb monoliths and packed beds. The open cell structure allows higher flow uniformity, which is a critical factor for the pollutant conversion efficiency and for the catalyst durability (Zygourakis, 1989; Martin et al., 2000; Gaiser et al., 2003). In honeycomb monoliths the laminar flow in channels results in low heat and mass transfer. Instead, the network of solid struts of the open cell lattices is characterized by tortuous paths that enhance gas-wall interactions and contribute to lower thermal inertia (Giani et al., 2005; Lucci et al., 2016). In automotive applications a critical parameter is the pressure drop, which affects engine efficiency. Foams have higher pressure drop compared to a monolith with the same dimensions (Twigg and Richardson, 2007; Lucci et al., 2015; Von Rickenbach et al., 2015). This can be compensated by an increased mass transfer that allows downsizing the catalyst (Dimopoulos Eggenschwiler et al., 2009) or by different geometrical reactor configurations (Koltsakis et al., 2008). Some effort has been spent on their modeling. On the one side, high fidelity CT (Computerized Tomography) foam scans have been analyzed, on the other side, in order to reduce the computational load, foams have been modeled as regular structures with Kelvin cells (Boomsman et al., 2003; Giani et al., 2005; Inayat et al., 2011). It has been demonstrated that regular Kelvin cell substrates perform better than their corresponding randomized foams in terms of trade off between mass transfer and pressure drop (Lucci et al., 2016).
Recently, a variation of foam structure has been proposed based on the advances of additive manufacturing (AM) techniques. Such “foams” are composed by repeated unit cells with different shapes (Inayat et al., 2016; Bracconi et al., 2018; Papetti et al., 2018). Different unit cells have been proposed building interconnected structures. (Papetti et al., 2018) describes a systematic geometrical optimization of the regular open cell substrate and combines numerical simulation design and AM techniques for realizing the worldwide first, as far as the authors know, 3D printed catalyst substrate out of Cordierite for real vehicle applications.
It is not straightforward to quantify the influence of catalyst substrate structure on engine performance due to the different dynamic behavior of honeycombs and foams during transients and to the high non-linearity of the overall engine system. To compare the influence of honeycomb and foam substrates an original 0D mathematical tool has been developed and used to model an up to date 1.6l turbocharged Diesel engine. Simulation results obtained with reference to an EUDC driving cycle are reported in the paper showing the effects of these different supports on catalyst thermal transients and on fuel consumption.
Real-time Modeling of the Engine and Exhaust After-Treatment System
“Crank-Angle” Engine Model
For the purpose of this work the engine model described in Gambarotta et al. (2011) and Gambarotta and Lucchetti (2013) has been used, considering a turbocharged engine with EGR. In-cylinder and gas exchange processes were described using a QSF approach for intake and exhaust valves and a F&E method for manifolds and cylinders. Combustion is considered defining a proper Heat Release Rate (HRR) and pollutant formation is estimated through black-box sub-models. An original algorithm has been developed for the integration of conservation equations in the cylinder with a suitable time step (tuned to keep an angular step of ~1° CA for any engine speed n), while keeping a larger overall time step for intake and exhaust systems. Fuel system model takes account of the fuel rail dynamics (through its bulk modulus), of injectors flow characteristics and of leakages and allows to calculate injected fuel flow rate from rail pressure prail and Energizing Time ET. Black-box map-based models have been used for compressor C and variable geometry turbine (VGT).
Cycle averaged value of equivalence ratio φ is calculated from total intake air mass (obtained by integrating air mass flow rate over each cycle) and the total fuel mass injected per cycle (estimated from injected fuel flow rate). Mass flow rates of considered pollutants (CO, HC, and PM), required to calculate pollutant concentrations Xmi in the exhaust gases and then heat generated by the oxidation reactions inside the catalyst (see Catalyst Model), are estimated as a function of equivalence ratio φ and of engine speed n through experimental maps, arranged in look-up tables in the following form:
The model and its causality scheme are described in Gambarotta et al. (2011) and Gambarotta and Lucchetti (2013). It has been used for the simulation of several automotive engines (both SI and Diesel) calibrated and validated comparing model output with experimental data, as reported in detail in Gambarotta and Lucchetti (2011, 2013) and Gambarotta (2017). The proposed model has been also used in an original PC-based Hardware-in-the-Loop (HiL) system developed by the authors (Gambarotta et al., 2012) showing good ability to predict the behavior and performance of the engine and related sub-systems both in steady and transient operating conditions.
Exhaust System and Catalyst Model
Heat transfer processes in the exhaust system have a key role in the simulation of ICEs due to the significant influence of exhaust gas temperature on after-treatment systems efficiency. Therefore, a careful description of heat exchange processes is fundamental especially during critical transients (e.g., catalyst “light-off,” particulate trap regeneration, etc.). Other emission critical phases of engine operation are long time operation at low load, when the after-treatment system is significantly cooled down, as well as at highest load, when temperatures are high enough but exhaust mass flow rates force the catalyst to operate under mass transfer deficiency. For this reason, although within the limitations imposed by a 0D approach, particular attention has been dedicated to the simulation of thermal behavior of the exhaust system.
Working fluid has been considered as a mixture of perfect gases defined through a vector of mass concentrations Xmi referred to 7 chemical species, i.e., N2, O2, CO2, H2O, CO, H2, and NO. Extensive properties ρ and cp are calculated as a weighted average taking into account mixture composition, and k = cp/cv is known from cp and gas mixture constant R. Intensive properties μ, Pr, and λ cannot be calculated that way. Dynamic viscosity μ is calculated as a function of equivalence ratio φ through an experimental correlation (Heywood, 1988):
Pr is estimated with the following expression (Heywood, 1988):
Finally λ is obtained from the definition of Pr:
Model of the Exhaust Manifold
The mathematical model of the exhaust manifold has been developed following a F&E approach. Temperature and pressure are obtained from the equations of conservation of mass and energy applied to the manifold considered as a 0D volume. Estimating heat flow through manifold walls as suggested in Guzzella and Onder (2010), energy conservation equation for exhaust gases inside the manifold can be written as follows:
where is the heat flux from the gas mixture to the manifold walls. Enthalpy of gases leaving the manifold htur and hEGR are calculated assuming that gas temperatures are equal to that inside the manifold.
In the presented model the thermal inertia of the exhaust manifold has been considered assuming a defined overall mass mw and a constant specific heat cw for the manifold walls (Figure 1). Manifold walls temperature has been assumed uniform, and its changes have bene estimated through the following differential equation:
where and are heat flux between gas stream and walls and between walls and ambient air, respectively. These heat fluxes can be calculated with reference to the well-known schematic description reported in Figure 1, where heat is exchanged by convection and radiation between gas flow and internal walls, by conduction through the walls and by convection and radiation between external walls and ambient air. In the proposed model, however, internal radiation has been considered negligible. Even if the real geometry of the manifold is complex, it has been modeled as a single cylindrical pipe with a proper length L to keep the calculation burden within the limits of the 0D approach.
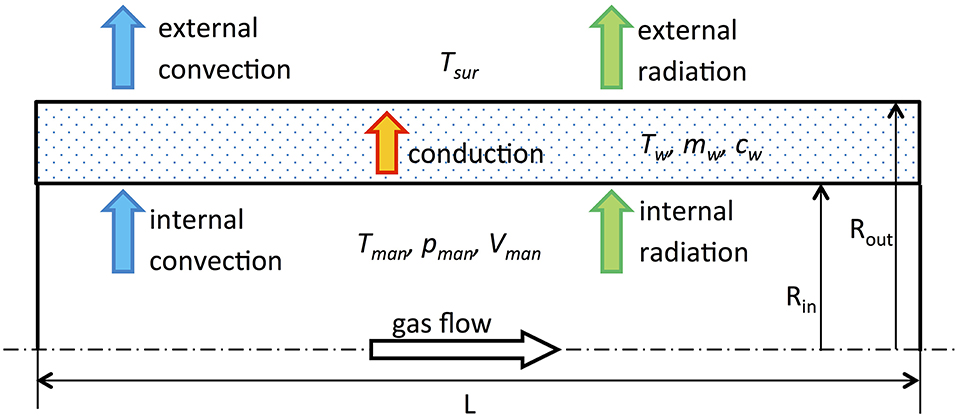
Figure 1. Schematic of the exhaust manifold flows.
To estimate a specific correlation suggested in the literature for intake and exhaust systems of ICEs has been used in the following form (Depcik and Assanis, 2001):
The term Prc often assumes a value close to 1 and values for a and b are defined from measurements. The value of Nu was estimated from the Gnielinski correlation reported in Konstantinidis et al. (1997) and Kandylas and Stamatelos (1999) introducing as suggested a suitable Convective Augmentation Factor to take account of flow unsteadiness and turbulence defined as follows:
where Nueff and Nuth are effective and theoretical value respectively. The last value can be estimated through well-known correlations from Konstantinidis et al. (1997) and Kandylas and Stamatelos (1999):
and
where
and
Then convection coefficient and heat flux can be calculated, since:
and
where Pr, μ, and λ for the exhaust gas are estimated at Texh_man temperature, assumed as uniform in the exhaust manifold.
The estimation of convective heat flux from manifold walls to ambient air is more difficult due to the component geometry and to external flow pattern. For the sake of simplicity, manifold geometry has been assumed as cylindrical and external flow field uniform and related to the vehicle speed. The model is based on the correlation proposed in Konstantinidis et al. (1997) and Kandylas and Stamatelos (1999), thus estimating Nu as follows:
where Nuout_lam and Nuout_tur are functions of Re and Pr numbers as follows:
and
From Nuout convection coefficient and heat flux can be calculated since
and
where Aout is the external manifold area. Thermodynamic properties Pr, ρ, μ, and λ are estimated with reference to the film temperature (i.e., at the average value between manifold walls temperature Tw and surrounding external air temperature Tsur).
External radiation heat flux has been estimated assuming external wall of the manifold as a gray surface in a cavity of infinite extension. Therefore, it can be calculated through the well-known Stefan-Boltzmann relationships (Incropera et al., 2013):
where Aout is the external area of the manifold, ε is the emissivity, σ is the Stephan-Boltzmann constant and Tw and Tsur are wall and external surrounding air temperatures respectively.
Total heat flux from the collector can be calculated from convection and radiation values as
Catalyst Model
A catalytic converter is a complex component from the point of view of both gas flow pattern and of chemical reactions. Fluid dynamics, heat and mass transfer processes have a significant role in its behavior and should be carefully considered. Taking account of the aims of the presented work, neither a 3D (e.g., Lucci et al., 2014, 2015; Von Rickenbach et al., 2014) nor a 1D modeling technique (e.g., Shamim et al., 2002; Pontikakis et al., 2004) were used. A 0D approach has been followed assuming for each component a uniform spatial distribution of thermodynamic parameters and applying conservation equations with empirical correlations where required. The developed model proved to be able to simulate catalyst behavior and its influence on powertrain performance during significant transients (e.g., driving cycles) with very short calculation time and taking account of system layouts, sizes of components and control strategies adopted during transients.
The model has been developed according to the causality reported in Figure 2. Two volumes were considered (in light blue upstream and downstream of the catalytic core) following a F&E approach. The model of the core (in orange) was based on a QSF procedure (i.e., assuming no accumulations of mass and energy). Since processes in a catalytic converter are complex and typically three-dimensional, proper assumptions had to be introduced to capture their overall effects still limiting the simulation burden. Therefore, processes that happen in the core were simplified splitting the model in two modules, as shown in Figure 3: the “gas model,” which describes gas flow in the catalyst, and the “monolith model,” which reproduce the thermal behavior of the catalyst core. At each time step mass flow and temperature changes through the core were estimated solving the two set of algebraic equations from the two modules, which are coupled through heat exchanges between exhaust gas and substrate walls (according to Figure 3).
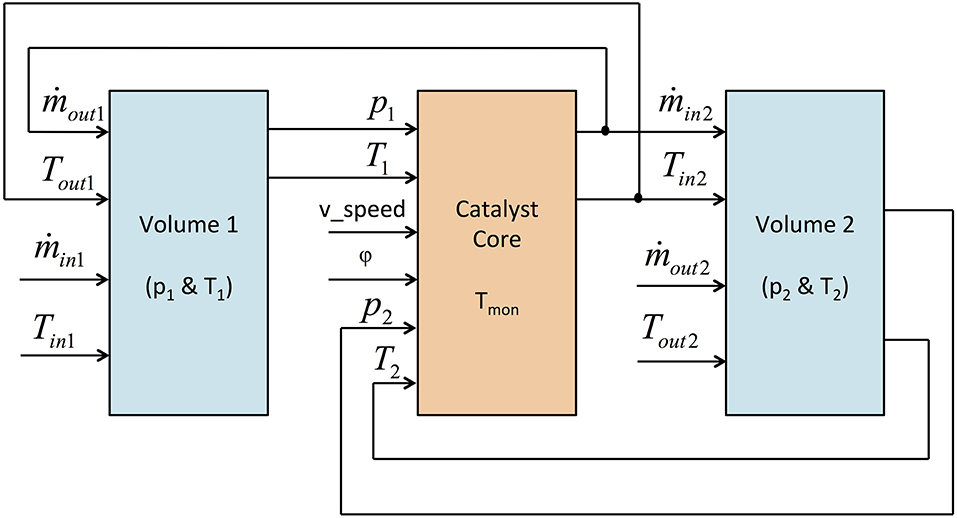
Figure 2. Schematic and causality of the catalyst model.
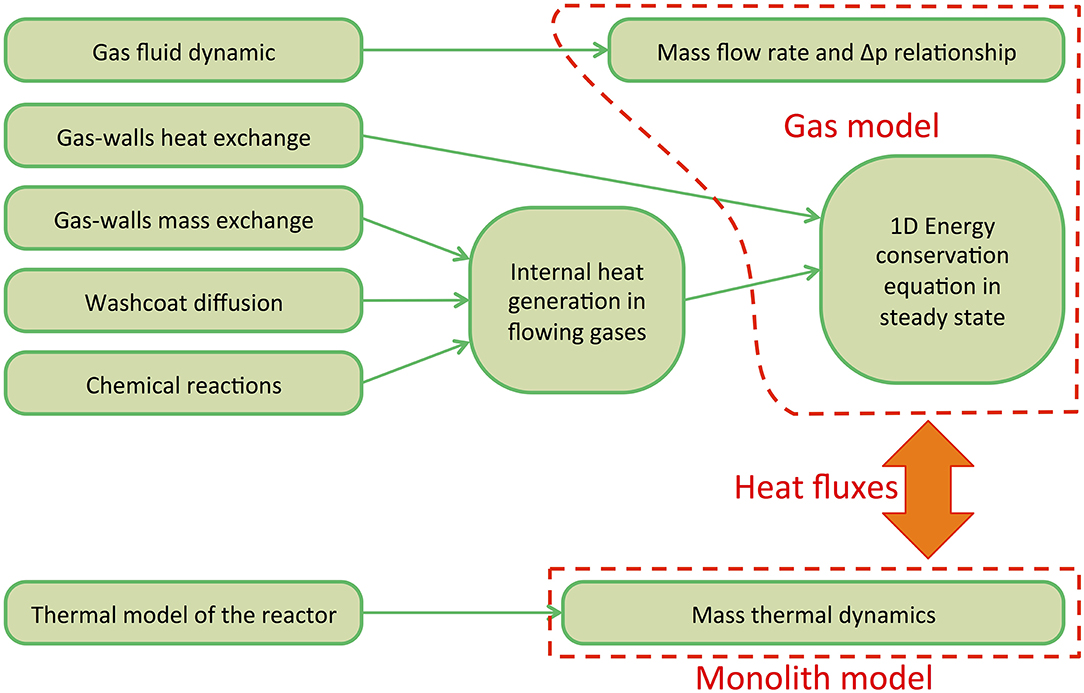
Figure 3. Layout of the model of the catalyst core.
The “gas model” has been developed as shown in Figure 4. At each time step values of pressure p and temperature T in the two adjacent volumes are used to calculate pressure difference Δp, mean pressure pm, and temperature Tm (taking account of flow direction). Assuming the catalyst core as a concentrated flow resistance (without mass accumulation) gas mass flow rate can be estimated through an empirical algebraic correlation in the following form:
where ρ and μ (as other fluid properties) are calculated at pm and Tm with regard to the composition of exhaust gases. The geometry of the catalyst involves both the overall dimensions of the core and its morphological characteristics (honeycomb/foam, porosity, etc.). Then gas temperature at the core exit can be defined integrating the energy conservation equation in 1D and in steady state:
where axial heat exchange and variation of kinetic and potential energy in the gas are neglected (as usually considered; Pontikakis et al., 2004), A' is the specific contact area per unit length and qgen is the 1D distribution of heat generation along the axial length of the core (between x = 0 and x = L). Gas properties are evaluated at pm and Tm and assumed constant.
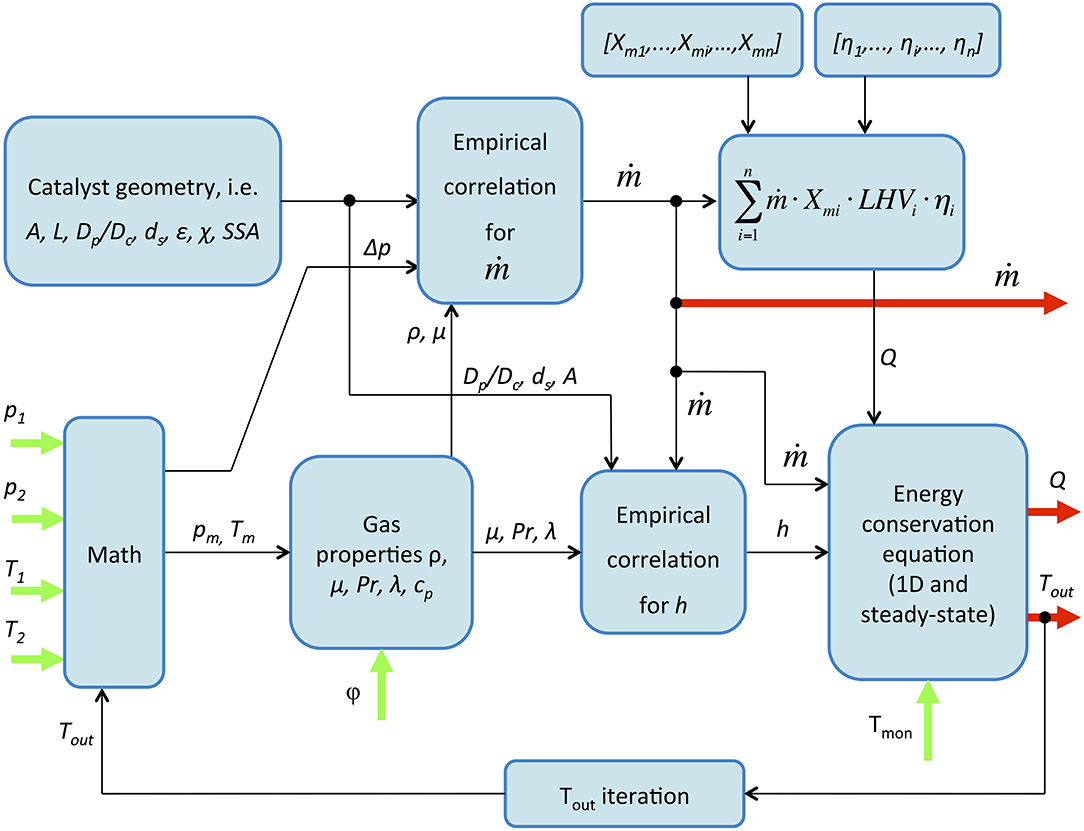
Figure 4. Structure of the “gas model” module (input and output variables are in green and red, respectively).
The convective heat exchange between gas and core is described as usual through a convection coefficient h obtained from Nu estimated with an empirical correlation in the following form (Konstantinidis et al., 1997; Kandylas and Stamatelos, 1999):
Wall temperature of the monolith Tmon is assumed constant in the time step, i.e., both axial and radial temperature gradients are neglected following the 0D approach in order to limit simulation time.
Molecular diffusion of different species and chemical reactions in the gas mixture and in the core has not been considered. However, the overall effects of unburnt species oxidation are replicated in terms of generated heat through the following expression (in [W/m]):
which represents a 1D distribution of heat generation along the axial length of the core (between x = 0 and x = L). is overall heat flux (in [W]) produced in the core volume due to the oxidation reactions of the pollutants and is estimated from exhaust gas mass flow rate ṁ, pollutant concentrations Xmi, corresponding lower calorific values LHVi and conversion efficiencies ηi as follows:
The number N and the type of involved pollutants depend on the specific application. In the presented model CO and one or more species representative of HC have been considered, since their oxidation reactions were assumed as the most significant in the determination of the catalyst temperature. It should be noted that working fluid has been considered as a mixture of 7 chemical species, i.e., N2, O2, CO2, H2O, CO, H2 NO. The vector of pollutant concentrations {Xmi} in the exhaust gases (i.e., engine out gases) can be obtained from experimental data in form of look-up tables as functions of engine operating parameters (e.g., equivalence ratio φ, engine speed n and power output; Fiorani et al., 2008). In the same way the vector {ηi} of conversion efficiencies can be defined through look-up tables defined experimentally as a function of monolith temperature Tmon and gas velocity (Fiorani et al., 2008). This approach (which is mainly black-box, as usually required by Real-time models) allows considering further reactions that may occur in the catalyst by introducing proper empirical correlations for the simulation of different catalytic converters and after-treatment systems.
The term qgen (which is a function of axial coordinate x, of core length L, of the number N of involved pollutants and of overall heat flux from oxidation of unburnt compounds) depends on reaction rates in the catalyst core that are influenced by many complex processes: chemical kinetics at low temperatures, diffusion in the monolith pores at medium temperatures and diffusion in gas phase at high temperatures. Therefore, if temperatures are high enough, chemical species can be supposed to react instantly as soon as they reach substrate walls. Assuming a concentration of chemical species in flowing gases that falls exponentially along the axial abscissa, and recalling that diffusive mass exchange is proportional to the difference in concentration, an exponential distribution of heat generated from unburnt compounds has been assumed, expressed in the following form:
Coefficients a and b can be determined imposing that the integral of qgen along the substrate length is equal to the overall heat flux generated in the core, i.e.,:
and assuming that the ratio qgen(0)/qgen(L) = 100. Therefore, the following expressions for a and b are obtained:
The integration of energy conservation equation in 1D and in steady state between x = 0 and x = L allows to define gas temperature changes along the core. For x = L the gas outlet temperature Tout can be determined.
Heat flux between gas and monolith in each time step can be estimated through the equation:
It should be noted that since properties of gas mixture are determined with reference to the average temperature in the core, the value of Tout is estimated through an iterative calculation (do-while procedure, Figure 4) with a 0.1K threshold.
For the estimation of changes of mean temperature of the monolith Tmon the energy conservation equation can be used in the following form:
In addition to the heat flux exchanged with gases and to monolith thermal capacity mmon·cmon, also heat flux to external ambient air is required.
Even if different configurations can be found, the most common technique is to fit the monolith into a metal casing with a layer of interposed insulating material: this layout has been assumed in the developed model, as schematically shown in Figure 5. Heat transfer occurs from the monolith to the ambient air first by conduction through the layer of insulating material and metal casing and then by convection and radiation from the external walls to ambient air. In this case convection can be either forced or natural depending on the vehicle speed v, which therefore represents an input parameter for the model. Following a Quasi-Steady approach, the steady-state heat transfer process can be simulated within each time step assuming two thermal resistances in series, and the overall thermal resistance can therefore be expressed as:
where Rt_cond is due to conduction and Rt_conv and Rt_irr are related to convection and radiation heat transfer to the outside.
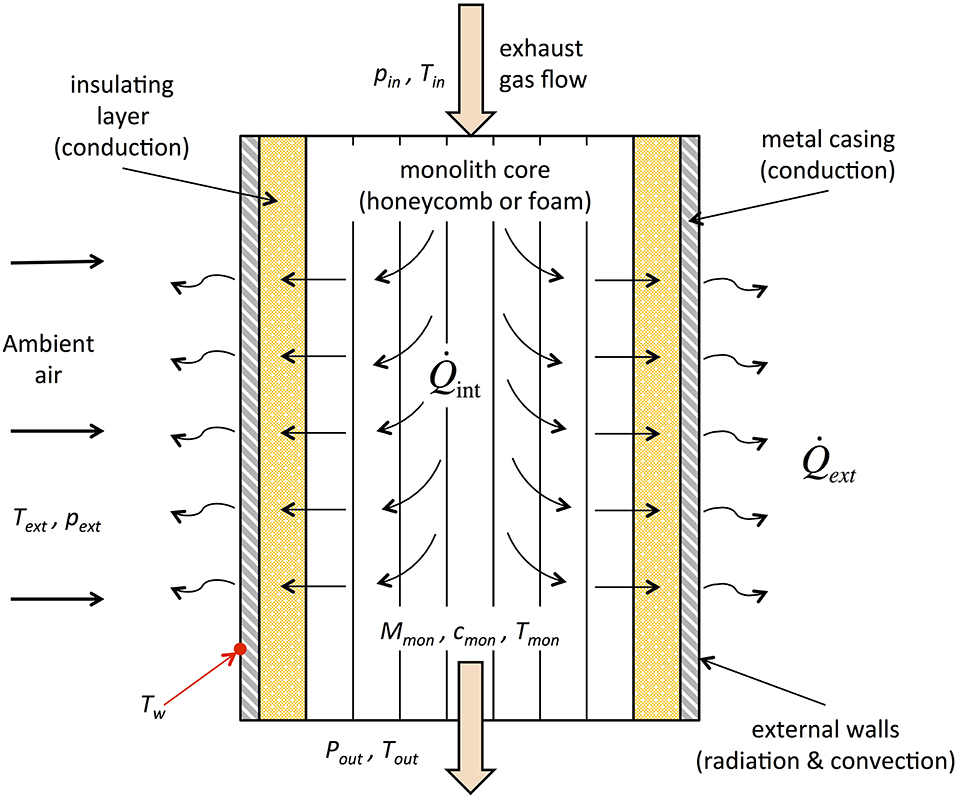
Figure 5. Schematic of flow and heat exchange processes in the catalyst core.
Taking into account only the insulating material layer (i.e., neglecting the thermal resistance of the metal casing) and assuming a cylindrical geometry, Rt_cond has been calculated through the following relationship (Incropera et al., 2013):
Forced convection to ambient air can be considered assuming a cylindrical casing with radius equal to rext: therefore
where
assuming a gain factor of 3/2 to take account of axial conduction in the metal casing.
The convection coefficient h is obtained starting from Nu (Incropera et al., 2013): the following correlation from Churchill and Bernstein (which does not require coefficients that vary with Re and is valid for a wide range of Re and Pr) has been used:
where
v is the velocity of the undisturbed flow, supposed equal to that of the vehicle. Then h can be calculated with the following relation:
As regards thermal radiation, assuming the external wall of metal casing as a gray body inside a large cavity, corresponding heat flux can be estimated as Incropera et al. (2013):
from which
Finally, heat flux to external ambient air can be calculated as:
Parameters for forced and natural convection have been calculated with reference to fluid properties at the average temperature:
where Tw is known from the equation:
Therefore, the value of Tw is estimated through an iterative calculation with a 0.1K threshold.
The described procedure has been used for the simulation of different catalyst substrates (honeycombs or foams) by using suitable correlations to link mass flow rates and pressure changes in the catalyst core (concentrated flow resistance) and to determine Nu for heat exchange between exhaust gas and monolith. Specific correlations used for honeycombs and foams considered in the present work will be reported in the following paragraph.
Physical Identification of the Catalyst Model
The presented model of the after-treatment system has been then calibrated with reference to specific core geometries, honeycombs, and foams. Flow resistance and heat transfer processes have been identified from correlations available in literature and standard physical and geometrical properties have been used.
In honeycombs, the gas has to move in channels of very small section, and therefore the flow is mainly laminar. Correlations that link mass flow rate with Δp are very similar to those obtained for laminar flow in a pipe and can be expressed in the form p = f(ṁ), which can be rewritten in the inverse form ṁ = f(p) that is suitable for the block diagram of Figure 4. In the present study the following relationship has been used
or, placing
as suggested in Incropera et al. (2013) for fully developed laminar flow through a square-section duct.
As regards the foam, a first relation was derived from Giani et al. (2005), obtained from experimental tests on high porosity metal foams. The geometry of these foams was schematized assuming cubic cells with cylindrical struts neatly packed. Starting from the expression for load losses inside a pipe bank, the authors proposed the following correlation:
where in Re the characteristic dimension is the strut diameter ds and the velocity u is obtained by dividing the volumetric flow rate for the cross section area A of the monolith. G(ε) is the ratio between strut diameter ds and pore diameter Dp: for the considered geometry it depends only on the porosity ε and can be expressed as follows:
A second correlation, suggested in Lucci et al. (2014), has been considered for foams. To avoid significant dispersion typical of experimental data (due to variability of the tested foams), the authors propose a CFD 3D simulation as an alternative to real measurements for the behavior characterization of a foam (arguing for a greater control over geometrical parameters). In particular, with reference to a foam modeled as a set of Kelvin cells (Figure 6), and noting that pressure drop in a foam arise from drag forces exerted by the fluid on the struts, the authors in Lucci et al. (2014) propose the following correlation:
where χ is called “tortuosity” and represents the ratio between the length of the actual path followed by the fluid and the corresponding axial displacement. With reference of the complex geometry of foams, χ is usually far greater than 1. To fit the results of 3D simulations, drag coefficient CD has been defined in the following form (Lucci et al., 2014):
where Re is calculated with Dp as the characteristic length assuming an average velocity on the cross sectional area (therefore lower than the effective value inside the foam: for this reason in the previous equation the term χ2/ε3 is added). Although above equation allows the estimation of pressure gradient in axial direction (1D model), it can be used to calculate overall Δp, evaluating fluid properties at pm and Tm thus obtaining
The estimation of heat flow between exhaust gases and the internal surface of the monolith has been based on the calculation of convection coefficient h, which can be obtained from Nu. The correlation used for honeycomb has been derived from Giani et al. (2005) as follows:
where
For foams two correlations were used from the literature. The first one has been suggested in Giani et al. (2005), where the authors extend results obtained experimentally for the characterization of metallic foams. Nu is expressed as a function of Re and Pr with a classical formulation with two corrective coefficients defined from experimental data as follows:
where .
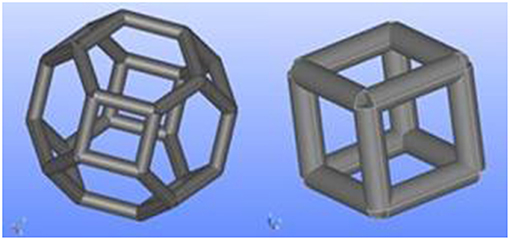
Figure 6. Three-dimensional and frontal view of a Kelvin cell (KC), from Lucci et al. (2014) and a cubic cell from Papetti et al. (2018).
A second correlation has been used for foams, derived from Lucci et al. (2014). For the estimation of Nu the following expression has been used:
where the Hagen number Hg is used instead of Re, defined as:
It should be recalled that the first correlation (Giani et al., 2005) is based on the schematization of the foam as a set of cubic cells (Figure 6) assuming strut diameter ds as a characteristic length. With this geometry only two out of four parameters Dp, ε, ds and SSA are independent, e.g., if Dp and ε are known, ds and SSA are obtained from the following equations:
The second correlations (Lucci et al., 2014) is derived from CFD simulations assuming the pore diameter Dp as a characteristic length and modeling the foam as a set of Kelvin cells (Figure 6). Also in this case two independent parameters are involved and the following relationships hold:
In Table 1 the different correlations for flow resistance and transfer properties for the structures considered in this paper are reported. Further details on them can be found in the referenced literature (Giani et al., 2005; Lucci et al., 2014).
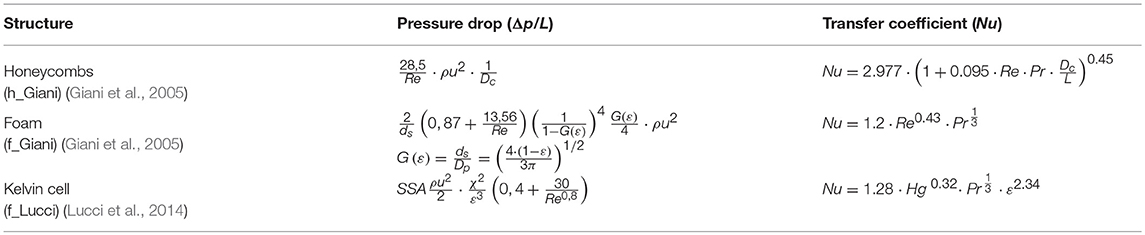
Table 1. Flow resistance and transport correlations used.
The total volume of the catalytic reactor is assumed to be 1.5 l with a reactor length of 15 cm. A standard honeycomb structure, identified in the following as “h_Giani,” is used as reference case and is characterized by a porosity of ε = 63%, a characteristic channel diameter of Dp = 1 mm and a specific surface area of SSA = 2,700 m2/m3. The honeycomb structure is compared to two open cell foam like structures, a real foam (Giani et al., 2005) identified as “f_Giani” and a synthetic Kelvin cell structure (Lucci et al., 2014) identified as “f_Lucci.” Both cell structures have porosity of ε = 73%, higher than the honeycomb, a lower surface area of SSA = 1,000 m2/m3 and characteristic pore dimension of dp = 2 mm. Other parameters assumed for the simulations are reported in Table 2: the volume of the monolith has been considered the same for honeycomb and foams (even if foams could require smaller volumes). Values of dp and ε lead to a honeycomb of about 400 cpsi, which can be considered a commercial standards, and value of Dp leads to foams of 12.7 PPI.
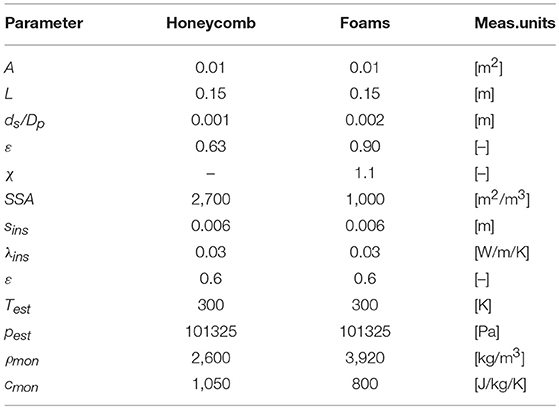
Table 2. Values of parameters assumed for the catalysts models.
Thickness sins and λins of the insulating layer have been assumed equal to 6 mm and to an average value for polyurethane foams. The value of overall hemispheric emissivity ε for the external metal surface varies greatly with the surface finish and oxidation state (from 0.1 for polished surfaces to 0.9 for strongly oxidized surfaces): in this case, since the outer casing usually does not have a particular finishes and moreover it could be oxidize, a value of 0.6 has been assumed. Specific density ρmon and heat capacity cmon of the monolith have been defined considering cordierite for honeycombs and Al2O3 for foams.
However, it should be recalled that all the above-mentioned parameters can be easily changed in the model, allowing to test and compare different geometries.
Development and Validation of the Engine Model
The exhaust system and the catalyst models have been coupled with a 0D “crank-angle” model of a turbocharged Diesel engine. The structure of the model (alternating volume and non-volume blocks) avoided numerical problems and algebraic loops (Gambarotta and Lucchetti, 2013).
The model has been identified with reference to a 1.6l turbocharged Diesel engine (main technical data are reported in Table 3) on the basis of steady-state experimental data from the OEM, which were used to define look-up tables and coefficients of interpolating functions through a least-square method (i.e., flow coefficients of intake/exhaust valves, pressure loss coefficients of air filter and exhaust system, etc.). Compressor and turbine models were identified on the basis of their characteristics from the manufacturer (Gambarotta and Lucchetti, 2013). Maps for the estimation of pollutants concentrations in exhaust gases are derived from Fiorani et al. (2008). The algorithm developed for the integration of model equations uses a constant principal time step of 2 ms and a variable time step for in-cylinder processes to keep an angular step of ~1° CA independently of engine speed n. In this application, on a 2 GHz PC with 2 Gb RAM, the ratio of simulation time to physical time was always remarkably lower than 0.65.
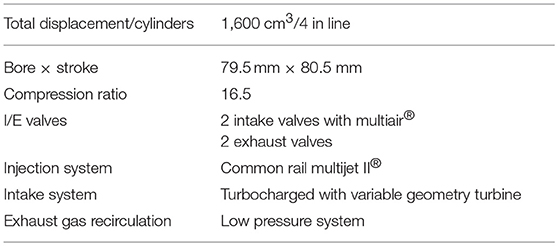
Table 3. Main technical data of the considered diesel engine.
Input parameters are engine rotational speed, fuel mass flow rate, driving signals for VGT and EGR, ambient temperature and pressure. Outputs can be every single one of the parameters estimated by the engine model, e.g., torque, bmep, effective power output, state parameters in the intake and exhaust manifold (i.e., p, T, Xmi), etc. Once identified, the engine model has been tested comparing calculated results with experimental data measured on a test bench in steady-state operating conditions by the OEM (other than those used for the identification), giving a good agreement as reported in Gambarotta and Lucchetti (2013).
Operating Conditions From the Driving Cycle
In order to highlight the influence of substrate characteristics on engine behavior, the Extra Urban Driving Cycle (EUDC) section of the New European Driving Cycle (NEDC) was chosen. To this extent input parameters (rotational speed, fuel mass flow rate, VGT and EGR driving signals) were defined through an inverse model of the vehicle (developed in Guzzella and Sciarretta, 2005). Vehicle data were identified with reference to the Alfa Romeo Giulietta 1.6 JTD. From time histories of speed and gear prescribed for the 400 s EUDC, instantaneous requested values for rotational speed and torque were computed and used as model input. Differences between target and actual engine torque have been used to estimate through a closed-loop PID control algorithm the injected fuel mass flow rate.
Simulation Results for the EUDC
Intake and Exhaust System Behavior
Thermodynamic parameters in the intake and exhaust systems obtained with different substrates were compared. As an example, in the following, several results are plotted with reference to the EUDC assuming the honeycomb substrate as a baseline (“h_Giani,” in solid red) and computed differences between the two open cell foam like structures (the real foam “f_Giani,” in solid green, and the Kelvin cell structure “f_Lucci,” in solid blue).
As expected, foam substrates lead to higher pressure losses. In Figure 7 static pressure difference through the catalyst ΔpDOC is reported, showing a max increase of about 10 kPa for both considered foams. However, significant non-linearities due to typical processes in the intake and exhaust system give rise to an overall non-trivial behavior. As a matter of fact, pressure drop through the turbine Δptur is slightly lower (Figure 8) and therefore changes in the exhaust manifold pressure pexh_man (Figure 9) are lower than expected (i.e., lower than the increase in pressure drop ΔpDOC, Figure 7). This leads to the conclusion that higher pressure losses induced by foams may be partly counterbalanced by the turbocharger effects, at least at high engine loads. Results of Figure 8 show that the slightly higher pressure drop of the foam catalysts leads to higher turbine efficiency (through the slightly higher pressure level at the turbine exit). Thus, the anyway low fuel consumption penalty is been partly counterbalanced by a higher turbine efficiency.
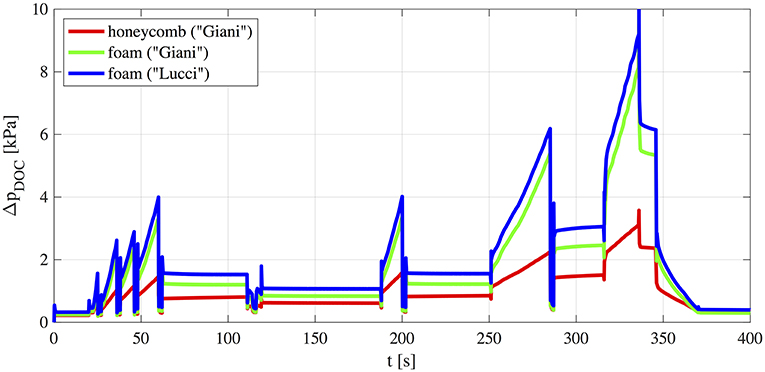
Figure 7. Calculated pressure losses through different catalysts substrates.
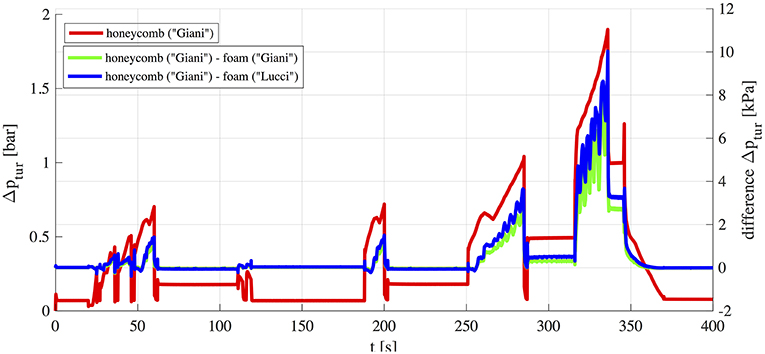
Figure 8. Calculated pressure changes through turbine.
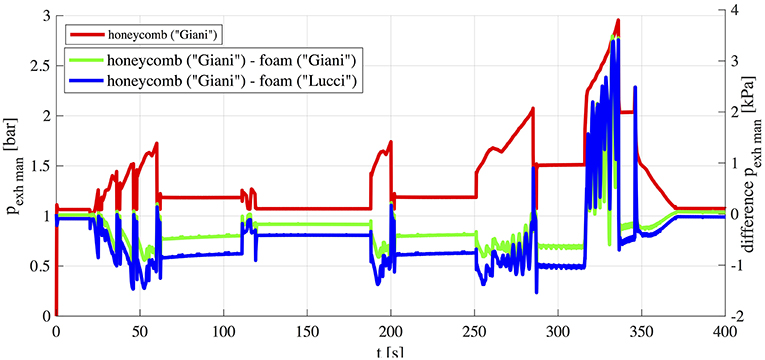
Figure 9. Calculated pressure in the exhaust manifold.
Temperature profiles inside the catalytic reactor block are presented in Figure 10. Due to the higher porosity, open cell structures have a lower thermal inertia and present shorter thermal transients. Figure 10 shows that both foams and Kelvin Cell structures are able to reach a light off temperature of 550 K approximately in half the time of the honeycombs (it should be noted that green and blue lines are almost completely superimposed). However, for the same reasons they are characterized by a faster cool down phase.
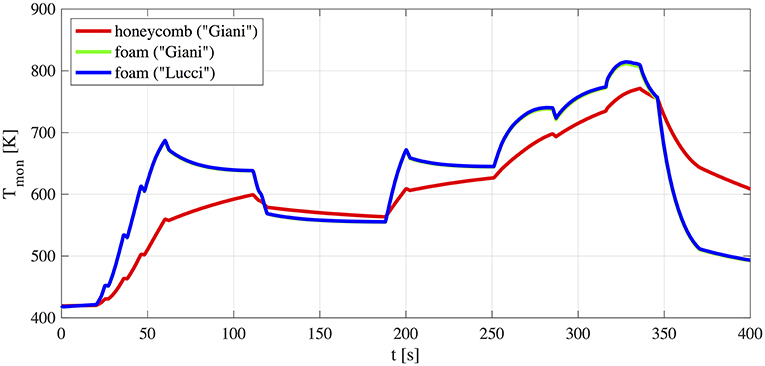
Figure 10. Calculated temperature of the substrates.
Prediction of Fuel Economy
The model allowed to estimate instantaneous and cumulative fuel consumption on the considered EUDC: results are plotted in Figure 11. The red solid line represents the cumulative fuel consumption for the engine with the honeycomb substrate (“h_Giani”), which is assumed as reference to highlight the effects of open cell substrates. Therefore, in Figure 11 blue and green lines show the percentage deviation when the foam (green solid line, “f_Giani”) and Kelvin Cells substrates (blue solid line, “f_Lucci”) are used with reference to the honeycomb one (“h_Giani”).
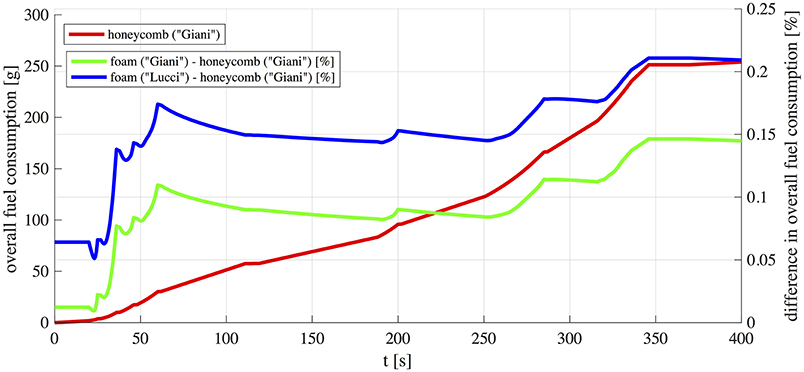
Figure 11. Calculated cumulative fuel consumption during the EUDC.
The analysis of the instantaneous fuel consumption ṁf shows that, within the assumed conditions, lower values are reached for the honeycomb than for both open cell foam structures. However, differences in cumulative fuel consumption between the cases is lower than 0.20%. Furthermore, among the open cell substrates, fuel consumption with real foams (“f_Giani”) is slightly lower than that with Kelvin Cells structures (“f_Lucci”).
As previously shown, pressure drop through the catalytic converter is higher for open cell structures (Figure 7) for all the analyzed cases, confirming that open cell structures are characterized by higher flow resistance. This is the main reason of higher fuel consumption for the considered open cell structures especially during accelerations. At higher engine loads and higher exhaust mass flows, the pressure drop increase in the exhaust manifold is more pronounced. It should be noted, however, that in the present study increase in fuel consumption is caused by the replacement of a honeycomb substrate with open cell foams assuming equal shape and volume. But higher mass transfer properties of open cell structures allow for more compact reactors compared to honeycomb ones, and this leads to a decrease in their flow resistance thus rebalancing the drawback in fuel consumption.
The maximum deviation observed in instantaneous fuel consumption between all the cases was 0.35%, appearing only during accelerations when higher torque is requested. During steady driving conditions at constant velocity the increased instantaneous fuel consumption due to the open cell structure substrate is lower (0.10% approximately). These variations result in an increase of only 0.20% in total injected fuel over the whole 400 s of the cycle.
Conclusions
Mathematical models represent an interesting (and often unavoidable) way to get a proper understanding of the behavior of complex systems. As a matter of fact, development of theoretical tools requires a good compromise between physical and empirical approaches to limit the CPU time.
In the paper a fast model of a catalytic converter for automotive application has been built up and integrated in a 0D “crank-angle” model of a turbocharged Diesel engine. After improving the heat exchange model for the exhaust manifold (to take account of thermal dynamics during transients), a 0D model of the catalyst has been developed to simulate related flow and thermal processes. Then the catalyst model has been coupled to an engine model to investigate the behavior of the overall system and the effects of catalyst substrate characteristics. To this extent an actual 1.6 l turbocharged Diesel engine with EGR has been simulated within an EUDC driving cycle comparing engine performance with different catalyst substrates.
The behavior of three different catalytic structures was analyzed: honeycomb, open cell foams and open Kelvin cell structures. It has been shown that, using reactors of the same volume, the increased pressure drop caused by open cell structures results in a total fuel consumption increase not higher than 0.20%. On the other side open cell structures show faster thermal transients due to their lower thermal inertial and thus are able to reach quickly light-off temperatures.
It should be noted that higher mass transfer properties of open cell structures may allow for more compact reactors compared to honeycombs. This may help to reduce the overall flow resistance of foams giving new possibilities to improve the efficiency of the after-treatment system lowering at the same time specific fuel consumption. The presented mathematical tool proved to be very effective to simulate the behavior of the comprehensive system (engine+after-treatment system) and will be used in the next future to explore exhaustively these topics.
It should be recalled that in the presented model working fluid has been considered as a mixture of 7 chemical species, i.e., N2, O2, CO2, H2O, CO, H2 NO. The number N and the type of involved pollutants depend on the specific application. In the presented model CO and one or more species representative of HC have been considered, since their oxidation reactions were assumed as the most significant in the determination of the catalyst temperature. Different after-treatment systems can be considered in the next future, e.g., three way catalysts (which represents a very interesting application for these new solutions). Modeling a three way catalyst however, is more complex since it involves the oxygen balance (gasoline engines are always near stoichiometric operation) and thus always operating under oxygen shortage. The presented approach can be used to attempt modeling a three way catalyst under real driving conditions in real-time.
Finally it should be emphasized that in the presented work the vehicle model has not yet been developed. Therefore, required input parameters (i.e., rotational speed, fuel mass flow rate, VGT and EGR driving signals) were defined through an inverse model of the vehicle (developed in Guzzella and Sciarretta, 2005). Therefore, the simpler EUDC cycle was chosen since it is a modal driving cycle, still significant enough to allow testing the effectiveness and flexibility of the proposed simulation tool. In the next step of the activity a suitable model for the vehicle will be developed and integrated with the engine+catalyst model to allow for the estimation of engine speed and torque in more complex transient driving cycles (as WLTC).
Data Availability
The datasets generated for this study are available on request to the corresponding author.
Author Contributions
AG, VP, and PD contributed to the design and implementation of the research, to the analysis of the results and to the writing of the manuscript.
Conflict of Interest Statement
The authors declare that the research was conducted in the absence of any commercial or financial relationships that could be construed as a potential conflict of interest.
Acknowledgments
The authors gratefully acknowledge financial support from the Swiss federal Office for the Environment (FOEN) for the projects, Exhaust After treatment system for the lowest environmental impact, Natural Gas powered delivery vehicle, Euro 7 and beyond (EAS7+), project no. UTF 584.13.18 and Katalysator simulation Vertrag Nr. 15.0002.PJ/S122-1359.
References
Bach, C., and Dimopoulos Eggenschwiler, P. (2011). Ceramic Foam Catalyst Substrates for Diesel Oxidation Catalysts: Pollutant Conversion and Operational Issues. SAE paper no.2011-24-079.
Boomsman, K., Poulikakos, D., and Ventikos, Y. (2003). Simulations of flow through open cell metal foams using an idealized periodic cell structure. Int. J. Heat Mass Trans. 24, 825–834. doi: 10.1016/j.ijheatfluidflow.2003.08.002
Bracconi, M., Ambrosetti, M., Okafor, O., Sans, V., Ou, X., Pereira, C. F., et al. (2018). Investigation of pressure drop in 3D replicated open-cell foams: coupling CFD with experimental data on additively manufactured foams. Chem. Eng. J. doi: 10.1016/j.cej.2018.10.060. [Epub ahead of print].
Depcik, C., and Assanis, D. (2001). A Universal Heat Transfer Correlation for Intake and Exhaust Flows in an Spark-Ignition Internal Combustion Engine. SAE Paper 2002-01-0372.
Dimopoulos Eggenschwiler, P., Tsinoglou, D., Seyfert, J., Bach, C., Vogt, U., and Gorbar, M. (2009). Ceramic foam substrates for automotive catalyst applications: fluid mechanic analysis. Exp. Fluids 47, 209–222. doi: 10.1007/s00348-009-0653-2
Fiorani, P., Gambarotta, A., Lucchetti, G., Ausiello, F. P., De Cesare, M., and Serra, G. (2008). A Detailed Mean Value Model of the Exhaust System of an Automotive Diesel Engine. SAE Technical Paper, no.2008-28-0027.
Gaiser, G., Oesterle, J., Braun, J., and Zacke, P. (2003). The Progressive Spininlet-Homogeneous Flow Distributions Under Stringent Conditions. SAE Technical Paper no.2003-01-0840.
Gambarotta, A. (2017). “Mathematical modeling techniques for turbochargers and turbocharged engines,” in Turbochargers and Turbocharging: Advancements, Applications and Research (Hauppauge, NY: Nova Science Publishers Inc.,), 375–434.
Gambarotta, A., and Lucchetti, G. (2011). Control-Oriented “Crank-Angle” Based Modeling of Automotive Engines. SAE paper no.ICE2011-24-0144.
Gambarotta, A., and Lucchetti, G. (2013). “A Crank-angle model for the “real-time” simulation of Diesel engines in HiL/SiL applications,” in 13th Stuttgart International Symposium on Automotive and Engine Technologies (Stuttgart).
Gambarotta, A., Lucchetti, G., and Vaja, I. (2011). Real-time modelling of transient operation of turbocharged diesel engines. Proc. Inst. Mech. Eng. Pt D J. Automob. Eng. 225, 1186–1203. doi: 10.1177/0954407011408943
Gambarotta, A., Ruggiero, A., Sciolla, M., and Lucchetti, G. (2012). HiL/SiL system for the simulation of turbocharged diesel engines. MTZ Worldwide 73, 48–53. doi: 10.1365/s38313-012-0143-4
Giani, L., Groppi, G., and Tronconi, E. (2005). Mass-transfer characterization of metallic foams as supports for structured catalysts. Ind. Eng. Chem. Res. 44, 4993–5002. doi: 10.1021/ie0490886
Guzzella, L., and Onder, C. H. (2010). Introduction to Modeling and Control of Internal Combustion Engine Systems. Berlin: Springer-Verlag.
Inayat, A., Freund, H., Zeiser, T., and Schwieger, W. (2011). Determining the specific surface area of ceramic foams: the tetrakaidecahedra model revisited. Chem. Eng. Sci. 66, 1179–1188. doi: 10.1016/j.ces.2010.12.031
Inayat, A., Klumpp, M., von Beyer, M., Freund, H., and Schwieger, W. (2016). Development of a a new pressure drop correlation for open-cell foams based compleely on theoretical grounds: taking into account strut shape and geometric tortuosity. Chem. Eng. J. 287, 704–719. doi: 10.1016/j.cej.2015.11.050
Incropera, F. P., Dewitt, D. P., Bergman, T. L., and Lavine, A. S. (2013). Principles of Heat and Mass Transfer, 7th Edn. New York, NY: John Wiley and Sons.
Kandylas, I. P., and Stamatelos, A. M. (1999). Engine exhaust system design based on heat transfer computation. Energy Converv. Manage. 40, 1057–1072. doi: 10.1016/S0196-8904(99)00008-4
Koltsakis, G. C., Katsaounis, D. K., Samaras, Z. C., Naumann, D., Saberi, S., Bohm, A., et al. (2008). Development of Metal Foam Based Aftertreatment System on a Diesel Passenger Car. SAE Technical Paper no.2008-01-0619.
Konstantinidis, P. A., Koltsakis, G. C., and Stamatelos, A. M. (1997). Transient heat transfer modelling in automotive exhaust systems. Proc. Inst. Mech. Eng. Part C 211, 1–14. doi: 10.1243/0954406971521610
Lucci, F., Della Torre, A., Montenegro, G., and Dimopoulos Eggenschwiler, P. (2015). On the catalytic performance of open cell structures versus honeycombs. Chem. Eng. J. 264, 514–521. doi: 10.1016/j.cej.2014.11.080
Lucci, F., Della Torre, A., Montenegro, G., Kaufmann, R., and Dimopoulos Eggenschwiler, P. (2016). Comparison of geometrical, momentum and mass transfer characteristics of real foams to Kelvin cell lattices for catalyst applications. Int. J. Heat Mass Transf. 108, 341–350. doi: 10.1016/j.ijheatmasstransfer
Lucci, F., Della Torre, A., Von Rickenbach, J., Montenegro, G., Poulikakos, D., and Dimopoulos Eggenschwiler, P. (2014). Performance of randomized Kelvin cell structures as catalytic substrates: mass-transfer based analysis. Chem. Eng. Sci. 112, 143–151. doi: 10.1016/j.ces.2014.03.023
Martin, A. P., Will, N. S., Bordet, A., Cornet, P., Gondoin, C., and Mouton, X. (2000). Effect of Flow Distribution on Emissions Performance of Catalytic Converters. SAE Technical Paper no.2000-05-0175.
Papetti, V., Dimopoulos Eggenschwiler, P., Della Torre, A., Lucci, F., Ortona, A., and Montenegro, G. (2018). Additive manufactured open cell polyhedral structures as substrates for automotive catalysts. Int. J. Heat Mass Transf. 126, 1035–1047. doi: 10.1016/j.ijheatmasstransfer.2018.06.061
Pontikakis, G. N., Konstantas, G. S., and Stamatelos, A. M. (2004). Three-way catalytic converter modeling as a modern engineering design tool. J. Eng. Gas Turbines Power 126, 906–923. doi: 10.1115/1.1787506
Santoliquido, A., Bianchi, G., Dimopoulos Eggenschwiler, P., and Ortona, A. (2017). Additive manufacturing of periodic ceramic substrates for automotive catalyst supports. Int. J. Appl. Ceram. Technol. 14, 1164–1173. doi: 10.1111/ijac.12745
Shamim, T., Shen, H., Sengupta, S., Son, S., and Adamczyk, A. (2002). A comprehensive model to predict three-way catalytic converter performance. J. Eng. Gas Turbines Power 124, 421–428. doi: 10.1115/1.1424295
Twigg, M., and Richardson, J. (2007). Fundamentals and applications of structured ceramic foam catalysts. Ind. Eng. Chem. Res. 46, 4166–4177. doi: 10.1021/ie061122o
Von Rickenbach, J., Lucci, F., Narayanan, C., Dimopoulos Eggenschwiler, P., and Poulikakos, D. (2014). Multi-scale modelling of mass transfer limited heterogeneous reactions in open cell foams. Int. J. Heat Mass Transf. 75, 337–346. doi: 10.1016/j.ijheatmasstransfer.2014.03.060
Von Rickenbach, J., Lucci, F., Narayanan, C., Dimopoulos Eggenschwiler, P., and Poulikakos, D. (2015). Effect of washcoat diffusion resistance in honeycomb and foam based catalytic reactors. Chem. Eng. J. doi: 10.1016/j.cej.2015.03.132
Zygourakis, K. (1989). Transient operation of monolith catalytic converters: a two-dimensional reactor model and the effects of radially nonuniform flow distributions. Chem. Eng. Sci. 44, 2075–2086.
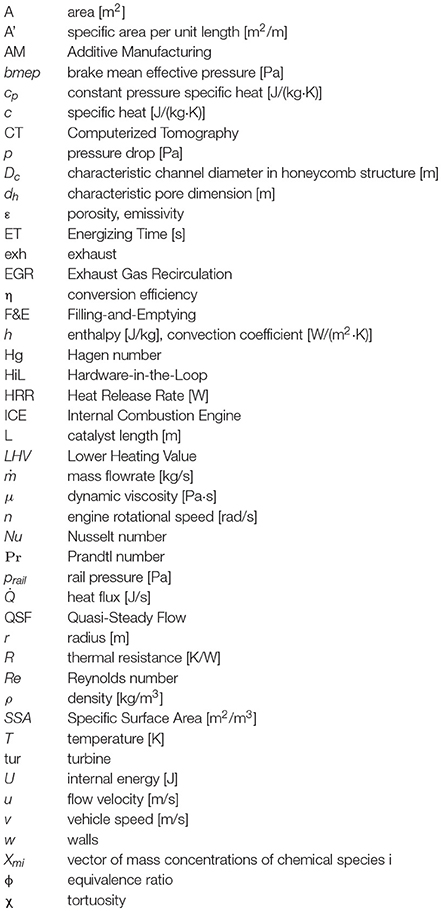
Nomenclature
Keywords: catalytic converters, honeycomb, open cell foam, after-treatment, numerical simulation, 0D mathematical model, real-time modeling
Citation: Gambarotta A, Papetti V and Dimopoulos Eggenschwiler P (2019) Analysis of the Effects of Catalytic Converter on Automotive Engines Performance Through Real-Time Simulation Models. Front. Mech. Eng. 5:48. doi: 10.3389/fmech.2019.00048
Received: 18 February 2019; Accepted: 22 July 2019;
Published: 13 August 2019.
Edited by:
Evangelos G. Giakoumis, National Technical University of Athens, GreeceReviewed by:
Christopher Harald Onder, ETH Zürich, SwitzerlandEduardo Ernesto Miro, Universidad Nacional del Litoral (FIQ-UNL), Argentina
Copyright © 2019 Gambarotta, Papetti and Dimopoulos Eggenschwiler. This is an open-access article distributed under the terms of the Creative Commons Attribution License (CC BY). The use, distribution or reproduction in other forums is permitted, provided the original author(s) and the copyright owner(s) are credited and that the original publication in this journal is cited, in accordance with accepted academic practice. No use, distribution or reproduction is permitted which does not comply with these terms.
*Correspondence: Agostino Gambarotta, YWdvc3Rpbm8uZ2FtYmFyb3R0YUB1bmlwci5pdA==