 Athanasios Dimaratos
 Zisimos Toumasatos
 Stylianos Doulgeris
 Georgios Triantafyllopoulos
 Anastasios Kontses
 Zissis Samaras*
- Laboratory of Applied Thermodynamics, Department of Mechanical Engineering, Aristotle University of Thessaloniki, Thessaloniki, Greece
The objective of this study is the assessment of the real-world environmental performance, and its comparison with laboratory measurements, of two Euro 6 passenger cars. The first is equipped with a common-rail diesel engine, Lean NOx Trap (LNT), and Diesel Particulate Filter (DPF), and the second is a bi-fuel gasoline/CNG (Compressed Natural Gas) vehicle equipped with a Three-Way Catalyst (TWC). The experimental campaign consisted of on-road and chassis dynamometer measurements. In the former test set, two driving routes were followed, one complying with Real Driving Emissions (RDE) regulation and another characterized by more dynamic driving. The aim of the latter route was to go beyond the regulatory limits and cover a wider range of real-world conditions and engine operating areas. In the laboratory, the WLTC (Worldwide harmonized Light vehicles Test Cycle) was used, applying the real-world road load of the vehicles. Both cars underwent the same tests, and these were repeated for the primary (CNG) and the secondary (gasoline) fuel of the bi-fuel vehicle. In all of the tests, CO2 and NOx emissions were measured with a Portable Emissions Measurement System (PEMS). The results were analyzed on two levels, the aggregated and the instantaneous, in order to highlight the different emissions attributes under varying driving conditions. The application of realistic road load in the WLTC limited its difference from the RDE-compliant route in terms of CO2 emissions. However, the aggressive driver behavior and the uphill roads of the Dynamic driving schedule resulted in approximately double the CO2 emissions for both cars. The potential of natural gas to reduce CO2 emissions was also highlighted. Concerning the NOx emissions of the diesel car, the real-world results were significantly higher than the respective WLTC levels. On the other hand, the bi-fuel car exhibited very low NOx emissions with both fuels. Natural gas resulted in increased NOx emissions compared to gasoline, always remaining below the Euro 6 limit, with the only exception being the Dynamic driving schedule. Finally, it was found that the overall cycle dynamics are not sufficient for the complete assessment of transient emissions, and the instantaneous engine, and aftertreatment behavior can reveal additional details.
Introduction
The transport sector is responsible for one-quarter of the greenhouse gas emissions in the EU28, rendering it the second-largest emitter after energy production (EEA, 2018a; European Commission, 2018a). According to the latest available official data, road transport constitutes the almost exclusive source of transport carbon dioxide (CO2), accounting for 95% of total emissions (EEA, 2018a). Passenger cars make up 61% of this, with an 18% increase (in absolute values, million tons) compared to the levels of 2,000 (EEA, 2018a). At the same time, road transport is the major contributor of Nitrogen Oxides (NOx), especially in urban areas (Hooftman et al., 2018), and is the largest contributor to total Nitrogen Dioxide (NO2) emissions in the EU28 (EEA, 2018b). These data highlight in the most explicit way the significance of investigating and effectively limiting road transport emissions.
First introduced in the late 1960s for light-duty vehicles, driving cycles are still serving as the tool for the certification of new vehicles (Giakoumis, 2016). In Europe, the New European Driving Cycle (NEDC) was the official Type Approval (TA) procedure for passenger cars until 2017. The large CO2 discrepancies observed between real-world and TA values, reaching 40% in 2017 (Tietge et al., 2019), led to the development of the Worldwide harmonized Light vehicles Test Cycle and Procedure (WLTC and WLTP, respectively), introduced into the certification process of new vehicles since September 2017 (Marotta et al., 2015; Tutuianu et al., 2015). It has been found that the new procedure is indeed bridging, to a certain extent, the gap between TA and real-world CO2 levels (Fontaras et al., 2017).
Regarding NOx emissions and referring to diesel cars, a wealth of data exists highlighting the significant discrepancies between TA and real-world values (e.g., Kwon et al., 2017; Ramos et al., 2018; Triantafyllopoulos et al., 2019). Although a diesel car can be compliant with the Euro 6 limit during the certification procedure (WLTP, or NEDC in the past), it may exceed the relevant NOx limit under real-world conditions (Zacharof et al., 2016). Conversely, a similar trend has not been reported for gasoline vehicles, which remain compliant with the limits, even when driven in extreme conditions (Rašić et al., 2017). In order to address this, the Real Driving Emissions (RDE) test has been introduced into the TA procedure in Europe (European Commission, 2017), effective from September 2017. Under this test, the car is driven on public roads and in real traffic conditions, following the specifications of the relevant regulation. The tailpipe emissions are continuously measured using a Portable Emissions Measurement System (PEMS) and must be below the respective Euro 6 limit multiplied by the Conformity Factor (CF). The latter introduces a margin around the limit and accounts for the uncertainties and inaccuracies of on-road testing. For NOx emissions, the final CF, effective from January 2021, is set to 1.43, with a temporary value equal to 2.1 applied from September 2019 (European Commission, 2017, 2019; ICCT, 2017).
Although very recent tests show that modern diesel cars (Euro 6d-temp, still with a limited market share) can emit very low quantities of NOx (ADAC, 2019), a number of studies have highlighted the elevated emissions of existing Euro 6 diesel-powered light-duty vehicles. For example, Luján et al. (2018) measured real-world NOx emissions up to 600 mg/km, while Gallus et al. (2017) found that when driving a car outside the RDE boundary conditions, vehicle emissions can be significantly increased. This discordance between certified and real-world environmental performance led to a reduction in the demand for new diesel cars (ACEA, 2019). The resultant shift to gasoline vehicles contributed to an increase in CO2 emissions in the last few years (SMMT, 2018; JATO, 2019), while the new registrations of electrified vehicles do not yet seem in a position to reverse this trend.
A significant contribution toward the reduction of CO2 emissions can come from vehicles powered by alternative fuels. Natural gas constitutes a very good example, as it offers a direct CO2 benefit compared to gasoline and diesel (Chen et al., 2018). Currently, Compressed Natural Gas (CNG) vehicles are produced with bi-fuel engines (gasoline/CNG). As will be explained in a later section, this limits the efficiency increase potential (and the subsequent decrease of CO2 emissions), compared to a mono-fuel engine optimized for CNG operation. Additional benefits associated with natural gas are the lower cost, compared to other fossil fuels, its availability in terms of reserves, and its applicability in both spark-ignition (mono/bi-fuel) and compression-ignition (dual-fuel) engines. On the other hand, the increased NOx emissions of a bi-fuel engine when running on CNG (Rašić et al., 2017), as well as the refueling infrastructure and logistics, make up the challenges for the widespread use of natural gas in light-duty vehicles (Van der Slot et al., 2016). In 2018, there were reported to be 1.3 million passenger cars powered by CNG, with optimistic scenarios estimating that this number will reach 4 million in 2025 (NGVA Europe, 2016; ACEA, 2018).
The objective of the present work is the assessment of the real-world environmental performance of a diesel and a bi-fuel Euro 6 passenger car and its comparison with laboratory measurements. The evaluation is accomplished through vehicle testing on both the road and with a chassis dynamometer using a PEMS. Aggregated and instantaneous data are included in the analysis of the results in order to investigate the different emission attributes under varying driving conditions. It is noted that the target of this study is the assessment of the emissions on a technical basis and not the evaluation of the regulations and the relevant policy procedures.
Methodology
Vehicles Tested and Measuring Equipment
The two vehicles tested in the current study belong to Segment C, which makes up almost 30% of new passenger car registrations in EU-28 (ICCT, 2018). Both vehicles are equipped with manual transmission and engine stop-start system, and they are compliant with the Euro 6b emission standard. Vehicle 1 is powered by a common-rail diesel engine, integrating a high-pressure EGR (Exhaust Gas Recirculation) circuit for engine-out NOx emission control. Its aftertreatment system consists of two LNTs (Lean NOx Traps), which have both (CO and HC) oxidation and NOx storage and reduction functionalities, and a DPF (Diesel Particulate Filter) for particle emission limitation. Vehicle 2 is equipped with an OEM manufactured bi-fuel spark-ignition engine capable of running on either gasoline (direct injection—GDI) or compressed natural gas (CNG, port fuel injection—PFI). The latter is used as the primary fuel, and only after its full depletion does the engine operate on gasoline. For tailpipe emission control, Vehicle 2 uses a close-coupled TWC (Three-Way Catalyst), which consists of a pre- and a main catalyst. The detailed specifications of the two vehicles tested in this study are presented in Table 1.
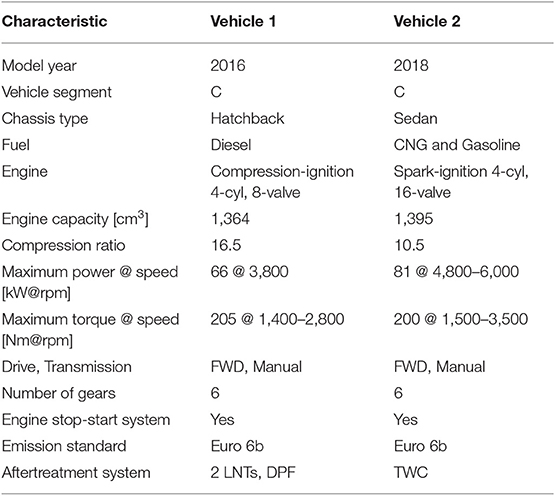
Table 1. Specifications of the vehicles tested.
The measurement of CO2 and NOx emissions was realized with the Horiba OBS-ONE Gas PEMS (Portable Emissions Measurement System). Table 2 presents technical details concerning the range and the accuracy of the emission analyzers integrated into the system. In order to ensure direct comparability between on-road and laboratory measurements, the same equipment was used in all the tests. An Exhaust Flow Meter (Horiba tailpipe attachment with pitot for OBS-ONE, C type, 0–10 m3/min) was additionally used for the accurate determination of the exhaust gas flow. Instantaneous recordings of vehicle velocity, altitude, and locational coordinates were taken with a GPS device, while ambient conditions (pressure, temperature, and humidity) were measured with suitable sensors. A scan tool was also integrated into the system for logging the signals available through the OBD port of the vehicles. The setup was completed by the control unit and the battery pack for the power supply to all the devices. Figure 1 is a schematic layout of the system used in the current work.
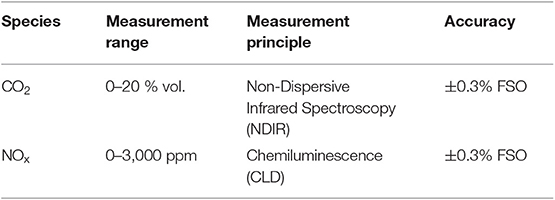
Table 2. Specifications of the Horiba OBS-ONE Gas PEMS.
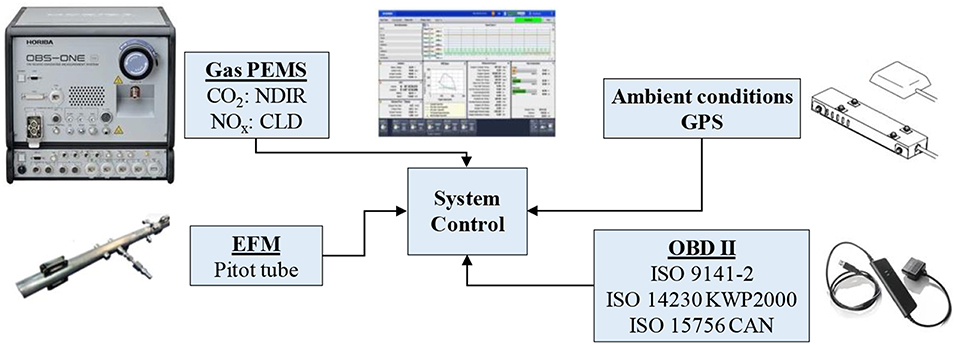
Figure 1. Schematic layout of the complete test setup.
Data processing and emissions calculations were carried out using tools developed in house. The aggregated emission values, expressed in g/km, were determined by dividing cumulative mass emissions by the total distance traveled during the test. This option was considered preferable, since the target of the study is to characterize the real driving emissions of the vehicles and compare them with the respective emissions in laboratory testing and not to evaluate the regulations or reproduce type-approval values. Besides, in the 4th package of the RDE regulations, in force since November 2018, the determination of average emission values (in g/km) is accomplished in a similar manner, while the moving average window method is used only for the verification of the overall trip validity (European Commission, 2018b).
Driving Profiles
The experimental campaign consisted of both laboratory and real-world measurements. In the former case, a Ward-Leonard dynamometer was used, with a maximum permissible vehicle weight of 2.5 ton (equivalent inertia), adjustable to both legislative and real-world driving cycles. On the chassis dynamometer, the WLTC was run under cold and hot starting conditions, applying the real-world road load of the vehicle, as determined through a coast-down test in a suitable test track. On the road, two different routes were followed in the wider area of Thessaloniki, Greece. Route 1 (hereinafter called “RDE compliant”) was compliant with the RDE regulation, and it was tested both cold- and hot-started. Route 2 (hereinafter called “Dynamic driving”) went beyond the regulatory limits, covering a wider range of real-world conditions. It was characterized by aggressive driving, including abrupt accelerations and decelerations. The second route was tested with the engine fully warmed-up. Both tested cars followed the same routes, and, for Vehicle 2, all of the tests were repeated with gasoline and with CNG.
The characteristics of the WLTC and the real-world routes followed in this study are summarized in Table 3, showing also the share of Urban (U), Rural (R), and Motorway (M) segments. In addition, Figure 2 presents the instantaneous vehicle speed, altitude, and cumulative distance for each driving profile. Moreover, Figure 3 visualizes the real-world routes on a map of the wider area where the tests were conducted, together with the elevation profile. It can be seen that the urban part of the RDE-compliant route (Figure 3A) was run within the city center, while the other parts were mainly in the western suburbs of the city. This discrimination is important in order to assess localized pollution (especially for urban air quality studies) further to the overall emission levels. On the other hand, the Dynamic driving route (Figure 3B) included roads with high inclination found in the northeastern suburbs of the city.
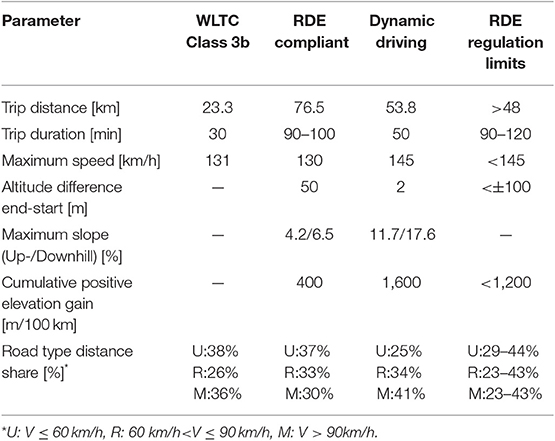
Table 3. Characteristics of the WLTC and the on-road (RDE) test routes.
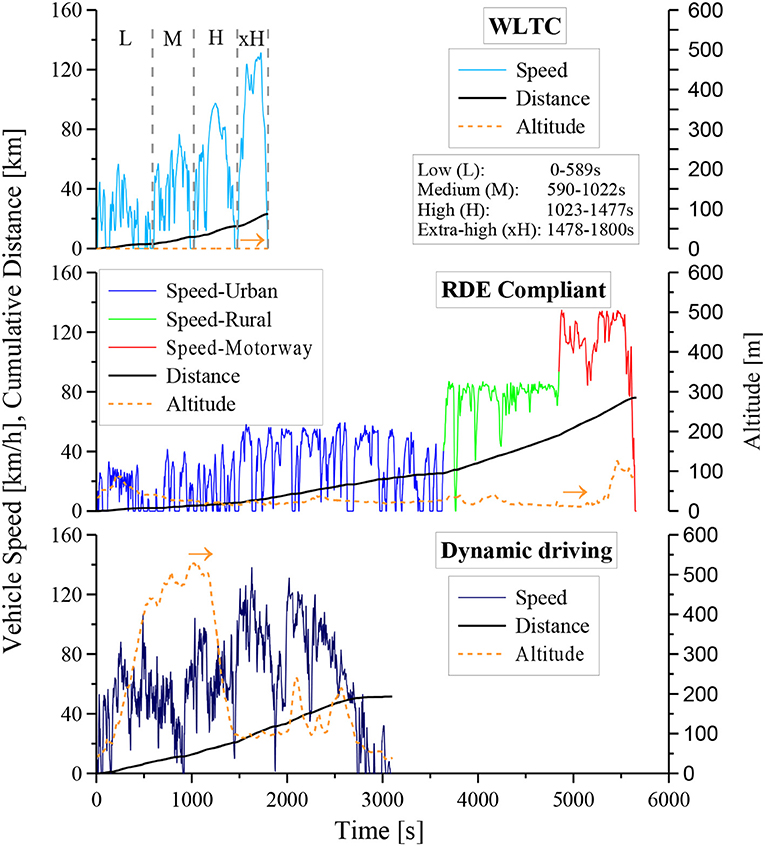
Figure 2. Vehicle speed, cumulative distance, and altitude for the WLTC, the RDE-compliant, and the Dynamic driving tests.
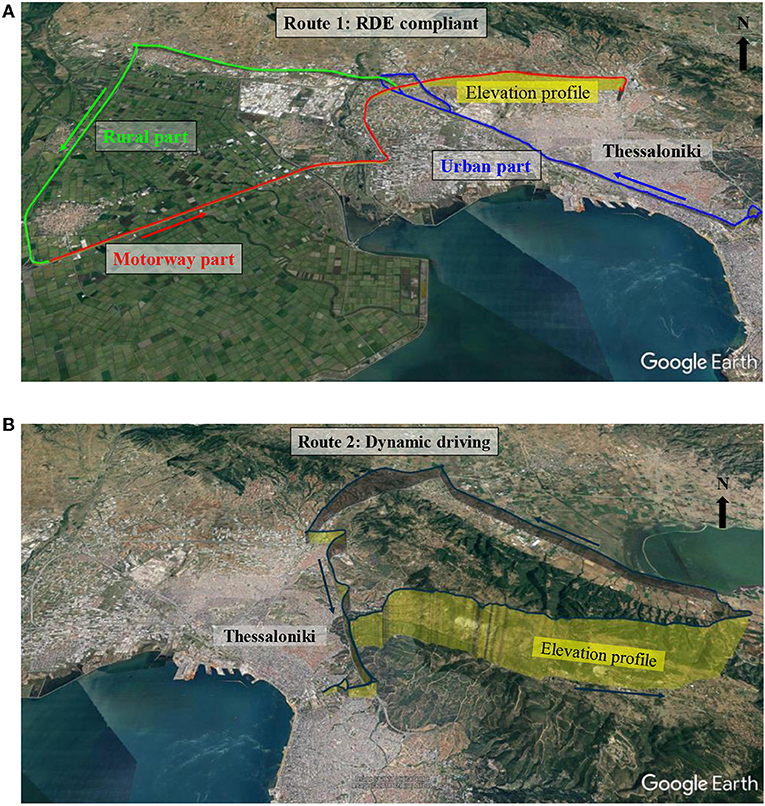
Figure 3. Visualization of the on-road tests (A: RDE compliant, B: Dynamic driving). Yellow fill denotes the local elevation.
Fuel Characteristics
In the current study, commercial fuels from local stations were used. In Vehicle 1, typical diesel fuel containing 7% vol. biodiesel (1st generation, i.e., FAME) was applied, while the gasoline used in Vehicle 2 did not contain any ethanol (E0). Further, the CNG consisted of methane (CH4) at 98% by vol., with the remaining 2% including ethane (C2H6), nitrogen, and traces of heavier hydrocarbons (up to butane) and carbon dioxide.
For the complete evaluation of the results, Table 4 summarizes some typical properties of the fuels of the two cars. It is noted that the values presented in this table were obtained from the literature (e.g., Khan et al., 2016; Chen et al., 2018), and they are not results from specific fuel analyses. These are used only in order to highlight a number of significant differences among the fuels. For example, CNG possesses the highest heating value among the three fuels and the lowest carbon content, which results in a low C/H ratio, favoring the reduction of CO2 emissions. Compared to gasoline, CNG has a significantly higher octane number, which translates into superior knocking stability, enabling an advance in spark timing, leading to an increase in engine efficiency. This effect is further influenced by the different flame propagation speeds of CNG and gasoline, depending on pressure, temperature, and the air–fuel equivalence ratio of the mixture (Heywood, 1988; Kratzsch and Günther, 2013; Van Basshuysen, 2015; Chen et al., 2018).
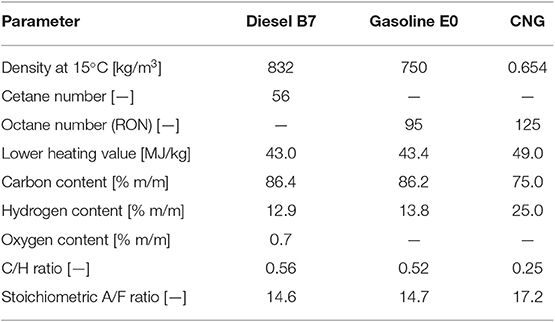
Table 4. Typical properties of the fuels considered in this study.
Results and Discussion
Aggregated Emission Levels
The first part of the results section presents and analyzes the aggregated emission levels, expressed in g/km. As stated in the previous section, the calculation is carried out by dividing the cumulative mass emissions by the total distance traveled during each test. Figure 4A illustrates CO2 emissions for the two cars tested in the complete range of driving conditions. The first observation, consistent with engineering intuition, common for both vehicles, and independent of the fuel, is that CO2 emissions are lower in the hot-started tests (WLTC and RDE compliant) as compared to the cold ones. In the latter case, the increased heat losses through the combustion chamber walls during the warm-up phase, as well as the increased engine and drivetrain friction due to the low temperature of lubricating oils, lie behind this observation. On average, the cold-start effect was 7 and 4 g/km in WLTC and RDE-compliant tests, respectively. These values also highlight the reduction of the cold-start effect in tests with longer driven distance and duration, where the vehicle spends more time in fully warm conditions. The same trend has been revealed in previous research concerning the comparison between NEDC and WLTP that further analyzes the effect of additional parameters, such as the road load, the driving profile, and the engine stop-start system (Tsokolis et al., 2016).
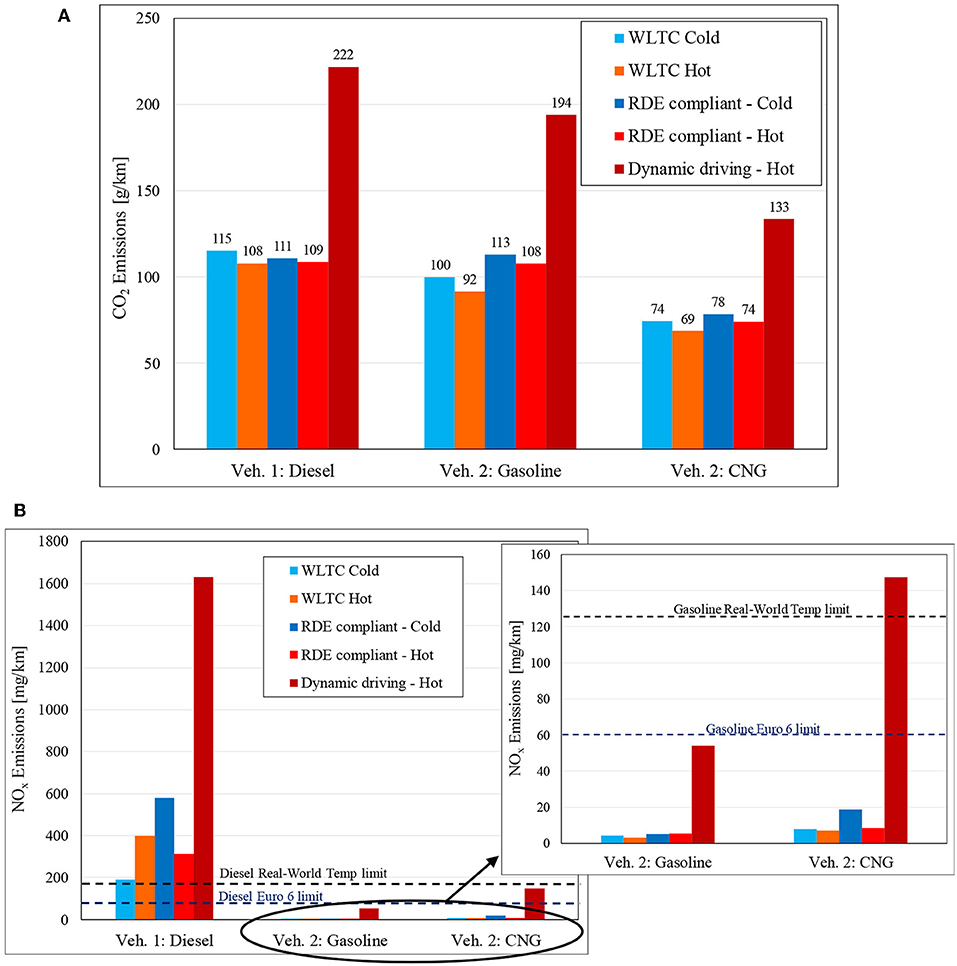
Figure 4. (A) CO2 and (B) NOx emissions of the vehicles tested under different driving conditions.
Examining each car separately, it is observed that, for Vehicle 1, the RDE-compliant and WLTC tests produce similar CO2 levels. Since the road load applied in the chassis dynamometer tests corresponds to the real load (note that this was determined with a coast-down test), this is an indication that the additional parameters influencing CO2 emissions (such as gear shifting strategy, driving dynamics, road grade, etc.) did not result in a significant difference on the aggregated fuel consumption of the specific vehicle. However, when the Dynamic driving test is considered, CO2 emissions are more than doubled owing to the abrupt accelerations and uphill driving.
For Vehicle 2, the RDE-compliant test results in higher CO2 emissions compared to the WLTC for both gasoline and CNG; the difference is more pronounced for the former fuel. The average deviation between the RDE-compliant route and the WLTC is in the order of 10% for both cold- and hot-started tests. As with the first car, the Dynamic driving test increases CO2 emissions significantly, by up to 95%. In Vehicle 2, the comparison between the fuels also reveals the beneficial effect of CNG, which results in 25% lower CO2 emissions in the WLTC compared to gasoline. The lower carbon content combined with the higher calorific value of CNG (Table 4) form the basis for the decreased CO2 levels (Van Basshuysen, 2015). On top of these, any increase in engine efficiency can contribute to further reduction of CO2 emissions. Indeed (slightly), higher brake thermal efficiency has been reported for bi-fuel engine when operating with CNG (Chen et al., 2018). Greater potential for efficiency increase exists in mono-fuel engines optimized for CNG and fully exploiting the properties of natural gas. For example, this can be achieved by higher CR and advanced spark timing, taking advantage of the very high octane number of CNG (Table 4), translating in superior knocking stability.
Figure 4B presents the aggregated NOx emissions for both cars under the complete range of driving conditions. The corresponding Euro 6 and temporary real-world (corresponding to Conformity Factor CF = 2.1) limits are also shown for comparison purposes. The diesel car (Vehicle 1) is the highest NOx emitter, independently of the driving conditions. The WLTC results are significantly above the Euro 6 limit (80 mg/km). Further, the cold RDE-compliant and the Dynamic driving tests are 7.4 and 20 times higher than the Euro 6 limit, and they exceed the currently permitted on-road level (168 mg/km) by 3.5 and 9.5 times, respectively. This is in agreement with previous research (Yang et al., 2015; O'Driscoll et al., 2018; Triantafyllopoulos et al., 2019), which has found on-road NOx emissions of Euro 6 diesel vehicles up to 25 times above the legislated limit. A variety of factors lie behind this discrepancy, from different engine calibration outside the type approval operating range to systems and controls, the so-called “defeat devices” (Muncrief et al., 2016), which recognize the driving cycle and adjust the powertrain and aftertreatment behavior accordingly. It is also interesting to observe the opposite trend in NOx emissions between the WLTC and RDE-compliant tests under the different starting conditions. While the hot WLTC produces higher NOx emissions than the cold, the hot RDE-compliant test lies below its cold counterpart. The reason behind this observation is the combined effect of EGR and LNT regeneration. The former influences NOx formation in the cylinder strongly (a higher EGR rate reduces the combustion temperature, so NOx formation is limited), while the latter takes place when the LNT is fully saturated. If, after the full saturation of the LNT, regeneration does not occur, engine-out NOx emissions are transferred directly to the tailpipe. Apparently, the higher the EGR rate, the lower the engine-out NOx emissions, so the lower the necessity for LNT regenerations. Comparing the WLTC tests, it is found that higher EGR rates were experienced in the cold-start case, along with more LNT regenerations. On the other hand, the opposite trend is observed in the RDE tests, where the EGR rate was higher under hot conditions, while the number of LNT regenerations were similar in cold and hot RDE tests. A more detailed assessment of NOx emissions of the diesel car is made in the next subsection.
Passing on to the bi-fuel car (Vehicle 2), this presents very low NOx emissions independently of the driving conditions and the fuel used, being compliant with the Euro 6 limit in most cases (sub-figure in Figure 4B). Actually, the only exception where Vehicle 2 exceeds the relevant limit is when running on CNG under the Dynamic driving test. Apparently, the TWC is capable of suppressing NOx emissions and keeping them well-below the permitted levels. In the gasoline-operation case, NOx emissions remain extremely low in the WLTC and RDE-compliant tests, with the latter conditions producing slightly higher levels. During Dynamic driving, NOx emissions are considerably higher (always remaining below the Euro 6 limit), due to the much more aggressive driver behavior. Coming to the CNG-operation case, clearer differences between the various testing conditions can be distinguished. The RDE-compliant test produces higher NOx levels than the WLTC, again always below the Euro 6 limit. It is only under the Dynamic driving conditions with CNG that the respective permitted levels are exceeded; NOx emissions are 2.5 times the Euro 6 limit and 20% higher than the real-world temporary limit (corresponding to CF = 2.1). Similar trends have been reported in a previous study that examined the emissions of a bi-fuel vehicle running on gasoline and natural gas under both moderate and extended RDE conditions (Rašić et al., 2017).
Two additional observations are worth highlighting for the bi-fuel car (Vehicle 2). The first concerns the increase in NOx emissions when it runs on CNG as compared to gasoline operation. This finding is confirmed by past and recent research and holds independently of the testing conditions—either steady-state operation, transient cycles, or on-road driving (Jahirul et al., 2010; Rašić et al., 2017; Chen et al., 2018). In the present experimental campaign, natural gas operation results in up to three times the NOx emissions as compared to gasoline. Higher combustion temperatures, combined with TWC operation, are the main reason behind this trend. On the other hand, as compared to diesel, the application of CNG in both mono-fuel and bi-fuel engines, either light- or heavy-duty, results in significantly lower NOx levels (Khan et al., 2015; Vojtíšek-Lom et al., 2018).
The second observation concerns the allocation of NOx emissions in the individual sub-cycles of the WLTC and RDE-compliant tests, both cold-started. Figure 5 presents the corresponding data, where the cumulative NOx mass emitted is used owing to the different distances traveled in each sub-cycle. An interesting finding is highlighted in Figure 5: although, in both tests and independently of the fuel, Vehicle 2 is compliant with the Euro 6 limit (as shown in Figure 4B), the largest portion of NOx is emitted in the Low part of the WLTC (Figure 5A) and during Urban driving on the RDE-compliant route (especially for CNG) (Figure 5B). These two sub-cycles correspond to driving within the city, implying that the respective elevated NOx levels contribute to the deterioration of urban air quality. In the Low part of the WLTC, the difference between the two fuels is limited to 25%. However, in the Urban part of the RDE-compliant route, CNG emits almost 10 times the NOx mass emitted by gasoline. This finding cannot be revealed by the aggregated results in Figure 4B, but it should be considered in applications where a car travels short distances within the city, interrupted by long stop periods. In addition, Figure 5 presents the contribution of the cold-start period, which is defined as the time for the engine coolant to reach 70°C or as the 300 first seconds after the cold start, whichever is achieved first, according to the latest provisions of the RDE regulation (European Commission, 2018b). It is clear that under natural gas operation, the car emits significantly higher quantities of NOx during this period, which is very critical, since the TWC light-off in CNG mode is achieved at higher temperatures as compared to the gasoline case (Ferri et al., 2018). Further explanations and insight into the NOx emissions of the bi-fuel car are provided in the next subsection.
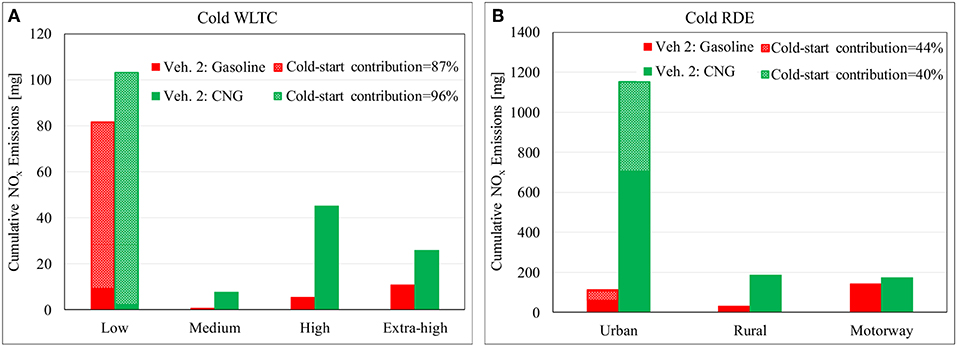
Figure 5. Distribution of cumulative NOx emissions in sub-cycles for WLTC (A) and RDE-compliant (B) tests, including the cold-start contribution, for Vehicle 2.
Assessing Driving Dynamics and Instantaneous Emissions
The second part of the results section aims at the assessment of instantaneous emissions and the effects of driving dynamics. The aim is to provide, for both vehicles, further insight into NOx emissions during the WLTC and on-road driving. The inadequacy of aggregated results for revealing all of the emission attributes, as shown in the previous sub-section, renders such an approach of particular importance for the complete interpretation of the vehicle behavior.
Figure 6 illustrates, for both vehicles, the operating points, in terms of speed and torque, at which the engine is driven under the different testing conditions considered in the present study. The full load and motoring curves are also shown, which are practically the highest and lowest limits, respectively, that the engine can reach. In the case of Vehicle 2 (Figure 6B), the NEDC operating range is also shown. For both vehicles, the WLTC appears to be a good approximation of the real-world conditions, as it covers a large portion of the engine operating range of the RDE-compliant route. The application of the real-world road load in the chassis dynamometer tests is apparently the main reason behind this phenomenon. More detailed examination reveals that during the RDE-compliant test, the engine operating range expands (i.e., increased point density) at higher speeds in Vehicle 1 (Figure 6A) and in higher speeds and loads in Vehicle 2 (Figure 6B) as compared to the WLTC. In any case, the difference between those two tests is not pronounced, and the engine is not driven above 2,500 and 3,000 rpm in Vehicles 1 and 2, respectively. Regarding the NEDC (Vehicle 2), the considerably narrower operating range of the engine during that cycle highlights its inadequacy for reproducing real-world conditions in the laboratory.
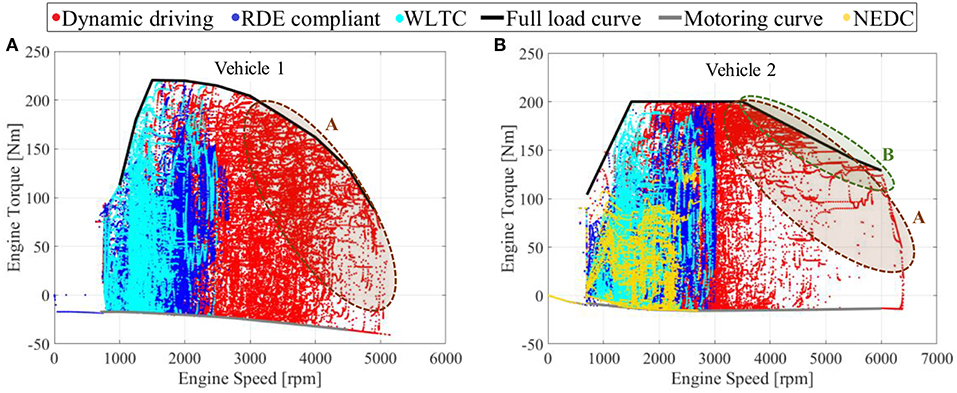
Figure 6. Engine operating points under different driving conditions for the two vehicles tested. (A) Vehicle 1 - Diesel car. (B) Vehicle 2 - Bi-fuel car.
However, both the WLTC and the RDE-compliant route cover only a limited area of the engine operating range, as clearly shown in Figure 6. It is only under the Dynamic driving conditions that almost the complete engine map is scanned; this is particularly pronounced for Vehicle 1 (Figure 6A). Higher engine speeds and loads are experienced, resulting from aggressive driver behavior characterized by abrupt accelerations and from the higher road grades included in the Dynamic driving test (Table 3; Figures 2, 3). The significant effect of those parameters on CO2 (i.e., fuel consumption) and pollutant emissions has also been highlighted by Wyatt et al. (2014) and Gallus et al. (2017). Average real-world driving probably lies between the RDE-compliant and Dynamic driving tests, with the latter being considered the most extreme case.
Considering that downsized (gasoline, mainly) engines are equipped with smaller catalysts that are adequate of covering legislated emission limits and characterized by lower thermal inertia and quicker heat-up (thus achieving light-off temperature faster), two critical areas, not covered by the RDE-compliant route, can be identified on the engine map, with reference to Figure 6:
1. Area A: At elevated speeds (and more pronounced when combined with high load), a larger mass of exhaust gas flows through an “undersized” catalyst, resulting in increased space velocity, and decreased residence time within the catalyst. Therefore, the relevant chemical reactions (CO and HC oxidation, NOx reduction) cannot be completed efficiently. This applies for the TWC, DOC, and SCR, as well as for the LNT.
2. Area B: In the high speed–full load area, very high exhaust gas temperatures are experienced, potentially causing overheat of an “undersized” catalyst (characterized by lower thermal capacity). The overheat will accelerate the aging of the catalyst and will have detrimental effects on its durability. This is the area of component protection against thermal stress, with various methods applied for controlling the maximum combustion (and subsequently, exhaust gas) temperatures, such as mixture enrichment (with the associated extra fuel consumption), EGR (used also to reduce throttling losses), and water injection (Fraidl et al., 2016).
The above highlight the importance of expanding vehicle testing further beyond the RDE regulation limits, as is the case with the Dynamic driving test considered in this study. Besides, daily driving is not limited only to the area covered by the RDE-compliant route.
Figure 7 examines the correlation between CO2 (Figures 7A,B) and NOx (Figures 7C,D) emissions and cycle dynamics. The latter is quantified by two parameters, the v×a_95% and the Relative Positive Acceleration (RPA), which have been found to be very good indicators for the characterization of driving style (Gallus et al., 2017; Triantafyllopoulos et al., 2019). The former, v×a_95%, is the 95th percentile of the data series (in 1 Hz) created after ranking in ascending order the product of vehicle speed per positive acceleration >0.1 m/s2 (European Commission, 2016). The latter parameter, RPA, is defined as the integral of vehicle speed multiplied by the time interval (equal to 1 s) and the positive acceleration, divided by the total distance traveled during the test. Both parameters practically express, in different ways, the frequency and intensity of vehicle accelerations. In Figure 7, the v×a_95% can be seen to be around 10 m2/s3 for both the WLTC and the RDE-compliant route, while it is in the order of 30 m2/s3 for the Dynamic driving test. The respective values of the RPA are around 0.15 m/s2 for both the WLTC and the RDE-compliant tests and between 0.30 and 0.40 m/s2 for the Dynamic driving schedule. These values indicate that the WLTC and the RDE-compliant route are similar, in terms of overall driving dynamics. Beginning with CO2 emissions (Figures 7A,B), the correlations with v×a_95% and RPA seem strong for both vehicles. This finding is similar to those of previous studies that included even wider ranges of driving dynamics (Gallus et al., 2017; Giakoumis and Zachiotis, 2018). However, in the case of NOx emissions (Figures 7C,D), a strong correlation with cycle dynamics can be established only for the spark-ignition car (Vehicle 2). A weaker correlation is found in the case of the diesel car (Vehicle 1), caused by the discordance between the WLTC and the RDE-compliant test. Although the former cycle is characterized by slightly higher dynamics, it presents considerably lower NOx emissions. This is a clear indication that there are additional influencing factors involved, and neither v×a_95% nor RPA, which are aggregated driving parameters, seems adequate for the complete characterization of NOx emissions.
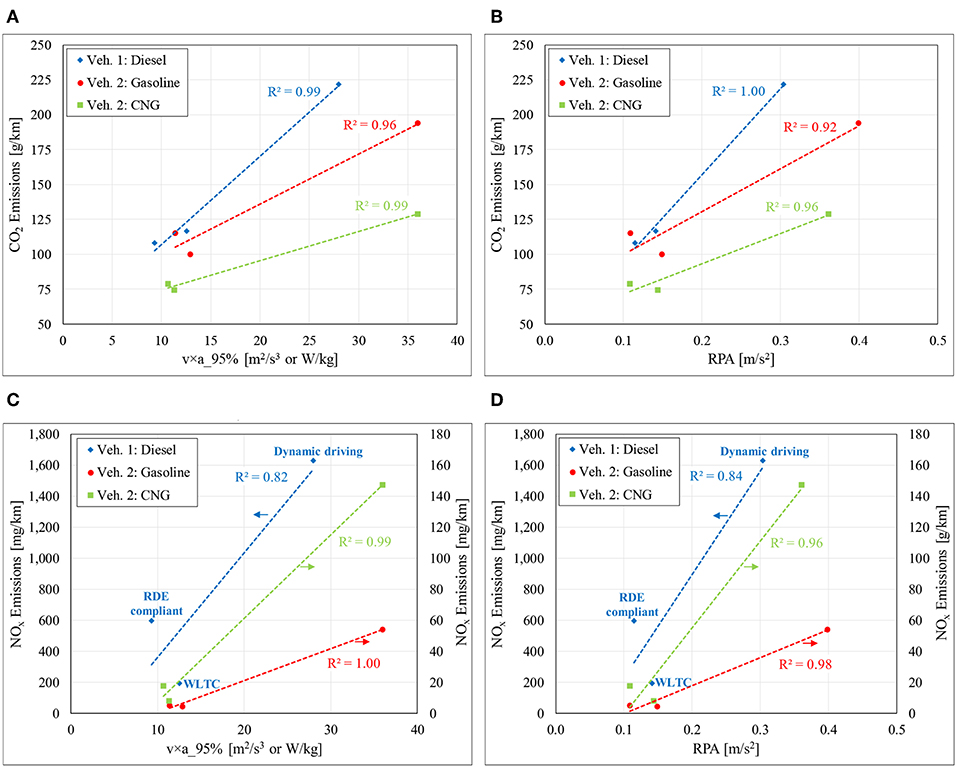
Figure 7. Correlation of CO2 (A,B) and NOx (C,D) emissions with driving dynamics.
A more detailed examination for Vehicle 1 is provided in Figure 8, which illustrates the instantaneous NOx emissions on the engine map as a function of speed and torque for the complete range of testing conditions. In agreement with Figure 6, the WLTC (Figure 8A) and the RDE-compliant route (Figure 8B) cover similar areas on the engine map, while the Dynamic driving test (Figure 8C) covers the complete range of speed and torque. The color scale in Figure 8 corresponds to the instantaneous NOx level at the tailpipe of the vehicle. Such a representation is very useful for highlighting the instantaneous dynamic behavior of the powertrain and aftertreatment systems. At this point, a discrimination between “vehicle” and “engine” dynamics should be made. Under different driving conditions (e.g., different road grade, altitude, selected gear, etc.), the same engine acceleration does not lead to the same vehicle acceleration and vice versa. In other words, each specific engine operating point (flywheel rotation speed and torque) does not correspond to a unique vehicle operating point (velocity and force on wheels).
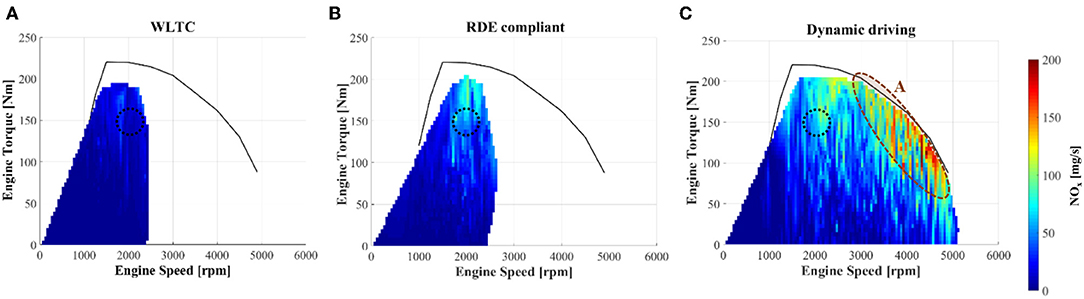
Figure 8. Visualization of tailpipe NOx emissions on the engine map for Vehicle 1 (diesel car) in WLTC (A), RDE-compliant (B), and Dynamic driving (C) tests.
It is interesting to notice in Figure 8 the different NOx emissions at engine operating points covered by all three testing schedules. For example, in the area around 2000 rpm and 150 Nm, marked with a black dotted circle, the tailpipe NOx level gets markedly higher when moving from the WLTC to the RDE-compliant route and then to the Dynamic driving test. Although the engine might macroscopically pass through the same points (in terms of rotational speed and torque), the individual operating parameters vary significantly among the three driving schedules. This explicitly highlights the different transient engine (and aftertreatment) behavior, which becomes more frequent and dynamic from the WLTC to the RDE-compliant route and then to the Dynamic driving test. Ultimately, this has a clear impact on emissions. Past research has shown that a faster engine acceleration or load increase (representing driver aggressiveness) can lead to elevated NOx (and soot) emission peaks (Hagena et al., 2006; Dimaratos, 2017). When considering the two extremes of dynamic engine operation, i.e., immediate transient events and steady-state conditions, at the same rotation speed and torque, NOx emissions can be up to 50% higher in the former conditions, while the respective difference in soot emissions can reach an order of magnitude. Therefore, the study of instantaneous engine and aftertreatment dynamics can provide further insight into emission attributes that cannot be successfully captured by overall cycle dynamics (the latter described, for example, by v×a_95% and RPA). In addition, area A in Figure 8C is characterized by elevated NOx emissions.
In order to further highlight the effect of instantaneous engine dynamics on the operating parameters, Figure 9 presents the distribution of the EGR rate, which is a factor that strongly influences NOx emissions. The frequency in the y-axis of Figure 9 is defined as the cumulative time that the instantaneous (in 1 Hz) EGR value falls within the respective bin over the total duration of the test. Great differences are observed among the three driving schedules examined here, consistent with the aggregated NOx levels: the WLTC has the highest EGR rates and the lowest NOx emissions, while the Dynamic driving test is at the other extreme. The RDE-compliant route lies between the two. The following better quantify the EGR rate in each test:
• WLTC (Figures 9A,D): The EGR rate is above 50% for 75% of the test time. The weighted average EGR rate is 63%.
• RDE compliant (Figures 9B,D): The EGR rate is below 65% for 95% of the test time. The weighted average EGR rate is 40%.
• Dynamic driving (Figures 9C,D): The EGR rate is below 20% for 75% of the test time. The weighted average EGR rate is 15%.
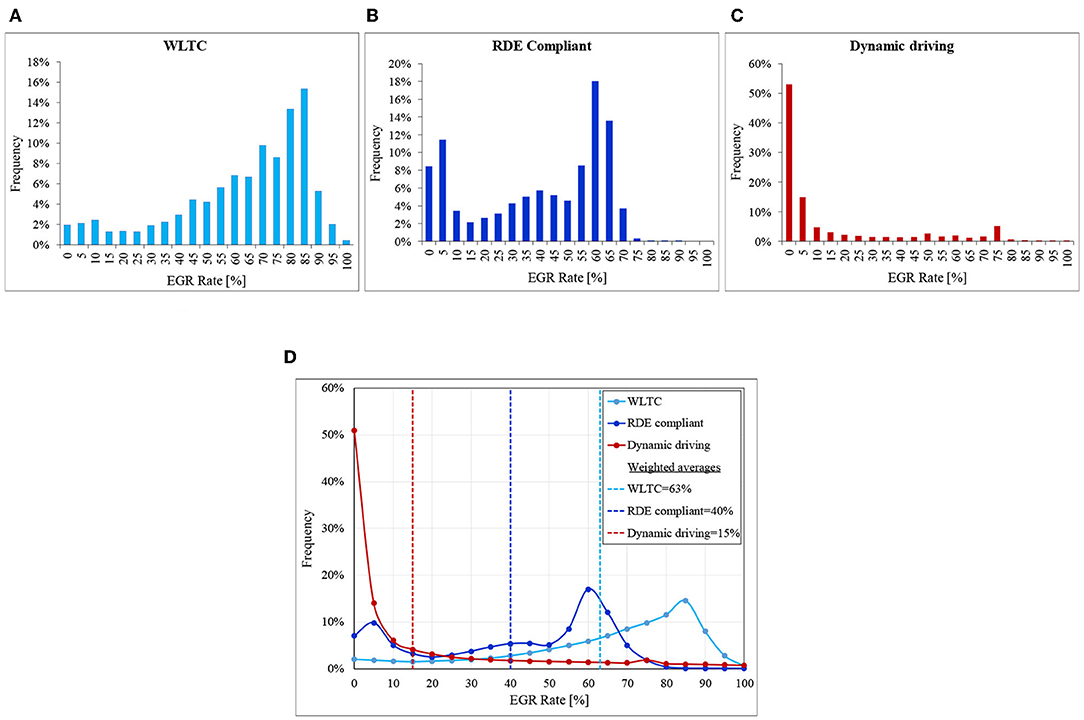
Figure 9. EGR rate of Vehicle 1 under the different driving conditions. Histograms (A–C) and approximate distributions (D) during each test cycle.
A similar analysis is conducted for the bi-fuel car (Vehicle 2), for both fuels. Figure 10 presents the instantaneous NOx emissions on the engine map as a function of speed and torque for the WLTC and the RDE-compliant route. It was not possible to generate similar diagrams for the Dynamic driving schedule owing to the low repeatability of the test (the abrupt accelerations cannot be reproduced with high accuracy in both fuel modes) and the low density of operating points in the high speed-low/medium load area (Figure 6). The color scale, significantly lower compared to the diesel car (Figure 8), corresponds to the instantaneous NOx level at the tailpipe of the vehicle.
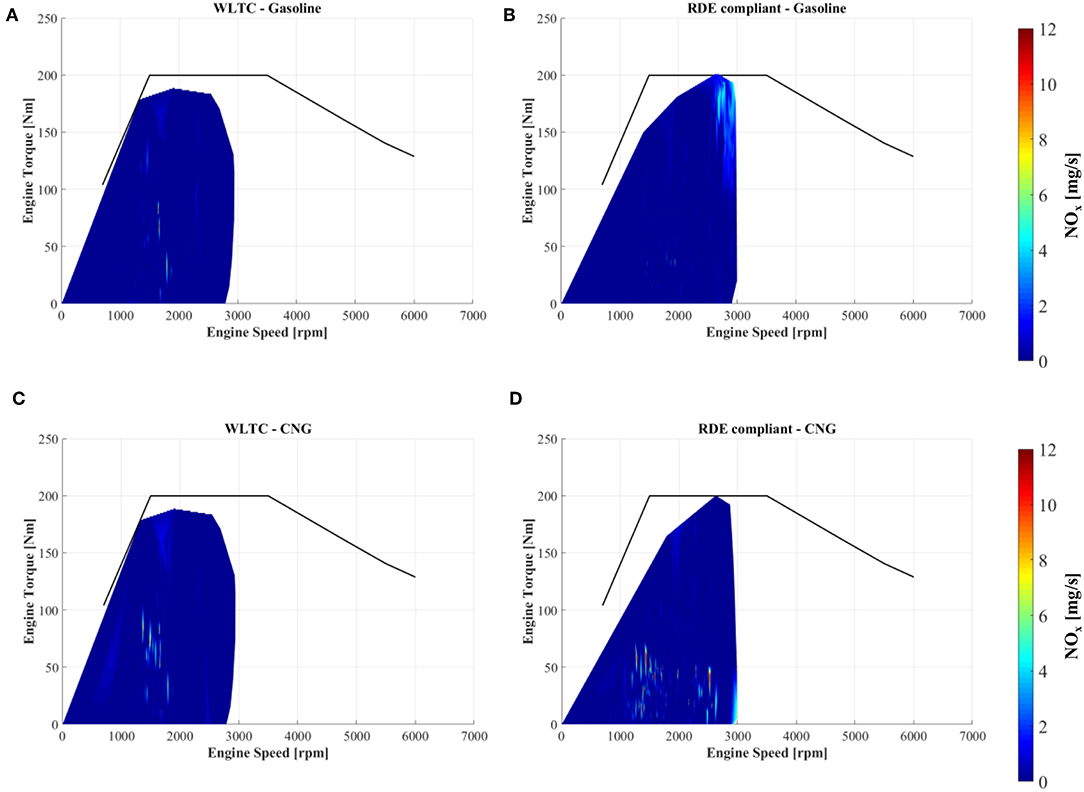
Figure 10. Visualization of tailpipe NOx emissions of Vehicle 2 on the engine map. (A) WLTC and (B) RDE-compliant test with gasoline (C) WLTC and (D) RDE-compliant test with CNG.
As clearly shown in Figure 10, the TWC is capable of diminishing tailpipe NOx emissions drastically in both the WLTC and the RDE-compliant on-road test, independently of the fuel. In the gasoline mode, the differences between the WLTC (Figure 10A) and the RDE-compliant route (Figure 10B) are negligible, in agreement with the aggregated results of Figure 4B. In the case of running with CNG, the RDE-compliant schedule (Figure 10D) presents two areas of elevated NOx emissions in the range of low/moderate engine speed and load. On the other hand, the increased NOx levels during WLTC (Figure 10C) are found within a limited area, in the same range of speed and load. More dynamic and frequent engine transients during the on-road test contribute to the observed differences from the laboratory conditions.
The comparison between the fuels reveals that the main source of NOx emissions is cold start, as highlighted in Figure 11A. As already shown in Figure 5, the cold-start phase, lasting on average <3 min, is responsible for 40% (CNG) and 44% (gasoline) of the NOx emissions of the urban part (the duration of which exceeds 1 h) of the RDE-compliant route. In CNG mode, the NOx peak is higher and the duration of elevated emissions is longer than in the gasoline case. Two aspects related to the aftertreatment operation during the cold-start period play a decisive role in this observation. On the one hand, the TWC light-off temperature is higher for natural gas (DieselNet, 2017; Ferri et al., 2018), and on the other, the catalyst warmup period is longer for CNG, as revealed in Figure 11B. On top of those two factors, methane (CH4, the main constituent of natural gas) has low chemical reactivity and so requires significantly higher activation energy (Van Basshuysen, 2015).
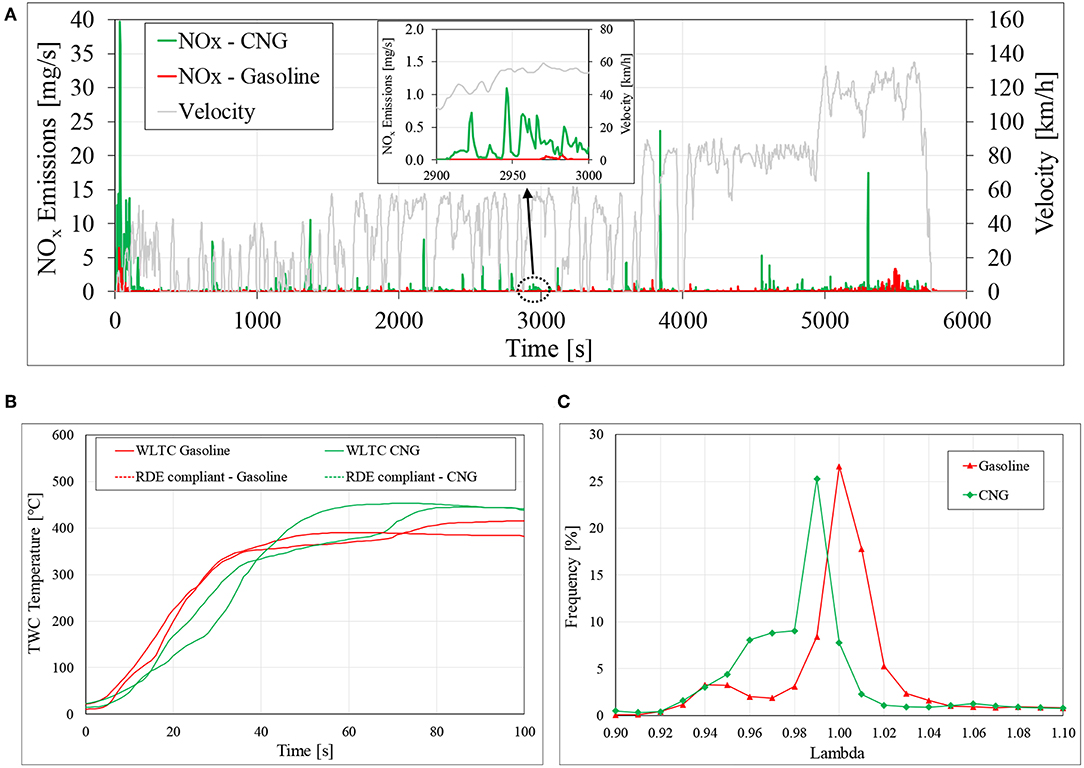
Figure 11. (A) Instantaneous NOx emissions of Vehicle 2 with gasoline and CNG during the RDE-compliant test. (B) TWC temperature evolution in WLTC and RDE-compliant tests. (C) Distribution of lambda (air-fuel equivalence ratio) during the RDE-compliant test.
However, even after the full warmup of the engine and the aftertreatment system, CNG exhibits higher levels of NOx emissions, as well as some spikes, significantly differentiating it from gasoline (Figure 11A). This is a result of the combined effect of engine-out emissions and the performance of the TWC in CNG mode. The governing parameter of NOx formation in the combustion chamber is temperature; oxygen concentration is an additional influencing factor (Heywood, 1988). It has been found experimentally that the cylinder head and wall temperatures of a bi-fuel engine are higher when running on natural gas (Ghorbanian and Ahmadi, 2012) due to the elevated combustion temperatures. In addition, TWC operation in fully warm conditions is different between the two fuel modes, originating from the different lambda (air-fuel equivalence ratio) control. Figure 11C presents the distribution of lambda values for the RDE-compliant test, and the clear divergence between the fuels is revealed: with CNG the engine runs slightly rich. The main reason behind this difference is the optimization of methane conversion efficiency (in the TWC), which reaches a maximum in a very narrow window with lambda values below 1 (Ferri et al., 2018). However, the conversion of NOx in the TWC within this window is only partial, while the competitive reactions of CO and NO oxidation pose further limitations to the successful abatement of nitrogen oxide emissions (DieselNet, 2017; Ferri et al., 2018).
Closing this section and with reference to Vehicle 2, it must be clarified that the above findings and analysis correspond to a bi-fuel passenger car that is required to run efficiently with both CNG and gasoline. This requirement poses limitations to the design of the powertrain system, not allowing the full exploitation of the properties of natural gas. For example, the very high octane number of CNG would permit an increase in CR, which, however, is kept low in a bi-fuel engine owing to the inferior knocking resistance of gasoline. Nevertheless, such drawbacks may be surpassed with the development of mono-fuel SI engines optimized for natural gas operation (e.g., Weber et al., 2018).
Summary and Conclusions
The present work aimed at the assessment of the CO2 and NOx emissions of two C segment Euro 6 passenger cars under real-world and laboratory conditions. A diesel vehicle equipped with a common-rail engine, LNT, and DPF and a bi-fuel gasoline/CNG vehicle equipped with TWC were tested. The on-road driving conditions consisted of two routes, the first complying with the RDE regulations and the second characterized by more aggressive driver behavior. In the laboratory, the WLTC was carried out, applying the realistic road load of the vehicles. CO2 and NOx emissions were measured with a PEMS. Further to the aggregated results, the instantaneous NOx emissions were analyzed in order to gain further insight into the behavior of the vehicles under varying driving conditions. The basic findings of the current study can be summarized as follows:
• Running the WLTC with the real-world road load of the vehicle limited the difference in CO2 emissions between the RDE-compliant route and the laboratory test. The aggressive driver behavior and the uphill roads in the Dynamic driving schedule resulted in a near-doubling of CO2 emissions for both cars.
• Natural gas can reduce CO2 emissions significantly compared to both gasoline and diesel due to its lower carbon content and its higher calorific value.
• For the diesel car, real-world NOx emissions were significantly higher than the Euro 6 and temporarily permitted on-road levels. The latter was exceeded by 3.5 and 9.5 times in the RDE-compliant and Dynamic driving tests, respectively. Major differences in EGR among the various tests influenced tailpipe NOx levels decisively.
• For the bi-fuel car, NOx emissions were below the Euro 6 limit under any testing condition, with the only exception being the Dynamic driving schedule in CNG mode. Peak levels were observed mainly in the cold-start phase, before the TWC reached its light-off temperature.
• Natural gas resulted in increased NOx emissions compared to gasoline under any testing condition. The combination of combustion temperature and lambda control lies behind this result.
• Aggregated emissions and overall cycle dynamics cannot capture all the emissions attributes sufficiently under transient conditions. The study of instantaneous engine and aftertreatment dynamics can reveal additional details, assisting the interpretation of the measured data, and results.
Data Availability Statement
The datasets generated for this study are available on request to the corresponding author.
Author Contributions
AD was responsible for the experimental campaign and data processing, the analysis and interpretation of the results, drafting the paper, and making its final revision. ZT supported the experimental campaign and reviewed the paper. SD and GT supported the post-processing of the experimental data and reviewed the paper. AK supported the experimental activity and reviewed the paper. ZS had the overall supervision of the work and reviewed the paper.
Funding
This research is co-financed by Greece and the European Union (European Social Fund-ESF) through the Operational Programme ≪Human Resources Development, Education and Lifelong Learning≫ in the context of the project “Reinforcement of Postdoctoral Researchers” (MIS-5001552) implemented by the State Scholarships Foundation (IKY).
Conflict of Interest
The authors declare that the research was conducted in the absence of any commercial or financial relationships that could be construed as a potential conflict of interest.
Abbreviations
CF, Conformity Factor; CNG, Compressed Natural Gas; CO2, Carbon Dioxide; DPF, Diesel Particulate Filter; EEA, European Environmental Agency; EGR, Exhaust Gas Recirculation; GDI, Gasoline Direct Injection; LNT, Lean NOx Trap; NEDC, New European Driving Cycle; NOx, Nitrogen Oxides; NO2, Nitrogen Dioxide; PEMS, Portable Emissions Measurement System; PFI, Port Fuel Injection; RDE, Real Driving Emissions; RON, Research Octane Number; TA, Type Approval; TWC, Three-Way Catalyst; WLTC, Worldwide harmonized Light vehicles Test Cycle; WLTP, Worldwide harmonized Light vehicles Test Procedure.
References
ACEA (2019). Share of Diesel in New Passenger Cars. Available online at https://www.acea.be/statistics/tag/category/share-of-diesel-in-new-passenger-cars
ADAC (2019). Saubere Diesel: Abgasnorm Euro 6d-Temp in Test. Available online at: https://www.adac.de/rund-ums-fahrzeug/abgas-diesel-fahrverbote/abgasnorm/test-euro-6d-temp/
Chen, H., He, J., and Zhong, X. (2018). Engine combustion and emission fuelled with natural gas: a review. J. Energy Inst. 92, 1123–1136. doi: 10.1016/j.joei.2018.06.005
DieselNet (2017). Three Way Catalysts for Methane. Available online at: https://www.dieselnet.com/tech/catalyst_methane_three-way.php
Dimaratos, A. M. (2017). “Turbocharger response during diesel engine transient operation and effect on soot emissions,” in Turbochargers and Turbocharging: Advancements, Applications and Research, ed E. G. Giakoumis (New York, NY: Nova Science Publishers), 193–220.
EEA (2018a). EEAGreenhouse Gas - Data Viewer. Available online at: https://www.eea.europa.eu/data-and-maps/data/data-viewers/greenhouse-gases-viewer
European Commission (2018a). Policies, Information and Services—Climate Action. Available online at: https://ec.europa.eu/clima/policies/international/paris_protocol/transport_en
European Commission (2019). Proposal for a REGULATION OF THE EUROPEAN PARLIAMENT AND OF THE COUNCIL Amending Regulation (EC) No 715/2007 on Type Approval of Motor Vehicles With Respect to Emissions From Light Passenger and Commercial Vehicles (Euro 5 and Euro 6) and on Access to Vehicle Repair and Maintenance Information. Available online at: https://eur-lex.europa.eu/legal-content/EN/TXT/?qid=1560514030186&uri=COM:2019:208:FIN
Ferri, D., Elsener, M., and Krocher, O. (2018). Methane oxidation over a honeycomb Pd-only three-way catalyst under static and periodic operation. Appl. Catal. B-Environ. 220, 67–77. doi: 10.1016/j.apcatb.2017.07.070
Fontaras, G., Ciuffo, B., Zacharof, N., Tsiakmakis, S., Marotta, A., Pavlovic, J., et al. (2017). The difference between reported and real-world CO2 emissions: how much improvement can be expected by WLTP introduction? Transp. Res. Procedia 25, 3933–3943. doi: 10.1016/j.trpro.2017.05.333
Fraidl, G., Kapus, P., and Vidmar, K. (2016). “The gasoline engine and RDE challenges and prospects”, in 16. Internationales Stuttgarter Symposium, eds M. Bargende, H.-C. Reuss, and J. Wiedemann (Wiesbaden: Springer Fachmedien Wiesbaden), 257–283. doi: 10.1007/978-3-658-13255-2_20
Gallus, J., Kirchner, U., Vogt, R., and Benter, T. (2017). Impact of driving style and road grade on gaseous exhaust emissions of passenger vehicles measured by a Portable Emission Measurement System (PEMS). Transp. Res. Part, D. Transp. Environ. 52, 215–226. doi: 10.1016/j.trd.2017.03.011
Ghorbanian, J., and Ahmadi, M. (2012). Experimental thermal analysis of cylinder block and head of a bi-fuel turbocharged engine. Meccanica 47, 1987–2004. doi: 10.1007/s11012-012-9569-7
Giakoumis, E. G., and Zachiotis, A. T. (2018). Comparative evaluation of eight legislated driving schedules in terms of cycle metrics and emissions from a diesel-powered turbocharged van. Transp. Res. Part D. Transp. Environ. 58, 139–154. doi: 10.1016/j.trd.2017.11.002
Hagena, J. R., Filipi, Z. S., and Assanis, D. N. (2006). “Transient diesel emissions: analysis of engine operation during a tip-in,” in SAE Technical Paper 2006-01-1151. doi: 10.4271/2006-01-1151
Hooftman, N., Messagie, M., Van Mierlo, J., and Coosemans, T. (2018). A review of the European passenger car regulations – Real driving emissions vs local air quality. Renew. Sustain. Energy Rev. 86, 1–21. doi: 10.1016/j.rser.2018.01.012
ICCT (2017). Real-Driving Emissions Test Procedure for Exhaust Gas Pollutant Emissions of Cars and Light Commercial Vehicles in Europe. 1–10.
Jahirul, M.I., Masjuki, H.H., Saidur, P., Kalam, M.A., Jayed, M.H., and Wazed, M.A. (2010). Comparative engine performance and emission analysis of CNG and gasoline in a retrofitted car engine. Appl. Therm. Eng. 30, 2219–2226. doi: 10.1016/j.applthermaleng.2010.05.037
JATO (2019). CO2 Emissions Rise to Highest Average Since 2014, as the Shift From Diesel to Gasoline Continues. Available online at: https://www.jato.com/co2-emissions-rise-to-highest-average-since-2014-as-the-shift-from-diesel-to-gasoline-continues
Khan, M. I., Yasmeen, T., Khan, M. I., Farooq, M., and Wakeel, M. (2016). Research progress in the development of natural gas as fuel for road vehicles: a bibliographic review (1991–2016). Renew. Sustain. Energy Rev. 66, 702–741. doi: 10.1016/j.rser.2016.08.041
Khan, M. I., Yasmin, T., and Shakoor, A. (2015). Technical overview of compressed natural gas (CNG) as a transportation fuel. Renew. Sustain. Energy Rev. 51, 785–797. doi: 10.1016/j.rser.2015.06.053
Kwon, S., Park, Y., Park, J., Kim, J., Choi, K.-H., and Cha, J.-S. (2017). Characteristics of on-road NOx emissions from Euro 6 light-duty diesel vehicles using a portable emissions measurement system. Sci. Total Environ. 576, 70–77. doi: 10.1016/j.scitotenv.2016.10.101
Luján, J. M., Bermúdez, V., Dolz, V., and Monsalve-Serrano, J. (2018). An assessment of the real-world driving gaseous emissions from a Euro 6 light-duty diesel vehicle using a portable emissions measurement system (PEMS). Atmos. Environ. 174, 112–121. doi: 10.1016/j.atmosenv.2017.11.056
Marotta, A., Pavlovic, J., Ciuffo, B., Serra, S., and Fontaras, G. (2015). Gaseous emissions from light-duty vehicles: moving from NEDC to the new WLTP test procedure. Environ. Sci. Technol. 49, 8315–8322. doi: 10.1021/acs.est.5b01364
Muncrief, R., German, J., and Schultz, J. (2016). Defeat Devices Under the U.S. and EU Passenger Vehicle Emissions Testing Regulations (Berlin: ICCT Briefing), 1–12.
NGVA Europe (2016). Norks Gassforum: Natural Gas in Vehicles in Europe—Challenges and Possibilities. Brussels.
O'Driscoll, R., Stettler, M. E. J., Molden, N., Oxley, T., and ApSimon, H. M. (2018). Real world CO2 and NOx emissions from 149 Euro 5 and 6 diesel, gasoline and hybrid passenger cars. Sci. Total Environ. 621, 282–290. doi: 10.1016/j.scitotenv.2017.11.271
Ramos, A., Muñoz, J., Andrés, F., and Armas, O. (2018). NOx emissions from diesel light duty vehicle tested under NEDC and real-word driving conditions. Transp. Res. Part D. Transp. Environ. 63, 37–48. doi: 10.1016/j.trd.2018.04.018
Rašić, D., Oprešnik, S. R., Seljak, T., Vihar, R., Baškovič, U.Ž, Wechtersbach, T., et al. (2017). RDE-based assessment of a factory bi-fuel CNG/gasoline light-duty vehicle. Atmos. Environ. 167, 523–541. doi: 10.1016/j.atmosenv.2017.08.055
Tietge, U., Díaz, S., Mock, P., Bandivadekar, A., Dornoff, J., and Ligterink, N. (2019). From Laboratory to Road – A 2018 Update of Official and “Real-World” Fuel Consumption and CO2 Values for Passenger Cars in Europe. ICCT White Paper, 1–56.
Triantafyllopoulos, G., Dimaratos, A., Ntziachristos, L., Bernard, Y., Dornoff, J., and Samaras, Z. (2019). A study on the CO2 and NOx emissions performance of Euro 6 diesel vehicles under various chassis dynamometer and on-road conditions including latest regulatory provisions. Sci. Total Environ. 666, 337–346. doi: 10.1016/j.scitotenv.2019.02.144
Tsokolis, D., Tsiakmakis, S., Dimaratos, A., Fontaras, G., Pistikopoulos, P., Ciuffo, B., et al. (2016). Fuel consumption and CO2 emissions of passenger cars over the new worldwide harmonized test protocol. Appl. Energy 179, 1152–1165. doi: 10.1016/j.apenergy.2016.07.091
Tutuianu, M., Bonnel, P., Ciuffo, B., Haniu, T., Ichikawa, N., Marotta, A., et al. (2015). Development of the World-wide harmonized Light duty Test Cycle (WLTC) and a possible pathway for its introduction in the European legislation. Transp. Res. Part D. Transp. Environ. 40, 61–75. doi: 10.1016/j.trd.2015.07.011
Van Basshuysen, R., (ed.). (2015). Natural Gas and Renewable Methane for Powertrains—Future Strategies for a Climate-Neutral Mobility. Wiesbaden: Springer (2015). doi: 10.1007/978-3-319-23225-6
Van der Slot, A., Schlick, T., Pfeiffer, W., and Baum, M. (2016). Integrated Fuels and Vehicles Roadmap to 2030+. Munich: Roland Berger GmbH.
Vojtíšek-Lom, M., Beránek, V., Klír, V., Jindra, P., Pechout, M., and Voříšek, T. (2018). On-road and laboratory emissions of NO, NO2, NH3, N2O and CH4 from late-model EU light utility vehicles: comparison of diesel and CNG. Sci. Total Environ. 616–617, 774–784. doi: 10.1016/j.scitotenv.2017.10.248
Weber, C., Kramer, U., Friedfeldt, R., Ruhland, H., and Krämer, F. (2018). “Development of a new combustion engine dedicated to methane operation,” in 39 Internationales Wiener Motorensymposium (Vienna), 26–27.
Wyatt, D.W, Li, H., and Tate, J. E. (2014). The impact of road grade on carbon dioxide (CO2) emission of a passenger vehicle in real-world driving. Transp. Res. Part D. Transp. Environ. 32, 160–170. doi: 10.1016/j.trd.2014.07.015
Yang, L., Franco, V., Mock, P., Kolke, R., Zhang, S., Wu, Y., et al. (2015). Experimental assessment of NOx emissions from 73 Euro 6 diesel passenger cars. Environ. Sci. Technol. 49, 14409–14415. doi: 10.1021/acs.est.5b04242
Keywords: RDE, PEMS, WLTC, emissions, CNG (Compressed Natural Gas), Euro 6 emission regulations
Citation: Dimaratos A, Toumasatos Z, Doulgeris S, Triantafyllopoulos G, Kontses A and Samaras Z (2019) Assessment of CO2 and NOx Emissions of One Diesel and One Bi-Fuel Gasoline/CNG Euro 6 Vehicles During Real-World Driving and Laboratory Testing. Front. Mech. Eng. 5:62. doi: 10.3389/fmech.2019.00062
Received: 31 May 2019; Accepted: 01 November 2019;
Published: 03 December 2019.
Edited by:
Apostolos Pesyridis, Brunel University London, United KingdomReviewed by:
Hongsheng Guo, National Research Council Canada (NRC-CNRC), CanadaVicente Bermudez, Polytechnic University of Valencia, Spain
Copyright © 2019 Dimaratos, Toumasatos, Doulgeris, Triantafyllopoulos, Kontses and Samaras. This is an open-access article distributed under the terms of the Creative Commons Attribution License (CC BY). The use, distribution or reproduction in other forums is permitted, provided the original author(s) and the copyright owner(s) are credited and that the original publication in this journal is cited, in accordance with accepted academic practice. No use, distribution or reproduction is permitted which does not comply with these terms.
*Correspondence: Zissis Samaras, emlzaXNAYXV0aC5ncg==