 Shingo Ozaki
 Keishi Mieda1
 Ken Nakano
- 1Faculty of Engineering, Yokohama National University, Yokohama, Japan
- 2Department of Electrical and Mechanical Engineering, Nagoya Institute of Technology, Nagoya, Japan
- 3Faculty of Environment and Information Science, Yokohama National University, Yokohama, Japan
To deepen the understanding of the frictional sliding phenomena of rough surfaces, advances are required in numerical analysis methods at various spatial scales. In this study, to examine the microscopic behavior of a rough asperity contact corresponding to a bulk contact on the macroscopic scale, a loop-type meso–macro coupled analysis scheme is proposed. A mesoscale numerical model and a macroscopic friction model are required for the proposed multi-scale analysis. A friction model was adopted based on the multipoint contact model for the mesoscale model, and the pressure- and state-dependent elastoplastic analogy friction model was used for the macroscale model. In the proposed meso–macro coupled analysis, the parameter set for the elastoplastic analogy friction model was first identified via a numerical friction test using the mesoscale multipoint contact model assuming various conditions. Then, a macroscale finite element analysis incorporating the elastoplastic analogy friction model was performed for the macroscopic analysis of contact between a rough rubber hemisphere and a smooth plate. Here, the information from the mesoscale rough surfaces were reflected in the macroscale finite element analysis. Finally, a mesoscale localization analysis was performed in which the macroscopic histories of several typical locations were obtained by finite element analysis and used as boundary conditions for the mesoscale model. It is suggested that the microscopic sliding process of rough surfaces represented by the finite element analysis can be examined using the proposed method.
Introduction
Friction is an important physical phenomenon in mechanical engineering. For example, friction between sliding parts of machines not only accounts for the majority of energy loss, but also causes failure. Meanwhile, rubber materials are often used for mechanical components where a frictional contact occurs. It is widely known that rubber friction can be categorized into two main components: adhesion friction and hysteresis friction (Tabor, 1960; Schallamach, 1971; Fuller and Tabor, 1975; Roberts, 1992; Persson, 2001). According to Roberts and Thomas (1975) and Persson and Volokitin (2006), adhesion friction is reported to be dominant when coarse rubber slides on a smooth hard surface. The focus of this study was therefore the adhesion friction of rubber.
For soft rubber, the distance between real contact points decreases as the contact load increases, and the mutual interference between the contact points saturates the real contact area (Johnson et al., 1985; Manners, 2000; Persson et al., 2002; Hyun et al., 2004; Yang and Persson, 2008; Maegawa et al., 2015). In this process, since the ratio of the real contact area Ar to the apparent contact area Aa increases, the relationship between the frictional force and the contact load is no longer proportional; thus, the friction coefficient exhibits a complex pressure dependency (Schallamach, 1971; Persson et al., 2002; Yang and Persson, 2008; Maegawa et al., 2015). Therefore, to deepen the understanding of the frictional sliding phenomena of rubber materials, advances in numerical analysis methods on various spatial scales are required in addition to experimental observations.
The invention of the atomic force microscope in the 1985 made it possible to directly measure frictional phenomena occurring at the atomic (nano) and molecular (micro) scales (Binnig et al., 1986), and several molecular dynamics methods were developed around the same time. Meanwhile, macroscale numerical analysis methods include the finite element and boundary element methods. At present, many commercial software packages are equipped with a standard analysis function for frictional contact problems (Kikuchi and Oden, 1988; Laursen, 2001; Wriggers, 2003). Furthermore, various phenomenological rate- and state-dependent friction models have been proposed for more advanced analyses (Dieterich, 1972, 1979; Ruina, 1983; Hashiguchi and Ozaki, 2008; Ozaki and Hashiguchi, 2010; Ozaki et al., 2012, 2013, 2020). In between the nano/microscale and macroscale, multipoint asperity level contact theories take the form of mesoscale models. Thus, studies focusing on each scale are being actively pursued, and a great deal of knowledge has already been accumulated as a result.
Meanwhile, multiscale analysis methods that connect analyses at each scale are also required. A multiscale analysis makes it possible to examine the elementary behavior of asperities on a microscopic scale corresponding to macroscopic frictional contact behavior. However, in practice, contact surfaces that need to be engineered often have uncertainties due to roughness; additionally, they have no periodicity or regularity. This makes it difficult to apply bi-directionally coupled (strong coupling) multiscale analysis methods, such as the homogenization method used in computational solid mechanics, to frictional contact problems. Therefore, it is necessary to use a multiscale analysis method in another framework that can overcome this issue.
In this study, a loop-type coupled analysis scheme is proposed that bridges the mesoscale and macroscale domains with reference to the multiscale uncoupled analysis used in studies of crystal structures that affect the strength of metals (Watanabe and Terada, 2010). Specifically, the “mesoscale multipoint contact model” and the “macroscale finite element analysis model” are linked via the “rate-, state-, and pressure-dependent friction model" proposed by the authors (Ozaki et al., 2020). Based on this scheme, the analysis results at each scale can be mutually expanded, and a multiscale understanding of the frictional sliding phenomena becomes possible. The procedure for implementing the proposed analysis method is summarized below. Note that in this study, the rate dependency of rubber friction is not considered in order to investigate the pressure-dependent behavior and the effect of roughness upon it.
The proposed loop-type coupled analysis method procedure is as follows:
1. Perform a “numerical friction test” using a mesoscale frictional contact model (mesoscale analysis) at the scale of the representative contact area.
2. Carry out parameter fitting of the macroscale friction model by using the results obtained in Step 1.
3. Implement the macroscale friction model in a finite element model and perform a “macroscale analysis” of various frictional contact problems using the previously determined parameters.
4. Select arbitrary evaluation points (nodes or elements) on the contact surface of the macroscale finite element model, and perform a “localization analysis” at the mesoscale using the histories of contact stress and sliding velocity as boundary conditions. Then, study the elementary behavior on the mesoscale corresponding to the macroscale analysis results.
Friction Models
The mesoscale and macroscale friction models are briefly explained in this section.
Mesoscale Model
In this study, the statistical model of asperities in contact based on Greenwood and Williamson (1966) was adopted as the mesoscale analysis model. Figure 1 shows a schematic of this analysis model. This model corresponds to multi-point contact between an elastic rough surface and a rigid smooth surface. As shown in the figure, there are N asperities on the upper surface, and the height of asperity i is zi. Assuming that the distance between the rough surface and the smooth surface is d, the compression of asperity i in the normal direction, δi, is given as follows:
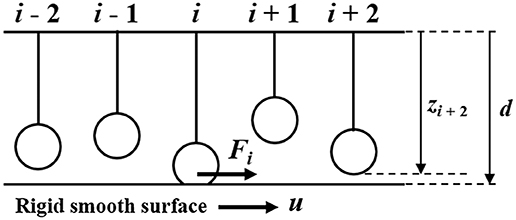
Figure 1. Mesoscale model: frictional sliding between a rough elastic surface and a smooth rigid surface considering stochastic distribution of asperity heights.
Here, it is assumed that the deformation of the asperity follows Hertz's contact theory. Thus, the radius of contact ai, the contact area Ai, and the normal load wi supported by the asperity can be defined in the following manner:
where E and ν are the elastic modulus and Poisson's ratio of the asperity, respectively, and β is the radius of curvature at the tip of the asperity. Further, the tangential contact stiffness ki is given by the following equation using the shear modulus, G, and Poisson's ratio, v:
The friction force Fi is expressed by the product of the tangential contact stiffness ki and the tangential displacement u when sticking, and by the product of the shear strength τ and the contact area Ai when sliding. That is,
Macroscale Model
In the proposed loop-type coupled multiscale analysis scheme, the capabilities of the macroscale friction model are important. In this study, the rate-, state-, and pressure-dependent elastoplastic analogy friction model previously proposed by the authors was used as the macroscale friction model (Ozaki et al., 2020). This model can rationally describe basic frictional sliding characteristics such as the smooth transition of static–kinetic frictions, time-dependent recovery of static friction, velocity-weakening of frictional resistance, and pressure dependency.
As rate dependency was not considered in this study, the state and pressure dependencies are the focus of this section. The relationship between the contact stress rate ḟ and sliding velocity is defined in the following manner (Hashiguchi and Ozaki, 2008; Ozaki and Hashiguchi, 2010; Ozaki et al., 2012, 2013, 2020):
where the second-order elastoplastic contact stiffness tensor is given as:
Here, αn and αt are the elastic contact stiffness moduli in the normal and tangential directions, respectively; I, n, and t are the unit tensor, unit normal vector, and unit tangential vector, respectively; and n and t are defined as follows:
where fn and ft are the normal and tangential contact stress vectors, respectively, and hold the relationship of f = fn + ft.
In this study, R(0 ≤ R ≤ 1) is defined as the state variable to describe the microscopic sliding before gross sliding, and is called the normal-sliding ratio. The following function was adopted for the evolution law of the normal-sliding ratio:
where
Here, r is the parameter for microscopic sliding and is the plastic (irreversible) sliding velocity.
Meanwhile, to describe the pressure dependency, the variable Sr = Ar/Aa is introduced in the model. Here, Ar is the real contact area and Aa is the apparent contact area. The pressure dependency of the real contact area is assumed as follows:
where b is the parameter for pressure dependency.
Multiscale Analysis
In this study, the contact between a rough rubber hemisphere made of cross-linked polydimethylsiloxane (PDMS) and a smooth plate made of polymethylmethacrylate (PMMA) (Maegawa et al., 2015) was adopted as the analysis target. Although PDMS hemispheres with different surface roughness values were assumed in the analysis, a quantitative comparison is beyond the scope of this study as the purpose of this study was to propose a meso–macro coupled analysis method. In the following sections, the details of each step of the proposed analysis method are described. Note that it was assumed that the PMMA plate was a rigid body in the analysis because the Young's modulus of PMMA is sufficiently large compared to that of PDMS.
Numerical Friction Test
This section describes the numerical friction test using the statistical model of asperities in contact, as shown in Figure 1. The heights of asperity, zi, were assumed to correspond to two levels of surface roughness. Here, the heights of asperity were set to follow a normal distribution.
Table 1 lists the conditions evaluated in the numerical friction tests, in which two levels of roughness were controlled by setting the maximum height Rz, where the values of Rz correspond to 6σ of each normal distribution. In addition, eight levels of normal stress (pressure) were evaluated to examine the pressure dependency. In the analysis, the target normal stress fn was set, and the parameters δi and wi were calculated using Equations (1) and (4), respectively. Then, the distance d was repeatedly increased by a small amount until the calculated normal stress reached the target value. Thereafter, the sliding displacement was given and the tangential stress (friction stress) was calculated by Equation (6) under a constant normal stress. Figure 2 shows examples of the asperity height distributions, where the 1 × 1 mm analysis area corresponds to the apparent contact area Aa, and is the representative contact area. Note that because random numbers were used, the distributions of asperities shown in Figure 2 were different for each analysis, and 10 tests were performed for each condition.
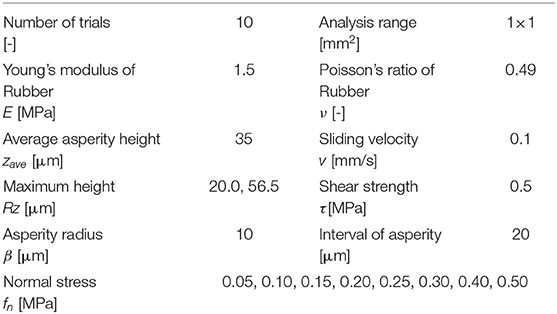
Table 1. Conditions of the numerical friction test using the statistical model of asperities in contact.
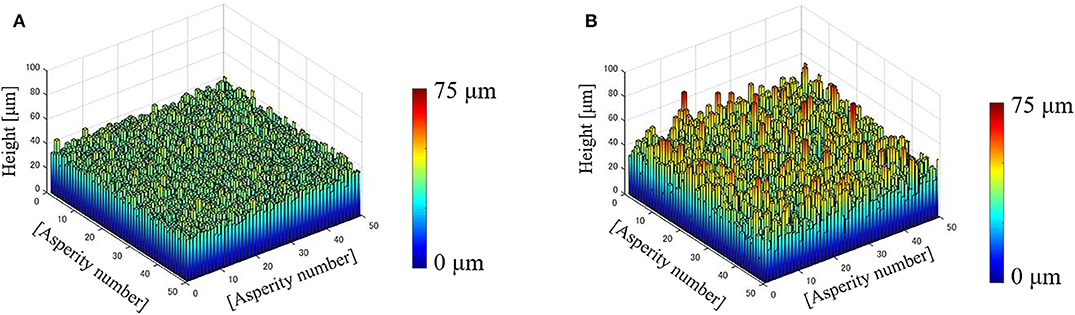
Figure 2. Example distribution of asperity heights: (A) Rz =20.0 μm and (B) Rz =56.5 μm.
Figure 3 shows an example of the numerical test results for the relationship between frictional stress and sliding displacement under eight levels of normal stress. Here, Rz is 20.0 μm. The averaged results of 10 tests are shown for each normal stress condition. As can be confirmed from the figure, the friction stress increases with sliding (the tangential movement of the smooth flat plate) and reaches a steady state. In addition, because the real contact area in the mesoscale model varies depending on the normal stress, the magnitude of friction stress also varies.
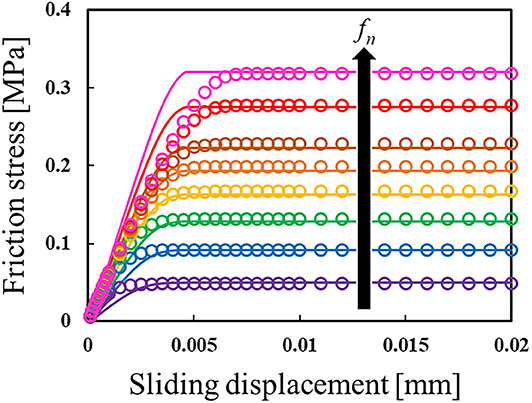
Figure 3. Variation in friction stress with sliding displacement under eight levels of constant normal stress, where Rz = 20.0 μm. The solid lines show results obtained by a numerical friction test (NFT), while the open circles show the fitting results from the macroscale friction model.
Figure 4 shows the results of the pressure dependency of the friction coefficient (as a ratio of stress ft/fn). Plots in the graph are average values during the steady state of the 10 tests. It is confirmed that the friction coefficient decreases as the normal stress increases. The reason for the tendency shown in Figure 4 is that the distance between the real contact points decreases as the normal stress increases, and the mutual interference between these contact points slows down the increase in the real contact area (Persson et al., 2002; Yang and Persson, 2008; Maegawa et al., 2015). Furthermore, the smaller the surface roughness, the larger the friction coefficient. These tendencies have also been confirmed in the actual friction tests simulated by these analyses (Maegawa et al., 2015).
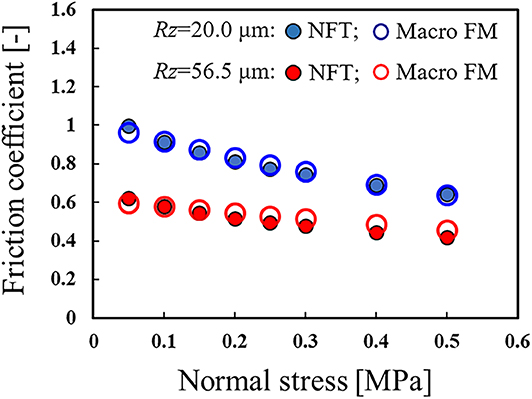
Figure 4. Relationship between the steady state ratio of stress (friction coefficient) and normal stress. Here, the closed circles show the results of the numerical friction test (NFT), while the open circles show the results of the macroscale friction model (Macro FM).
Parameter Fitting of Macroscale Friction Model
In this section, the determination of the friction model parameters used for the macroscale finite element analysis is described. The following parameters were determined: the elastic contact stiffness moduli αn and αt; r, which prescribes the smoothness of the stick-to-slip transition; and b, which prescribes the pressure dependency. Additionally, the shear strength shown in Table 1 was adopted.
In the mesoscale model adopted in this study, the initial slope of the friction stress–sliding displacement relationship differs depending on the normal stress because the contact radius of asperity is used for the tangential stiffness [see Equation (5)]. Since the pressure dependencies of the elastic moduli were not considered in the macroscale friction model, the parameter fitting was performed by focusing on the result fn= 0.25 MPa. The determined parameters are accordingly listed below:
Figures 3, 4 also show an example of the fitting results by the macroscale friction model (the open circles). By using an appropriate macroscale friction model, the results of the mesoscale analysis can indeed be obtained at a low calculation cost.
Finite Element Analysis
In this section, the finite element analysis of the frictional contact between a rough rubber hemisphere and a smooth plate is described. The commercial software package MSC Marc (2020) and its related user subroutine for the implementation of the friction model was used in this analysis.
Figure 5 shows the finite element model and boundary conditions. The rubber hemisphere and the flat plate were discretized by eight-node solid elements. Note that a fine mesh was adopted for the rubber contact surface. The rubber hemisphere was a linear elastic body, and its Young's modulus and Poisson's ratio were set to E = 1.5 MPa and v = 0.49, respectively, while the flat PMMA plate was considered a rigid body. The radius of the rubber hemisphere was 11 mm. In the analysis, the upper surface of the rubber hemisphere was fixed in the in-plane direction and subjected to a prescribed forced displacement in the vertical direction (normal to the plate) in order to press it against the plate. Then, a forced velocity (0.1 mm/s) was applied to the plate in the x-direction to slide over one another. Note that the displacement of the plate was fixed in all directions except the x-direction.
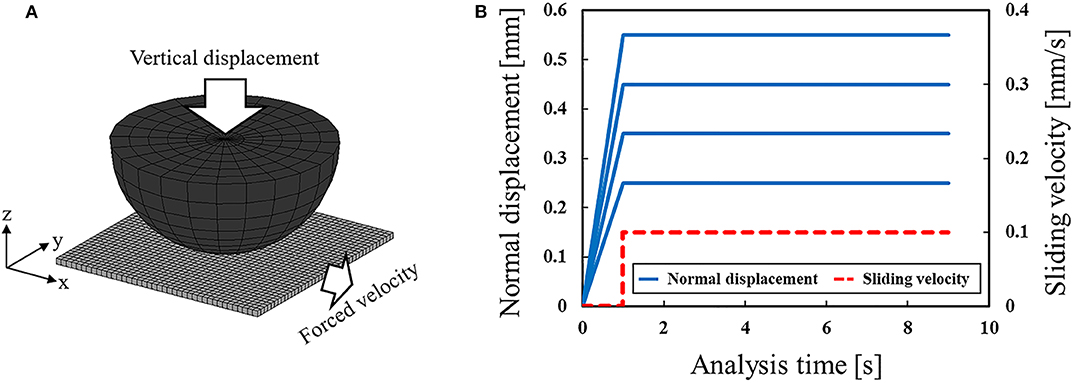
Figure 5. (A) Finite element model and (B) Sliding condition.
Figure 6 shows an example of the macroscale analysis results, in which the vertical pressing displacement of the rubber hemisphere is 0.25 mm. This figure shows the variation in friction force on the rubber hemisphere over time. From the figure, it can be seen that the frictional force gradually increases with the movement of the flat plate before reaching a steady state. In addition, the magnitude of the frictional force in the steady state reflects the roughness in the mesoscale model, i.e., the friction force decreases as the roughness increases. This tendency has also been confirmed in previous experiments (Maegawa et al., 2015).
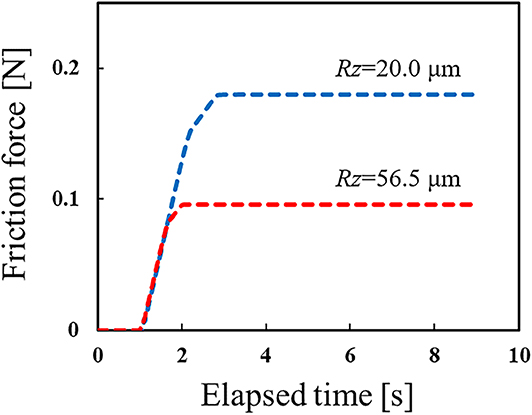
Figure 6. Variation of friction force on rubber hemisphere over time obtained by finite element analysis under two roughness conditions. Here, the vertical pressing displacement of the rubber hemisphere is 0.25 mm.
Figure 7 shows the relationship between the friction coefficient and normal stress at the bottom of the rubber hemisphere. Here, the friction coefficient was evaluated using the contact stresses at the center contact node. As can be seen from the figure, the pressure dependence of the friction coefficient is expressed even in the finite element model via the macroscale friction model, thereby reflecting the mesoscale condition.
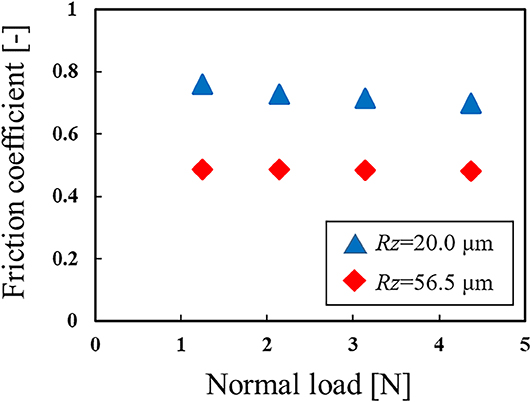
Figure 7. Relationship between the friction coefficient and normal stress at the bottom of the rubber hemisphere, obtained by finite element analysis.
Localization Analysis
In this section, the results of the mesoscale localization analysis are discussed using the histories of the normal stress and sliding velocity of arbitrary contact nodes obtained by the macroscale finite element analysis as boundary conditions. The model used here is the same as that used in the numerical friction test described in Section Numerical Friction Test.
Effect of Vertical Pressing Displacement
In this section, the effect of the vertical pressing displacement of the rubber hemisphere is described. Here, the surface roughness of the rubber was Rz = 20.0 μm, and the vertical pressing displacement was evaluated at two levels. The node at the bottom center of the hemisphere was used as the evaluation point. Figure 8A shows the variation in the normal stress and sliding velocity over time obtained by the finite element analysis. It is confirmed that the transition to gross sliding is delayed when the pressing displacement increases. Further, Figure 8B shows the results of the mesoscale analysis using the data in Figure 8A as input conditions; the graph shows the relationship between the frictional stress and the sliding displacement.
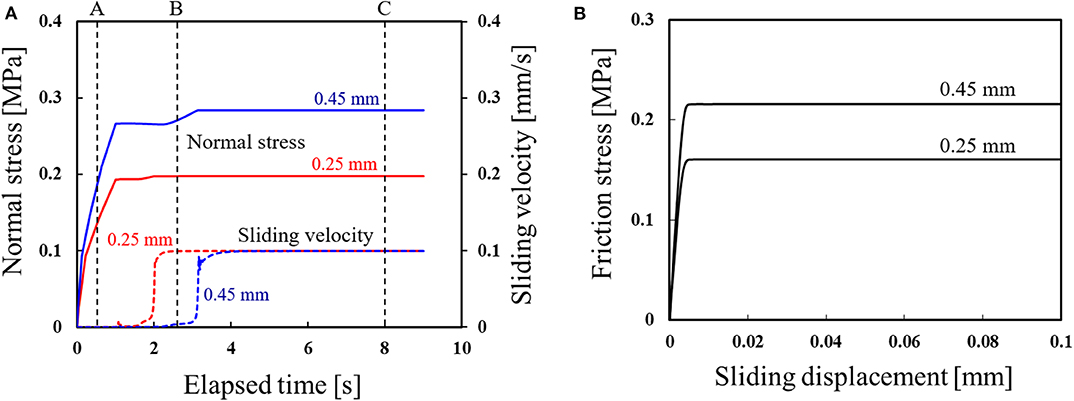
Figure 8. Results of a meso–macro coupled analysis of the effect of vertical pressing displacement, where the surface roughness of the rubber was Rz =20.0 μm: (A) History of the normal stress and sliding velocity obtained by the finite element analysis; (B) Localization analysis result of friction stress vs. sliding displacement.
Times A, B, and C in Figure 8A represent the characteristic states corresponding to the vertical pressing process, the transient process between stick and slip, and the steady state, respectively. Figures 9A,B show the results of the mesoscale analysis of the contact area when the pressing displacement is 0.25 and 0.45 mm, respectively. Here, the contour range shows the ratio of contact area when the area πβ2 is set to 1.0. From the result at time A, it is observed that the magnitude of the normal stress affects the distribution of the real contact area. In addition, when the pressing displacement is smaller, the distribution of the real contact area at time B already shows the same area as under the steady state at time C. Meanwhile, when the pressing displacement is larger, sliding has hardly occurred at time B. Thereafter, gross sliding occurs and the normal pressure increases, and at time C, the real contact area increases. Thus, by performing the localization analysis, the microscopic state can be examined, such as the variation in friction stress and real contact area corresponding to the macroscale finite element analysis.
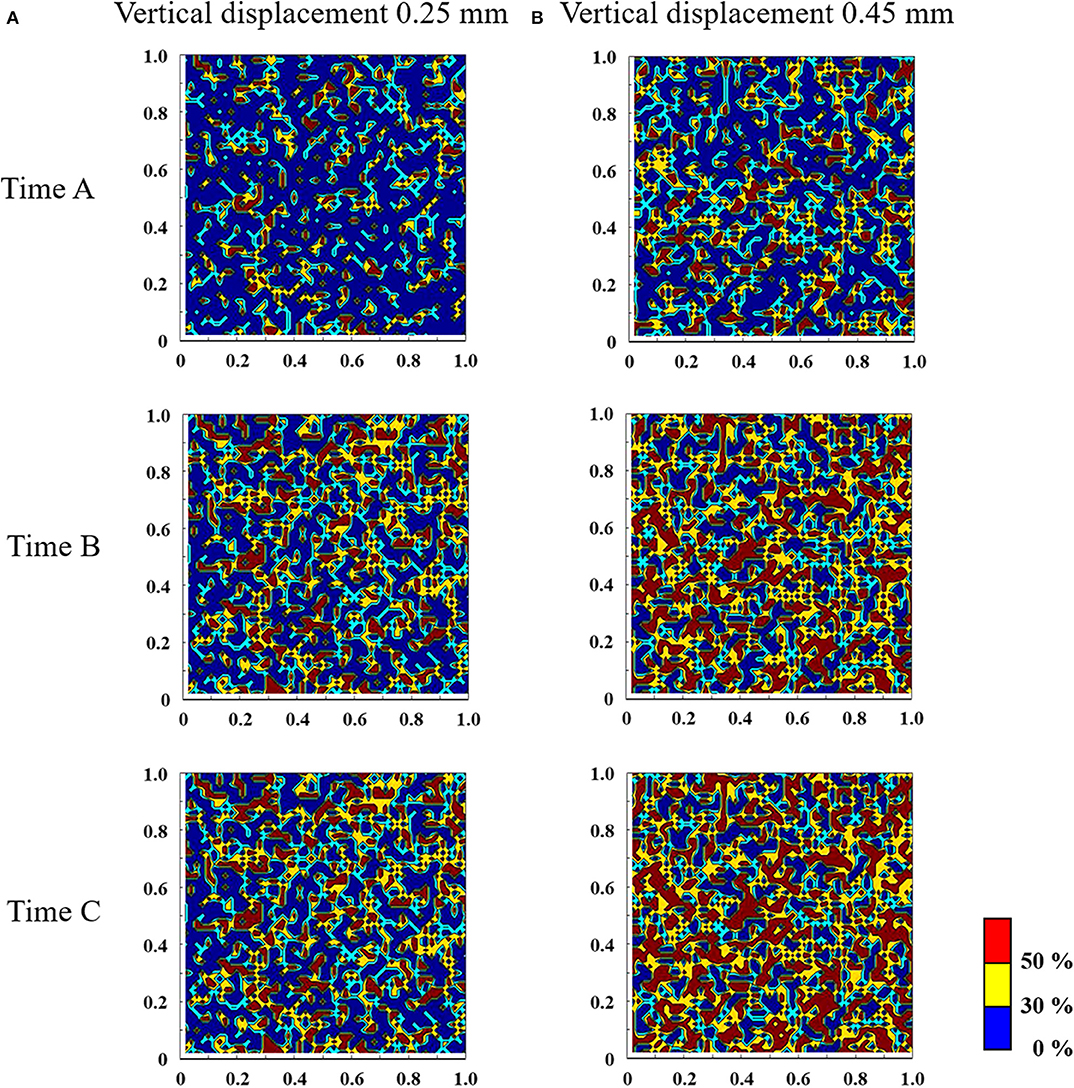
Figure 9. Results of a mesoscale analysis of the contact area, where the surface roughness of the rubber is Rz = 20.0 μm, the pressing displacements are (A) 0.25 mm and (B) 0.45 mm, and the analysis area is 1 × 1 mm.
Effect of Surface Roughness
Next, the effect of surface roughness is discussed. Here, the pressing displacement was 0.35 mm, and two levels of rubber surface roughness were adopted (Rz = 20.0 μm and 56.5 μm). The node at the bottom center of the hemisphere was used as the evaluation point. Figure 10A shows the variation in the normal stress and sliding velocity with elapsed time obtained by the finite element analysis. Figure 10B shows the results of the mesoscale analysis using the data in Figure 10A as input conditions. The graph shows the relationship between the frictional stress and sliding displacement. From these figures, it is confirmed that the surface roughness influences the stress and sliding.
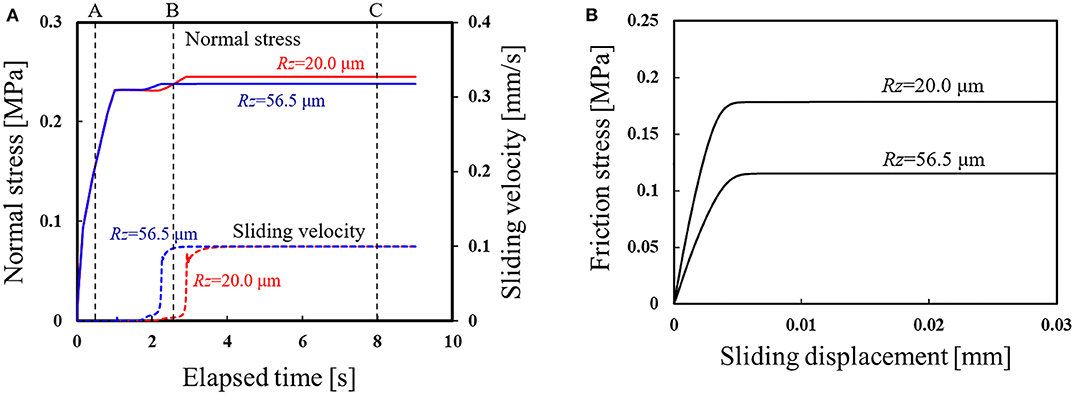
Figure 10. Results of a meso–macro coupled analysis of the effect of surface roughness, where the pressing displacement is 0.35 mm: (A) History of the normal stress and sliding velocity obtained by the finite element analysis; (B) Localization analysis results of friction stress vs. sliding displacement.
Figures 11A,B show the results of the mesoscale analysis of the contact area under conditions of Rz = 20.0 μm and 56.5 μm, respectively. Here, the contour range shows the ratio of contact area when the area πβ2 is set to be 1.0. The focused times are shown in Figure 10A. From time A to time B, it can be seen that the real contact area increases, and its rate of increase is affected by the surface roughness. In the steady state (time C), the smaller the surface roughness, the larger the real contact area for the same levels of normal stress. As a result, as shown in Figure 10B, it is assumed that the variation in friction stress with elapsed time is affected.
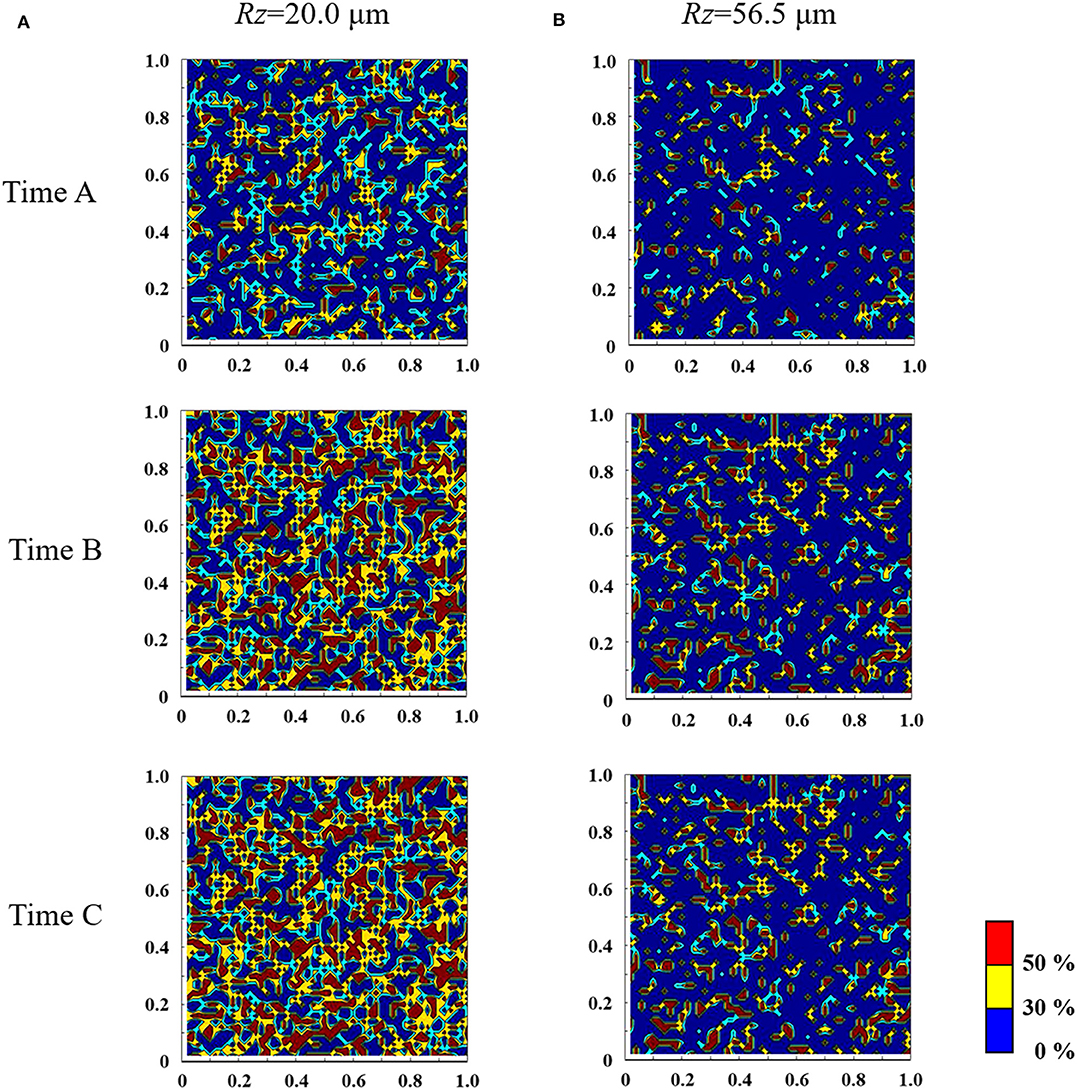
Figure 11. Results of a mesoscale analysis of the contact area, where the pressing displacement was 0.35 mm, the surface roughnesses are (A) Rz =20.0 μm and (B) Rz =56.5 μm, and the analysis area is 1 × 1 mm.
Effect of Contact Location
This section describes the effect of the location of evaluation points in the contact zone on the determined friction behavior. Figure 12A shows the finite element model of the rubber hemisphere viewed from directly below. In the localization analysis, nodes (i)–(iii) shown in the figure were used as evaluation points.
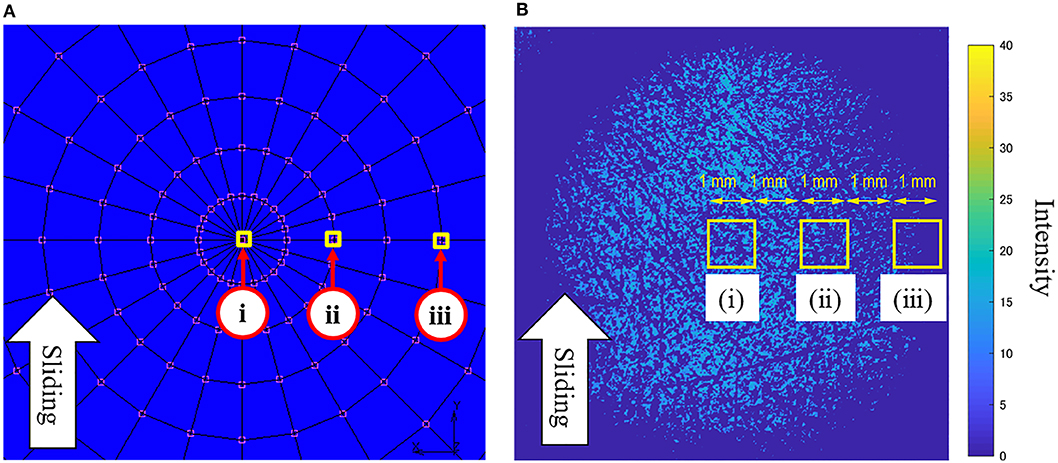
Figure 12. Evaluation points: (A) Multi-scale analysis; (B) Experiment (Normal load 3.8 N, Ra = 2.11 μm).
Figure 13A shows the variation in the normal stress and sliding velocity with elapsed time obtained by finite element analysis. Figure 13B shows the results of the mesoscale analysis using data in Figure 13A as input conditions. Here, the pressing displacement is 0.45 mm and the surface roughness is Rz = 20.0 μm. It can be seen in the figure that the normal stress at the bottom center [node (i)] is the largest, and the occurrence of gross sliding is the most delayed. In addition, it is confirmed that the normal stress decreases toward the outside of the contact area. The relationship between the friction stress and sliding displacement at the mesoscale also reflects the results of the finite element analysis and its boundary conditions. Thus, by using the proposed meso–macro coupled analysis method, it is possible to study the microscopic behavior according to the geometric conditions and contact conditions with a macroscale finite element analysis.
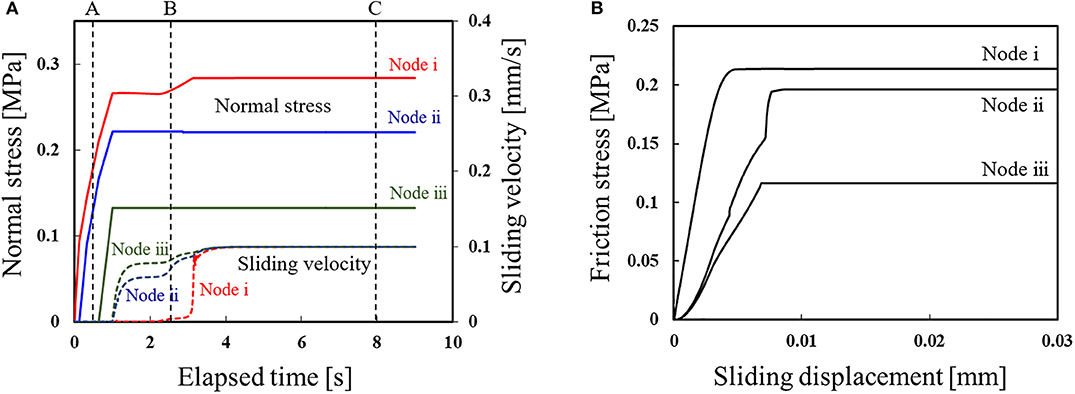
Figure 13. Results of a meso–macro coupled analysis of the effect of contact location. Here, the pressing displacement is 0.45 mm, and the surface roughness is Rz = 20.0 μm: (A) History of the normal stress and sliding velocity obtained by the finite element analysis; (B) Localization analysis results of friction stress vs. sliding displacement.
Finally, the distribution characteristics of the real contact area obtained by the proposed meso–macro coupled analysis are qualitatively compared with the results of an experiment. Figure 12B shows the real contact area using a method for visualizing real contact regions formed in the apparent contact zone (Maegawa et al., 2015). Note that the rubbing materials used in the referenced study were the same as those used in this study, but their roughness conditions were different. The contour map in the figure shows the reflected light intensity after image processing, in which the bright portions correspond to the areas of real contact.
Figures 14A,B show a visualization of the real contact area results in steady state sliding obtained by the proposed multiscale analysis and previous experiment, respectively, corresponding to regions (i), (ii), and (iii) in Figures 12A,B, respectively. Although a quantitative comparison is difficult because of the different roughness profiles, it is confirmed that the relationship between the contact position and roughness determined by analysis and experiment reasonably agree. In other words, the ratio of the real contact area to apparent contact area decreases as the surface becomes rougher and closer to the outside of the contact area. However, the results of the mesoscale localization analysis are averaged over the representative contact area, so the normal stress distribution is homogeneous. Therefore, please note that the gradient of the results according to the stress distribution within the representative contact area is not represented as shown for the experiment results.
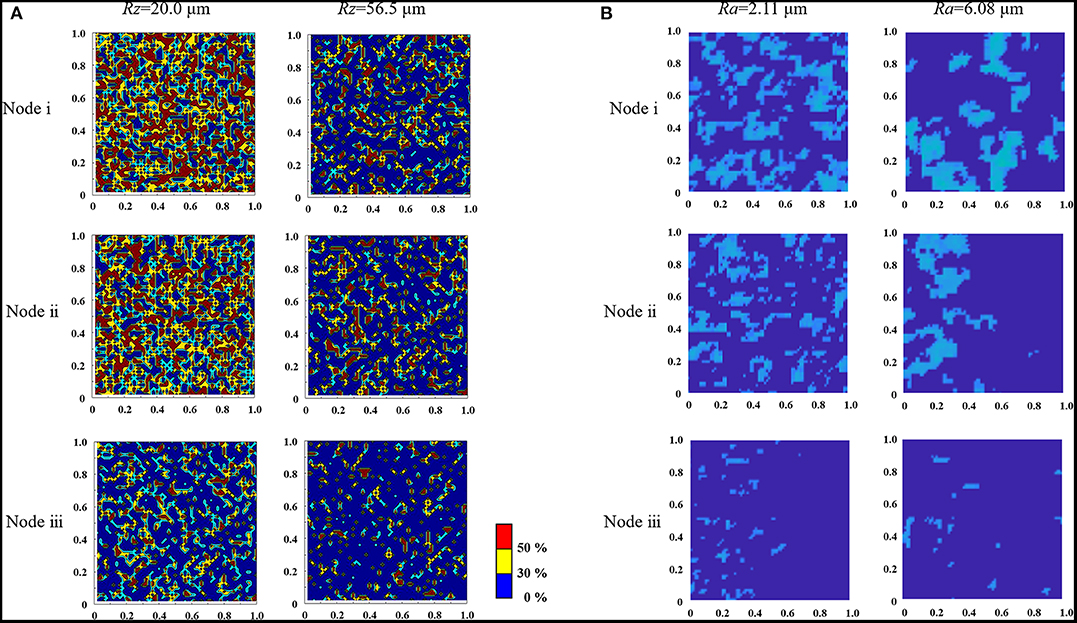
Figure 14. Results for the contact area obtained by (A) the mesoscale analysis and (B) the experiment, where the analysis area is 1 × 1 mm.
Conclusion
This study proposed a loop-type coupled analysis scheme to bridge the mesoscale and macroscale domains of friction analysis. Specifically, the mesoscale multipoint contact model was linked with the macroscale finite element analysis model via the rate-, state-, and pressure-dependent friction model previously proposed by the authors (Ozaki et al., 2020). Next, the proposed method was applied to a contact problem between a rough rubber hemisphere and a smooth rigid plate. Then, systematic analyses were conducted, including a qualitative comparison with the results of a previous experiment, and the effectiveness of the proposed method in providing multiscale understanding of frictional sliding phenomena was examined. The proposed method was observed to enable a finite element analysis that reflects the characteristics of roughness at the mesoscale. Moreover, the analysis of elementary mesoscale behavior corresponding to the finite element analysis under arbitrary geometric and contact conditions can be performed in converse. Note that although other mesoscale and macroscale friction models (laws) can be used in the proposed method, the ability of the macroscale model to describe the complex frictional sliding phenomena model is essential. Additionally, attention must be paid to how the representative contact area is determined in the proposed method, as the contact area must be of a size for which the stress distribution in the macroscale analysis can be considered sufficiently uniform. Please note that a full quantitative comparison with experimental results still remains necessary. Thus, the authors intend to adopt a more advanced mesoscale contact model and use an actual profile of contact roughness in this model to perform a quantitative verification of the proposed method in a future study.
Data Availability Statement
The datasets generated for this study are available on request to the corresponding author.
Author Contributions
SO and KM performed the numerical analysis and wrote the paper. SM conceived and designed the experiments and provided their detailed data. KN performed the conceptualization of mesoscale model.
Conflict of Interest
The authors declare that the research was conducted in the absence of any commercial or financial relationships that could be construed as a potential conflict of interest.
References
Binnig, G., Quate, C. F., and Gerber, C. (1986). Atomic force microscope. Phys. Rev. Lett. 56, 930–933. doi: 10.1103/PhysRevLett.56.930
Dieterich, J. H. (1972). Time-dependent friction in rocks. J. Geophys. Res. 77, 3690–3697. doi: 10.1029/JB077i020p03690
Dieterich, J. H. (1979). Modeling of rock friction: 1. Experimental results and constitutive equations. J. Geophys. Res. 84, 2161–2168. doi: 10.1029/JB084iB05p02161
Fuller, K. N. G., and Tabor, D. (1975). The effect of surface roughness on the adhesion of elastic solids. Proc. R. Soc. Lond. A 345, 327–342. doi: 10.1098/rspa.1975.0138
Greenwood, J. A., and Williamson, J. B. P. (1966). Contact of nominally flat surface. Proc. R. Soc. Lond. A295, 300–319. doi: 10.1098/rspa.1966.0242
Hashiguchi, K., and Ozaki, S. (2008). Constitutive equation for friction with transition from static to kinetic friction and recovery of static friction. Int. J. Plasticity. 24, 2102–2124. doi: 10.1016/j.ijplas.2008.03.004
Hyun, S., Pei, L., Molinari, J.-F., and Robbins, M. O. (2004). Finite-element analysis of contact between elastic self-affine surfaces. Phys. Rev. E 70:026117. doi: 10.1103/PhysRevE.70.026117
Johnson, K. L., Greenwood, J. A., and Higginson, J. G. (1985). The contact of elastic regular wavy surfaces. Int. J. Mech. Sci. 27, 383–396. doi: 10.1016/0020-7403(85)90029-3
Kikuchi, N., and Oden, J. T. (1988). Contact Problem in Elasticity: A Study of Variational Inequalities and Finite Element Methods. Philadelphia, PA: SIAM.
Laursen, T. A. (2001). Computational Contact and Impact Mechanics: Fundamentals of Modeling International Phenomena in Nonlinear Finite Element Analysis. Berlin; Heidelberg: Springer-Verlag.
Maegawa, S., Itoigawa, F., and Nakamura, T. (2015). Effect of normal load on friction coefficient for sliding contact between rough rubber surface and rigid smooth plane. Tribol. Int. 92, 335–343. doi: 10.1016/j.triboint.2015.07.014
Manners, W. (2000). Pressure required to flatten an elastic random rough profile. Int. J. Mech. Sci. 42, 2321–2336. doi: 10.1016/S0020-7403(99)00098-3
Ozaki, S., and Hashiguchi, K. (2010). Numerical analysis of stick-slip instability by a rate-dependent elastoplastic formulation for friction. Tribol. Int. 43, 2120–2133. doi: 10.1016/j.triboint.2010.06.007
Ozaki, S., Hikida, K., and Hashiguchi, K. (2012). Elastoplastic formulation for friction with orthotropic anisotropy and rotational hardening. Int. J. Solids Struct. 49, 648–657. doi: 10.1016/j.ijsolstr.2011.11.010
Ozaki, S., Ito, C., and Hashiguchi, K. (2013). Experimental verification of rate-dependent elastoplastic analogy friction model and its application to FE analysis. Tribol. Int. 64, 164–177. doi: 10.1016/j.triboint.2013.03.016
Ozaki, S., Matsuura, T., and Maegawa, S. (2020). Rate-, state-, and pressure-dependent friction model based on the elastoplastic theory. Friction 1–16. doi: 10.1007/s40544-019-0321-3
Persson, B. N. J. (2001). Theory of rubber friction and contact mechanics. J. Chem. Phys. 115, 3840–3861. doi: 10.1063/1.1388626
Persson, B. N. J., Bucher, F., and Chiaia, B. (2002). Elastic contact between randomly rough surfaces: comparison of theory with numerical results. Phys. Rev. B 65:184106. doi: 10.1103/PhysRevB.65.184106
Persson, B. N. J., and Volokitin, A. I. (2006). Rubber friction on smooth surfaces. Eur. Phys. J. E 21, 69–80. doi: 10.1140/epje/i2006-10045-9
Roberts, A. D. (1992). A guide to estimating the friction of rubber. Rubber Chem. Technol. 65, 673–686. doi: 10.5254/1.3538633
Roberts, A. D., and Thomas, A. G. (1975). The adhesion and friction of smooth surfaces. Wear 33, 45–64. doi: 10.1016/0043-1648(75)90223-9
Ruina, A. L. (1983). Slip instability and state variable friction laws. J. Geophys. Res. 88, 359–370. doi: 10.1029/JB088iB12p10359
Tabor, D. (1960). Hysteresis losses in the friction of lubricated rubber. Rubber Chem. Technol. 33, 142–150. doi: 10.5254/1.3542120
Watanabe, I., and Terada, K. (2010). A method of predicting macroscopic yield strength of polycrystalline metals subjected to plastic forming by micro-macro de-coupling scheme. Int. J. Mech. Sci. 52, 343–355. doi: 10.1016/j.ijmecsci.2009.10.006
Keywords: multiscale analysis, real contact area, roughness, friction model, FEM
Citation: Ozaki S, Mieda K, Maegawa S and Nakano K (2020) Meso–Macro Coupled Analysis of Pressure-Dependent Friction of Rubber. Front. Mech. Eng. 6:24. doi: 10.3389/fmech.2020.00024
Received: 16 March 2020; Accepted: 15 April 2020;
Published: 06 May 2020.
Edited by:
Valentin L. Popov, Technical University of Berlin, GermanyReviewed by:
Varvara Romanova, Institute of Strength Physics and Materials Science (ISPMS SB RAS), RussiaFrancesco Massi, Sapienza University of Rome, Italy
Copyright © 2020 Ozaki, Mieda, Maegawa and Nakano. This is an open-access article distributed under the terms of the Creative Commons Attribution License (CC BY). The use, distribution or reproduction in other forums is permitted, provided the original author(s) and the copyright owner(s) are credited and that the original publication in this journal is cited, in accordance with accepted academic practice. No use, distribution or reproduction is permitted which does not comply with these terms.
*Correspondence: Shingo Ozaki, cy1vemFraUB5bnUuYWMuanA=