 Varvara Romanova
 Ekaterina Dymnich
 Ruslan Balokhonov
 Olga Zinovieva
- Institute of Strength Physics and Materials Science, Siberian Branch of the Russian Academy of Sciences, Tomsk, Russia
The mechanical aspects of deformation-induced surface roughening inherent in microstructural inhomogeneity are studied numerically using single inclusion models. Three-dimensional finite-element calculations of uniaxial tension are performed for a set of single inclusion models where a cubic-shaped inclusion is embedded into a homogeneous matrix. The inclusion-to-surface distance, tilt angle about the axis of tension, and the ratio between the matrix and inclusion elastic-plastic properties are varied in different combinations to study the effects which these parameters have on the development of out-of-plane surface displacements under uniaxial tension. It has been shown that all stress and strain tensor components in the vicinity of inclusions take on non-zero values, including those directed across the load axis. Thus, the free surface becomes rough under the action of internal forces originated from the inhomogeneous stress-strain fields. Some illustrative examples of surface roughening under uniaxial tension are shown for multiple ellipsoidal inclusions periodically arranged in a subsurface layer of an elastic-plastic material.
Introduction
Deformation-induced surface roughening is a common feature for many materials (Raabe et al., 2003; Stoudt et al., 2011; Yoshida, 2014; Shi et al., 2017; Ma et al., 2019a,b). Being flat in the undeformed state, the material free surface roughens under deformation in the absence of external forces applied across its plane. Generally, roughening develops throughout all length scales from micro to macro (Anongba et al., 1993; Raabe et al., 2003) with roughness characteristics depending on many factors (crystal lattice, grain size and shape, texture, interface geometry, loading conditions, mechanical properties, etc.) (Raabe et al., 2003; Stoudt et al., 2011; Yoshida, 2014; Shi et al., 2017; Ma et al., 2019a,b; Solhjoo et al., 2020).
For the most part, deformation-induced roughening is thought to be undesirable feature impairing cosmetic and functional material properties, such as reflectivity, lubricant transport, wear resistance, yield strength and the like (Raabe et al., 2003; Stoudt et al., 2011; Yoshida, 2014; Shi et al., 2017; Ma et al., 2019a,b; Cinat et al., 2020; Joe et al., 2020; Ozaki et al., 2020).
On the other hand, the roughness pattern can be used for non-destructive testing of the material stress-strain state. In our recent studies (Romanova et al., 2017a, 2019, 2020), we gave a special consideration to the mesoscale processes where roughness patterns were formed by grain groups involved in cooperative out-of-plane surface displacements. Experimental and numerical results obtained for a titanium alloy (Romanova et al., 2017a, 2019, 2020) suggested us that it is the mesoscale roughness which might be used as an early precursor of macroscale plastic strain localization and fracture.
In tribological applications, surface roughening acquires a special significance. Being one of essential factors influencing friction and adhesion [see, e.g., Popov and Li, 2018; Popov et al. (2017)], this phenomenon can be treated as positive or negative effect depending on the requirements to operative conditions. A comprehensive review of the related phenomena is provided by Popov (2010). Along with other methods to control adhesion and friction behavior (see, e.g., Popov and Li, 2018), the idea of controllable deformation-induced surface roughening sounds attractive.
The development of efficient methods to suppress or control deformation-induced surface roughening requires a deep understanding of the roughening mechanisms operative at different scales. While abundant experimental evidence has been produced and numerous theoretical studies have been performed, the problem of identifying the mechanisms involved and the factors responsible for the surface roughening in plastically deformed materials is the subject of considerable controversy and further investigations along these lines are clearly necessary.
Experimental and numerical studies have shown that it is structural inhomogeneity which is responsible for free surface roughening in the absence of external forces. Classical mechanics considering a homogeneous solid fails to provide an adequate description of this event. On a flat free surface of a homogeneous material there are no stresses likely to cause out-of-plane displacements. It is, therefore, reasonable to describe the related phenomena in terms of micro- and mesomechanics where material microstructure is taken into account.
In our earlier studies of micro- and mesoscale deformation-induced surface roughening in polycrystalline and coated materials (Romanova et al., 2017a,b, 2019, 2020), three-dimensional finite difference and finite element calculations were performed for microstructural models with realistic morphological features. The calculation results well-agreed with the experimental evidence and provided new insights into the roughening mechanisms, but the amount of the information gained with the use of the complex models was too vast and nearly as difficult to analyze as the data obtained from real experiments. Therefore, it is thought to be reasonable to examine the roughening mechanisms using simplified models to avoid the effect of the set of parameters used in the complex models. In this contribution, the mechanical aspects of deformation-induced surface roughening under uniaxial tension are studied numerically, using single inclusion models. While a large number of papers offer analytical and numerical solutions to a single inclusion mechanical problem (see, e.g., Eshelby, 1959; Mori and Tanaka, 1973), the discussion of the related free surface out-of-plane displacements has but a little attention.
In this paper, out-of-plane surface displacements developing in a homogeneous material under uniaxial tension in the presence of a cubic-shaped inclusion in a subsurface layer are studied numerically. The inclusion orientation and position and the matrix and inclusion mechanical properties are varied in different combinations to study the effects which these parameters have on the surface geometrical characteristics. Some calculation results are presented for deformation-induced roughening in a multiple inclusion model where ellipsoidal inclusions are arranged in a subsurface layer in a regular manner.
Simulation of Surface Roughening in Single Inclusion Models
Geometry, Constitutive Description, and Loading Conditions
Three-dimensional calculations for uniaxial tension were performed for a set of single inclusion models where a cubic-shaped inclusion was embedded into a homogeneous matrix in a subsurface layer. The inclusion-to-surface distance, inclusion tilt angle about the axis of tension, and the ratio between the matrix and inclusion elastic-plastic properties were varied in different combinations to investigate their effects on the free surface out-of-planeness.
Six representative geometrical models with the inclusions tilted at an angle of 0, 22, and 45 degrees about the axis of tension are shown in Figure 1. The depth of the inclusion position below the free surface was varied from 0 (Figures 1A–C) to a value equal to the inclusion linear size (Figures 1D–F). The models measuring 400 × 200 × 400 μm were approximated by tetrahedron finite-element meshes.
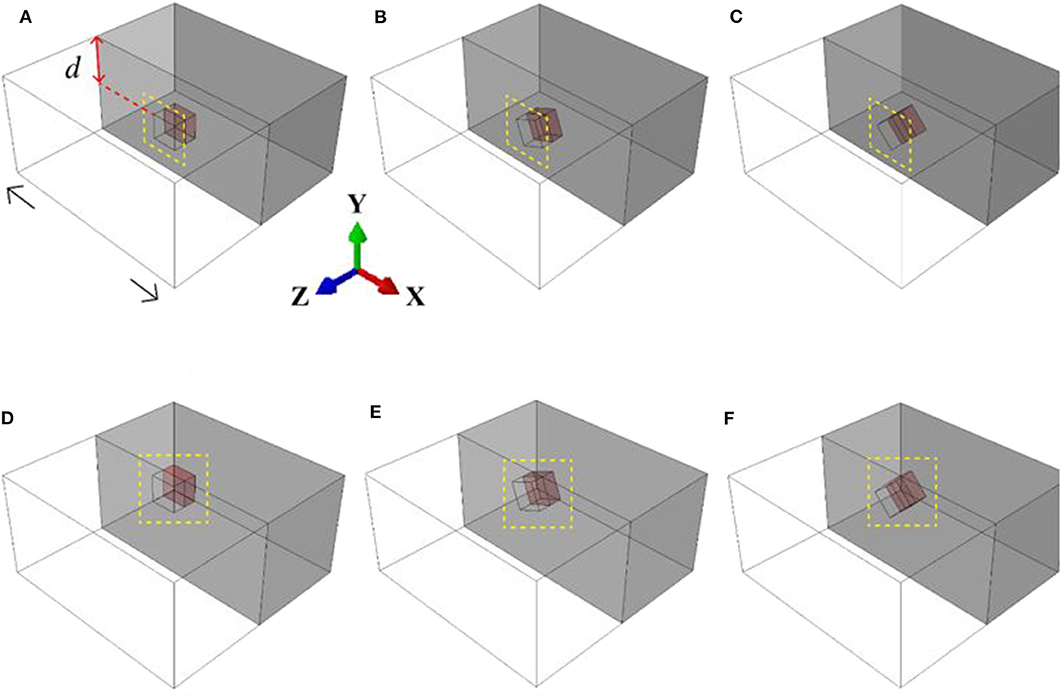
Figure 1. Geometrical models of cubic-shaped single inclusions tilted at an angle of 0 (A,D), 22 (B,E), and 45 degrees (C,F) about the load axis and positioned at different depth d below the surface.
Calculations were performed for two sets of the matrix and inclusion properties. In the first case referred to as a hard inclusion model the matrix was aluminum and inclusion was ceramic. In the second case referred to as a soft inclusion model the inclusion was aluminum and the matrix was ceramic. The elastic-plastic model with a linear strain hardening was used to describe the constitutive behavior of the aluminum alloy. Ceramics was calculated in terms of elasticity. A perfect mechanical contact at the matrix-inclusion interface was kept throughout the entire loading process. The material constants applied in the calculations are given in Table 1.
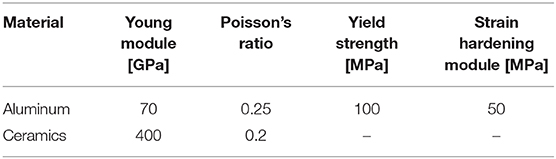
Table 1. Material constants used in the calculations.
Three-dimensional boundary-value problems in a quasistatic formulation were solved numerically by the finite element method using ABAQUS/Standard (Dassault Systèmes Simulia, 2011). The boundary conditions in all calculations were set to simulate uniaxial tension along the X-axis, as shown schematically in Figure 1D. For doing so, the displacements were assigned in the nodal points of the two opposite faces perpendicular to the X-axis to reach 1% tensile strain. This degree of strain is reasonable to study the mechanical factors responsible for the roughness formation. The other two lateral faces and the top surface, which was the main object of our interest, were free of external forces, and the bottom surface was taken to be a symmetry plane about the Y-direction.
Stress and Strain Fields
In order to identify the mechanisms of deformation-induced surface roughening in single inclusion models, let us analyze the relationship between the processes operative on the free surface and in the bulk of the material. For the sake of illustration, calculation results are presented for six models where inclusions are positioned near the surface (Figures 1A–C) and at a distance below the surface (Figures 1D–F), with the general conclusion being supported by the whole set of numerical data including intermediate inclusion positions. For each geometrical model, the mechanical properties were assigned in two combinations: the elastic inclusion - elastic-plastic matrix and vice versa.
The stress and equivalent plastic strain fields developing in the vicinity of hard inclusions embedded in the elastic-plastic matrices are presented in Figures 2, 3 for the regions bordered by dashed lines in Figure 1. Similar results for elastic-plastic inclusions embedded in the elastic matrix are given in Figures 4, 5.
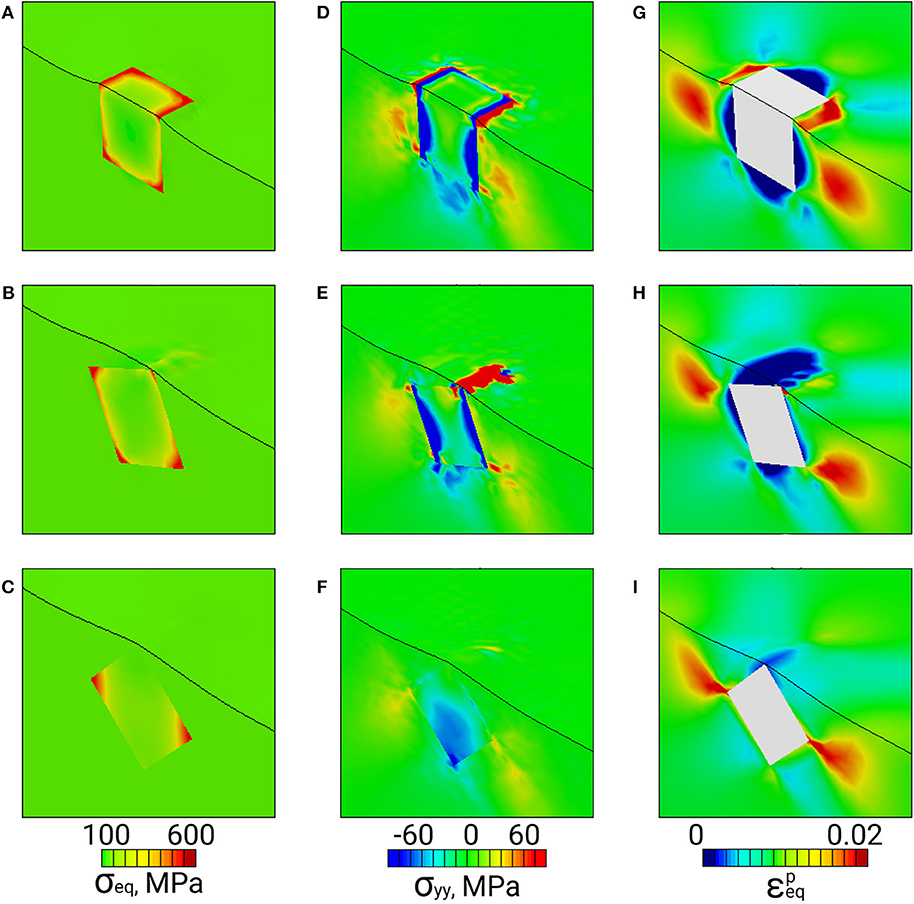
Figure 2. Von Mises stress (A–C), normal stress σyy (D–F), and equivalent plastic strain fields (G–I) in the vicinity of a hard inclusion positioned in an elastic-plastic matrix near the surface (dash-bordered regions in Figures 1A–C).
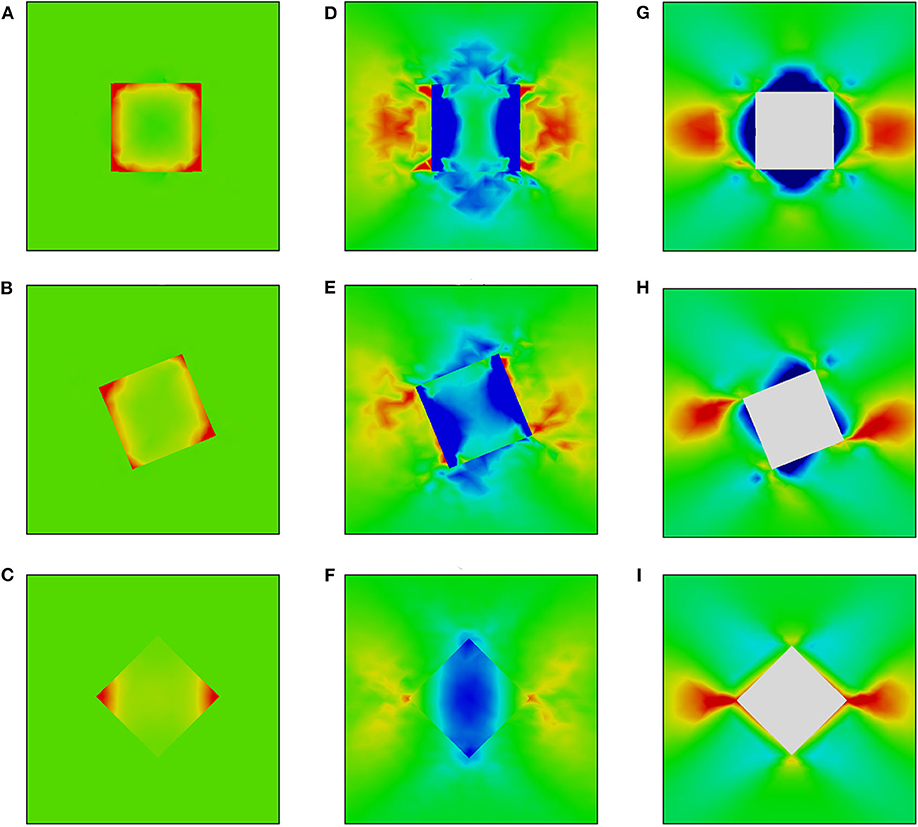
Figure 3. Von Mises stress (A–C), σyy (D–F), and equivalent plastic strain fields (G–I) in the vicinity of a hard inclusion embedded in an elastic-plastic matrix at a distance below the surface (dash-bordered regions in Figures 1D–F). Color legends are given in Figure 2.
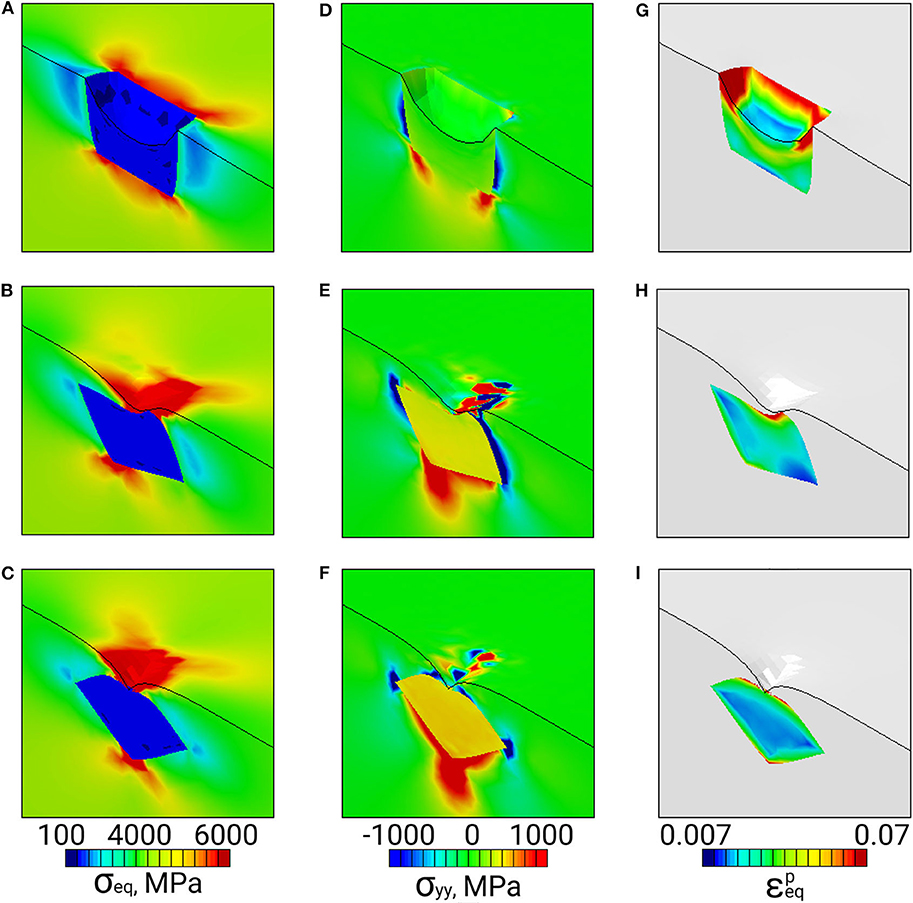
Figure 4. Von Mises stress (A–C), normal stress σyy (D–F), and equivalent plastic strain fields (G–I) in the vicinity of a soft inclusion positioned in an elastic matrix near the surface (dash-bordered regions in Figures 1A–C).
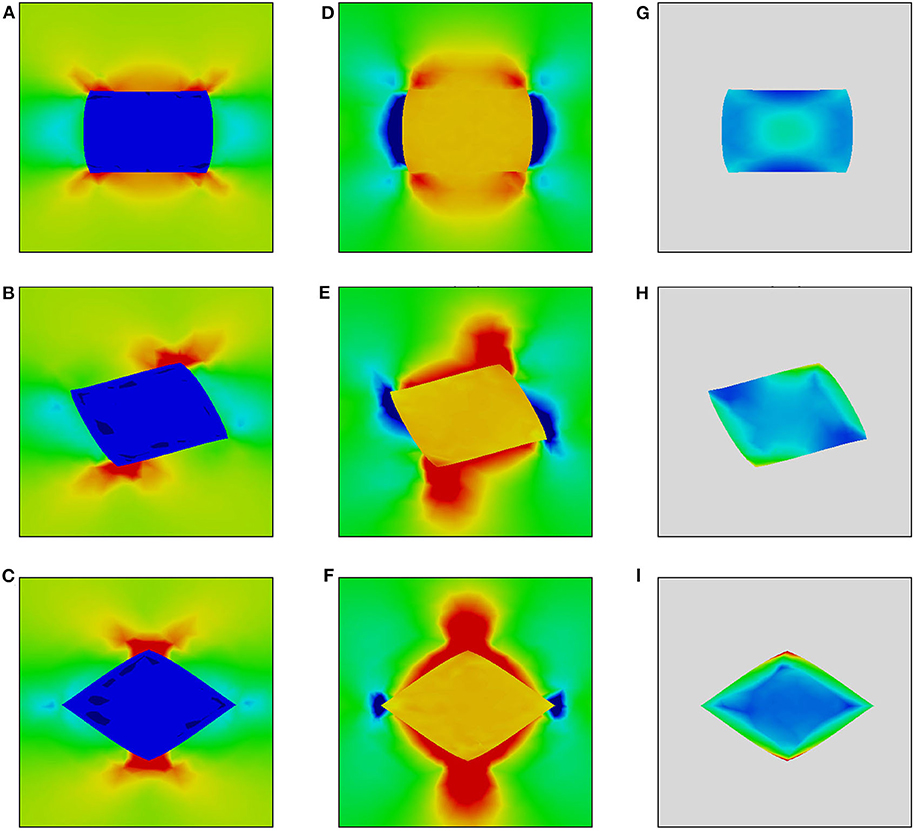
Figure 5. Von Mises stress (A–C), normal stress σyy (D–F), and equivalent plastic strain fields (G–I) in the vicinity of a soft inclusion embedded in an elastic matrix at a distance below the surface (dash-bordered regions in Figures 1D–F). Color legends are given in Figure 4.
Inside the hard inclusions, the von Mises stress exhibits strong inhomogeneity with the highest values developing near the inclusion boundaries (Figures 2A–C, 3A–C). Correspondingly, the elastic-plastic matrix demonstrates strain localization near the matrix-inclusion interfaces (Figures 2G–I, 3G–I). Common features of plastic strain fields in the vicinity of the inclusions are the appearance of cross-shaped regions of lower strains (blue-colored regions) and spherically-shaped regions of higher strains (red-colored regions) where the strains deviate from the average strain level (green-colored regions in Figures 2G–I, 3G–I). While the position of the low and high strain localization regions is mainly controlled by the loading conditions, the strain values in the interfacial regions are affected by the inclusion orientations. The most pronounced stress concentration develops in the inclusions with faces parallel to the axis of tension (Figures 3A, 4A) which have a higher ability to resist deformation. Accordingly, extensive regions of low plastic strains are formed in the matrix near the inclusion faces (Figures 2G–I, 3G–I). At a short distance from the faces perpendicular to the axis of tension, the regions of high plastic strains are formed to compensate the low strains in the interfacial regions. Different plastic strain pattern is formed in the vicinity of the inclusions whose faces are tilted at an angle of 45 degrees to the load axis where high plastic strains localize along the whole matrix-inclusion interface (Figures 2I, 3I).
In the soft inclusion models (Figures 4, 5), the von Mises stresses developing in the elastically deformed matrix take on the highest values near the inclusion top and bottom boundaries and low values in the regions symmetrical about the inclusion vertical centerlines (Figures 4A–C, 5A–C). In the plastically deformed inclusions, the strains mainly localize near boundaries; the plastic strain patterns are controlled by the inclusion orientation relative to the axis of tension. It is a common tendency for all orientations that the inclusions positioned close to the surface exhibit higher strains than those located at a distance (cf. Figures 4G–I, 5G–I). It is interesting to note that the inclusion whose faces are parallel to the load axis demonstrates less pronounced localization among all models when it is positioned at a distance from the surface (Figure 5G) and the highest strain level when it is exposed on the surface (Figure 4G).
The calculation results exemplify the fact that it is the material inhomogeneity which is responsible for the surface out-of-plane displacements. From the mechanical viewpoint, in a homogeneous material subjected to uniaxial tension, all components of the stress and strain tensors are equal zero except for those associated with the load direction. In this case, the free surface undergoes uniform deformation along the loading axis and remains flat throughout the entire loading process. The material inhomogeneity, however, gives rise to a complex stress-strain state with all stress and strain tensor components being non-zero in the near-interface regions.
Out-of-Plane Surface Displacements
From the viewpoint of surface roughening, particular attention should be paid to the stress tensor components associated with the direction normal to the free surface (hereinafter referred to as normal stresses). The normal stress fields σyy are shown in Figures 2D–F, 3D–F for the hard inclusion models and in Figures 4D–F, 5D–F for the soft inclusion models. Again, these stresses in the case of a homogeneous isotropic material must be zero due to the absence of external forces directed normal to the surface. Due to the presence of inclusions, the normal stresses take on non-zero values near the matrix-inclusion interfaces with the positive and negative stress regions bordering each other. The negative normal stresses develop inside the hard inclusions and in the matrix above and below the inclusion boundaries to resist compression across the load direction (Figures 3D–F). As dictated by the stress equilibrium condition, the regions of positive normal stresses are formed in the matrix symmetrically about the inclusion vertical centerline. The positive and negative stresses compensate each other so that the average normal stress values are zero. A similar conclusion is held for the soft inclusion models with the positive and negative normal stress regions reversing their positions (Figures 4D–F, 5D–F). The stresses σyy are associated with the forces directed normal to the free surface. Acting from the inside, these forces give rise to the out-of-plane surface displacements in the form of the humps above the hard inclusion (Figures 6A–C) and dimples above the soft inclusion (Figures 6D–F). These conclusions are supported experimentally. For instance, Solhjoo et al. (2020) have reported formation of surface humps in a stainless steel under uniaxial tension due to the presence of hard particles in a subsurface layer.
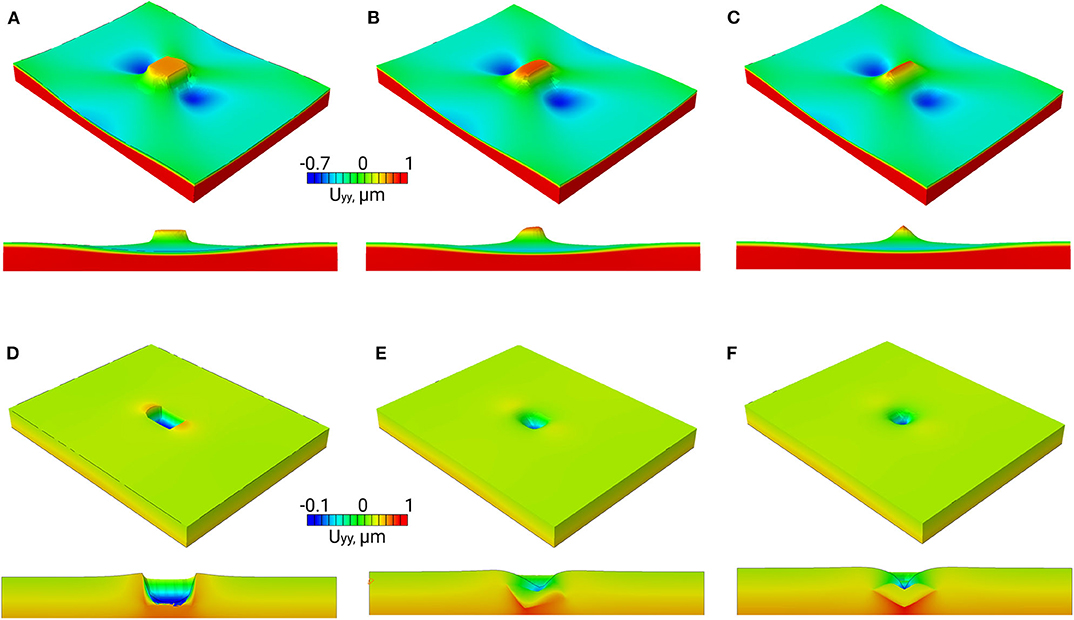
Figure 6. Normal surface displacements in the hard (A–C) and soft inclusion models (D–F) shown in Figures 1A–C at 1% tensile strain.
In correspondence with the stress and strain patterns, the surface undulations are affected by the inclusion geometry, position below the surface and mechanical properties of the matrix and inclusion. Let us evaluate the effects which these parameters have on the surface displacement fields in the models with hard and soft inclusions (Figure 6). In both cases, the tilt angle of inclusions positioned below the surface at a distance equal or longer than the inclusion linear size has no significant impact on the shape and height of the surface humps and valleys. Contrastingly, calculation results for the inclusions located close to the free surface reveal a profound effect of the inclusion orientation on the surface roughness characteristics. The hard and soft inclusions with edges parallel to the free surface give rise to the formation of rectangular-shaped humps (Figure 6A) and dimples (Figure 6D), respectively. When the inclusions are tilted at an angle of 22 degrees about the loading axis, the hump and dimple shapes become asymmetric (Figures 6B,E). The sharpest humps and dimples are caused by the inclusions tilted at an angle of 45 degrees about the loading axis (Figures 6C,F).
Figure 7 demonstrates a combined effect of the inclusion orientation and inclusion-to-surface distance on the surface humps and dimples. In these plots, the height, depth, and inclusion-to-surface distance values are normalized to their largest values. A common tendency for all models is that the heights and depths of the humps and dimples non-linearly increase with decreasing the inclusion-to-surface distance, which is judged from the curves plotted in Figure 7. It is interesting to note that the curves for hard inclusions demonstrate a specific behavior within a narrow subsurface region (Figure 7A). Particularly, an inverse dependence of the hump height on the inclusion-to-surface distance is observed for the inclusions with faces parallel to or tilted at an angle of 22 degrees about the load axis and a horizontal portion for that oriented at 45 degrees. In order to explain the mechanical cause of this non-linear behavior, let us analyze the normal stress fields in the vicinity of the inclusion top parts (Figures 3D–F). The non-zero normal stress regions formed in the matrix above the inclusion top strongly depend on the inclusion orientations. The larger the inclusion tilt angle about the loading axis, the wider the matrix region exhibiting negative normal stresses. The smallest region of compressive normal stresses is formed near the top of the inclusion whose faces are tilted at an angle of 45 degrees to the load axis (Figure 3F). As the inclusion moves close to the surface, the out-of-plane surface displacements become higher until the region of non-zero normal stresses reaches the surface. At a shorter distance, the stress concentration area is partially terminated by the surface and the humps are getting smaller.
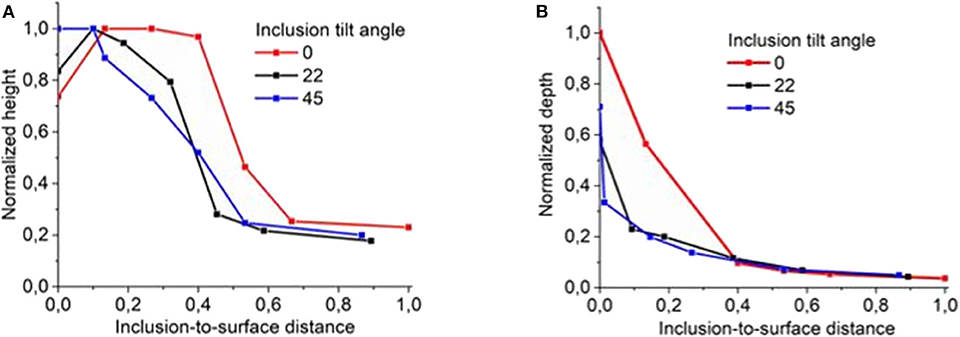
Figure 7. Normalized heights (A) and depths (B) of the surface humps and dimples vs. inclusion orientations and positions d below the surface.
Deformation-Induced Surface Roughening in the Presence of Multiple Inclusions in a Subsurface Layer
While the stresses acting across the free surface are much lower than those associated with the load direction and, correspondingly, the out-of-plane surface displacements are much smaller than the displacements in the direction of tension, the deformation-induced surface roughness is thought to be a useful characteristic for evaluating the material stress-strain state. In contrast to calculating the stress and strain fields from the in-plane surface displacements or using methods of indirect estimations (e.g., measurements of dislocation density, X-ray diffraction, etc.), the out-of-plane surface displacements are a measurable quantity which can be directly compared with the reference (undeformed) surface configuration.
As an example, calculations for deformation-induced surface roughening in the presence of multiple hard inclusions in a subsurface layer are presented in this section. The geometrical model measuring 2 × 1 × 2 mm with ellipsoidal inclusions in a subsurface layer is shown in Figure 8A. The major and minor axes of the inclusions are 0.26 and 0.13 mm, respectively. The inclusions are arranged in a periodical manner at a depth of 0.11 mm below the surface. The shortest distance between inclusions is 0.37 mm, which reduces their interinfluence to a minimum. Thus, the roughness is not affected by the inclusion interaction but controlled by their individual contributions. The model is approximated by a regular 200 × 100 × 200 mesh with hexahedral elements. The matrix and inclusions are assigned aluminum and ceramic properties, respectively; the material constants are given in Table 1. The boundary conditions are set in a similar way as for the single inclusion models to simulate uniaxial tension along the X-axis up to a strain of 20% to examine the roughness evolution in a wide range of plastic strains.
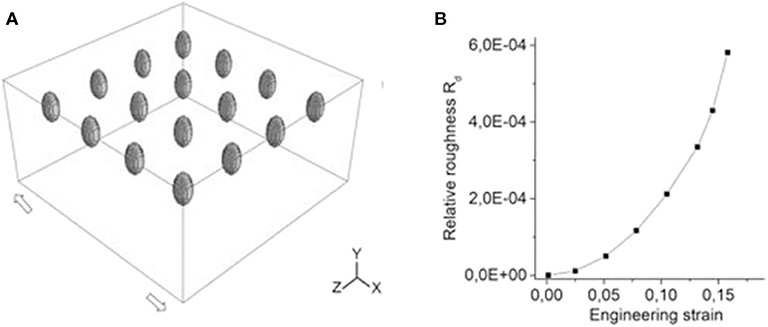
Figure 8. Model with ellipsoidal inclusions (A) and the strain-dependent roughness curve (B).
Similar to the case of single inclusions, all components of the stress and strain tensors are inhomogeneous, with the highest non-zero values taking place in the interfacial regions. The surface roughness develops in the form of periodically arranged extruded and intruded regions (Figure 9A) and, correspondingly, plastic strain localizes in periodical bands going across the surface perpendicular to the axis of tension (Figure 9B).
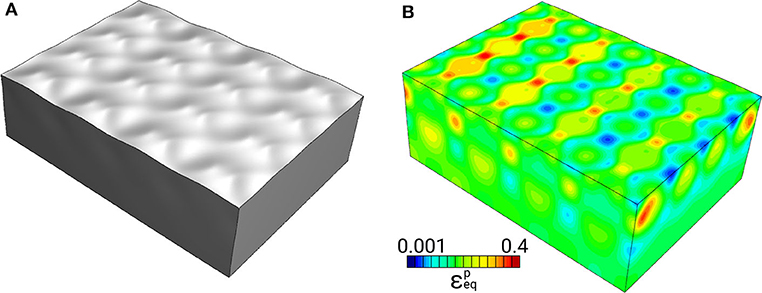
Figure 9. Roughness pattern (A) and plastic strain field (B) in the model shown in Figure 8A at 20% tensile strain.
Let us estimate the roughness evolution in terms of a dimensionless roughness parameter proposed in Romanova et al. (2017a, 2019) to quantify surface roughening in plastically deformed materials. By analogy with the strain quantification, the dimensionless roughness Rd is calculated as
where Lr is the rough profile length and Le is the profile evaluation length. Expressed in this way, the roughness parameter is clearly interpreted: the larger is the Rd value, the rougher is the surface and the more inhomogeneous are the stress and strain fields developing in the material. Note again, in an idealized case of a homogeneous isotropic material subjected to uniaxial tension, the material free surface remains flat as long as no external forces act perpendicular to the tensile axis. In real materials, the displacement fields, inhomogeneous due to the present microstructure, give rise to the formation of rough patterns on the material free surface. Thus, the dimensionless parameter Rd shows to which extent the material is deformed in comparison with an ideal homogeneous material and can be treated as a relative roughness characteristic.
The dimensionless roughness parameter was calculated for a set of surface profiles measured along the model centerline in the range of tensile strains up to 20%. The strain-dependent roughness curve plotted in Figure 8B demonstrates non-linear growth in the course of plastic deformation, which agrees with previous experimental and numerical results obtained in (Romanova et al., 2017a, 2019, 2020). The dimensionless roughness parameter estimated for roughness profiles in plastically-deformed titanium alloy appeared to be rather sensitive to the local plastic straining. What is more important, the Rd value grew non-linearly with the degree of plastic deformation in contrast to the commonly used roughness characteristics linearly dependent on the strain value. Thus, the Rd estimations would be promising tool for non-destructive material testing.
Conclusion
The mechanical cause of deformation-induced surface roughening under uniaxial tension has been analyzed numerically using single inclusion models. The effects of the inclusion orientation, position below the surface, and the matrix and inclusion elastic-plastic properties on the out-of-plane surface displacements were studied under uniaxial tension.
It has been shown that all stress and strain tensor components take on non-zero values in the vicinity of inclusions, including those directed across the load axis. Under the action of internal forces originated from the inhomogeneous stress-strain fields, the free surface becomes rough with humps and dimples formed above the hard and soft inclusions, respectively. The height of the surface undulations is affected by the inclusion-to-surface distance while their shape (extrusion or intrusion) is controlled by the inclusion-to-matrix mechanical property ratio.
The roughness evolution in a multiple inclusion model was analyzed in terms of relative roughness estimations. It was found that the dimensionless roughness parameter calculated for the multiple inclusion model non-linearly increases in the course of plastic deformation, which agrees with earlier estimations for polycrystalline and coated materials.
Data Availability Statement
The original contributions presented in the study are included in the article/supplementary material, further inquiries can be directed to the corresponding author/s.
Author Contributions
VR wrote the first draft of the manuscript, performed calculations for multiple inclusions, and analyzed roughness. ED carried out calculations for single inclusions and analyzed the results. RB contributed to the discussion of the results and wrote section stress and strain fields. OZ wrote introduction and analyzed calculations for single inclusion. All authors contributed to conception and structure of the paper and approved the submitted version.
Funding
This work is supported by Russian Science Foundation (Project No. 20-19-00600).
Conflict of Interest
The authors declare that the research was conducted in the absence of any commercial or financial relationships that could be construed as a potential conflict of interest.
References
Anongba, P. N. B., Bonneville, J., and Martin, J. L. (1993). Hardening stages of [112] copper single crystals at intermediate and high temperatures—II. Slip systems and microstructures. Acta Metallurg. Mater. 41, 2907–2922. doi: 10.1016/0956-7151(93)90105-2
Cinat, P., Gnecco, G., and Paggi, M. (2020). Multi-scale surface roughness optimization through genetic algorithms. Front. Mech. Eng. 6:29. doi: 10.3389/fmech.2020.00029
Eshelby, J. D. (1959). The elastic field outside an ellipsoidal inclusion. Proc. R. Soc. A 252, 561–569. doi: 10.1098/rspa.1959.0173
Joe, J., Thouless, M. D., and Barber, J. R. (2020). Effect of surface roughness on adhesive instabilities for the elastic layer. Front. Mech. Eng. 6:31. doi: 10.3389/fmech.2020.00031
Ma, X., Zhao, J., Du, W., Zhang, X., and Jiang, Z. H. (2019a). Analysis of surface roughness evolution of ferritic stainless steel using crystal plasticity finite element method. J. Mater. Res. Technol. 8, 3175–3187. doi: 10.1016/j.jmrt.2019.03.017
Ma, X., Zhao, J., Du, W., Zhang, X., and Jiang, Z. H. (2019b). Analysis of texture-induced ridging in ferritic stainless steels 430 and 430LR during tensile deformation. J. Mater. Res. Technol. 8, 2041–2051. doi: 10.1016/j.jmrt.2018.12.019
Mori, T., and Tanaka, K. (1973). Average stress in matrix and average elastic energy of materials with misfitting inclusions. Acta Metall. 21, 571–574. doi: 10.1016/0001-6160(73)90064-3
Ozaki, S. H., Mieda, K., Maegawa, S., and Nakano, K. (2020). Meso–macro coupled analysis of pressure-dependent friction of rubber. Front. Mech. Eng. 6:24. doi: 10.3389/fmech.2020.00024
Popov, M., and Li, Q. (2018). Multimode active control of friction, dynamic ratchets and actuators. Phys. Mesomech. 21, 24–31. doi: 10.1134/S1029959918010046
Popov, V. (2010). Contact Mechanics and Friction. Heidelberg: Springer. doi: 10.1007/978-3-642-10803-7
Popov, V., Pohrt, R., and Li, Q. (2017). Strength of adhesive contacts: influence of contact geometry and material gradients. Friction 5, 308–325. doi: 10.1007/s40544-017-0177-3
Raabe, D., Sachtleber, M., Weiland, H., Scheele, G., and Zhao, Z. (2003). Grain-scale micromechanics of polycrystal surfaces during plastic straining. Acta Mater. 51, 1539–1560. doi: 10.1016/S1359-6454(02)00557-8
Romanova, V., Balokhonov, R., Emelianova, E., Pisarev, M., and Dymnich, E. (2020). Numerical study of the texture effect on deformation-induced surface roughening in titanium polycrystals, Eng. Fail. Anal. 110:104437. doi: 10.1016/j.engfailanal.2020.104437
Romanova, V., Balokhonov, R., Emelianova, E., Sinyakova, E., and Kazachenok, M. (2019). Early prediction of macroscale plastic strain localization in titanium from observation of mesoscale surface roughening. Int. J. Mech. Sci. 121–162. doi: 10.1016/j.ijmecsci.2019.105047
Romanova, V., Balokhonov, R., Panin, A., Kazachenok, M., and Kozelskaya, A. (2017a). Micro- and mesomechanical aspects of deformation-induced surface roughening in polycrystalline titanium. Mater. Sci. Eng. A 697. 248–258. doi: 10.1016/j.msea.2017.05.029
Romanova, V. A., Balokhonov, R. R., Panin, A. V., Batukhtina, E. E., Kazachenok, M. S., and Shakhijanov, V. S. (2017b). Micromechanical model of deformation-induced surface roughening in polycrystalline materials. Phys. Mesomech. 20. 324–333. doi: 10.1134/S1029959917030080
Shi, Y., Jin, H., Wu, P., and Lloyd, D. (2017). Analysis of roping in an AA6111 T4P automotive sheet in 3D deformation states. Acta Mater. 124, 598–607. doi: 10.1016/j.actamat.2016.11.028
Solhjoo, S., Halbertsma, P. J., Veldhuis, M., Toljaga, R., and Pei, Y. (2020). Effects of loading conditions on free surface roughening of AISI 420 martensitic stainless steel. Mater. Proc. Tech. 275:116311. doi: 10.1016/j.jmatprotec.2019.116311
Stoudt, M. R., Levine, L. E., Creuziger, A., and Hubbard, J. B. (2011). The fundamental relationships between grain orientation, deformation-induced surface roughness and strain localization in an aluminum alloy. Mater. Sci. Eng. A 530, 107–116. doi: 10.1016/j.msea.2011.09.050
Keywords: deformation-induced surface roughening, stress-strain analysis, numerical simulation, microstructure, uniaxial tension
Citation: Romanova V, Dymnich E, Balokhonov R and Zinovieva O (2020) Mechanical Aspects of Deformation-Induced Surface Roughening in the Presence of Inclusions in a Subsurface Layer. Numerical Modeling. Front. Mech. Eng. 6:66. doi: 10.3389/fmech.2020.00066
Received: 03 June 2020; Accepted: 07 July 2020;
Published: 14 August 2020.
Edited by:
Valentin L. Popov, Technical University of Berlin, GermanyReviewed by:
Vladimir Skripnyak, Tomsk State University, RussiaShingo Ozaki, Yokohama National University, Japan
Vera Petrova, University of Stuttgart, Germany
Copyright © 2020 Romanova, Dymnich, Balokhonov and Zinovieva. This is an open-access article distributed under the terms of the Creative Commons Attribution License (CC BY). The use, distribution or reproduction in other forums is permitted, provided the original author(s) and the copyright owner(s) are credited and that the original publication in this journal is cited, in accordance with accepted academic practice. No use, distribution or reproduction is permitted which does not comply with these terms.
*Correspondence: Varvara Romanova, dmFydmFyYUBpc3Btcy50c2MucnU=