 Žiga Rosec1
 Véronique Dias
 Tomaž Katrašnik
 Tine Seljak
- 1Laboratory for Internal Combustion Engines and Electromobility, Faculty of Mechanical Engineering, University of Ljubljana, Ljubljana, Slovenia
- 2Institute of Mechanics, Materials and Civil Engineering, Thermodynamics and Fluid Mechanics Division, Université Catholique de Louvain, Louvain-la-Neuve, Belgium
The paper presents a first comparative analysis of emission formation phenomena of three different bioliquids, derived from low-cost waste streams while utilizing the same gas turbine-based experimental setup. A consistent and unbiased comparison is ensured by the application of the same experimental test rig featuring only those minor fuel-based adaptations, which are required to ensure the most favorable operation of each of the analyzed fuels. This provides the direct comparative data between combustion performance of liquefied wood, obtained through solvolysis process, glycerol, and waste liquor from nanocellulose production which were previously tested in various combustion systems, hence making a direct evaluation of fuel's suitability difficult. The study focuses on the analysis of all key thermodynamic parameters and significant emission species covering CO, NOx, HC particulate matter, and soot as well as identification of underlying phenomena for observed emission trends. These indicate that for NOx emissions, a good correlation exists to the stoichiometric ratio of the fuels, where a low stoichiometric ratio results in lower NOx emissions, provided that oxygen content is the main diluent and fuel-bound nitrogen is low. As all tested fuels feature oxygen content above 43%, this enables a large improvement in NOx-CO trade off, as CO emissions are reduced with higher peak combustion temperatures while minimally increasing NOx emissions. Similar observations are made for particulate matter–NOx trade off; however, the ash content significantly impacts the particulate matter emission, hence reducing the potential for clean combustion of waste liquor. In the case of glycerol with no ash content, soot emissions are minimal and for an order of magnitude lower than for benchmark diesel fuel, as there are numerous phenomena effectively reducing their formation and increasing their oxidation. The presented research confirms that utilization of bio-intermediates and waste-derived fuels in appropriate combustion setups can, beside a low CO2 footprint, feature also very low emissions of other pollutant species, providing that fuels feature high oxygen content, low ash content, and low nitrogen content. With such approach, it is possible to achieve clean combustion that is fully in line with circular economy guidelines.
Introduction
The research area of alternative fuels was previously heavily boosted by the first EU RED directive (European Union, 2009), which fostered innovation and implementation efforts in the EU as well as worldwide. Within the first RED perspective, several commercial setups for biofuel production were put in function; however, they mostly relied on first-generation feedstock, where a significant market share was obtained with biodiesel (Ciriminna et al., 2014). Along with these, a strife continued to reach commercially feasible setups for production of advanced biofuels with second-generation and waste-derived feedstocks. In the first stage of the development process, they were capable of producing bio-intermediates, a mid-process product that required substantial upgrading before utilization as fuels (Xu et al., 2018). They were defined within RED as bioliquids (liquid fuels made from biomass for energy purposes other than transport). Although these are not suitable for transportation, low price and high maturity of technology make them a viable alternative for stationary power generation and for cogeneration (heating and cooling).
Within the recast of RED to RED II (European Union, 2018), bioliquids still play an important role as they count toward the goal of achieving sufficient renewable energy sources. Within these, currently technically confirmed bioliquids that are suitable for power generation comprise pyrolysis oils from biomass (Hita et al., 2016), liquefied biomass obtained through solvolysis process (Seljak et al., 2012), and a number of other niche products that originate as side streams in various production processes with a most notable case being crude glycerol that originates as a side stream of biodiesel production (Mishra and Goswami, 2018). Although being a promising bio-intermediate for further upgrading, hydrothermal liquefaction of biocrude (Dimitriadis and Bezergianni, 2017) was not technically proven to be directly usable in power generation systems; however, this does not limit its significant potential for upgrading and refinement to transportation fuels (Tzanetis et al., 2017). The above bioliquids are almost exclusively relying on waste-based feedstock; hence, they do not interfere with the food-supply chain and do not exhibit indirect land-use change risk, which is often the case with straight vegetable oils, which also classify as bioliquids but do not fit very well within the circular economy.
The relatively low cost of bioliquids and bio-intermediates (20 €/GJ for pyrolysis oil, 14€/GJ for HTL biocrude, and 11€/GJ for crude glycerol) in comparison to 37 €/GJ for ethanol or 19 €/GJ for biodiesel leads to a thorough investigation of power generation possibilities. The research was mostly oriented toward power generation with pyrolysis oils, where small-scale gas turbines (Cappelletti et al., 2013; Sallevelt et al., 2014; Beran and Axelsson, 2015; Pozarlik et al., 2015; Buffi et al., 2018a) and reciprocating engines (Chiaramonti et al., 2007) were often researched. Glycerol, for example, was also investigated as a fuel for boilers; however, promising results were obtained in gas turbines as well (Seljak and Katrašnik, 2019). Liquefied lignocellulosic biomass was investigated in experimental gas turbine systems and small-scale gas turbines exclusively (Seljak et al., 2014; Buffi et al., 2018b). All of the studies used a wide variety of experimental setups with different methodologies of experimental evaluation for each of the investigated fuels, hence making a direct comparison of performance difficult. This leads to challenging identification of technical, economical, and life-cycle benefits, which is of utmost importance when evaluating the environmental suitability of different power generation approaches.
The present study fills this gap by providing the first thorough comparative analysis of three different bio-intermediates and waste-derived fuels from industrial processes that strictly follow the circular economy guidelines and feature a low CO2 equivalent (according to RED II, crude glycerol from biodiesel production can be considered to have a CO2 equivalent of zero). Their utilization in power generation at the same time increases the economic viability of baseline processes where they are generated. The comparative analysis for the first time provides an unbiased insight into thermodynamic and emission performance within the same experimental setup and provides a long needed link between the currently available studies on separate fuels. The analyzed fuels comprise the following:
• Lignocellulosic biomass, liquefied through solvolysis, first proposed as a fuel in Rezzoug and Capart (2002) and experimentally confirmed in Seljak et al. (2012), the process of which uses wood trimmings, residual lignocellulose materials, and reclaimed wood as a feedstock.
• Glycerol, used as a model compound for crude glycerol originating as a side stream from biodiesel production, which exhibits a market price similar to natural gas (11 €/GJ) and presents a well-known burden to the biodiesel industry.
• Waste liquor originating as a side stream from production of nanocrystallinic cellulose that currently has no practical use and is discarded at high costs. Successful implementation of waste liquor as a fuel can lead to the first zero-waste nanocellulose production process.
• Diesel fuel, used as a benchmark to provide a direct comparison of performance to the above bioliquids.
All investigated fuels feature challenging physical and chemical properties with high viscosity and high oxygen content as the key limiting factors for utilization in a single experimental setup. To overcome this, a modular, gas turbine-based system, specifically tailored for low calorific value fuels with high viscosity, was developed. It features the above state-of-the-art fuel flexibility and enables analysis of all key thermodynamic parameters and the most significant emission species including CO, NOx, HC, and particulate matter. On this basis, the study thus provides comparative links of underlying phenomena that are present during combustion and emission formation of different bioliquids which can be extrapolated to gas turbine-based systems. The featured analysis thus provides an insight into the environmental performance of investigated bioliquids and is a key enabler for further technical advances of baseline processes that are oriented toward zero-waste and materially independent principles.
Fuel Processing
The following section provides detailed information on fuel processing in order to exhibit the relative complexity of different approaches and opportunities that are available in the area of initial feedstock used for production of fuels. Further, the section thoroughly describes the experimental procedure with emphasis on key required subsystems that enable the unified analysis of fuels with pronounced relative deviation of physical and chemical properties.
Liquefied Wood
The process for obtaining liquefied wood is well-developed and optimized in several earlier studies (Jasiukaityte-Grojzdek et al., 2012). Optimized formulation is produced by preparing a finely ground spruce wood (with particle size ~3 mm) from trimming residues. Ground wood is then introduced to a cold mixture of multifunctional alcohols (glycerol and diethylene glycol in 1:1 ratio), where the wood-to-multifunctional alcohol ratio is 1:3 by mass. Three percent of the multifunctional alcohol mass is substituted with para-toluensulfonic acid which acts as a catalyst. The liquefaction procedure involves heating of the mixture to 160°C with simultaneous ultrasonic agitation to speed up the lignocellulosic complex breakdown (Kunaver et al., 2012). After 60 min, the mixture is cooled to room temperature in order to prevent the formation of the recondensation products. Besides depolymerized cellulose, liquefied wood contains lignin degradation products, resulting in a notable content of cyclic hydrocarbons. Additionally, it is highly viscous and prone to thermal degradation, which is a consequence of the restarted liquefaction process at elevated temperatures due to the catalyst being still present in the final product. The overall energy requirement for production amounts to 2% of fuel's heating value, while the liquefaction yield is above 98%. Figure 1 presents the final product; the key properties are presented in Table 1.
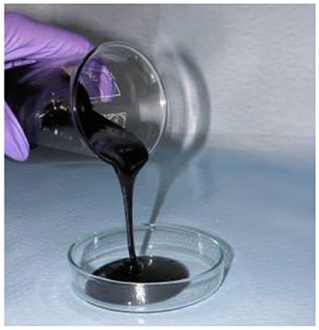
Figure 1. Liquefied wood.
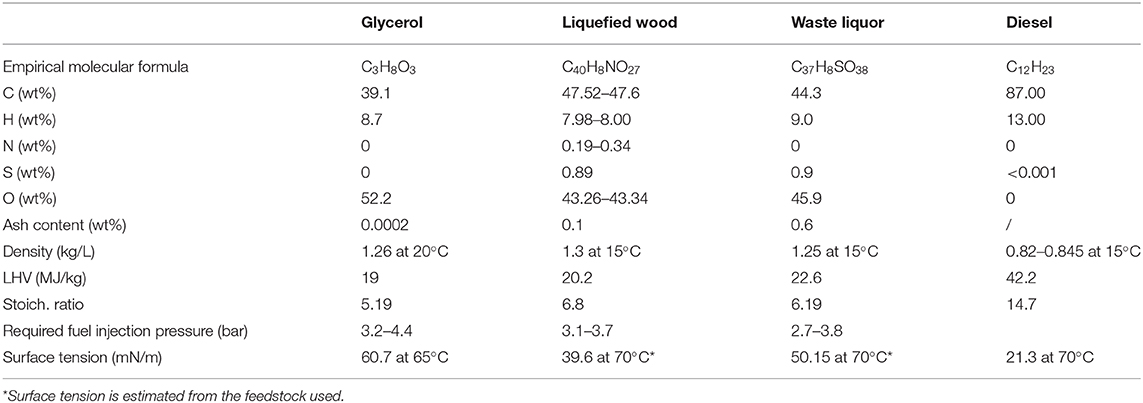
Table 1. Properties of investigated fuels.
Glycerol
Glycerol is an abundant side product of the transesterification process which amounts to ~10% of the biodiesel produced and is perceived as one of the major bottlenecks due to large quantities produced (Monteiro et al., 2018) and low price (Ciriminna et al., 2014). Depending on the process parameters and feedstock, the properties are highly variable in terms of catalyst residuals and mineral matter content, water content, and methanol content (Kumar et al., 2019). Major contaminants are sodium, calcium, potassium, magnesium, and phosphorous. Many process variations increase the purity of the coproducts, for example, fixed bed catalyst. For the sake of brevity of the paper, possible process variations to increase the purity of the side product will not be covered here. Nevertheless, it is worth mentioning that fixed bed catalysts yield glycerol with the lowest contaminant content. Depending on the final use, crude glycerol is usually refined to different levels of purity. For power generation purposes, the key challenge is the mineral content, whereas water content and methanol content are to a moderate extent tolerated, since they aid at reduction of viscosity, which is a key parameter for atomization of the fuel and aid at ignition properties. To provide an unbiased and transferrable comparative analysis with other investigated fuels, purified glycerol was used in the study with properties presented in Table 1.
Waste Liquor
One of the possible processes for production of nanocrystallinic cellulose (NCC) follows the similar route as for production of liquefied wood; however, for optimizing the NCC yield, cotton linters are used as a feedstock and several additional steps are involved for isolation of NCC. These involve dilution with dioxane and centrifuging to sediment the nanocrystallinic particles. After centrifuging, waste liquor is obtained which is recycled through the process several times in place of a fresh multifunctional alcohol mixture. The process route is presented in Figure 2, and further details are described by Kunaver et al. (2016). The key difference to liquefied wood is the use of cellulose-rich feedstock (waste textiles, residual cotton linters, etc.) which yields little to no cyclic hydrocarbon content in waste liquor. At the same time, the process is optimized to each feedstock by using a tailored multifunctional alcohol mixture, liquefaction time, and other parameters. Similar to the above-described glycerol and liquefied wood, waste liquor features a high oxygen content as well, but its viscosity exhibits less dependence on temperature, which to a certain extent limits the useful fuel preheating temperatures. With utilization of waste liquor for power generation, a possibility to set up a first zero-waste process for nanocellulose production emerges, which is a key enabler for large-scale nanocellulose production, since all of the processes produce large quantities of side streams with no further use (Brinchi et al., 2013). Key properties of waste liquor are presented in Table 1.
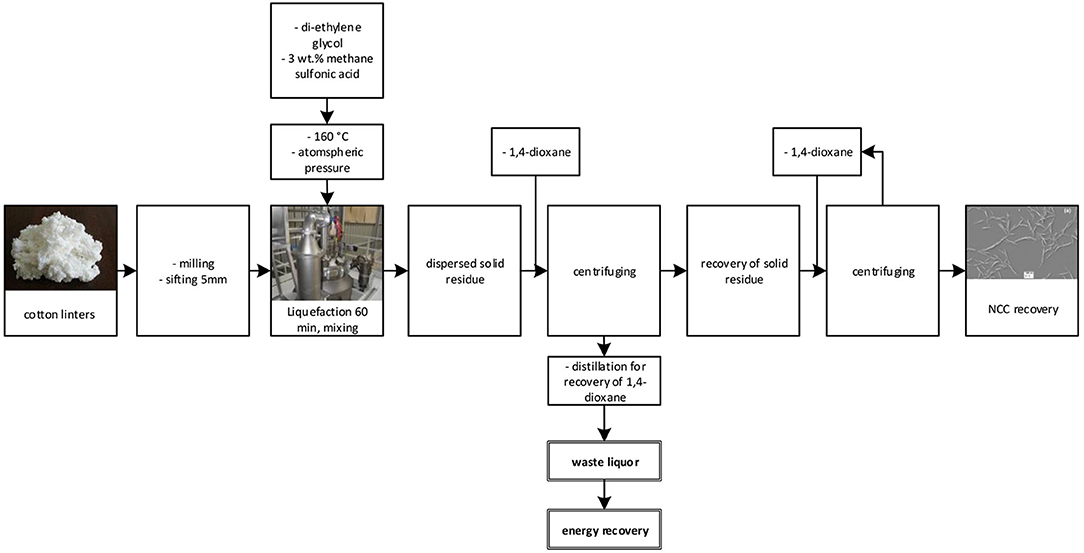
Figure 2. Waste liquor origin.
All presented fuels that will be investigated through this study exhibit similar challenging chemical and physical properties, although they are not interrelated. One of the challenging properties is the high viscosity presented in Figure 3; in comparison to a standard diesel fuel, the viscosities for glycerol and diesel are based on literature data (Seljak and Katrašnik, 2019), while for liquefied wood and waste liquor it was measured with Rotary Viscometer ViscoStar Plus. Particularly, liquefied wood exhibits a smaller reduction of viscosity at high temperatures, a consequence of thermal degradation of the fuel, which increases its viscosity due to polymerization reactions. Hence, the liquefied wood is also the least chemically stable at high temperatures, while other fuels exhibit better thermal stability.
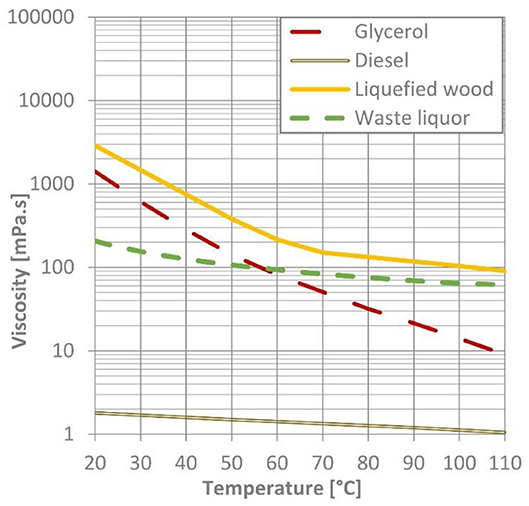
Figure 3. Viscosity dependence on temperature for the investigated fuels.
The impact of viscosity on atomization was extensively researched in the past for various different atomization systems. Generally, the increased viscosity lowers the Reynolds number of the fuel flow inside the atomizer which counters the development of instabilities, which generally delays the onset of droplet formation. This can also be derived from the so-called basic Equation (1) for twin-fluid atomizers presented by Lefebvre and Ballal (2010), where SMD is the Sauter mean diameter; ALR is the air-to-liquid ratio by mass; Lc is the characteristic dimension of the airblast atomizer; We is the Weber number, Oh is the Ohnesorge number, and A and B are constants depending on atomizer design.
If we expand the Weber and Ohnesorge numbers, we get Equation (2), where σ is the surface tension; ρA is the air density; UA is the air velocity; μL is the dynamic viscosity of fuel; ρL is the fuel density; and Dp is the pre-filmer diameter. From this equation, we can ascertain that increasing viscosity will result in bigger mean droplet size produced by the atomizing nozzle.
Although the presented equations are not fully transferable to the swirl-air nozzle used in the study, the similarity of the underlying mechanisms clearly shows that viscosity is one of the main influential parameters for obtaining appropriate SMD. As the viscosities in Figure 3 are notably temperature dependent, this can be exploited to reduce the viscosity at the point of injection.
With a constant air atomizing pressure of 6.5 bar for all fuels and fuel injection pressures in Table 1 being relatively low, we can assume relatively similar flow field conditions at the nozzle exit orifice for all fuels. This assumption can be based on the fact that the atomization process in majority relies on the internal mixing chamber; thus, fully developed spray is available already at the nozzle exit orifice. This allows for a rough assumption of spray characteristic in the form of Weber number. In relative comparison to diesel Weber number (160), the tested fuels are estimated to have 65% smaller Weber number for glycerol, 45% times smaller for waste liquor, and 55% times smaller for liquefied wood, which is mostly the consequence of surface tension differences among the tested fuels and their viscosity which are much higher than for diesel fuel and will hence impact the spray formation. Due to unavailability of surface tension data for liquefied wood and waste liquor, the range estimation was based on surface tension of the feedstock used (a mixture of diethylene glycol and glycerol), as given in Table 1.
Experimental Setup for Combustion Analyses
Combustion Test Rig
Evaluating the combustion capabilities of the investigated fuels is done on the experimental rig presented in Figure 4. The experimental rig can be easily modified to accommodate the changes in fuel type used; a detailed description is given by Seljak and Katrašnik (2016).
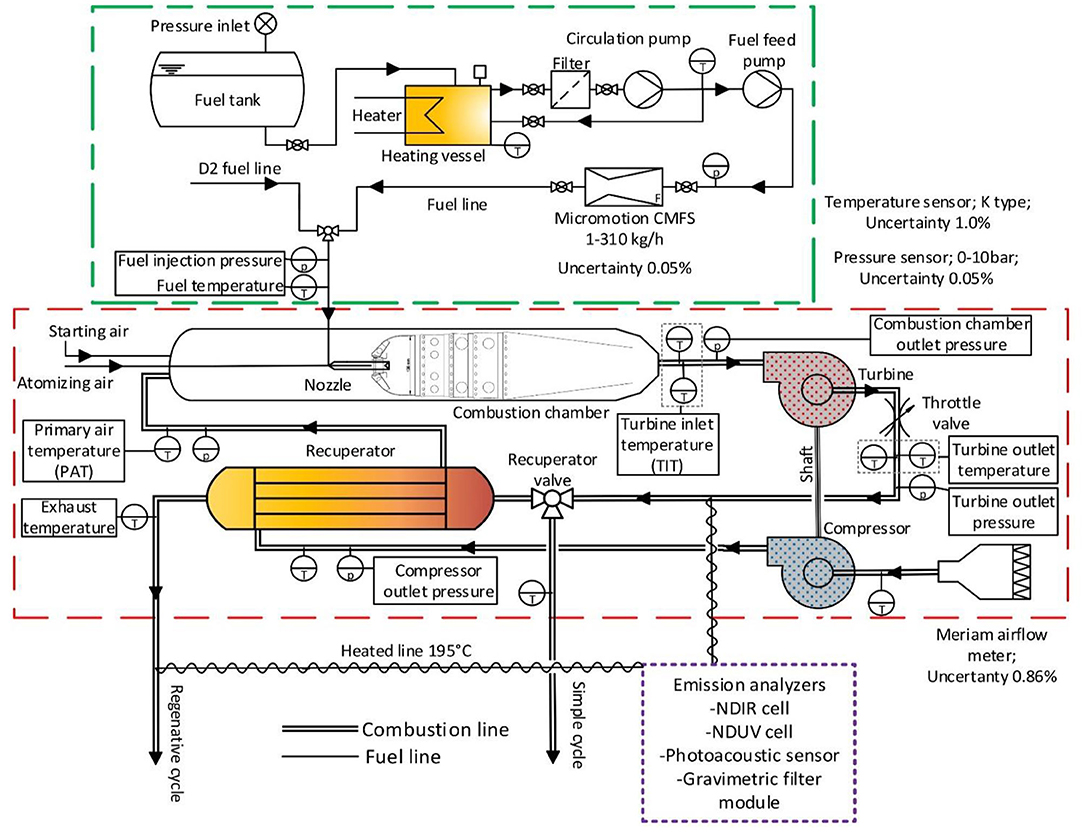
Figure 4. Scheme of the experimental rig used for evaluating combustion performance of evaluated fuels.
The fuel preparation subsystem is marked within the green rectangle, where different fuels are connected from their individual fuel tank to the heating vessel. Fuel is heated in the heating vessel until a stable target temperature is achieved. Downstream, the circulation pump establishes a homogenous fuel temperature and heats up the fuel line with a possible inclusion of a fuel filter to remove possible impurities. The heated fuel is then fed to the combustion chamber with the fuel feed pump through a coriolis mass flow meter. The fuel processing subsystem is fully pressurized to prevent the boil-off of volatile components and at the same time features low heater surface temperatures in order to avoid thermal degradation and phase separation of the fuels, which are due to a large content of oxygenated groups thermally unstable.
The combustion test rig (within the red rectangle) is the experimental subsystem that is designed for combustion analyses; hence, the power output is not measured. However, the implications on efficiency can be evaluated from chemical losses visible through emissions, combustion chamber pressure, and fuel pressure. The ambient air or intake air enters the experimental test rig at ambient temperature and is not preheated. After compression, the compressor discharge air is introduced to the recuperator that increases the temperature to primary air temperature, which is further discussed in section Comparative Analysis of Thermodynamic Parameters.
An air-atomizing nozzle with internal mixing is used in the experimental rig which is a suitable option for highly viscous fuels. While preheating the tested fuels results in lower viscosity, this still exceeds the recommended limit values [15 mm2/s (Lefebvre and Ballal, 2010) and 12 mm2/s Gupta et al., 2010] of commercially available gas turbine injector nozzles, but as already confirmed by Seljak and Katrašnik (2016), air-blast and air-assisted atomizer nozzles solve these problems. The experimental rig relies on a swirl-air nozzle using atomizing air, for which a cross section is given in Figure 5.
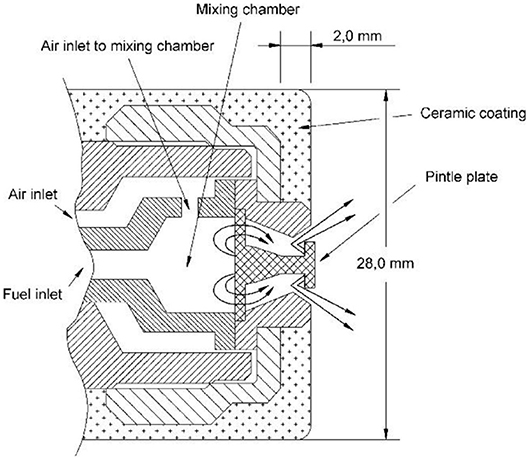
Figure 5. Swirl-air nozzle cross section.
The atomizing air pressure is set to 6.5 bar for all tested fuels. The fuel injection pressure is then a dependent variable of fuel mass flow that is regulated with a volumetric fuel feed pump. This principle ensures a robust and stable operation since it allows for self-regulation properties of the system in terms of combustion chamber pressure. Fuel mass flows are different for each tested fuel, depending on their energy content and viscosity, with glycerol having the highest fuel mass flow followed by an approximate increase of 16% for liquefied wood and a 22% increase for waste liquor in comparison to glycerol.
Different power outputs can be emulated either via a throttle valve that reduces the enthalpy difference on the turbine or via fuel mass flow control. Both approaches result in altered turbine inlet temperature (TIT), a characteristic parameter for defining the operating point of the experimental system. The main components also include a single can diffusive combustion chamber (Figure 6), which has not received any optimizations, and the recuperator which enables regenerative cycle operation and hence primary air temperatures in excess of 450°C. The starting procedure uses diesel fuel. Ignition is achieved with a pilot diesel flame in simple cycle mode, which is followed by a gradual increase in regeneration intensity to ultimately achieve operation in the regenerative cycle. After operating temperatures are stabilized, the switch from diesel to investigated fuel is performed. From this point, the experimental system operates with the investigated fuel, including all transient operation and stabilization intervals.

Figure 6. 3D model of combustion chamber.
Measurement Equipment and Post-processing
Seven type-K thermocouples, five low-frequency piezoresistive pressure sensors, and a laminar flow airflow meter are positioned on all characteristic points of the experimental rig. Positions are discernible from Figure 4. In the emission analyzers, NOx emissions are measured in a NDUV cell and CO, CO2, and HC in a NDIR cell. For the NDIR cell, the accuracy is 3% of the reading and repeatability is 2% of the reading, with the same accuracy of 3% of the reading and 2% repeatability of the reading in the NDUV cell measurements. The photoacoustic sensor and gravimetric filter have an accuracy of 5% of the full scale.
The values for each individual operation point are averaged from 30 s of recorded data in a stabilized operational point. All the evaluated emissions are normalized to fuel power, to assure a credible comparison. The mathematical formulation for any normalized emission Ex normalized is defined as
Ex normalized represents the normalized emissions while Ex represents the measured values of the chosen emission, Mx is the corresponding molar mass, and Mexhaustgas is the molar mass of exhaust gases. Mass flows of fuel and air are represented as ṁfuel and ṁair and LHV the lower heating value of fuel.
The analysis and evaluation of data follow the emission concentrations normalized to fuel power at each distinctive operational point with different fuels. The environmental impact is assessed through CO, NOx, HC (as C6H12), and particulate matter results. While a direct footprint of combustion can be estimated via combined concentrations, the Results and Discussion section specifically discusses each emission species separately in order to provide an insight into combustion phenomena that is responsible for observed trends and to establish a link between analyzed fuels and emission performance.
Particulate matter (PM) emissions are measured with a PM-PEMS analyzer produced by AVL List GmbH. It is capable of accurately determining the PM emissions using two subsystems (photoacoustic sensor and gravimetric filter module). The exhaust sample is firstly diluted to a ratio between 2 and 50 with filtered air. The photoacoustic sensor is capable of determining the soot concentration using the photoacoustic method where strongly absorbent soot particles are exposed to a modulated laser beam. This induces periodic expansion and contraction as the particles get warmed and cooled, which results in sound-wave generation measured with a microphone determining soot concentration. Calculation of cumulative soot mass on filter is done from the continuous soot signal and filter flow from start to end of filter loading, presented in Equation (4). This parameter is then used to calculate the scaling factor (fac) with the filter mass in Equation (5).
msoot(filter) represents the cumulative soot mass on filter, tfil is the time the filter is loaded, csoot is the continuous soot signal, and qfil is the filter flow.
In Equation (5), fac represents the scaling factor, mfil is the filter mass flow, and the msoot(filter) presents the previously calculated cumulative soot mass on the filter.
To calculate the real-time PM emissions with the scaling factor, we use Equation (6), where the dilution ratio [rd(t)] is taken into account.
Results and Discussion
The following section presents the results, where emphasis is given on emission data. Results on thermodynamic parameters are provided to ensure unbiased comparative analysis and evaluation of possible impact on thermodynamic performance. As all experiments were carried out on the same experimental rig, the differences in emission concentrations can mainly be attributed to fuel physical and chemical properties and only to a minor extent to minimal changes that were implemented in the experimental setup to accommodate the use of different fuels. Emission concentrations are plotted vs. TIT at different fuel temperatures.
Comparative Analysis of Thermodynamic Parameters
The baseline thermodynamic parameters, pressure ratio, and primary air temperature need to be evaluated to assure a comparative analysis. TIT is the leading parameter for establishing operational points, which is controlled with fuel flow that results in higher pressure ratios. In general, the established conditions mirror those present in commercial micro turbines. In Figure 7, the pressure ratios are presented for each separate fuel. The change in fuel temperature does not affect the pressure ratios; also, the relative differences between investigated fuels are small, which is a result of minor changes in the experimental setup. A slightly larger difference is observed with diesel fuel. Additionally, by analyzing the time-resolved data within each of the measured points, an estimation of pressure fluctuations on the outlet of the combustion chamber can be evaluated. Although the pressure sampling is not designed for high-frequency monitoring and is instead designed for static pressure measurements with substantial equalizing lengths on four circumferentially positioned probes, it is capable of revealing possible large-scale instabilities. The values of pressure fluctuations are fairly low for glycerol in the range of 0.06–0.21% and are higher for waste liquor and liquefied wood in the range of 0.84–1.31%. Based on the estimation of the critical pressure fluctuations (1–2% of static pressure) given by Gülen (2019), it can be concluded that operation of the listed fuels is stable which is also confirmed through preliminary analysis of time-resolved emission data.
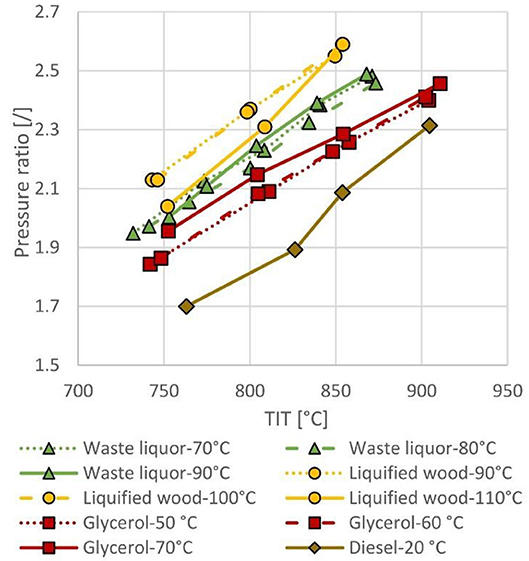
Figure 7. Pressure ratios.
As the experimental rig was purposely built for testing highly viscous fuels with low LHV, benchmark data with diesel fuel was obtained in a separate set of experiments with a partially closed throttle valve position after the turbine, hence reducing the pressure ratio slightly. Simultaneously, the fuel flow was reduced to maintain comparable TIT and PAT as with other investigated fuels; however, the emission concentrations are normalized to fuel power, hence eliminating this effect.
With increasing TIT, the impact on primary air temperature is visible as well. This happens as higher TIT results in higher turbine outlet temperature and hence higher temperature of regenerated primary air. The primary air temperature shown in Figure 8 does not change significantly for each individual fuel, with minorly lower primary air temperature obtained with liquefied wood, which is a consequence of a slightly higher pressure ratio obtained with liquefied wood in Figure 7. The reason for this is in minor changes in the experimental setup which provided lower pressure drops on the intake side when utilizing liquefied wood. Diesel fuel shows comparable primary air temperatures to other fuels, although the pressure ratio is slightly lower. The reason for this can be traced back to reduced air mass flow which impacts the primary heat exchanger effectiveness. The detailed thermodynamic analysis for this phenomenon is not discussed here as the emissions of diesel fuel are given for a reference purpose and all emission concentrations are normalized to fuel power.
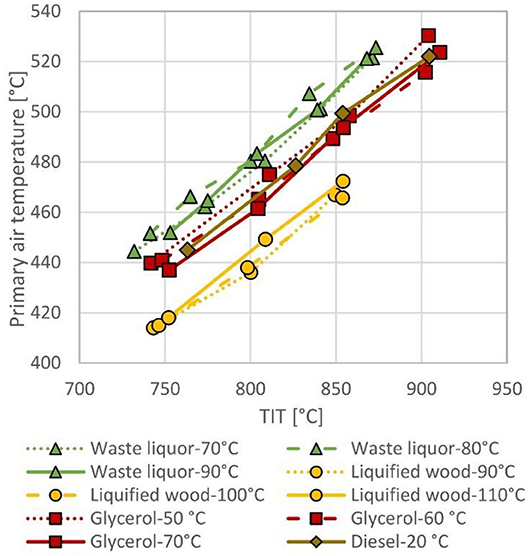
Figure 8. Primary air temperatures.
NOx Emissions
NOx emissions for each investigated fuel are shown in Figure 9. None achieve similar emissions, but all exhibit increased NOx emissions with increasing TIT. In addition, the fuel temperatures play little to no role in NOx emission formation as no trends are immediately observed, apart from liquefied wood, which features the highest viscosity and at low TIT and low fuel preheating temperatures exhibits higher NOx emissions, which is a consequence of large fuel droplets that feature isolated combustion, hence providing a large cumulative flame front area, where NOx formation is promoted.
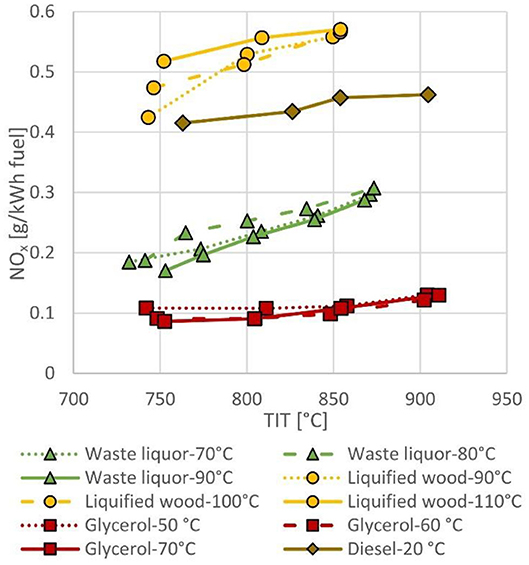
Figure 9. NOx emissions for different fuels at different fuel temperatures.
The investigated fuels are all highly oxygenated and have similar characteristics; surprisingly, their effect of inhibiting the mechanisms responsible for NOx varies from fuel to fuel. The high oxygen content is proven to be beneficial in regard to emission reduction (Nabi, 2010), as glycerol and waste liquor fuel emissions are 2-fold lower for waste liquor and 4-fold lower for glycerol compared to the reference diesel fuel. Again, liquefied wood exhibits higher NOx emissions which can be linked to high nitrogen content in the fuel.
The high oxygen content in fuel is linked to low stoichiometric ratios, which is the main mechanism responsible for lower NOx emissions. If the low stoichiometric ratio is a consequence of high oxygen content, which is the case in investigated fuels, smaller quantities of air are required to achieve flammability limits and consequently less nitrogen is introduced into the high-temperature zones to participate in the thermal (Heywood, 1988) and also prompt (Fenimore, 1971) mechanisms responsible for NOx emissions. This is the main advantage of glycerol for achieving the lowest NOx emissions, due to having the lowest stoichiometric ratio followed by waste liquor.
The fuel-bound oxygen can also affect the adiabatic flame temperature (Nabi, 2010). Increasing the oxygen content will decrease the adiabatic flame temperature, resulting in decreased hot zones and reduced thermal formation of NOx.
Even though the beneficial effects of fuel-bound oxygen are present with liquefied wood, the NOx emissions exceed those of diesel, which can be linked to another mechanism of NOx formation, as liquefied wood is the only investigated fuel that contains a traceable amount of nitrogen. This fuel-bound nitrogen forms NOx emissions (Buffi et al., 2018b), which results in inferior performance of liquefied wood in comparison to the other fuels that have no nitrogen content. We can assume that the liquefied wood would still produce higher NOx emissions even if no fuel-bound nitrogen would be present, as it has the highest stoichiometric ratio of all investigated fuels.
CO Emissions
Considering the high viscosity and density of investigated fuels, the observed CO emission trends are to some extent expected. Particularly viscosity and density notably impact the mixture formation process, resulting in increased CO emissions. The main reason is that reduced atomization performance and larger droplets are formed that feature a lower surface-to-volume ratio, which is additionally influenced by the high density of the fuel and causes an even lower mass-to-volume ratio. This, combined with a large droplet momentum, inhibits the residence time of droplets in high-temperature zones of the combustion chamber and reduces the heat transfer, required for fuel vaporization. With combustion taking place later in the primary zone, a significant amount of reaction quenching can occur which stops the completion of CO-to-CO2 reactions.
In Figure 10, the liquefied wood and waste liquor emissions are in the same range, even though the liquefied wood viscosity is higher and the increased temperature of the fuel brings liquefied wood and waste liquor to similar values resulting in similar CO emissions. Increasing the fuel temperature does have a limit as is observed with liquefied wood as a high fuel temperature of 110°C can reach the fuel nozzle coking point, which impairs the atomization ability of the nozzle and increases the CO emissions (Albert-Green and Murray, 2018).
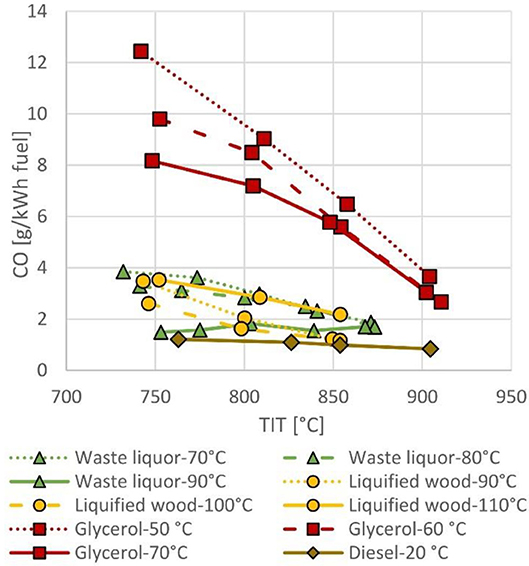
Figure 10. CO emissions for different fuels at different fuel temperatures.
The large gap between the glycerol and other fuels is not a result of viscosity as glycerol viscosity values sit between those of liquefied wood and waste liquor and even lower at higher temperatures. The higher CO emissions are believed to be connected to the components in fuels. Glycerol is a single component whereas the liquefied wood and waste liquor are multicomponent fuels with a large number of different hydrocarbons—from highly volatile to relatively heavy ones with high ignition resistance. A single-component composition combined with high boiling point (290°C) and auto-ignition temperature (370°C) of glycerol drastically alters the evaporation curve. Thus, high temperatures are required to start the vaporization process, which increases the delay of mixture formation. Comparing this to the evaporation curves of liquefied wood and waste liquor, where the component with lower boiling points helps to release the heat early in the mixture formation process and support the vaporization and combustion of other components. This can also explain why increasing TIT has the most effect on lowering the CO emissions with glycerol and is less pronounced with liquefied wood and waste liquor.
The observed trends ultimately suggest that a persistent CO–NOx trade off is present among investigated fuels, which is not linked to thermodynamic parameters as they were comparable during the experiments with different fuels. However, as glycerol shows the best NOx performance and well-pronounced reducing trend of CO emission with high TIT, state-of-the-art gas turbine setups that utilize TIT above 1,000°C could majorly benefit from the use of glycerol.
HC Emissions
The same problem linked to glycerol, due to its being a single-component fuel, can also be observed with the HC emissions in Figure 11. Although the spread is smaller, the droplets that do not reach the required temperature conditions are unable to vaporize and fully oxidize. This is also apparent with lower fuel temperatures where the droplet size increases for all fuels, resulting in more HC emissions. Like with CO, a trend of lowering HC emissions is observed for all fuels when increasing TIT. The higher TIT temperature increase in the combustion chamber allows for more favorable conditions for fuel vaporization and combustion reactions to occur. Considering relatively low HC emissions, it can be concluded that no significant deviation from baseline diesel fuel is present and HC emissions are not a limiting factor when power generation with investigated waste-derived bioliquids is in question.
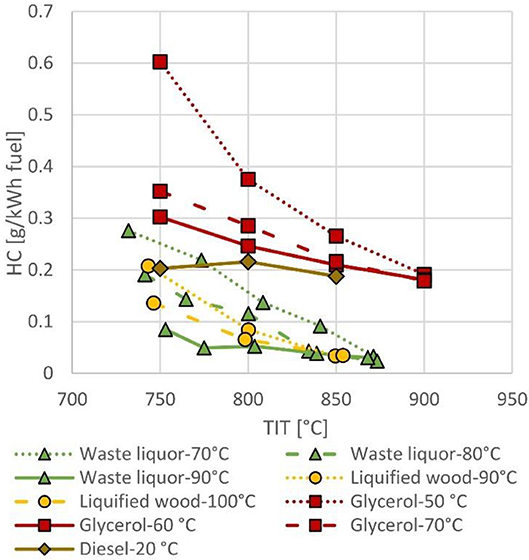
Figure 11. HC emissions for different fuels at different fuel temperatures.
Particulate Matter Emissions
Particulate matter emissions are measured with two different but correlated methods. As described in section Experimental Setup for Combustion Analyses, soot emissions are measured with the photoacoustic method that responds to soot particles and is calibrated for diesel fuel. In parallel, the same sample is measured also gravimetrically, which gives the cumulative mass of the particulate matter sampled. The real-time concentration of soot is given by the photoacoustic method, which is after finalized experiments weighted with data from the gravimetric method to obtain a real-time particulate matter concentration. This step is done post-processing.
Ideally, both methods should return similar concentrations. This is the case with baseline diesel fuel, where the scaling factor between soot and particulate matter emission is 1.2 since the method is fitted to the morphology, optical properties, and chemical composition of diesel soot. With other fuels, soot might exhibit significantly different properties that cause a lower response to the photoacoustic method, particularly due to lower absorbance of irradiated heat and smaller volume change as a consequence of different densities and soot compositions.
To provide an insight into both measured parameters, soot emission is given in Figure 12 and weighted PM emission is given in Figure 13. Here, no data for liquefied wood is available. However, based on liquefied wood properties, soot formation for liquefied wood might be increased in comparison to waste liquor, as it contains a notable amount of cyclic hydrocarbons that act as precursors for soot and originate from lignin degradation products (Jasiukaityte et al., 2010).
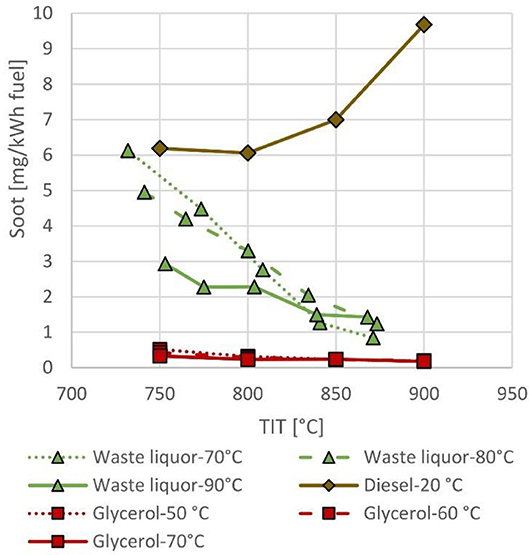
Figure 12. Soot emissions for different fuels at different fuel temperatures.
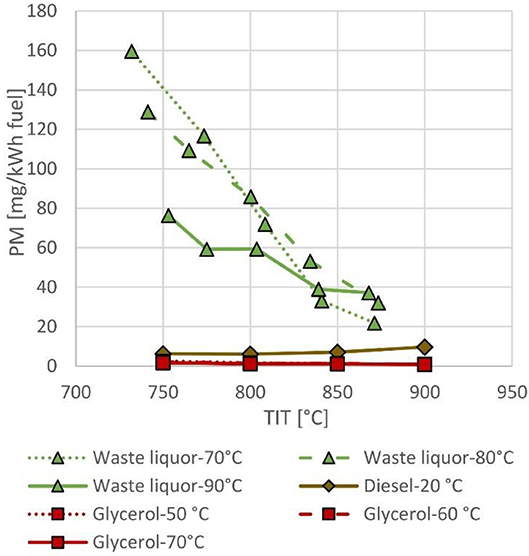
Figure 13. Particulate matter emissions for different fuels at different fuel temperatures.
Soot emissions for waste liquor and glycerol are remarkably lower compared to diesel fuel (Figure 12). The diesel soot emissions increase with higher TIT as the soot of waste liquor and glycerol decreases. In absolute terms, glycerol exhibits an order of magnitude lower soot emissions than diesel fuel and at least 5-fold lower emissions than waste liquor. Here, fuel-bound oxygen plays a vital role as it influences the following phenomena:
1. Altered soot zone formation limits
2. Inhibited formation of soot precursors
3. Increased soot reactivity
The first phenomena responsible for low soot emission trends with glycerol can be linked to high oxygen content in glycerol and purely physical phenomena involved in spray formation. Bonded oxygen becomes, during dissociation of glycerol, readily available in the flame zone in the form of free radicals, resulting in a high local C/O ratio already without any entrapment of external air. Thus, in the case of glycerol, the C/O ratio is always below 1 (based on elemental composition of glycerol), regardless of the mixture preparation dynamics, whereas for D2 this value is easily exceeded on the rich side of the mixture, where insufficient air is entrapped into the spray and approaches infinity where only fuel vapor is present. Areas outside the soot formation interval are more likely to occur with glycerol as the volume of the mixture within the soot formation limit (EQR between 1.8 and 2.9) is smaller. A similar reasoning is valid also for waste liquor.
The second phenomenon concerns mainly combustion kinetics. Several previous studies have shown that the addition of an oxygen compound to hydrocarbon flames reduces the formation of species considered as “soot precursors,” such as acetylene (C2H2), cyclopentadiene (C5H6), benzene (C6H6), and naphthalene (C10H8). These last molecules lead directly to the production of soot. By blending oxygenated compounds into the rich hydrocarbon flames and by keeping the equivalence ratio constant, we observe that hydrocarbon production is governed mainly by the C/O ratio instead of the equivalence ratios. This leads to a lower formation of soot precursors and an increase in the production of light oxygenates (Dias and Vandooren, 2011; Dias et al., 2014). These observations are justified and validated by detailed kinetic analyses that underline the reactivity of reactions with O and OH radicals. In this study, the low C/O ratio of glycerol justifies thus the small amount of soot formation (Figure 12). Moreover, for molecules as complex as glycerol, the multiple carbon–oxygen bonds decrease the formation of soot composed entirely of carbon–carbon bonds. By comparison, diesel is composed only of hydrocarbons with carbon–carbon bonds (alkanes, cycloalkanes, alkenes, aromatic hydrocarbons) which are responsible for the increase in soot (Figure 12). Soot formation is also influenced with temperature, as Figure 12 shows an increase in soot formation for diesel fuel as a function of temperature. Indeed, the production of the first soot particles is promoted by kinetic mechanisms that are very sensitive to temperature. For glycerol and waste liquor, the temperature leads to a more complete combustion, which allows a higher production of oxygenated molecules instead of soot emissions.
The third phenomenon touches upon the increased reactivity of soot particles, as the oxygenated groups in the investigated fuels have a proven effect on increasing the soot reactivity (Lapuerta et al., 2019), which consequently leads to lower soot in exhaust gases provided that a long enough residence time is available. This is one of the effects that can be used with gas turbines as the residence time of mixture is longer in comparison to diesel engines. Increased oxidation points become available on the soot surface because of the fuel-bound oxygen together with a more porous structure that is more accessible to oxygen attack (Verma et al., 2020), leading to eventual soot burn-off. The most important role is played by a combustion chamber secondary zone, where gradual reduction in temperature occurs with high excess air ratios. Under this assumption, it is mandatory that secondary air temperature is sufficiently high (in the presented case approximately equal to the primary air temperature).
Particulate matter emissions follow similar trends as those of soot emissions with a significant difference in absolute values seen in Figure 13. The aforementioned scaling factor is 1.2 for diesel fuel, 5.0 for glycerol, and 26.0 for waste liquor. This indicates that soot originating from waste liquor combustion exhibits significantly different properties with possible inclusions of matter with low light absorbance; hence, the gravimetric method detects bigger emitted concentrations than the photoacoustic method. This might be linked to significant inclusions of ash in emitted particulate matter, since waste liquor contains 0.6% of ash. Additional reasons are linked to different soot structures and hence lower response in terms of volume change when particles are heated, hence limiting the sensitivity of the photoacoustic method. For glycerol, the scaling factor is much lower which can be linked to the absence of ash.
The trend observed with the investigated fuels show that the increase in EQR does not increase the soot or PM emissions; instead, the emission trend is reduced as the TIT increases. This offers a promising scenario where with the additional increase in TIT which is easily attainable in commercial gas turbine setups, high effective efficiency can be achieved with no or minimal impact on the increase in PM emissions. Already, the aforementioned improvement in CO–NOx trade off can similarly be also confirmed with PM–NOx trade off, making a power generation with low cost, waste-derived bioliquids a promising alternative, providing that ash content is minimized. This puts a new perspective on the waste-derived fuels, as they are generally depicted as troublesome fuels with increased emissions and opens a great opportunity for reducing or even closing a fraction of waste streams that originate in different production processes.
Conclusions
The study represents the first comparative analysis of different bio-intermediates and waste-derived fuels that originate from established processes in the wood industry, biodiesel production, and nanocellulose production. All tested fuels originate from renewable sources, and their utilization closely follows circular economy guidelines. The results show that improvement of the emission footprint of such fuels is not solely the consequence of a low CO2 footprint but also significant reduction of major pollutant species, namely, NOx and particulate matter.
The NOx emission reduction is one of the main advantages in the case of investigated fuels as both waste liquor and glycerol display far lower NOx emissions in comparison to diesel fuel with the lowest emissions attained from glycerol as it has the highest oxygen content of all the investigated fuels. The reducing trend is consistent with reductions in the stoichiometric ratio of the fuels, providing that fuel-bound nitrogen is low. The latter case is observed with liquefied wood, which exhibits slightly higher NOx emissions in comparison to diesel fuel, while glycerol and waste liquor feature ~4- and 2-fold reduction in NOx emissions.
CO emissions of all investigated fuels are higher than for diesel fuel; however, the emission reduces toward a higher TIT, suggesting that utilization in modern gas turbine-based systems with TIT in excess of 1,000°C would provide significantly lower concentrations of CO. The reducing trend can be attributed to a very high viscosity of the tested fuels which causes generation of larger droplets during spray formation, which requires higher temperatures for further evaporation and mixture formation. Similar tendencies are present also with HC emissions. Combining this observation with reduced NOx emissions in comparison to diesel fuel, a significantly improved CO–NOx trade off can be achieved with glycerol and waste liquor, while liquefied wood exhibits very similar trade off behavior as diesel fuel at the highest tested TIT.
Considerably low PM emissions are achieved with the use of glycerol, as the fuel-bound oxygen can influence several phenomena resulting in less soot emissions. The underlying reason is that the C/O ratio heavily influences soot zone formation by supplying sufficient oxygen concentrations already without air entrapment in the spray. The kinetics of soot formation are influenced as well, namely, through reduction of soot precursor formation. Furthermore, reactivity of soot is increased, due to porous soot particles with a larger active area which enables soot burn-off in the secondary zone of the combustion chamber. Although the same phenomenon is present with waste liquor, the PM emissions far exceed those of glycerol and diesel, which can be linked to the high ash content in waste liquor.
The performed comparative analysis confirms that with utilization of waste-derived fuels and bio-intermediates for power generation, CO2 emissions as well as pollutant emissions can be reduced at the same time. In the investigated fuels, where recycling and reuse routes are highly challenging, this can lead to attractive business cases and a step toward zero-waste production processes that are fully in line with circular economy guidelines.
Data Availability Statement
The datasets presented in this article are not readily available because intellectual property rights under which they were obtained, prevent the publishing of raw data. Requests to access the datasets should be directed to dGluZS5zZWxqYWtAZnMudW5pLWxqLnNp.
Author Contributions
The experiments were designed and conducted by TS. ŽR conducted the data post-processing and writing. TS provided the overall idea and relevance of the work. Writing was principally performed by ŽR, TS, and TK, and essential contributions were provided by VD and FC in the discussions of the results. TK, FC, and TS provided the guidance in reviewing the paper. All authors contributed to the article and approved the submitted version.
Funding
The authors acknowledge the financial support from the Slovenian Research Agency (research core funding No. P2-0401—energy engineering, project funding Z2-1862—zero-footprint combustion for green energy generation, and young researcher program funding No. 802-7/2019).
Conflict of Interest
The authors declare that the research was conducted in the absence of any commercial or financial relationships that could be construed as a potential conflict of interest.
References
Albert-Green, S., and Murray, J. T. (2018). The effects of nozzle design on the combustion of wood-derived fast pyrolysis oil. Biomass Bioenergy 117, 102–114. doi: 10.1016/j.biombioe.2018.07.002
Beran, M., and Axelsson, L. U. (2015). Development and experimental investigation of a tubular combustor for pyrolysis oil burning. J. Eng. Gas Turb. Power 137:031508. doi: 10.1115/1.4028450
Brinchi, L., Cotana, F., Fortunati, E., and Kenny, J. M. (2013). Production of nanocrystalline cellulose from lignocellulosic biomass: technology and applications. Carbohyd. Polym. 94, 154–169. doi: 10.1016/j.carbpol.2013.01.033
Buffi, M., Cappelletti, A., Rizzo, A. M., Martelli, F., and Chiaramonti, D. (2018a). Combustion of fast pyrolysis bio-oil and blends in a micro gas turbine. Biomass Bioenergy 115, 174–185. doi: 10.1016/j.biombioe.2018.04.020
Buffi, M., Seljak, T., Cappelletti, A., Bettucci, L., Valera-Medina, A., Katrašnik, T., et al. (2018b). Performance and emissions of liquefied wood as fuel for a small scale gas turbine. Appl. Energy 230, 1193–1204. doi: 10.1016/j.apenergy.2018.08.126
Cappelletti, A., Rizzo, A. M., Chiaramonti, D., and Martelli, F. (2013). “CFD redesign of micro gas turbine combustor for bio-fuels fueling,” in XXI International Symposium on Air Breathing Engines (ISABE) (Busan), 1199–1206.
Chiaramonti, D., Oasmaa, A., and Solantausta, Y. (2007). Power generation using fast pyrolysis liquids from biomass. Renew. Sustain. Energy Rev. 11, 1056–1086. doi: 10.1016/j.rser.2005.07.008
Ciriminna, R., Pina, C. D., Rossi, M., and Pagliaro, M. (2014). Understanding the glycerol market. Euro. J. Lipid Sci. Technol. 116, 1432–1439. doi: 10.1002/ejlt.201400229
Dias, V., Katshiatshia, H. M., and Jeanmart, H. (2014). The influence of ethanol addition on a rich premixed benzene flame at low pressure. Combust. Flame 161, 2297–2304. doi: 10.1016/j.combustflame.2014.03.005
Dias, V., and Vandooren, J. (2011). Experimental and modeling studies of C2H4/O2/Ar, C2H4/Methylal/O2/Ar and C2H4/Ethylal/O2/Ar rich flames and the effect of oxygenated additives. Combust. Flame 158, 848–859. doi: 10.1016/j.combustflame.2011.01.015
Dimitriadis, A., and Bezergianni, S. (2017). Hydrothermal liquefaction of various biomass and waste feedstocks for biocrude production: a state of the art review. Renew. Sustain. Energy Rev. 68, 113–125. doi: 10.1016/j.rser.2016.09.120
European Union (2009). Directive (EU) 2009/28/EC of the European Parliament and of the Council of 23 April 2009 on the Promotion of the Use of Energy from Renewable Sources. Available online at: https://eur-lex.europa.eu/legal-content/EN/ALL/?uri=CELEX%3A32009L0028 (accessed March 4, 2020).
European Union (2018). Directive (EU) 2018/2001 of the European Parliament and of the Council of 11 December 2018 on the Promotion of the Use of Energy from Renewable Sources. Available online at: https://eur-lex.europa.eu/legal-content/EN/TXT/?uri=uriserv:OJ.L_.2018.328.01.0082.01.ENG (accessed March 3, 2020).
Fenimore, C. P. (1971). Formation of nitric oxide in premixed hydrocarbon flames. Int. Symp. Combust. 13, 373–380. doi: 10.1016/S0082-0784(71)80040-1
Gülen, S. C. (2019). Gas Turbines for Electric Power Generation. Cambridge: Cambridge University Press.
Gupta, K. K., Rehman, A., and Sarviya, R. M. (2010). Bio-fuels for the gas turbine: a review. Renew. Sustain. Energy Rev. 14, 2946–2955. doi: 10.1016/j.rser.2010.07.025
Heywood, J. B. (1988). Engine Types and Their Operation. Internal Combustion Engine Fundamentals. New York, NY: McGraw-Hill College.
Hita, I., Arabiourrutia, M., Olaza, R. M., Bilbao, J., Arandes, J. M., and Sanchez, P. C. (2016). Opportunities and barriers for producing high quality fuels from the pyrolysis of scrap tires. Renew. Sustain. Energy Rev. 56, 745–759. doi: 10.1016/j.rser.2015.11.081
Jasiukaityte, E., Kunaver, M., and Crestini, C. (2010). Lignin behaviour during wood liquefaction—characterization by quantitative 31P, 13C NMR and size-exclusion chromatography. Catal. Today 156, 23–30. doi: 10.1016/j.cattod.2010.02.001
Jasiukaityte-Grojzdek, E., Kunaver, M., and Poljanšek, I. (2012). Influence of cellulose polymerization degree and crystallinity on kinetics of cellulose degradation. BioResources 7, 3008–3027. doi: 10.15376/biores.7.3.3008-3027
Kumar, L. R., Yellapu, S. K., Tyagi, R. D., and Zhang, X. (2019). A review on variation in crude glycerol composition, bio-valorization of crude and purified glycerol as carbon source for lipid production. Bioresour. Technol. 293, 122–155. doi: 10.1016/j.biortech.2019.122155
Kunaver, M., AnŽlovar, A., and Žagar, E. (2016). The fast and effective isolation of nanocellulose from selected cellulosic feedstocks. Carbohyd. Polym. 148, 251–258. doi: 10.1016/j.carbpol.2016.04.076
Kunaver, M., Jasiukaityte, E., and Cuk, N. (2012). Ultrasonically assisted liquefaction of lignocellulosic materials. Bioresour. Technol. 103, 360–366. doi: 10.1016/j.biortech.2011.09.051
Lapuerta, M., Sánchez-Valdepenas, J., Barba, J., Fernández-Rodríguez, D., Andrés, J. P., and García, T. (2019). Analysis of soot from the use of butanol blends in a Euro 6 diesel engine. Energy Fuels 33, 2265–2277. doi: 10.1021/acs.energyfuels.8b04083
Lefebvre, A. H, and Ballal, D. R. (2010). Gas Turbine Combustion: Alternative Fuels and Emissions. 3rd Edn. London: CRC Taylor and Francis Group.
Mishra, V. K., and Goswami, R. (2018). A review of production, properties and advantages of biodiesel. Biofuels 9, 273–289. doi: 10.1080/17597269.2017.1336350
Monteiro, M. R., Kugelmeier, C. L., Pinheiro, R. S, Batalha, M. O, and César, A. S. (2018). Glycerol from biodiesel production: technological paths for sustainability. Renew. Sustain. Energy Rev. 88, 109–122. doi: 10.1016/j.rser.2018.02.019
Nabi, M. N. (2010). Theoretical investigation of engine thermal efficiency, adiabatic flame temperature, NOx emission and combustion-related parameters for different oxygenated fuels. Appl. Thermal Eng. 30, 839–844. doi: 10.1016/j.applthermaleng.2009.12.015
Pozarlik, A., Bijl, A., Alst, N. V., Bramer, E., and Brem, G. (2015). “Pyrolysis oil utilization in 50 KWe gas turbine,” in 18th IFRF Members' Conference–Flexible and Clean Fuel Conversion to Industry (Freising), 1–10.
Rezzoug, S. A., and Capart, R. (2002). Liquefaction of wood in two successive steps: solvolysis in ethylene-glycol and catalytic hydrotreatment. Appl. Energy 72, 631–644. doi: 10.1016/S0306-2619(02)00054-5
Sallevelt, J. L. H. P., Gudde, J. E. P., Pozarlik, A. K., and Brem, G. (2014). The impact of spray quality on the combustion of a viscous biofuel in a micro gas turbine. Appl. Energy 132, 575–585. doi: 10.1016/j.apenergy.2014.07.030
Seljak, T., and Katrašnik, T. (2016). Designing the microturbine engine for waste-derived fuels. Waste Manag. 47, 299–310. doi: 10.1016/j.wasman.2015.06.004
Seljak, T., and Katrašnik, T. (2019). Emission reduction through highly oxygenated viscous biofuels: use of glycerol in a micro gas turbine. Energy 169, 1000–1011. doi: 10.1016/j.energy.2018.12.095
Seljak, T., Kunaver, M., and Katrašnik, T. (2014). Emission evaluation of different types of liquefied wood. J. Mech. Eng. 60, 221–231. doi: 10.5545/sv-jme.2013.1242
Seljak, T., Oprešnik, S. R., Kunaver, M., and Katrašnik, T. (2012). Wood, liquefied in polyhydroxy alcohols as a fuel for gas turbines. Appl. Energy 99, 40–49. doi: 10.1016/j.apenergy.2012.04.043
Tzanetis, K. F., Posada, J. A., and Ramirez, A. (2017). Analysis of biomass hydrothermal liquefaction and biocrude-oil upgrading for renewable jet fuel production: the impact of reaction conditions on production costs and GHG emissions performance. Renew. Energy 113, 1388–1398. doi: 10.1016/j.renene.2017.06.104
Verma, P., Jafari, M., Rahman, S. M. A., Pickering, E., Stevanovic, S., Dowell, A., et al. (2020). The impact of chemical composition of oxygenated fuels on morphology and nanostructure of soot particles. Fuel 259, 116–167. doi: 10.1016/j.fuel.2019.116167
Keywords: bioliquids, oxygenated fuels, emissions, particulate matter, gas turbine, waste-derived fuels, combustion
Citation: Rosec Ž, Dias V, Contino F, Katrašnik T and Seljak T (2020) Comparative Analysis of Bio-Intermediates and Waste-Derived Fuels in Experimental Gas Turbine. Front. Mech. Eng. 6:71. doi: 10.3389/fmech.2020.00071
Received: 30 March 2020; Accepted: 21 July 2020;
Published: 10 September 2020.
Edited by:
Mattias Richter, Lund University, SwedenReviewed by:
Christer Fureby, Lund University, SwedenKhanh Duc Cung, Southwest Research Institute (SwRI), United States
Copyright © 2020 Rosec, Dias, Contino, Katrašnik and Seljak. This is an open-access article distributed under the terms of the Creative Commons Attribution License (CC BY). The use, distribution or reproduction in other forums is permitted, provided the original author(s) and the copyright owner(s) are credited and that the original publication in this journal is cited, in accordance with accepted academic practice. No use, distribution or reproduction is permitted which does not comply with these terms.
*Correspondence: Tine Seljak, dGluZS5zZWxqYWtAZnMudW5pLWxqLnNp