 A. Tiwari
 T. Tolpekina3
 M. K. Gunnewiek
 B. N. J. Persson
- 1PGI-1, FZ Jülich, Jülich, Germany
- 2MultiscaleConsulting, Jülich, Germany
- 3Apollo Tyres Global R&D, Enschede, Netherlands
We study the influence of the surface energy and contamination films on rubber adhesion and sliding friction. We find that there is a transfer of molecules from the rubber to the substrate which reduces the work of adhesion and makes the rubber friction insensitive to the substrate surface energy. We show that there is no simple relation between adhesion and friction: adhesion is due to (vertical) detachment processes at the edge of the contact regions (opening crack propagation), while friction in many cases is determined mainly by (tangential) stick-slip instabilities of nanosized regions, within the whole sliding contact. Thus while the pull-off force in fluids may be strongly reduced (due to a reduction of the work of adhesion), the sliding friction may be only slightly affected as the area of real contact may be dry, and the frictional shear stress in the contact area nearly unaffected by the fluid.
1 Introduction
The friction and adhesion between rubber materials and a counter surface have many practical applications, e.g., for tires, conveyor belts, rubber seals, and pressure-sensitive adhesives. The adhesion and friction of rubber is a very complex topic because of the temperature and frequency dependency and the non-linearity of the stress-strain relation. In addition, all solids have surface roughness, usually extending from the linear size of the object down to atomic distances, which strongly influence the contact mechanics (Heinrich and Klüppel, 2002; Persson, 2006; Israelachvili, 2011; Persson, 2013; Persson, 2014; Gnecco and Meyer, 2015; Heinrich and Vilgis, 2015; Barber, 2018).
In this, paper we will study the influence of the substrate surface energy on adhesion and friction. We use surfaces with the same topography but different surface energy, namely smooth and sandblasted glass surfaces with and without hydrophobic coating (monolayers of grafted molecules). We will also study how rubber transfer to the track may influence the friction for another rubber compound sliding on the surface contaminated by the first compound.
This paper is organized as follows. In Section 2, we present a qualitative discussion about rubber friction. In Section 3, we describe the rubber compounds used in the study. In Section 4, we show the surface roughness power spectra of the sandblasted glass surfaces, and of a smooth and a rough rubber surface. Section 5 describe the procedure used to prepare hydrophobic glass surfaces. In Section 6, we present adhesion results between clean and silanized glass balls and rubber, which illustrate the influence on the adhesion by contamination films, formed by the transfer of molecules from the rubber to the glass surface. In Section 7, we present Fourier-transform infrared spectroscopy data, which shows that the contamination film is a wax added to the rubber to protect against ozone. Similarly, during the sliding of rubber blocks, contamination films (derived from the rubber) form on the countersurface, even for the silanized glass surfaces. This is discussed in Section 8, where we present experimental results for the velocity dependent friction coefficient for rubber blocks sliding on smooth and sandblasted glass surfaces, both “clean” and silanized. We will also study how the transfer of molecules from a rubber compound A to a concrete surface influence the friction for another rubber compound B on the surface contaminated by the compound A. Section 9 present a discussion, and Section 10 the summary and conclusion.
2 Rubber Friction: Qualitative Discussion
Figure 1 shows schematically the contribution to the friction coefficient
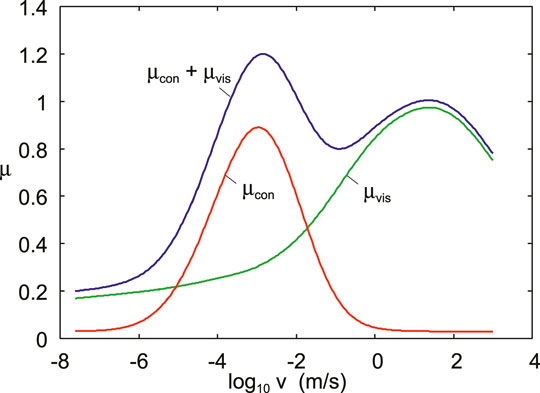
FIGURE 1. The contribution to the friction coefficient from viscoelastic deformations
The contribution from the area of real contact may involve shearing a thin contamination film, or processes where polymer segments (or nanosized rubber patches) undergoes cyclic stick-slip events (Schallamach, 1963; Chernyak and Leonov, 1986; Persson and Volokitin, 2006), or wherehard filler particles at the rubber surface scratches the substrate (plowing friction). The viscoelastic contribution to the friction result from the time-dependent deformations of the rubber by the substrate asperities, and occurs on many length scales (Persson, 2001). In what follows we will focus mainly on the contribution to the friction from the area of real contact.
We can write
Figure 2 shows schematically the contribution to the friction from the area of real contact, which depends on surface energies, contamination films and the location of slip (or shear) planes. In (A) a thin, strongly bound, contamination film (usually water and polar molecules with a hydrocarbon part) occur on the surface. In (B) a thicker contamination film occur, which could result from transfer of molecules from the rubber to the glass surface. In (C) the glass surface is silanized, and hence covered by an inert grafted monolayer (pink region), which may result in slip between the contamination film and the silanized surface.
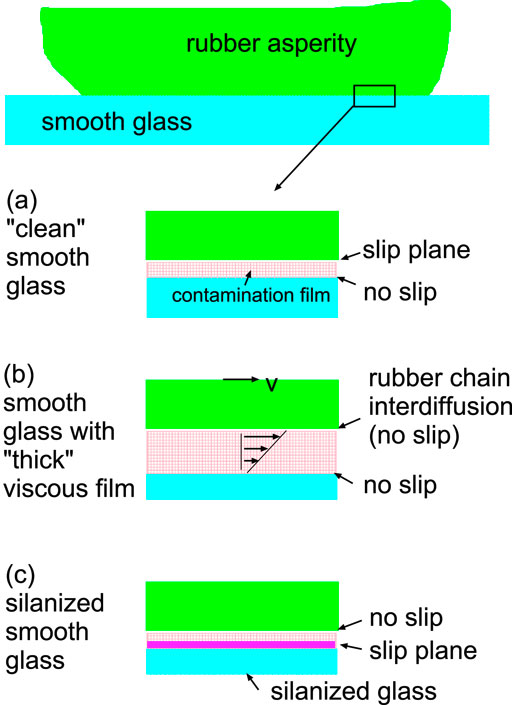
FIGURE 2. The contribution to the friction from the area of real contact depends on surface energies, contamination films and slip (or shear) planes. In (A) a thin strongly bound contamination film occur on the substrate surface. In (B) a thicker contamination film occur, e.g. due to transfer of molecules from the rubber to the glass surface. In (C) the glass surface is silanized which may result in slip between the contamination film and the silanized glass surface (pink).
If the contamination film is very thin (some nanometers), and the molecules bound strongly enough to the substrate surface (here glass), slip will occur between the rubber and the contamination film (see Figure 2A). In this case the contribution from the area A of real contact to the friction may involve interfacial processes where polymer segments, or nanosized patches of the rubber, attach, stretch, snap-off and re-attach to the substrate. During the rapid snap-off the elastic energy in the stretched polymer chains are converted into heat. Theoretical (Schallamach, 1963; Chernyak and Leonov, 1986; Persson and Volokitin, 2006) and experimental (Tiwari et al., 2017; Tiwari et al., 2018) studied have shown that this result in a frictional shear stress which is well approximated by a Gaussian-like function of the logarithm of the sliding speed v, with a width of order several decades in velocity:
where
If the contamination film is thicker (see Figure 2B) it may behave as a (usually shear thinning) viscous fluid, and the shear stress acting on the rubber surface will be determined by the viscosity (and shear rate) of the fluid:
where B is a shear-thinning constant and
For a silanized glass surface (see Figure 2C) some of the slip may be localized to the interface between the hydrophobic coating and the contamination film (Rotella et al., 2020), but the experimental results presented below indicate that the main slip again occur either within the contamination film or at the interface between the rubber and the contamination film. We will show below that the contamination film may be derived mainly from the rubber rather than from other origins.
If the substrate is perfectly smooth there is no viscoelastic contribution
3 Rubber Compounds
We have used three different rubber compounds denoted A, B and C. B is a summer tread compound filled with carbon black. A is a summer tread compound filled with silica and containing a traction resin. C is a winter tread compound, filled with silica and containing a traction resin (same as in A in the same quantity).
Table 1 gives a summary of the glass transition temperature
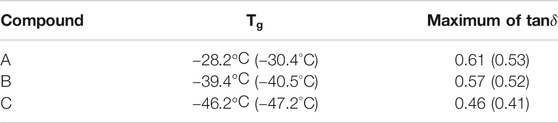
TABLE 1. Summary of the glass transition temperatures of the A, B and C compounds. The glass transition temperature is defined as the maximum of
4 Surface Roughness Power Spectrum
The surface roughness is of crucial importance for the sliding friction (Persson et al., 2004; Persson, 2014). The most important quantity is the surface roughness power spectrum. The two-dimensional (2D) surface roughness power spectrum
The smooth glass surface can be considered as perfectly smooth with vanishing surface roughness power spectrum. We prepared several sandblasted glass surfaces. The glass plates (16 cm × 36 cm and 0.5 cm thick) where sandblasted “by hand” for 5 min each. This may result in some variation in the surface topography but the surface roughness power spectrum of the plates are nearly identical (see Figure 3A). The power spectra shown in Figure 3A was calculated from 25 mm long line scans, and averaged over five different line scans obtained at different locations on the glass surfaces.
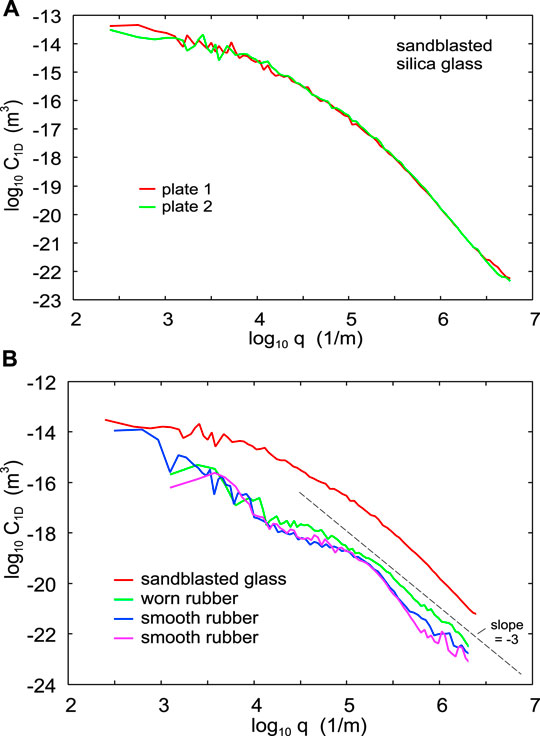
FIGURE 3. (A) The 1D surface roughness power spectrum of the sandblasted glass plate 1 (red) and glass plate 2 (green). The rms roughness of both plates is
We also measured the surface topography of a rubber surface before and after sliding it on the sandblasted glass surface. Sliding on the sandblasted surface resulted in some wear and increased surface roughness. Figure 3B shows the power spectra of the smooth (before tests) rubber surface (blue and pink), and of the rubber surface after the sliding friction measurements on the sandblasted surface (green). The figure also shows the surface roughness power spectrum of the sandblasted glass surface (red), as obtained from the average over the two power spectra shown in Figure 3B. The root-mean-square (rms) roughness of the sandblasted glass surface is
5 Preparation of Silanized Glass Surfaces
We have prepared silanized (hydrophobic) glass surfaces using Rain-X. Rain-X is most commonly used on glass automobile surfaces, and result in a hydrophobic coating which causes water to bead. Rain-X’s primary active ingredient are polysiloxanes, the primary one being hydroxy-terminated polydimethylsiloxane. The polysiloxanes have functional groups that bind to the hydroxyl group of the glass surface. In addition Rain-X contains acetone and water, but the exact ratio is a trade secret.
The glass surfaces was first cleaned with acetone and isopropanol, and then ultrasonic cleaned in distilled water. After drying the surface with a paper towel we immediately applied the Rain-X. Next the glass surface was wiped with a paper towel for 5 min using a firm, circular and overlapping motion. Finally, the coated surface was left for 24 h, washed with distilled water and dried. In addition, in a few studies the silanized glass surfaces were ultrasonic cleaned in distilled water to make sure just a monolayer of chemically attached polydimethylsiloxane molecules occur on the glass surface.
Figure 4 shows the water contact angle on a glass surface cleaned with acetone and isopropanol (left), and a glass surface covered by hydrophobic monolayer (right) using Rain-X.
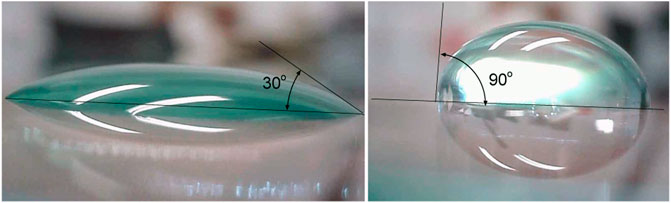
FIGURE 4. Water contact angle of glass surface cleaned with acetone and isopropanol (left), and silanized glass surface i.e., a glass surface covered by hydrophobic grafted monolayer (right).
6 Role of Contamination on Adhesion
We have performed adhesion experiments where a glass ball with a few cm diameter is moved repeatedly up and down making first repulsive contact with the rubber substrate (typical repulsive force 0.1 N) and then pulled-off (Tolpekina and Persson, 2019). The glass ball was cleaned with acetone just before start of the experiment, and moved up and down with the vertical speed
The rubber surface is either smooth (but with some roughness due to the roughness of the mold) or roughened by sandpaper P180. The smooth rubber surfaces were cleaned with hot water just before the start of the experiments. This removed a gray film from the rubber surface (probably wax, see Section 7), and made the rubber surfaces appear shining black, but after a few hours the rubber surface appeared gray again. This shows that mobile molecules diffuse to the rubber surface from inside the rubber, which probably is the origin of the time dependency of the adhesion observed below.
Figure 5A shows the interaction force between a glass ball and the rubber compound A as a function of time. Results are shown in dry condition (red) and when immersed in water (green).
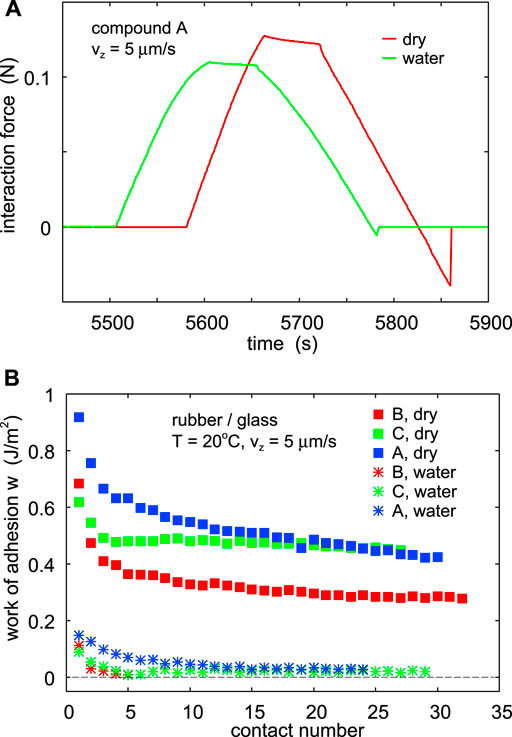
FIGURE 5. (A) The interaction force between a glass ball and the rubber compound A as a function of time. Results are shown in dry condition (red) and when immersed in water (green). The rubber surface was cleaned with hot water and the glass ball with acetone. The glass ball moved up and down with the speed
Figure 5B shows the work of adhesion between an (originally) cleaned glass ball and the rubber compound B, C and A for dry contact and in water. Note the continuous decrease in the work of adhesion with the number of contacts (and hence increasing time) which we attribute to diffusion of mobile molecules to the rubber surface and to transfer of molecules from the rubber to the glass surface. This is observed even in water. Note also that adhesion in water is much smaller than in the dry state.
We have performed a set of experiments using rubber from a new (nominally identical) batch produced one year after the rubber used in Figure 5B. Figure 6 shows the work of adhesion between a glass ball and the rubber compound C for dry contact (squares) and in water (stars). In (A) the rubber surface is smooth and cleaned with hot water just before start of the experiment. In (B) the rubber surface was roughened by sandpaper just before start of the experiment. The red symbols are for a glass ball cleaned with acetone and isopropanol. The green symbols are for a silanized glass ball prepared using Rain-X (see Section 5).
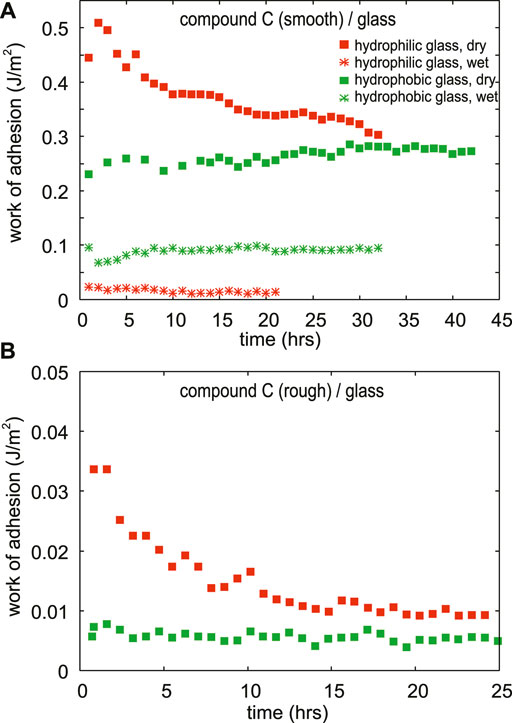
FIGURE 6. The work of adhesion between a glass ball and the rubber compound C for dry contact (squares) and in water (stars). In (A) the rubber surface is smooth and cleaned with hot water just before start of the experiment. In (B) the rubber surface was roughened by sandpaper just before start of the experiment. The red symbols are for a glass ball cleaned with acetone and isopropanol. The green symbols are for a silanized glass ball prepared using Rain-X. The pull-off speed
Note that for the roughened rubber surface the (macroscopic) adhesion nearly vanish (see Figure 6B). This is due to the reduction in the area of real contact, and (more importantly) due to the elastic deformation energy stored at the interface which is “given back” during pull-off, and help to break the adhesive bonds. However, even when there is no macroscopic pull-off force, at short enough length scale adhesion is still strong, and result in an increase in the contact area (Persson et al., 2008).
Figure 6A shows that for the smooth rubber surface the work of adhesion in the dry state is initially much larger for the clean glass ball than for the silanized glass ball, which we mainly attribute to a larger surface energy of the clean glass ball then the silanized ball. However, the rubber surface is not perfectly smooth and the surface roughness will affect (reduce) the work of adhesion and this effect may differ for the two cases.
For the (initially) clean glass ball the work of adhesion decreases with increasing number of contacts which we attribute to a decrease in the surface energy of the glass ball due to transfer of molecules from the rubber to the glass ball. For the silanized glass ball the work of adhesion is nearly constant, both in the dry state and in water. This could indicate that no molecules are transferred from the rubber to the silanized glass ball. However, with increasing number of contacts the work of adhesion for the (originally clean) glass ball approach the work of adhesion for the silanized glass ball, so that even if molecules are transferred to the silanized glass ball they may result in a negligible change in the ball surface energy. Since the transferred molecules most likely are wax molecules (see Section 7) this is not unexpected due to the inert nature of wax.
In water there is a huge difference between the clean glass ball and the silanized glass ball. For the clean glass ball the adhesion nearly vanish which result from the hydrophilic nature of the glass surface (water molecules bind strongly to the glass surface) which, in the case of complete wetting, favor a thin (nanometer or less) water film between the glass and the rubber in the rubber-glass contact region, resulting in nearly vanishing adhesion. The silanized glass surface is hydrophobic and the water does not like (from an energetic point of view) to stay between the rubber and the glass surface, i.e., a dewetting transition occurs, resulting in strong adhesion even in water.
7 Infrared Spectroscopy of Contamination Film
We have performed Fourier-transform infrared (FTIR) spectroscopy from the contamination film left on the glass surface after (sliding) contact with the rubber. In Figure 7 we show the FTIR spectra from (A) a not-cleaned rubber surface (compound A), and in (B) from a rubber surface cleaned with acetone, and in (C) from the contamination film left on a glass surface after sliding of compound A. The FTIR spectra of the anti-ozone wax, which is added to the rubber compounds, is shown in Figure 7D. We conclude that the contamination film on the glass surface (and on the rubber surface) is a wax, which is added to protect the rubber against ozone. The wax molecules are mobile in the rubber matrix and even if removed from the surface of the rubber using, e.g., acetone or hot water, it will rapidly diffuse to the surface of the rubber where it form a thin film which protect the rubber against the influence of ozone (Akrochem, 2020).
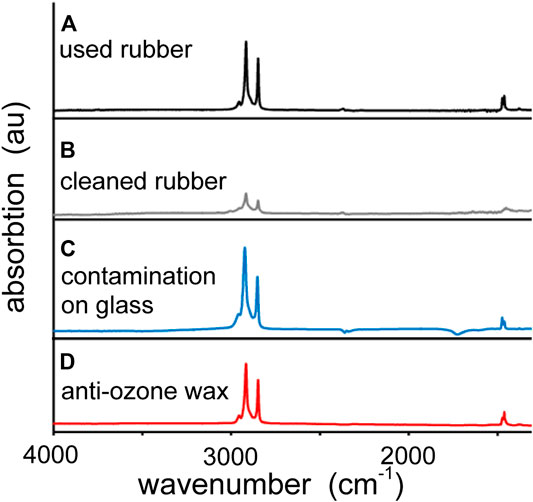
FIGURE 7. Surface contamination of the rubber compound A. The infrared absorption spectra from (A) a not-cleaned rubber surface, (B) a rubber surface cleaned with acetone, (C) the contamination film left on a glass surface after sliding of compound A and (D) anti-ozone wax.
8 Sliding Friction on Smooth and Sandblasted Hydrophilic and Hydrophobic Glass
In this section we present results for the friction force when rubber blocks are sliding on smooth (Section 8.1 and 8.3) and sandblasted (Section 8.2) glass surfaces which are either clean and hydrophilic, or made hydrophobic as described in Section 5. We also study how the transfer of rubber to a concrete surface may influence the friction for another rubber compound on the surface contaminated by the first compound (Section 8.4). We note that rubber friction measurements on smooth substrates are very sensitive to the thickness and nature of contamination films, and to (unavoidable) variations in the roughness of the rubber block. Thus, we observe relative large variations in the friction force when repeating the experiments under nominally identical conditions. In what follows we therefore focus mainly on general trends rather than exact numerical values of the friction coefficients. Sliding friction measurements on rough surfaces, e.g., concrete surfaces, are much easier to perform, and result in more reproducible results.
8.1 Sliding Friction on Smooth Glass Surfaces
We have studied the rubber sliding friction on smooth and sandblasted glass surfaces using the Leonardo da Vinci set up (see Tolpekina and Persson, 2019). We have used clean glass and silanized glass surfaces and studied both dry and wet friction.
Figure 8A shows the measured friction coefficient for the compound A on smooth silica glass plates as a function of the logarithm of the sliding speed. The red symbols are the measured friction coefficient on a glass surface ultrasonic cleaned in water. The green symbols was obtained on the same type of glass plate cleaned in the same way and then covered by an inert monolayer film using Rain X. The blue symbols is for a thick film of Rain X. The nominal contact pressure p = 0.006 MPa and the temperature T = 20°C.
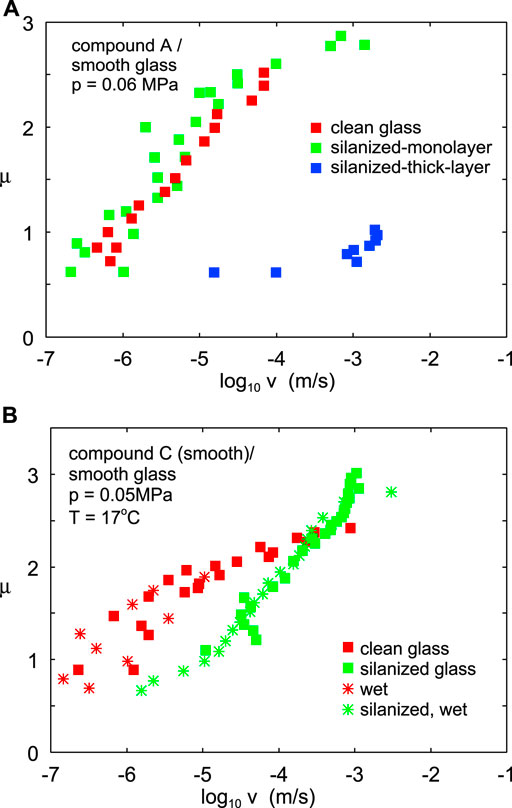
FIGURE 8. (A) The measured friction coefficient for compound A on smooth silica glass plates as a function of the logarithm of the sliding speed. The red symbols are the measured friction coefficient on a glass surface ultrasonic cleaned in distilled water. The green symbols was obtained on the same type of glass plate cleaned in the same way and then covered by an inert monolayer film using Rain X. The blue symbols is for a thick film of Rain X. The nominal contact pressure p = 0.06 MPa and the temperature T = 20°C. (B) The measured friction coefficient for compound C on smooth silica glass plates as a function of the logarithm of the sliding speed. The rubber surface was cleaned in hot water and then dried just before start of the experiment. The squares are for dry surfaces and the stars in water. The red symbols are the measured friction coefficient on a glass surface cleaned by ultrasound in water. The green symbols was obtained on the same type of glass plate cleaned in the same way and then covered by an inert thin film using Rain X. The nominal contact pressure p = 0.05 MPa and the temperature T = 17°C.
Note that the friction coefficient before run-away is the same on the “clean” and (monolayer) silanized glass surface, but extend to higher sliding speeds for the silanized surface. Optical (reflected light at grazing incidence) pictures of the glass surfaces after the friction studies shows that a very thin contamination film is transferred from the rubber to the glass surface, probably already at the front edge of the rubber-glass asperity contact regions. We propose that the friction is due to sliding on, or shearing of, this transfer film which is effectively pinned at the glass surface, even for the silanized glass surfaces.
That a thin molecular film is transferred from the rubber to the countersurface even for silanized glass was also proved by letting a small water droplet slide on the tilted glass surface: the droplet moved quickly on the silanized glass surface in the regions which had not been in contact with the rubber, but stopped to move, or moved in a slow and irregular way, on the regions of the glass surface which had been in sliding contact with the rubber. As shown in Section 7 the contamination film is a wax.
For the silanized glass surface which was not washed (cleaned) with distilled water after being exposed to the Rain X liquid, we observed much lower friction than for the monolayer silanized surface (see Figure 8A). We attribute this to a relative thick (maybe micrometer) film of polydimethylsiloxane, which act as a viscous lubrication film resulting in a hydrodynamical (but shear thinning) frictional shear stress as indicated in Figure 2B.
Figure 8B shows similar results as in Figure 8A but now for the compound C. The squares are for dry surfaces and the stars in water. The red symbols are the measured friction coefficient on a glass surface cleaned by ultrasound in water. The green symbols was obtained on the same type of glass plate cleaned in the same way and then covered by an inert thin film using Rain X.
For the compound C the friction coefficient on the dry silanized glass surface is lower at low sliding speed than for the clean glass surface, but larger at the highest sliding speeds. Again we believe a very thin contamination film (maybe just a few monolayers) is transferred from the rubber to the glass surface already at the front edge of the rubber-glass asperity contact regions, and the friction is due to shearing of this film. The lower friction on the silanized surface indicate that some slip may occur between the contamination film and the silanized glass surface, at least at low sliding speed.
For the compound C (smooth) we observe before run-away the same friction coefficient in water as on the dry surface for both the clean glass surface and the silanized glass surface (see Figure 8B). This indicate that in both cases the water is removed from the rubber-glass interface. This is expected for the silanized glass surface which is hydrophobic. In fact, Figure 6A shows that for the silanized glass the rubber-glass adhesion in water is very strong. However, for the clean glass surface the adhesion in water is very weak, but the friction for low sliding speeds is the same as for the dry surface. We believe this is due to a combination of fluid squeeze-out by the applied normal pressure, and dewetting driven by the (small) adhesion observed also in water (see Figure 6A). Note, however, that for the clean glass surface the sliding in water is stable only for sliding speeds
We note that surface roughness can have a strong influence in determining the transition from dry (or boundary lubricated) contact to the hydrodynamic (run-away) regime. For an elastically soft material like rubber this transition may involve deformations of the asperities by the hydrodynamic pressure as described by micro-elastohydrodynamics (Scaraggi et al., 2011).
We have repeated the experiment for compound C (not shown) and found more noisy results than in Figure 8B, but qualitatively the same behavior except that for hydrophobic glass in water the run-away occurred at much lower friction coefficient than found above (
Figure 9 shows the measured friction coefficient for compound C (rough) on smooth silica glass plates as a function of the logarithm of the sliding speed. The rubber surface was roughened by sand paper. The squares and triangles are for dry surfaces and the stars in water. The red symbols are the measured friction coefficient on a glass surface cleaned by ultrasound in water. The green symbols was obtained on the same type of glass plate cleaned in the same way and then covered by an inert thin film using Rain X.
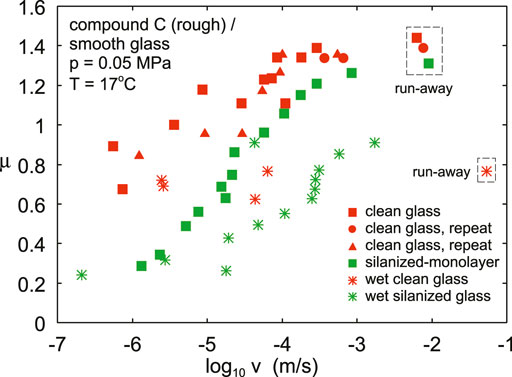
FIGURE 9. The measured friction coefficient for compound C on smooth silica glass plates as a function of the logarithm of the sliding speed. The rubber surface was roughened by sand paper. The squares are for dry surfaces and the stars in water. The red symbols are the measured friction coefficient on a glass surface cleaned by ultrasound in water. The green symbols was obtained on the same type of glass plate cleaned in the same way and then covered by an inert thin film using Rain X. The nominal contact pressure p = 0.05 MPa and the temperature T = 17°C.
Note that for the dry clean and silanized glass surfaces the velocity dependency of the friction coefficient for the roughened rubber surface (Figure 9) is similar to for the smooth rubber surface (Figure 8B), but the friction coefficient is smaller for the rough rubber surface as expected because of the smaller area of real contact. However, in water the results are very different. Thus for the clean glass surface the friction is only weakly velocity dependent, and similar in magnitude to the sliding friction on the dry surface at the lowest sliding speed. For the hydrophobic glass surface the friction in water is smaller than for the dry state but exhibit a similar velocity dependency. The reduction in the friction coefficient in water for the rough rubber surface may be due to water trapped in sealed-off regions which carry part of the external load, and hence reduces the area of real contact. In the present case the applied squeezing pressure is not high, but the local pressure in asperity contact regions will be high and, at short enough length scale, the contact area may percolate in the asperity contact regions, resulting in water filled sealed-off regions (see Figure 10).
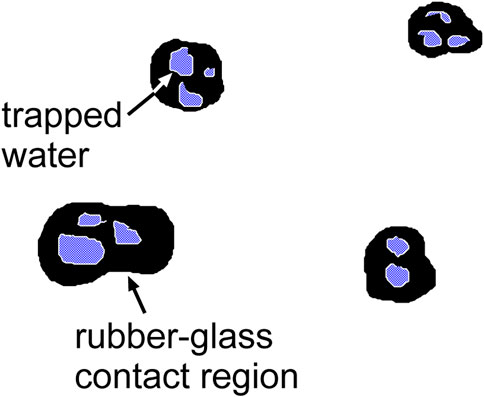
FIGURE 10. Rubber-glass asperity contact regions in water. At short enough length scale the contact pressure becomes so high that the contact area (locally) percolate. When the contact is formed in water, pressurized water may occur in the sealed-off regions. In this case part of the external load will be carried by the water resulting in a reduced rubber-glass contact area and a reduced sliding friction.
8.2 Sliding Friction on Sandblasted Glass Surfaces
Figure 11A shows the measured friction coefficient for compound C sliding on a sandblasted silica glass plate as a function of the logarithm of the sliding speed. The squares are for dry surfaces and the stars in water. The red symbols are the measured friction coefficient on a glass surface ultrasonic cleaned in water and then with distilled water. The green symbols was obtained on the same type of glass plate cleaned in the same way, and then covered by an inert monolayer film using Rain X.
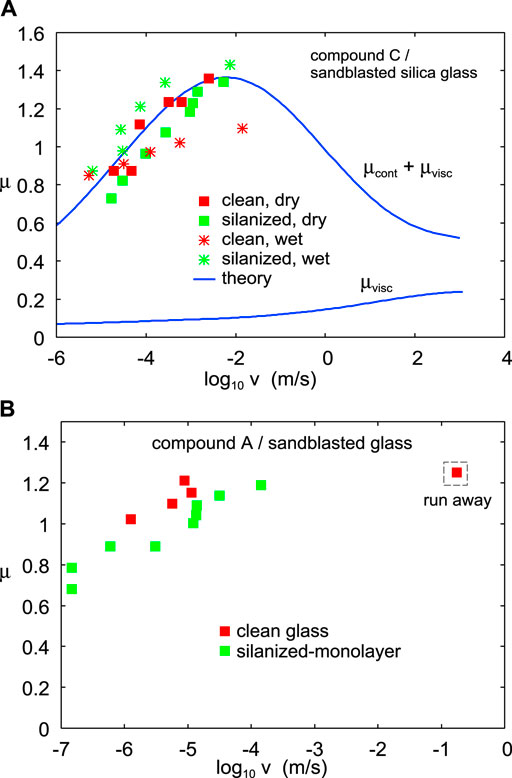
FIGURE 11. (A) The measured friction coefficient for compound C on sandblasted silica glass plates as a function of the logarithm of the sliding speed. The squares are for dry surfaces and the stars in water. The red symbols are the measured friction coefficient on a glass surface ultrasonic cleaned in water. The green symbols was obtained on the same type of glass plate cleaned in the same way), and then covered by an inert thin film using Rain X. The nominal contact pressure p = 0.05 MPa and the temperature T = 22°C. The blue lines are the theoretically predicted viscoelastic contribution
The friction coefficient is very similar for the clean and silanized glass surfaces in spite of the fact that the work of adhesion for the (smooth) clean glass is twice as high as for the silanized glass surface (see Figure 6). This indicate again the transfer of a contamination film to the glass surface from the rubber and that the film is effectively pinned at the glass interface even for the silanized glass surface. For sliding in water, for the low sliding speed prevailing in the experiments, the water is likely to be squeezed out from the asperity contact regions. In this case it appears as if no islands of trapped (sealed-off) water occur. This may be due to the increased surface roughness which result in a smaller contact area and in larger non-contact channels where the water can be removed.
Figure 11B shows the measured friction coefficient for compound A on sandblasted silica glass plates as a function of the logarithm of the sliding speed. Again the rubber friction on the clean glass surface and the silanized glass is nearly the same. We note that on the sandblasted glass surface there will be a viscoelastic contribution to the friction, which does not exist on the smooth glass surfaces even when the rubber surface is rough.
8.3 Results Obtained Using a Linear Friction Slider
We have also performed friction studies using a (low-temperature) linear friction tester (see Tolpekina and Persson, 2019). Figure 12A shows the friction coefficient as a function of the logarithm of the sliding speed for the compound B on a dry smooth glass surface cleaned by acetone and isopropanol and then ultrasonic cleaned in distilled water (red), and on a hydrophobic (silanized) glass surface (green). The rubber block surface is roughened by sand paper, which removes a thin surface layer of rubber, which may have different properties from the bulk rubber.
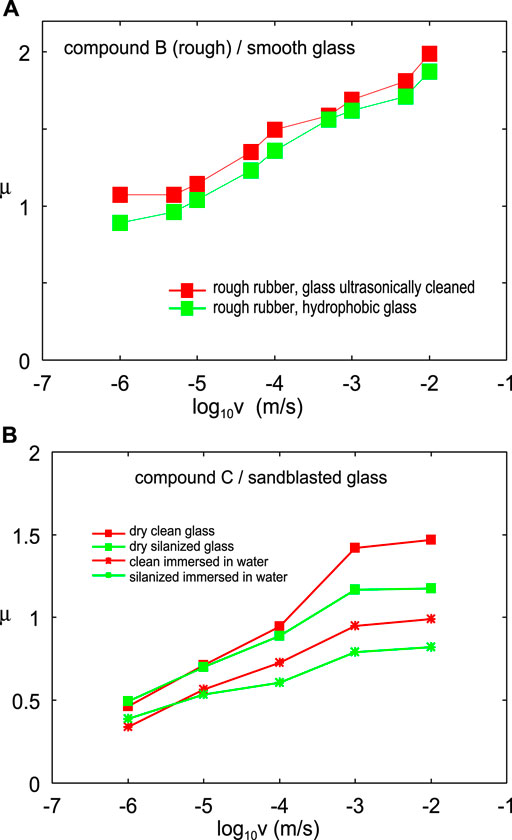
FIGURE 12. (A) The friction coefficient as a function of the logarithm of the sliding speed for the compound B. The red squares are on a dry glass surface cleaned by acetone and isopropanol and then ultrasonic cleaned in distilled water. The green squares are for a hydrophobic (silanized) glass. The rubber block surface is roughened by sand paper. The nominal contact pressure p = 0.06 MPa and the temperature T = 20°C. (B) The friction coefficient as a function of the logarithm of the sliding speed for the compound C on sandblasted glass. The red squares are on a dry glass surface cleaned by acetone and isopropanol and then ultrasonic cleaned in distilled water. The green squares are for a hydrophobic (silanized) glass. The square symbols are for dry contact and the stars in water. The nominal contact pressure p = 0.06 MPa and the temperature T = 20°C.
Note that in the present case the dry “clean” glass surface exhibit nearly the same friction as for the silanized surface, as also observed in the Leonardo da Vinci study (not shown).
Figure 12B shows the friction coefficient as a function of the logarithm of the sliding speed for the compound C on sandblasted glass. The red squares are on a dry glass surface cleaned by acetone and isopropanol and then ultrasonic cleaned in distilled water. The green squares are for a hydrophobic (silanized) glass. The square symbols are for dry contact and the stars in water. The friction coefficients are similar to obtained in Figure 11A using the Leonardo da Vinci set up but at the higher sliding speeds the hydrophobic glass gives slightly smaller friction than the clean glass, both in the dry state and in water. Also, in water the friction is smaller than in the dry state. We believe the difference between the results in water in Figures 11A, 12B is due to differences in the stiffness of the two experimental set-up and a (related) slight tilting of the rubber blocks which effect the removal of the water between the two surfaces.
8.4 Sliding Friction on Contaminated Concrete
It is often stated in F1-racing that transfer of rubber to the racing track can have a strong influence on the sliding friction or grip. In particular, when changing to new tires with a different rubber tread compound the friction can be reduced compared to clean road surface. In an earlier study we observed a strong drop in the friction when a rubber block was slid on a concrete surface contaminated by first sliding a block made from another rubber compound on the concrete surface (Tolpekina and Persson, 2019).
We have performed a set of experiments to study the role of rubber contamination films on rubber friction on a concrete surface. In the experiments we first run-in the rubber compounds A and B on two different concrete surfaces a and b. The run-in consisted of 11 forwards and backwards sliding events (sliding speed
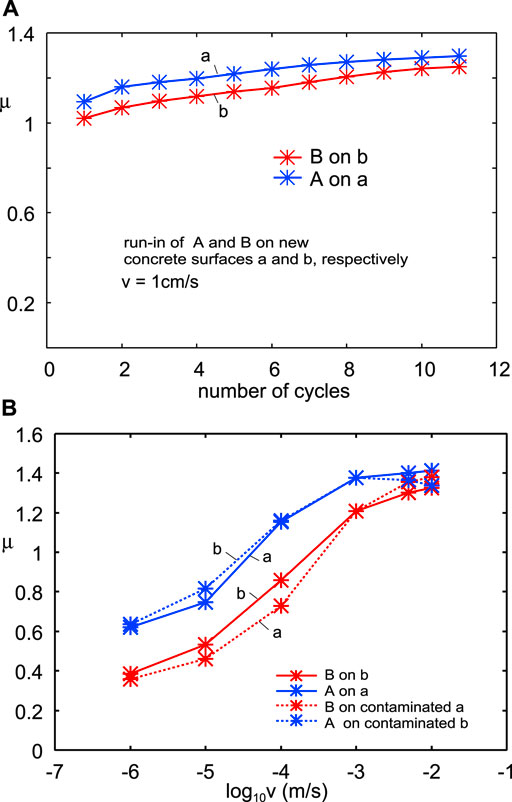
FIGURE 13. (A) The friction coefficient at the sliding speed
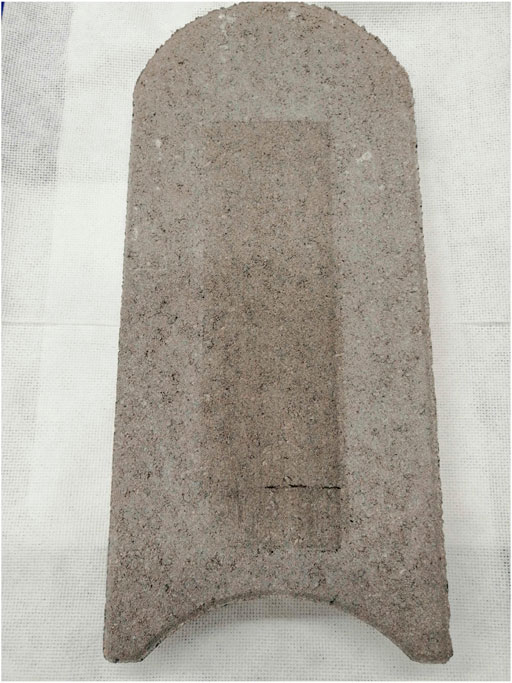
FIGURE 14. Picture of concrete block b after run-in of compound B.
Next we measured the friction force for compound B on surface b for sliding speeds from
Both compounds A and B wear partly by the formation of loose rubber wear particles, which are easily removed with a brush, and partly by the formation of a strongly bound smear film. In Tiwari et al. (2021) we observed that loose rubber wear particles form when the viscoelastic contribution dominate the friction, and a smear film when the adhesive contribution dominate the friction. In the present case calculations show that at the sliding speed
We have shown that the friction changes very little when sliding compound B on the concrete surface first contaminated by compound A, and the same was observed also in the opposite case. This indicate that either the contamination film is sheared as in Figure 2B, in which case the frictional shear stress may be independent of the rubber compound used, or the chain interdiffusion mentioned above may occur in a similar way for the compound B in contact with the transfer film from compound A as with the transfer film from compound B. Alternatively, during sliding of compound B on the concrete surface contaminated by the compound A there is a new transfer film of compound B deposited on the concrete surface which could result in a contact which is effectively the same in both cases.
9 Discussion
We have found above that for smooth and sandblasted glass surfaces the friction force for compounds A and B is nearly the same on the “clean” glass surfaces as on the silanized glass surfaces. For compound C the same is true on the sandblasted glass surface in the Leonardo da Vinci set up, but for the smooth glass surface the silanized surface exhibit lower friction at low sliding speed. Optical pictures show that molecules are transferred from the rubber to the glass surface, and FTIR spectra shows that the contamination film is a wax. If we assume that negligible slip occur at the interface between the contamination film and the clean or silanized glass surface, then the friction force will be the same on both glass surfaces. Only if we assume this to be the case is it possible to explain the great similarity in the observed friction coefficient on the two different surfaces for compounds A and B. Thus, for these compounds in both cases we propose that most of the slip may occur at the interface between the rubber and the contamination film (see Figure 2A), or result from shearing the lubrication film as in Figure 2B. On the silanized surface the contamination film binds weaker than on the clean surface but, nevertheless, it appear that in many cases there is negligible slip between the contamination film and the silanized glass surface. This differ from the result of a recent study where slip was observed between a rubber stopper and a glass barrel with baked-on silicone oil (Rotella et al., 2020).
In wet conditions the silanazed glass surface result in a higher maximum friction coefficient than the hydrophilic glass surface. We interpret this as resulting from forced wetting. In forced wetting the water is dragged into the contact by the sliding motion, resulting in viscous hydroplaning and a decreasing friction force with increasing sliding speed. Forced wetting is due to a competition between a liquid invasion induced by shear and spontaneous dewetting of the liquid driven by the (negative) spreading pressure.
For the clean glass surface the drop in the work of adhesion between dry contact and contact is in water (see Figure 5B) is much higher than the change in the friction force between dry and wet condition. Hence, there is no simple relation between adhesion (pull-off force) and sliding friction. This is easy to understand (see Figure 15) because the pull-off force depends on breaking the bonds in the normal direction at the edges of the contact region, while the frictional shear stress depends mainly on shearing the contact area, i.e., on processes occurring everywhere within the contact region. The latter may not even “know” that there is fluid (water) outside the asperity contact regions, which may strongly reduce the bond-breaking at the edges of the contact regions.
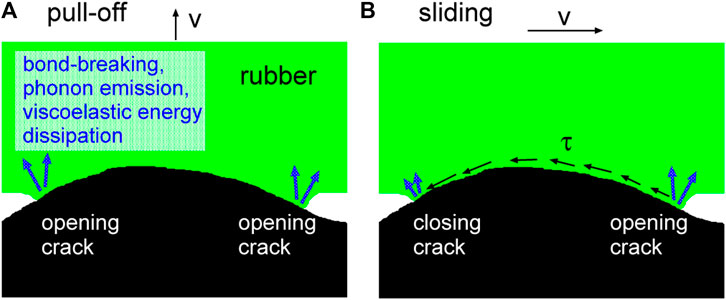
FIGURE 15. There is in general no simple relation between adhesion (pull-off force) and sliding friction (A) The pull-off force depends on breaking the bonds in the normal direction at the edges of the contact region (opening crack propagation) (B) The friction force depends on energy dissipation at the opening and closing crack tips, and in addition on shearing the area of real contact, i.e., on processes occurring everywhere within the contact region. In many cases this latter contribution will give the most important contribution to the friction force (Tiwari et al., 2017).
When the substrate has surface roughness (as in Figure 5B) there will also be a contribution to the friction from the opening crack tip on the exit side of the sliding rubber-substrate contact regions (Wang et al., 2020), but for small contacts the latter contribution will be reduced due to finite size effects (Persson, 2017), and experiments (Tiwari et al., 2017) indicate that, in most practical applications, the main contribution to the friction arises from the inner region of the asperity contact regions. We note, however, that Yoshizawa et al. have observed a relation between friction and adhesion hysteresis in surface forces apparatus measurements of surfactant monolayer-coated surfaces. This was shown by comparing the adhesion energy hysteresis during loading-unloading cycles with the friction forces measured under similar conditions (Yoshizawa et al., 1993). However, in their study they correlated the bond formation and bond breaking processes at the edges of the contact area (which determined the adhesion hysteresis) with similar bond formation and bond breaking processes everywhere within the contact area. These processes (which may involve chain interdiffusion) occur in a similar way if the pull-off speed and sliding speed are choosen so that similar time scales are involved in the bond formation and bond breaking processes in the adhesion as in the sliding friction.
10 Summary and Conclusion
In this article we have presented results for rubber adhesion and friction against glass in dry and wet conditions. The surface energy and topography of the glass surfaces were changed by applying hydrophobic coating (silanization) and sandblasting.
In many cases we found that changing the glass surface energy by silanizing does not affect the magnitude of rubber friction on the smooth and sandblasted glass surfaces. We believe that this is due to sliding on or shearing of a contamination film derived from the rubber, with negligible slip at the glass-contamination film interface, even for the silanized glass surfaces. This indicates that for dry surfaces substrate surface energy may be irrelevant for rubber friction in many practical cases. Infrared light absorption measurements show that the contamination film is a wax added to the rubber compounds to protect against ozone.
The magnitude of rubber friction for smooth glass depends on whether the rubber is smooth or roughened prior to friction measurements. Smooth rubber showed higher friction as compared to the roughened rubber. We attribute the decrease in the friction for roughened rubber to the reduced area of contact.
When rubber slides on a clean, smooth glass in the wet state, we observe runaway instabilities at low sliding speed. We attribute this to forced wetting, where water is dragged into the sliding interface during sliding motion.
When the rubber or countersurface are rough the rubber friction is lower in water than that in the dry state. We attribute this to trapped islands of pressurized water, which carry part of the external load and hence reduces the area of real contact. The trapped islands of water form at short enough length scales (observed at high enough magnification), where the rubber-substrate contact area percolate.
We have shown that the transfer of rubber to a concrete track has only a small influence on the friction for another rubber compound and vice versa. However, more studies of this, using rubber compounds with more prominent differences in the chemical composition, are necessary to determine how general this conclusion is.
Our study demonstrates that there is no simple relation between adhesion and friction. Thus, adhesion is due to (vertical) detachment processes at the edge of the contact regions (opening crack propagation), while friction in many cases is determined mainly by (tangential) stick-slip instabilities within the whole sliding contact.
Data Availability Statement
The raw data supporting the conclusions of this article will be made available by the authors, without undue reservation.
Author Contributions
AT—Designed and carried out experiments. Analyzed the data. BP—Supervision of the research project. Helped in design of experiments, data interpretation and wrote the manuscript, TT—Technical input in discussion of the results and improving the manuscript. HB—Technical input in discussion of the results and improving the manuscript. Provided the rubber compound for testing. MG—Spectroscopy experiments and interpretation. All authors contributed to the article and approved the submitted version.
Conflict of Interest
Authors AT, BP were employed by the company MultiscaleConsulting and Authors TT, HB and MG were employed by the company Apollo Tyres Global R&D.
The remaining authors declare that the research was conducted in the absence of any commercial or financial relationships that could be construed as a potential conflict of interest.
References
Akrochem (2020). Available at: https://www.akrochem.com/pdf/technical_papers/waxes_for_ozone_solutions.pdf.
Carbone, G., Lorenz, B., Persson, B. N., and Wohlers, A. (2009). Contact mechanics and rubber friction for randomly rough surfaces with anisotropic statistical properties. Eur. Phys. J. E Soft Matter 29, 275–284. doi:10.1140/epje/i2009-10484-8
Chernyak, Y. B., and Leonov, A. I. (1986). On the theory of the adhesive friction of elastomers. Wear 108, 105–138. doi:10.1016/0043-1648(86)90092-x
Gnecco, E., and Meyer, E. (2015). Elements of friction theory and nanotribology. Cambridge, United Kingdom: Cambridge University Press.
Heinrich, G., and Klüppel, M. (2002). Filled elastomers drug delivery systems. New York, NY: Springer, 1–44. Recent advances in the theory of filler networking in elastomers.
Heinrich, G., and Vilgis, T. A. (2015). A statistical mechanical approach to the payne effect in filled rubbers. Express Polym. Lett. 9 26. doi:10.3144/expresspolymlett.2015.26
Martin, A., Clain, J., Buguin, A., and Brochard-Wyart, F. (2002). Wetting transitions at soft, sliding interfaces. Phys. Rev. E Stat. Nonlin Soft Matter Phys. 65, 031605. doi:10.1103/PhysRevE.65.031605
Nayak, P. R. (1971). Random process model of rough surfaces. J. Lubric. Technol. 93, 398. doi:10.1115/1.3451608
Persson, B. (2001). Theory of rubber friction and contact mechanics. J. Chem. Phys. 115, 3840–3861. doi:10.1063/1.1388626
Persson, B. (2017). Crack propagation in finite-sized viscoelastic solids with application to adhesion. EPL 119, 18002. doi:10.1209/0295-5075/119/18002
Persson, B. (2014). On the fractal dimension of rough surfaces. Tribol Lett. 54, 99–106. doi:10.1007/s11249-014-0313-4
Persson, B., Lorenz, B., Shimizu, M., and Koishi, M. (2016). “Multiscale contact mechanics with application to seals and rubber friction on dry and lubricated surfaces,” in Designing of elastomer nanocomposites: from theory to applications. New York, NY: Springer, 103–156.
Persson, B., and Volokitin, A. (2006). Rubber friction on smooth surfaces. Eur. Phys. J. E Soft Matter 21, 69–80. doi:10.1140/epje/i2006-10045-9
Persson, B. N. (2013). Sliding friction: physical principles and applications. Berlin, Germany: Springer Science & Business Media.
Persson, B. N., Albohr, O., Tartaglino, U., Volokitin, A. I., and Tosatti, E. (2004). On the nature of surface roughness with application to contact mechanics, sealing, rubber friction and adhesion. J. Phys. Condens Matter 17, R1. doi:10.1088/0953-8984/17/1/R01
Persson, B. N. J. (2006). Contact mechanics for randomly rough surfaces. Surf. Sci. Rep. 61, 201–227. doi:10.1016/j.surfrep.2006.04.001
Persson, B. N. J., Sivebaek, I. M., Samoilov, V. N., Zhao, K., Volokitin, A. I., and Zhang, Z. (2008). On the origin of Amonton’s friction law. J. Phys. Condens. Matter 20, 395006. doi:10.1088/0953-8984/20/39/395006
Rotella, C., Persson, B., Scaraggi, M., and Mangiagalli, P. (2020). Lubricated sliding friction: role of interfacial fluid slip and surface roughness. The Eur. Phys. J. E 43, 9. doi:10.1140/epje/i2020-11933-4
Scaraggi, M., Carbone, G., and Dini, D. (2011). Experimental evidence of micro-ehl lubrication in rough soft contacts. Tribol Lett. 43, 169–174. doi:10.1007/s11249-011-9794-6
Schallamach, A. (1963). A theory of dynamic rubber friction. Wear 6, 375–382. doi:10.1016/0043-1648(63)90206-0
Sivebæk, I. M., Samoilov, V. N., and Persson, B. N. (2012). Effective viscosity of confined hydrocarbons. Phys. Rev. Lett. 108, 036102. doi:10.1103/PhysRevLett.108.036102
Tiwari, A., Dorogin, L., Tahir, M., Stöckelhuber, K. W., Heinrich, G., Espallargas, N., et al. (2017). Rubber contact mechanics: adhesion, friction and leakage of seals. Soft Matter 13, 9103–9121. doi:10.1039/c7sm02038d
Tiwari, A., Miyashita, N., Espallargas, N., and Persson, B. N. J. (2018). Rubber friction: the contribution from the area of real contact. J. Chem. Phys. 148, 224701. doi:10.1063/1.5037136
Tiwari, A., Miyashita, N., and Persson, B. (2021). Rubber wear and the role of transfer films on rubber friction on hard rough substrates. Tribology Lett.
Tolpekina, T., and Persson, B. (2019). Adhesion and friction for three tire tread compounds. Lubricants 7, 20. doi:10.3390/lubricants7030020
Wang, J., Tiwari, A., Sivebaek, I. M., and Persson, B. N. J. (2020). Role of lattice trapping for sliding friction. EPL 131, 24006. doi:10.1209/0295-5075/131/24006
Yamada, S. (2002). General shear-thinning dynamics of confined fluids. Tribology Lett. 13, 167–171. doi:10.1023/a:1020151824274
Keywords: friction, adhesion, surface energy, rubber, contamination films
Citation: Tiwari A, Tolpekina T, Benthem Hv, Gunnewiek MK and Persson BNJ (2021) Rubber Adhesion and Friction: Role of Surface Energy and Contamination Films. Front. Mech. Eng 6:620233. doi: 10.3389/fmech.2020.620233
Received: 22 October 2020; Accepted: 29 December 2020;
Published: 16 March 2021.
Edited by:
Martin H. Müser, Saarland University, GermanyReviewed by:
Giuseppe Carbone, Politecnico di Bari, ItalyDaniele Dini, Imperial College London, United Kingdom
Copyright © 2021 Tiwari, Tolpekina, Benthem, Gunnewiek and Persson. This is an open-access article distributed under the terms of the Creative Commons Attribution License (CC BY). The use, distribution or reproduction in other forums is permitted, provided the original author(s) and the copyright owner(s) are credited and that the original publication in this journal is cited, in accordance with accepted academic practice. No use, distribution or reproduction is permitted which does not comply with these terms.
*Correspondence: A. Tiwari, YXZpY205MjZAZ21haWwuY29t; B. N. J. Persson, Yi5wZXJzc29uQGZ6LWp1ZWxpY2guZGU=