 Hamed Salehizadeh
 Raquel S. P. Hakes
 Michael J. Gollner
- 1Department of Fire Protection Engineering, University of Maryland, College Park, MD, United States
- 2Department of Mechanical Engineering, University of California, Berkeley, Berkeley, CA, United States
This study investigated the thermal conditions preceding ignition of three dense woody fuels often found on structures by firebrands, a major cause of home ignition during wildland-urban interface (WUI) fires. Piles of smoldering cylindrical firebrands, fabricated from wooden dowels, were deposited either on a flat inert surface instrumented with temperature and heat flux sensors or on a target fuel (marine-grade plywood, oriented-strand board, or cedar shingles) to investigate critical conditions at ignition. The former provided thermal data to characterize the time before and at ignition, while the latter provided smoldering and flaming ignition times. Tests were conducted in a small-scale wind tunnel. Larger firebrand piles produced higher temperatures at the center of the pile, thought to be due to re-radiation within the pile. Ignition was found to be dependent on target fuel density; flaming ignition was additionally found to be dependent on wind speed. Higher wind speeds increased the rate of oxidation and led to higher temperatures and heat fluxes measured on the test surface. The heat flux at ignition was determined by combining results of inert and ignition tests, showing that ignition occurred while transient heating from the firebrand pile was increasing. Ultimately, critical ignition conditions from firebrand pile exposure are needed to design appropriate fire safety standards and WUI fire modeling.
1. Introduction
Over the past few decades, losses from fires at the wildland-urban interface (WUI) have increased dramatically (Caton et al., 2016). The WUI, the area where human development intermixes or borders undeveloped wildland (Radeloff et al., 2005), represents a confluence of structures and surrounding flammable vegetation. Previous investigations have shown that firebrands are a major cause of fire spread during WUI fires, igniting structures and secondary fires far away from the main fire front (Mell et al., 2010), thus complicating suppression efforts. While early works by Cohen (2008) and numerous investigations by Maranghides and Mell (2011), Maranghides et al. (2013), Maranghides et al. (2015), and Maranghides and McNamara (2016) have shown that firebrands are a major source of structural losses, our understanding of the physical mechanisms by which firebrands generate, loft, and eventually ignite structures is still in its early stages (Caton et al., 2016; Manzello et al., 2020).
To better understand potential metrics to quantify critical ignition conditions for structural fuels exposed to firebrand piles, this study investigates the heating from and ignition by firebrand piles under wind on a small-scale, building on initial work by Hakes et al. (2019). The goal of this study is to quantify heat flux conditions at ignition of dense fuels representative of WUI fuels. This work applies the methodology developed by Hakes et al. (2019) and later used by Tao et al. (2020) to measure heat fluxes from piles of firebrands under various wind conditions and understand how these conditions relate to those which cause flaming and smoldering ignition of various WUI materials. Measurements are conducted over both an inert substrate and with representative WUI fuels, allowing for the influence of a target material to be separated from firebrand pile heating. The effect of wind, both on the heat flux and on the time to ignition, has been investigated.
2. Literature Review
There have been a number of studies on firebrand ignition, which can loosely be split into small-scale studies on ignition by individual firebrands or of vegetative fuels (Manzello et al., 2006; Ellis, 2015; Fernandez-Pello et al., 2015; Wang et al., 2017; Urban et al., 2018) and large-scale studies on structural components exposed to firebrand showers. Previous studies and post-fire investigations of ignition by firebrands in the WUI (Manzello et al., 2009; Maranghides et al., 2013) have found that firebrands frequently form piles on structural fuels prior to ignition, especially in crevices or corners around the exterior of structures. As a result, ignition of structural elements in WUI fires is expected to occur differently than ignition by a single firebrand, since individual firebrands exhibit different thermal characteristics than piles of firebrands (Hakes et al., 2019). Additionally, vegetative fuels ignite differently than dense materials, such as wooden structural elements used on residential homes, necessitating the study of solid fuels. Larger-scale studies have mostly focused on the generation of firebrand “showers” and large wind-driven depositions of and ignition by firebrands in a wind tunnel setting (Manzello et al., 2012; Manzello and Suzuki, 2017). Investigations of accumulated firebrand piles under wind are more realistic; however, they are difficult to reproduce on a small-scale in the laboratory and require extensive characterization.
A recent small-scale study by Hakes et al. (2019) investigated heat fluxes from piles of firebrands, finding that larger pile sizes increased rates of heating while the effect of firebrand diameter was relatively negligible for all cylindrical firebrands. Most tests were performed under ambient conditions; however, one test was performed at a higher wind speed. This wind test presented a dramatic increase in heating and reduction in the time to flaming ignition of the tested target fuel. Another recent study led by the senior author investigated the effect of firebrand size and shape on heating under different wind speeds (Tao et al., 2020). They found that piles from real firebrand fuels, such as barks and sticks, achieved higher peak heat fluxes at higher wind speeds than firebrand piles produced from artificial birch fuels, which exhibited little change with firebrand geometry. This effect was mostly attributed to the porosity of the firebrand pile; however, the effect of the mass of the firebrand pile and ignition of recipient WUI fuels were not studied. Bearinger et al. (2020) recently used IR thermography and inverse heat transfer analysis to measure localized heat transfer from firebrands to an inert surface. They found relatively high localized heat fluxes (80−105 kW/m2) from individual firebrands under a 1−2 m/s wind speed; however, when these heat fluxes were averaged over an area the size of the heat flux gauge used in Hakes et al. (2019), heat fluxes were in a similar range (7–25 kW/m2). Hakes et al. (2019) also hypothesized that structural fuels ignite in a smoldering state and then transition to flaming. Numerous previous studies have investigated the transition from smoldering to flaming; however, work on transition to flaming has primarily focused on less dense fuels such as foams (Ohlemiller, 1990; Tse et al., 1996) and remains challenging to model and predict (Dodd et al., 2012).
In summary, there is a need for improved physical understanding of firebrand ignition behavior, especially for structural fuels. In particular, previous studies on firebrand ignition have not described the thermal conditions at ignition of dense WUI fuels, conditions which are needed to determine critical ignition criteria for firebrand exposure. Minimum conditions that can cause ignition are unknown, although the importance of wind in contributing to ignition has been highlighted extensively. Additionally, it is necessary to understand the heating expected under worst-case firebrand loading scenarios. Ultimately, quantification of critical ignition criteria for firebrand exposure is necessary to design appropriate fire safety standards and to model propagation of wildland fires through WUI areas.
3. Materials and Methods
Two series of tests were performed in this experimental study. First, inert tests were performed to characterize thermal conditions of a pile of smoldering firebrands over an inert sample, using an array of thin-skin calorimeters (TSCs), a water-cooled heat flux gauge (WC-HFG), and K-type thermocouples (TCs). Second, for ignition tests, a pile of smoldering firebrands was deposited over a target fuel, and ignition time was recorded. Both inert thermal characterization tests and ignition tests were performed in a small, enclosed wind tunnel that produced wind speeds in the range of 0.5–3.5 m/s. The wind tunnel had a 30 × 30 cm inlet which reduced into a 25 × 7.5 cm test section made of stainless steel. Gases were exhausted through a high-temperature variable fan. The interior of the wind tunnel was painted matte black to reduce re-radiation, and a 20 × 6 cm window of borosilicate glass provided visual access to the experiments. At the bottom of the wind tunnel, experiments were placed in a 15 × 12 cm hole, as shown in Figures 1, 2. An additional 1.5 cm diameter hole located past the reducing section and before the test sample allowed for wind speed measurements with a hot-wire anemometer. Wind speeds were measured as a function of height, revealing a relatively flat profile at the inlet (Salehizadeh, 2019). The firebrand pile blocked a relatively large portion of the wind tunnel, which caused the wind speed over the firebrand pile to actually be lower than the wind speed setting. This effect was measured for several different pile sizes to calibrate the wind speed setting with the “corrected” wind speed that the firebrands actually experience. Wind speeds given throughout this paper are for this corrected wind speed.
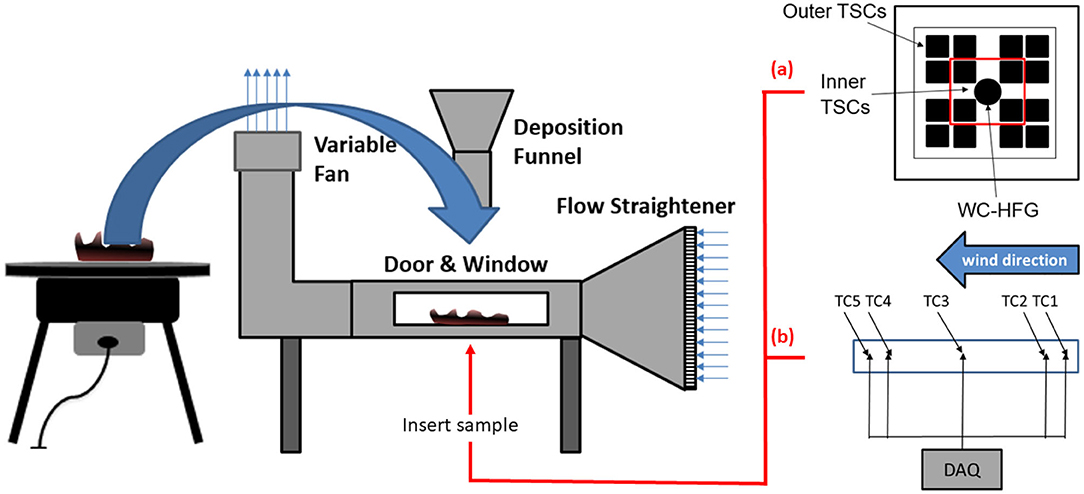
Figure 1. Schematic of the experimental setup, from left to right: burner used to ignite firebrands (modified figure from Caton, 2016), enclosed wind tunnel, (a) sensor array for inert tests with thin-skin calorimeters (TSC) and a water-cooled heat flux gauge (WC-HFG), and (b) thermocouple (TC) array for ignition tests, and data acquisition (DAQ) system.
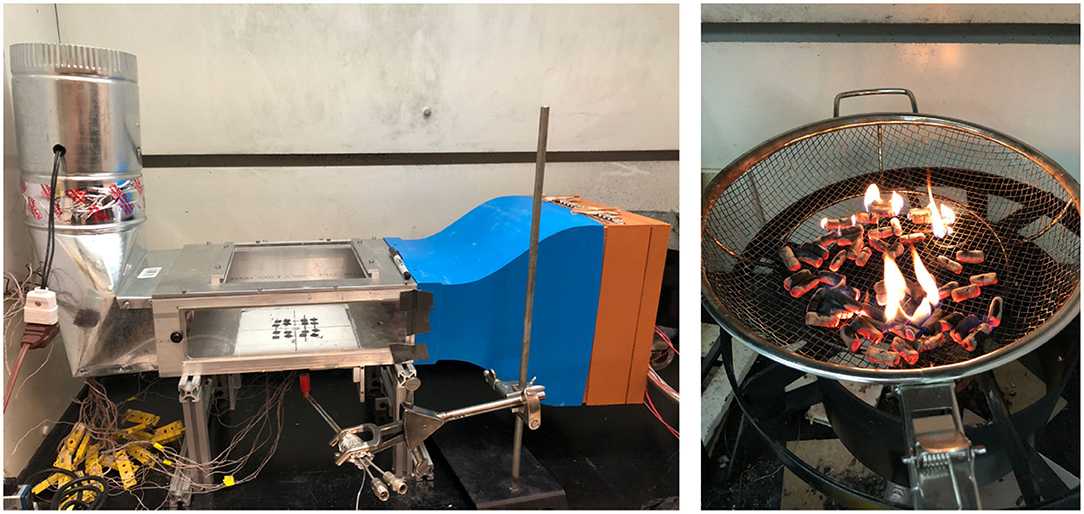
Figure 2. Photograph of the experimental setup (left) with an inert sensor array mounted and (right) a photograph showing cylindrical brands just before flames die out and firebrands are deposited on the test surface.
Firebrands were fabricated from 1.27 cm diameter and 2.54 cm long cylindrical birch wooden dowels. All dowels were cut and fully dried in an oven at 103°C before testing. Dowels were measured to have an initial density of 527±16 kg/m3 based on mass and geometry measurements of a sampling of cut dowels. The density of birch is slightly higher than those wood species, such as pine, typically found in WUI fires; however, it was not possible to source the desired quantity of the lower density materials for the firebrand diameter and shape considered here. We chose to use birch as a surrogate which could be readily supplied for the experiments and was used in previous firebrand ignition experiments (Hakes et al., 2019). Smoldering firebrands were fabricated following the method described in Hakes et al. (2019) by placing the dowels in a mesh basket over a large propane burner, shown on the left in Figure 1 and on the right in Figure 2. Once all firebrands achieved flaming (after 10–15 s depending on the pile size), the propane burner was turned off and the firebrands were allowed to burn until all flaming combustion ceased.
Firebrands were deposited on the experimental setup in a smoldering state using a funnel-like dumper. This dumper was used so that the firebrand pile was ensured of being deposited on the sensor array; both dumper outlet area and array area were approximately 10 × 10 cm. There was some natural variation in the deposition of the pile, meaning that there was variation in the contact area between the firebrands and the sensors. While this deposition method is anticipated to slightly increase variability between tests, the time-dependent deformation of smoldering wood as it transitions to ash adds inherent variability to this physical process, even for individual firebrand placement. Despite the associated uncertainty, clear and repeatable trends are still extracted by repeating experiments multiple times. Fully depositing the firebrand pile also allows for simulation of a worst-case heating scenario, capturing the initial high heat fluxes, conditions that could not be captured by placing each firebrand individually.
Three firebrand loading conditions were used for both inert and ignition tests. Initial mass of the wood was measured and resulted in smoldering piles about 16% the mass of the original wooden dowels, as shown in Table 1. For simplicity, the three piles will be referred to as 16, 8, and 4 g piles in the rest of the paper. As an indicator of the porosity, the bulk density of the resulting piles was also examined using volume measurements from side-view photographs of the pile and mass measurements from a load cell. Three tests for each deposited mass of 4, 8, and 16 g were chosen and pictures from a side and front view of the pile were analyzed with the software ImageJ. The volume of the pile was calculated based on the average height of the pile and the contact area between the pile and inert sample, approximately 10 × 10 cm, the area of the funnel-like dumper used. The bulk density of the pile, also shown in Table 1, was found to increase—indicating a decrease in porosity—with increasing deposited mass of firebrands. Bulk density is recorded for reference, but not varied in these experiments (i.e., the firebrand pile was never compacted).
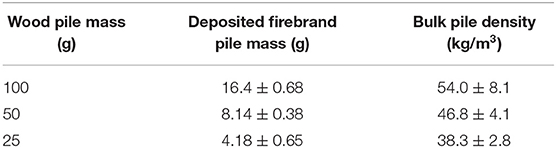
Table 1. Firebrand loading conditions for three pile sizes used in inert and ignition tests.
3.1. Inert Tests
Inert tests for thermal characterization were conducted by depositing a firebrand pile on a 1.27 cm thick sheet of ceramic insulation board (SuperWool 607), which was used to simulate a relatively adiabatic surface. Three types of sensors were inserted into the insulation board, flush with its surface, to take thermal measurements beneath the pile. These sensors included a single WC-HFG, which was inserted in the center of an array of sixteen TSCs, as shown in Figure 1a. Five K-type TCs, fabricated in-house, were used for temperature measurement. The number of repetitions for each condition was determined based on the variability of the results and will be discussed with the heat flux results. These tests were conducted under wind speeds varying from 0.5 to 2.0 m/s. This range was selected because wind speeds greater than 2 m/s moved and eventually blew away firebrands in 4 and 8 g piles. While these wind speeds are much lower than free-stream wind speeds expected in a WUI fire, speeds will reduce close to the surface due to boundary-layer effects, potential obstructions, and re-circulation zones adjacent to buildings.
First, a 1.27 cm diameter Medtherm Schmidt-Boelter WC-HFG (model GTW-7-32-485A, range: 0–70 kW/m2, maximum non-linearity ±2% of range, repeatability ±0.5%) was used to precisely measure the time-resolved heat flux beneath the center of the array. This type of WC-HFG is typically used for incident radiant heat flux measurement, but is used here following the methodology of Hakes et al. (2019). Although the WC-HFG is exposed to conductive heat fluxes, these conductive fluxes are negligible, as firebrands are rarely fully in contact with the gauge surface. Instead, ash and air pockets may block the firebrand from being fully in contact with the surface (Bearinger et al., 2020). Additionally, previous work (Hakes et al., 2019) presenting spatial maps of heat flux from individual firebrands shows radiation measured by sensors near the firebrand, but not in contact with it, indicating that even individual firebrands produce radiative heat fluxes. A firebrand pile is a non-contiguous heat source and, thus, expected to be dominated by radiation (Babrauskas, 2003). In order to account for the effect of ash on the surface of the WC-HFG, the gauge was regularly re-painted and re-calibrated. The WC-HFG was inspected visually after each test and was painted and calibrated with a frequency based on visual inspection of the surface paint on the gauge and heat fluxes reached during the test. Calibration was performed using a radiant cone heater, comparing measured heat flux values against a NIST-traceable calibration gauge. For smaller firebrand loading conditions (at lower wind speeds), the gauge was calibrated and re-painted at least every ten tests; for larger firebrand loading conditions (and higher wind speeds), the gauge was calibrated at least every five tests.
One concern with the use of a WC-HFG is whether the cooling of the gauge will also provide cooling to the firebrand pile. Previous work by Hakes (2017) compared the cooling to a firebrand pile from two WC-HFGs of different diameters, a 2.54 cm diameter gauge and a 1.27 cm diameter gauge. The latter is the size of the gauge used in the present study. That study found clear effects of cooling from the 2.54 cm gauge: tests on 8 g firebrand piles using the 2.54 cm gauge were 250–750 s shorter than those using the 1.27 cm gauge. Additionally, heat fluxes measured were on average lower when measured with the 2.54 cm gauge as opposed to the 1.27 cm gauge, indicating a cooling effect from the larger gauge. A comparison between heat fluxes measured by the 1.27 cm WC-HFG and an array of 16 TSCs found that heat fluxes measured by the WC-HFG were slightly lower than those measured by the TSCs (Hakes, 2017). It is unclear whether these results indicate cooling from the 1.27 cm WC-HFG or a heating time-lag associated with the TSCs. In the present study, the uncertainty due to potential cooling from the WC-HFG is estimated to be on the order of ~10% at most. The potential cooling was estimated for a firebrand pile at a temperature of 800°C, an average based on Urbas et al. (2004), Caton et al. (2016), and Urban et al. (2019), with a gauge held at the water temperature of 20°C, assuming radiative heat transfer between the firebrands and the WC-HFG. Given the difference in size between the pile and the gauge, cooling by the WC-HFG is ~10% for the worst case scenario (i.e., the lowest longtime heat fluxes measured). For the larger pile and highest wind cases, this loss is expected to be much lower.
To provide a spatial representation of temperature, 16 TSCs were fabricated in-house by spot welding a 30 gauge Chromel-Alumel K-Type thermocouple to the back of a 1 × 1 cm Inconel alloy 625 plate, of thickness 0.1 cm. The top surface of the TSC was painted matte black using high temperature Zynolyte paint in order to reduce the reflectively of the alloy plate and, subsequently, the re-radiation from the TSCs to the firebrands. The TSC array was split into two regions, as shown in Figure 1a: a set of inner TSCs to determine the temperature at the center of the firebrand pile, and a set of outer TSCs to indicate the temperature at the edges of the firebrand pile. While originally designed for heat flux measurements, TSCs have been found to provide a reliable, spatially-resolved surface temperature measurement, albeit with a slow time response. The viability of using TSCs for temperature measurements at the surface was verified by using five fine-wire, 30 gauge K-type thermocouples, placed adjacent to the surface of five TSCs, which provided relative measurements of temperature on the inert surface during the test. Further details on the construction and selection of TSCs can be found in Hakes (2017) and Hakes et al. (2019).
3.2. Ignition Tests
Ignition tests were performed by depositing firebrand piles over target fuels which represented WUI materials. Three target fuels were tested: marine-grade plywood, oriented-strand board (OSB) and cedar shingles, all of which were chosen based on availability, uniformity, and a range of densities which are expected to produce varying ignition behavior. The density of each target fuel was calculated using mass and volume measurements for five samples of each fuel type after the samples had been fully dried to 0% moisture content (MC). The target fuel densities measured were 565.4±12.5, 662.6±11.1, and 305.2±5.0 kg/m3 for plywood, OSB and cedar, respectively. Sample thickness ranged from 0.7 to 1 cm for cedar samples and 1–1.2 cm for OSB and plywood samples. For OSB and plywood, variation in thickness was due to manufacturer error. For cedar samples, cedar shingles decreased in thickness from one side to the opposite one. Ignition tests were performed under a narrower band of wind speeds from 0.5 to 1.4 m/s. Higher wind speeds resulted in a rapid transition to flaming that was not sustainable in the test apparatus. A minimum of five test repetitions were conducted for each fuel/wind speed condition.
The ignition test setup was instrumented with a side-view video camera and TCs embedded in the target fuel to measure both flaming and smoldering ignition times, shown in Figure 3. Ignition time was measured from the time of firebrand deposition on the target fuel. The flaming ignition time was determined using a video camera to observe when flames anchored to the fuel surface, rather than to firebrands in the pile. The smoldering ignition time was determined using five K-type thermocouples pinned inside the target fuel, 0.5 cm below the top surface, as shown schematically in Figure 1b. Smoldering ignition time was determined as the time it took for one of the five TCs to reach a threshold temperature. Preliminary tests were conducted with a range of firebrand loading conditions to determine a representative threshold temperature for smoldering. Target fuel samples were extinguished and cut at various times to expose the smoldering front, denoted visually as the blackened section of the wood. For samples where this front reached the embedded thermocouples, a threshold temperature of 200°C was determined, above which the fuel sample blackened completely. This threshold temperature is thought to be lower than realistic smoldering temperatures because thermocouples, initially in contact with the sample, became detached from the wood when the front approached. It is also possible that this blackened region represented pyrolysis of the fuel; however, the fuel samples were observed to be in a glowing condition at least at the surface for the majority of tests where smoldering was indicated by the temperature threshold. The thermal wave appears to move linearly through the sample making the trends observed valid regardless of the choice. This definition was still useful as it helped to segregate a point of self-propagating smoldering; at lower temperatures, smoldering was only maintained by the heating of the firebrand pile. For all experiments, this threshold temperature was reached first by TC3, the thermocouple below the center of the pile, as shown in Figure 1b.
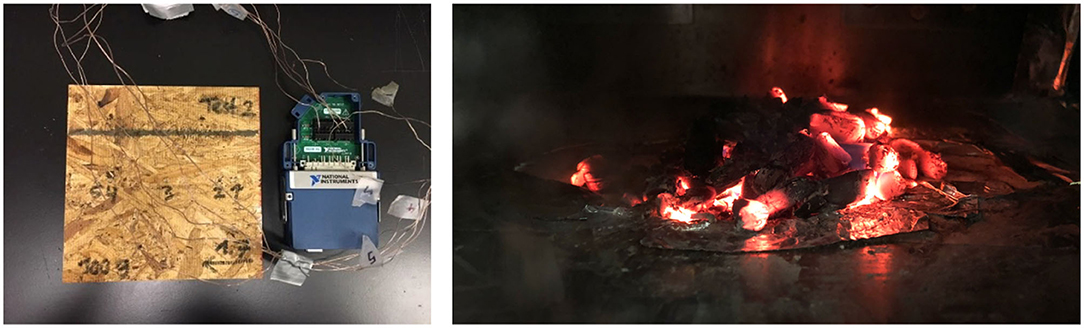
Figure 3. (Left) Photograph of a sample of plywood instrumented with thermocouples and attached to the DAQ card used in the experiment and (right) a representative smoldering firebrand pile with wind flowing from right to left.
4. Results
Results are presented first for inert thermal characterization tests and second for ignition tests. Heat fluxes and temperatures from the inert tests are compared with time to smoldering or flaming ignition in the ignition tests to shed light on the phenomena leading to ignition of different materials.
4.1. Inert Thermal Characterization
Both time-resolved single-point heat flux measurements and time-resolved spatial temperature measurements were taken for varying firebrand deposited pile mass and wind speed conditions.
4.1.1. Heat Flux Results
For each test, heat flux over time was recorded from the WC-HFG. Subsequently, the heat fluxes from individual tests under the same conditions were averaged to provide an average heat flux curve for each pile size and wind speed test condition. Figure 4 shows both the individual test heat flux curves as well as the averaged heat flux curve for two test conditions: 16 g of smoldering birch dowels deposited on the inert sensor array for wind speeds of 1.2 and 1.4 m/s. For all tests, there is an initial heat flux spike at the beginning of the test which is not sustained. This spike occurs when the firebrand pile is first placed on the WC-HFG and is not considered as part of the analysis here. After the firebrand pile is deposited, the heat flux increases to a peak, between 500 and 1,000 s on average in the tests shown here, then decays gradually as the firebrand pile cools.
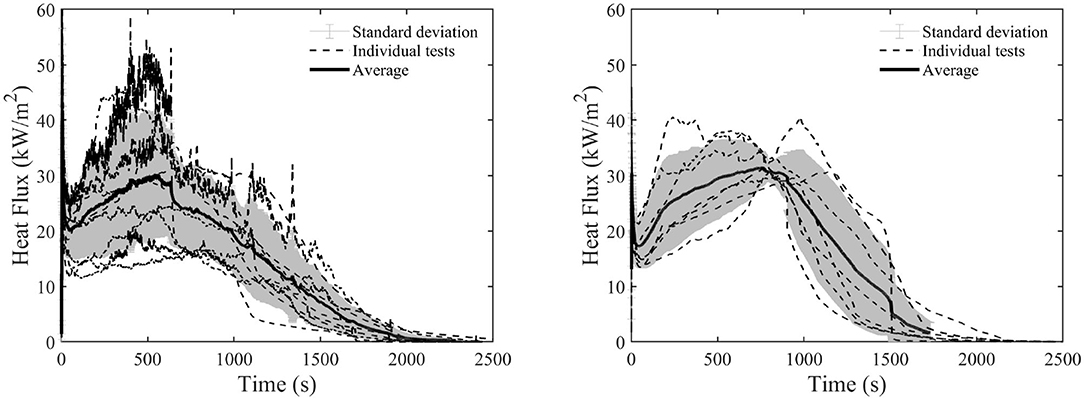
Figure 4. Heat fluxes recorded from a WC-HFG are shown for 16 g of smoldering birch firebrands deposited over the sensor array for 1.2 m/s (left) and 1.4 m/s (right). The shaded area represents the standard deviation between tests. Dashed lines represent all individual tests recorded.
Included in Figure 4 is the standard deviation for the averaged curve. The standard deviation between tests increases as the variability of tests increases. The number of tests performed at each condition was determined based on the variability of the heat flux measurements from test to test. At 1.2 and 1.4 m/s, which both lie at the transition point between smoldering and flaming, 11 and 7 test repetitions, respectively, were performed. A lower wind speed of 0.5 m/s exhibited repeatable behavior and only three tests were performed. The large standard deviations shown for 1.2 and 1.4 m/s are indicative of the stochastic nature of transition between flaming and smoldering. Indeed, even for experiments over an inert substrate, piles of firebrands sometimes transitioned to flaming under high enough wind speeds, dramatically affecting the heat fluxes measured. The probability of transition to flaming for a firebrand pile on the inert surface was determined from recorded videos of experiments for each wind speed and deposited mass condition. The transition from smoldering to flaming (using a probability threshold of 0.5) occurred at around 1.2 m/s for 16 g and 1.4 m/s for 8 g deposited mass piles. It is expected that the probability of transition to flaming may be responsible for some of the variability between the tests.
4.1.2. Temperature Results
For inert tests, temperatures beneath the firebrand pile were recorded using the TSC array. Averaged temperatures of the inner and outer group TSCs (shown in Figure 1a) provide representative temperatures for the center of the pile and perimeter of the pile, respectively. The averaged inner TSC temperature provides a representative temperature for the area around the WC-HFG. Figure 5 shows averaged center and perimeter temperatures for two pile sizes under four different wind speeds. First, it is clear that temperatures increased as the deposited pile mass increased. Additionally, the heating duration also increased as the deposited pile mass increased, while the duration of heating slightly decreased with higher wind speeds owing to faster oxidation rates.
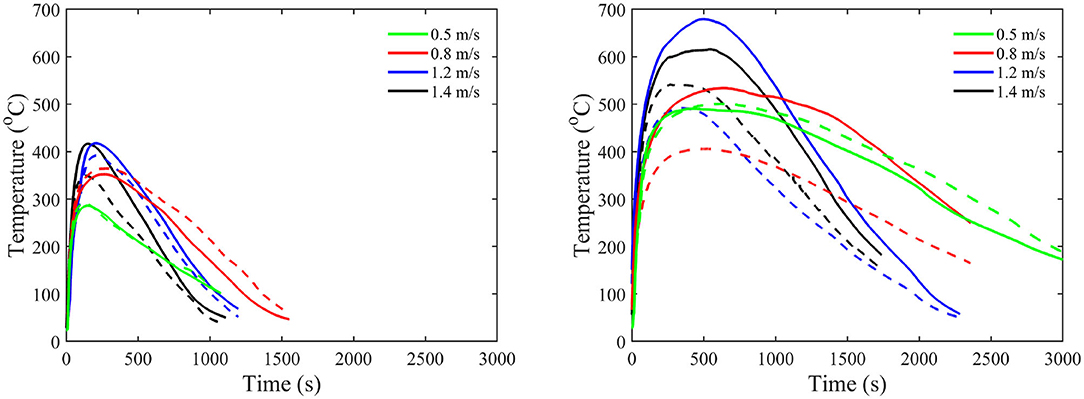
Figure 5. Averaged TSC temperatures for (left) a 4 g deposited mass pile and (right) a 16 g deposited mass pile. Solid lines represent inner TSCs; dashed lines represent outer TSCs.
In larger piles the average temperature of the inner TSCs reached 500-700°C, close to expected values for smoldering ignition under wind, while the center temperatures for the 4 g pile only reached approximately 400°C, much lower than what would be expected for a smoldering reaction under wind. While averaged temperatures for the inner TSCs for the large pile reach about 700°C, the temperatures of individual TSCs reached well over 900°C instantaneously at higher wind speeds. These temperatures correspond well with previously measured temperatures by Urban et al. (2019) using color pyrometry.
A comparison between averaged temperatures at the center of the pile and the perimeter of the pile show that, for the most part, the center of the pile experiences higher average temperatures. This trend is the clearest for the large 16 g pile shown on the right in Figure 5; however, at lower wind speeds, there is little difference between central and perimeter temperatures. For 0.5 m/s, neither the small nor the large pile experienced higher center temperatures than perimeter temperatures. At 0.8 m/s, the 4 g pile shows perimeter temperatures that are slightly higher than center temperatures. The difference between center and perimeter temperature reached 200°C for the 16 g pile under a 1.2 m/s wind.
The differences between the 4 and 16 g pile, both in terms of temperatures reached and trends between the center and perimeter of the pile, are expected to be the result of two phenomena. First, sensors were more completely surrounded for the large pile, while the small pile was sparse in nature, resulting in poor coverage of the sensors. Second, visually, the larger piles of smoldering firebrands reached a glowing state as the wind speed was increased. It is expected that the higher temperatures from the 16 g pile resulted in a firebrand pile dominated by re-radiation. Additionally, the size of the large pile, in comparison to the small one, served to better insulate the firebrands from some of the convective cooling effects from the surrounding wind. On the other hand, for the 4 g pile, it is expected that conduction may still play a significant role in heating. The sparse nature of the 4 g pile more closely resembles contact from individual firebrands rather than a pile structure which insulates, suspends firebrands, and encourages re-radiation.
4.1.3. Peak Heating and Heating Duration
The above investigation of averaged temperatures indicated that both pile size and wind speed have a considerable effect on heating duration and maximum temperatures. Similar results can be seen when comparing the averaged heat fluxes for different pile size and wind speed configurations. The effect of pile size and wind speed on averaged heat flux is shown in Figure 6. As shown for temperature in Figure 5, higher wind speeds are shown to yield higher maximum heat fluxes and result in a shorter heating duration. In Figure 6, it is clear that there is a large uptick in the maximum heat flux as the mass of the pile increases from 4 to 8 g; however, there is little difference between 8 and 16 g, except that the duration of heating generally lasts longer for the larger pile.
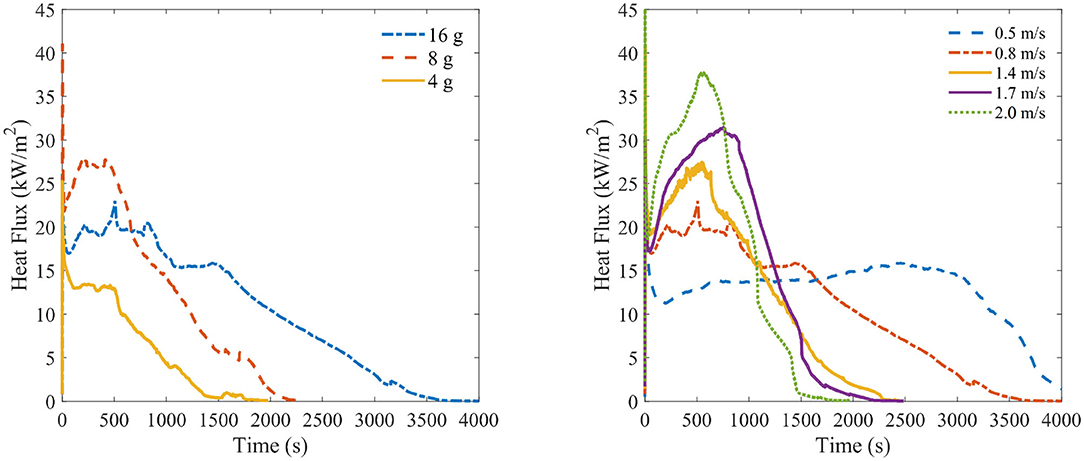
Figure 6. (Left) Time-resolved heat flux for three deposited mass piles at 0.8 m/s wind. (Right) Time-resolved heat flux for a 16 g deposited mass pile under five different wind speeds.
The influence of wind speed and deposited pile mass on heat flux and temperature can also be observed by investigating the point values of peak heat flux and peak temperature, as shown in Figure 7. Peak heat flux is seen to be highly dependent on wind speed with a relatively linear increase in peak heat flux as wind speed is increased. The differences in peak heat flux resulting from pile size are mostly small and within the standard deviation of other pile sizes, though 8 g piles experienced high peak heat fluxes on average for wind speeds from 0.7 to 1.4 m/s.
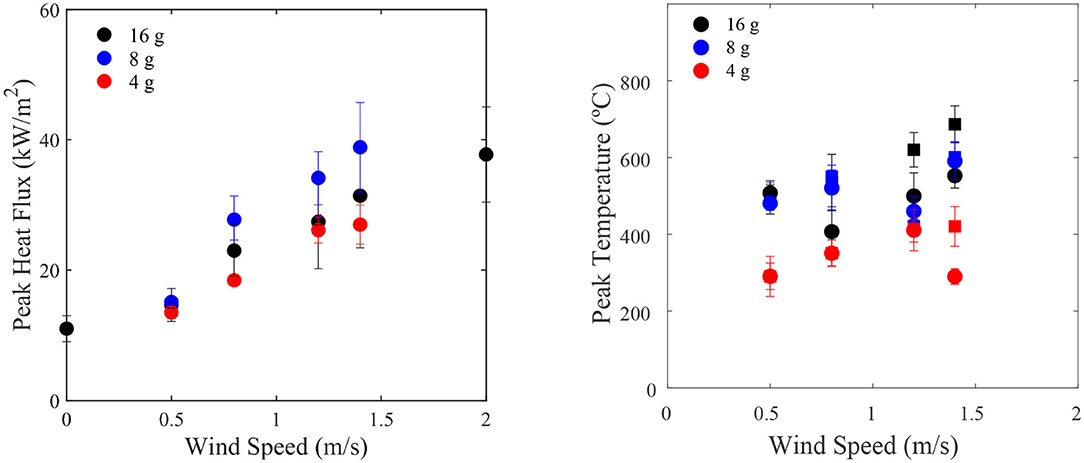
Figure 7. Peak heat flux (left) and peak temperature (right) as a function of wind speed for three pile sizes. For most pile sizes, peak heat flux and temperature increases with increasing wind speed. Peak temperatures are shown for inner TSCs (squares) and outer TSCs (circles).
The effect of wind speed on peak heat flux is anticipated as higher wind speeds produce higher temperatures as a result of increased surface oxidation. Increased oxidation will invariably increase heat fluxes to the surface. As heat is released at a higher rate, firebrands burn out faster, resulting in a reduced duration of heating. While increased wind speeds may increase the cooling rate from firebrands, it appears that the effect of increased rates of oxidation is considerably larger than any cooling effects within the regimes tested here.
Peak temperature shows somewhat different trends from peak heat flux. While peak heat flux depended mostly on wind speed, peak temperature is dependent on both pile size and wind speed. While the two larger piles experience similar peak temperatures, the 4 g pile reaches much lower peak temperatures. This is due to the smaller bulk density in the 4 g piles, which results in decreased interaction between firebrands and a larger cooling effect from the wind. Although there is generally an increase of peak temperature with wind speed, there are more variations for sensors along the perimeter (outer TSCs). This variation is likely due to the fact that the sensors on the edges of the pile were sometimes more sparsely covered than those at the center of the pile and subject to more convective cooling effects from the wind. An effect concealed here is the area that receives this heat flux. A larger pile will heat a larger area, which is indicated by the large peak temperature differences for the outer TSCs.
4.2. Ignition Results
In order to understand ignition behavior, smoldering and flaming observations and times were compared over a range of wind speeds for the three different target fuels tested. All samples experienced smoldering on the surface. Some samples also experienced in-depth smoldering or flaming ignition. In intermediate regimes where conditions could cause either smoldering or flaming, tests were repeated above the minimum five repetitions per scenario. Surface smoldering occurred early in the test for almost all conditions studied, and eventually propagated in-depth in the target fuel for some conditions. In some cases, especially those with high wind speeds and a low target fuel density, transition to flaming occurred and flames appeared on the surface of the fuel.
In order to determine which tests experienced flaming of the target fuel, it was necessary to distinguish between flaming of the firebrands (which occurred even in some inert tests) and flaming ignition of the target fuel. Figure 8 shows the difference between flaming of the firebrand pile and flaming ignition of the target fuel. The flames over the glowing firebrands appear higher in the photograph, while the flame anchored to the target fuel surface is visually lower down, indicating the location of the top surface of the target fuel. Flames over the firebrand pile usually started at the top of the pile and moved to the left of the pile (downwind). On the other hand, flaming ignition of the target fuel typically started at the boundary of the fuel and pile of firebrands, at the right side of the pile (upwind). These flames were typically anchored to the target fuel surface.
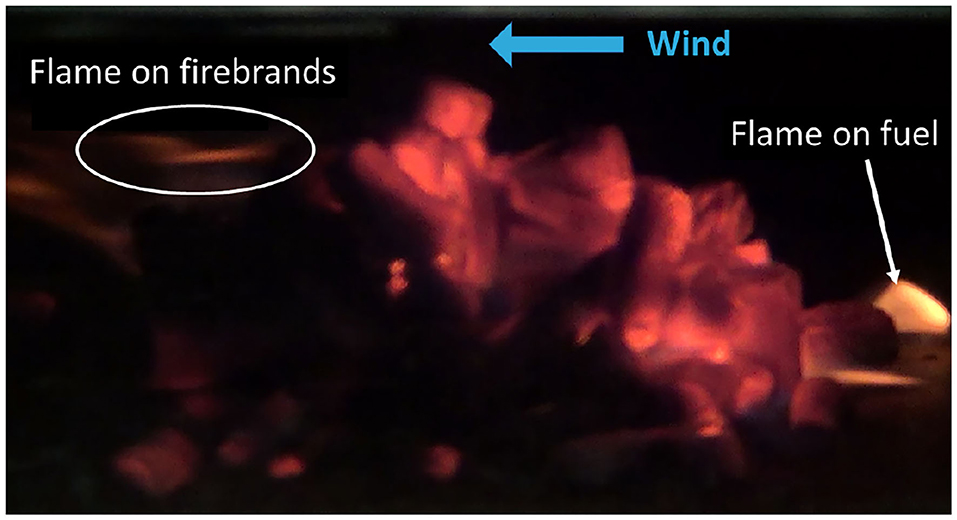
Figure 8. Photograph showing flames present both over the pile of firebrands, downwind and attached to the glowing firebrands, and over the fuel surface, upwind and anchored to the fuel surface.
A representative time to smoldering and time to flaming ignition was determined in each case and used to quantify ignition conditions for different materials. Self-sustained smoldering of the target fuel was quantified with a time to smoldering, defined as the time when smoldering propagated to a 0.5 cm depth in the target fuel. Therefore, the smoldering times shown do not represent surface smoldering but in-depth smoldering. Time to flaming ignition is the time when smoldering at the surface of the fuel transitioned to flaming ignition at the surface of target fuels. After observing a flame at the surface of the fuel, the test was ended and the time to flaming was recorded. Time to smoldering was only collected from samples without flames observed at the surface of the fuel, i.e., flaming ignition. This was due to the fact that flaming, if it occurred, happened quickly, whereas in-depth smoldering would be observed at later times. Therefore, tests with flaming on the surface of the fuel were ended before smoldering was measured in-depth. If flaming samples were allowed to continue to burn, which was allowed to occur in limited cases, they would eventually burn through the entire sample.
Figure 9 shows the time to ignition for both in-depth smoldering and flaming as a function of wind speed for the three fuels tested. The ignition times presented here represent cases where either smoldering or flaming occurred, not a transition from one to the other. Under certain wind speed and firebrand loading conditions not all tests transitioned to flaming, as indicated by the flaming propensity. In order to explore this transition region, additional ignition tests were conducted in the 0.8–1.4 m/s wind speed range.
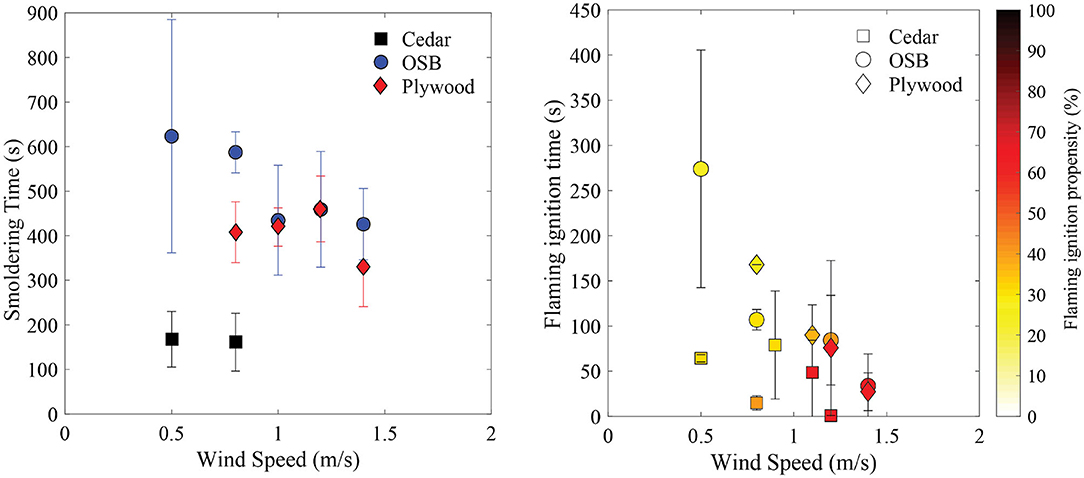
Figure 9. Time to smoldering ignition (left) and time to flaming ignition (right) as a function of wind speed for three fuels and 16 g firebrand piles. Each point is averaged with error bars representing the standard deviation between values from individual tests. The flaming propensity is the ratio of tests that transitioned to flaming over those that did not; darker colors indicate a higher likelihood of transition to flaming.
The density of the fuel bed was found to be a critical parameter related to propensity of smoldering ignition. A higher fuel density resulted in generally longer times to smoldering ignition. This effect is clearly seen for the lowest density material, cedar, which experienced the shortest ignition times and the greatest propensity for flaming. Smoldering ignition times decreased slightly and became more repeatable at higher wind speeds, while lower wind speeds exhibited more stochastic behavior. Many factors, including wind speed, firebrand pile mass, and target fuel density, influenced transition to flaming. Ultimately, higher wind speeds were more likely to transition to flaming. For low wind speeds, ignition behavior was found to be more variable and the probability of flaming on the fuel surface was low, especially for high fuel density.
4.3. Heat Flux at Ignition
While ignition times are important for a particular set of experiments, ultimately criteria are needed to fully describe ignition conditions. There are several different types of ignition criteria–critical temperature at ignition, critical mass flux, and critical heat flux at ignition–for each material. For radiation-based steady heating, it is possible to define a critical heat flux which, when sustained for a certain period of time, will result in ignition. Quantifying critical heat fluxes from firebrand piles is more complicated as heat fluxes change as a function of time. In some situations, values of instantaneous heat flux at ignition may be higher than the steady critical heat flux value (Santamaria and Hadden, 2019). Studies on transient heat flux (Bilbao et al., 2002; Lizhong et al., 2007; Zhai et al., 2017; Gong et al., 2018; Santamaria and Hadden, 2019) have investigated time to ignition for transient as opposed to constant heat flux, including investigating the ignition criteria of critical temperature, critical heat flux, and critical mass flux; however, these studies have focused on incident radiative heating. Studies by Vermesi et al. (2016, 2017, 2020) have investigated ignition of various materials exposed to transient heat fluxes and found that dual-criteria may be more accurate to describe ignition rather than a single criterion.
Most previous studies on transient heating focus either on increasing or decreasing heating. The heat flux from the firebrand pile provides both increasing and decreasing heating, depending on the portion of the test. As described previously, the heat flux profiles in these tests increase to a peak heat flux and then gradually decay. As the wind speed is increased, the peak heat flux achieved also increases, but the heating occurs over a shorter duration. In order to look at whether ignition occurs under the increasing or the decreasing part of the test, flaming and smoldering ignition times for target fuels were plotted on the averaged time-resolved heat flux curves, as shown in Figure 10. These results are shown for three wind speeds and all three target fuels. For all fuels and wind speeds, both smoldering and flaming ignition occur under a region of increasing heat flux.
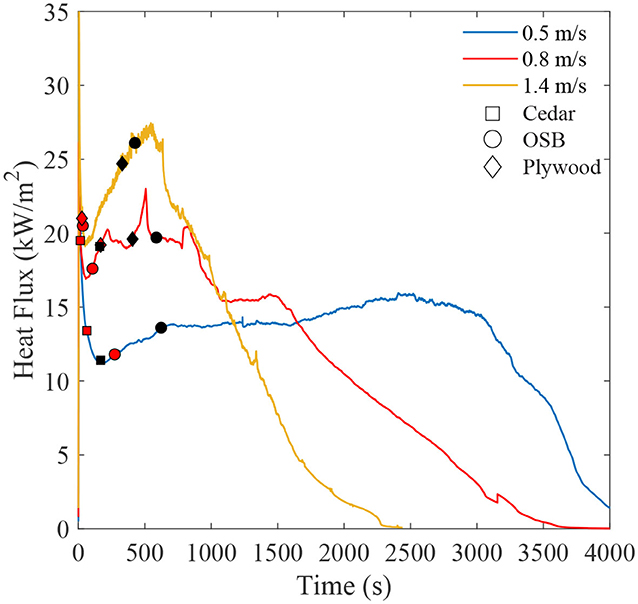
Figure 10. Averaged heat flux curves for inert tests under three wind speeds and a 16 g firebrand pile. Time of flaming (red) or smoldering (black) ignition is marked on the heat flux curves for three fuels, cedar, OSB, and plywood.
Although the value of the heat flux at ignition may not be able to provide in itself a critical ignition criterion, the heat flux at the time of ignition may still be useful to assess and compare the relative conditions occurring at the point of ignition for different fuels. For smoldering ignition, there is a clear increase in the value of heat flux at ignition as wind speed is increased. For flaming ignition, a similar increase occurs from 0.5 to 0.8 m/s, but not for higher wind speeds. It is interesting to note that differences between the heat flux at ignition for smoldering and flaming ignition are minimal. Note that smoldering ignition here is again the in-depth smoldering propagation measured at 0.5 cm below the fuel surface.
The heat flux at ignition shown here illuminates some trends in smoldering and flaming ignition for different target fuels, but it does not fully describe the ignition process. It only provides a point value to describe an ignition condition and so is unable to account for the changing heat flux leading up to ignition or the duration over which this heat flux occurs. In determining ignition criteria, it is notable that ignition occurs during the increasing heating phase. Previous work on ignition under increasing radiant heat flux suggests defining the critical ignition criteria using a ratio between the surface losses and the incident heat flux (Santamaria and Hadden, 2019). For radiant heating, it is possible to develop a simplified one-dimensional model; however, the energy balance for the firebrand pile is more complicated and may require numerical simulations to provide further insight.
5. Discussion and Conclusions
Several factors were found to be critically important to the ignition of fuels, namely, the ambient wind speed, the firebrand pile mass, and the density of the target fuel. A large number of repetitions of several experimental conditions were conducted due to the stochastic nature of the transition from smoldering to flaming and natural variability in wood samples. Despite the high variability, some key trends were extracted from these experiments. Both the temperature beneath the firebrand pile and the heat flux from firebrands over an inert sample increased with increased wind speeds as a result of more rapid oxidation in firebrands. For ignition tests, these increases in temperature and heat flux were reflected in the decreased time to ignition and increased likelihood of flaming ignition of the target fuel under higher wind speeds. For both smoldering and flaming ignition, density of the target fuel was found to be the most important factor.
Results point to interesting interactions between firebrands once they are deposited in bulk over a surface. In particular, firebrands at the center of a pile have higher temperatures than surrounding firebrands, which are losing heat to the surrounding environment. Interactions between firebrands in the pile and enhanced oxidation driven by the wind overcomes some cooling effects and results in increased temperatures and heat fluxes with higher wind speeds. The role of re-radiation within the pile was not explicitly explored, but may be important here. Wind speeds were varied from 0.5 to 2.0 m/s for inert tests, and heat flux trends for those wind conditions were illustrated. In particular, tests at higher wind speeds resulted in higher peak heat fluxes and shorter test duration. While not possible in this work, it is important to consider conducting experiments with higher wind speeds in the future, as higher wind speeds may provide increasing rates of cooling to the firebrand pile and affect the trends found.
The ignition of a target fuel is complex and influenced by a number of factors. In this study, a number of simplifications were made to isolate the effects of wind speed, pile size, and target fuel type. The present work shows that ignition, at least for the configuration considered here, occurs under the increasing heat flux regime. Future work should consider expanding to more complex and realistic considerations, including fuel geometry, additional fuel types and fuel moisture content (MC). To simulate a worst-case scenario, the MC of the fuels remained zero in all experiments; however, MC may have a non-negligible effect on ignition and should be considered in future tests. A flat fuel surface presents a perfect configuration for this fundamental study, but future work will have to address more complex geometries. Other geometries, such as crevices, L-shaped walls, and corners, are more common accumulation points in real fires than the flat surfaces studied here. It will be important to understand how geometry influences ignition of a dense fuel on a small-scale.
Data Availability Statement
The datasets presented in this study can be found in online repositories. The names of the repository/repositories and accession number(s) can be found below: https://doi.org/10.5281/zenodo.3964633.
Author Contributions
MG conceived of the presented idea and supervised the project. HS conducted the experiments. HS and RH analyzed the data. RH took the lead in writing the manuscript. All authors discussed the results and contributed to the final manuscript.
Funding
This research was funded by the National Institute of Standards and Technology, Fire Research Grant Program under financial assistance awards 60NANB15D358, 70NANB16H284, and 70NANB17H288.
Conflict of Interest
The authors declare that the research was conducted in the absence of any commercial or financial relationships that could be construed as a potential conflict of interest.
Acknowledgments
The authors would like to thank Alison Davis, Alicea Fitzpatrick, Erin Griffith, Michael Jones, Seth Lattner, and Jessen Oey for their assistance with laboratory experiments, Hanyu Xiong for comments on the manuscript, and the NIST WUI group, especially Nelson Bryner, Jiann Yang, Kathryn Butler, and Erica Kuligowski for their advice and support.
References
Bearinger, E., Lattimer, B., Hodges, J., and Rippe, C. (2020). “Measuring heat transfer from firebrands to surfaces,” in Proceedings of the ASME 2020 Heat Transfer Summer Conference. Virtual doi: 10.1115/HT2020-9165
Bilbao, R., Mastral, J., Lana, J., Ceamanos, J., Aldea, M. E., and Betrán, M. (2002). A model for the prediction of the thermal degradation and ignition of wood under constant and variable heat flux. J. Anal. Appl. Pyrol. 62, 63–82. doi: 10.1016/S0165-2370(00)00214-X
Caton, S. (2016). Laboratory studies on the generation of firebrands from cylindrical wooden dowels (Masters thesis). University of Maryland, College Park, MD, United States
Caton, S., Hakes, R., Gorham, D., Zhou, A., and Gollner, M. (2016). Review of pathways for building fire spread in the wildland urban interface part I: exposure conditions. Fire Technol. 53, 429–473. doi: 10.1007/s10694-016-0589-z
Cohen, J. (2008). “The wildland-urban interface problem,” in Forest History Today, Durham, NC, 20–26.
Dodd, A., Lautenberger, C., and Fernandez-Pello, C. (2012). Computational modeling of smolder combustion and spontaneous transition to flaming. Combust. Flame 159, 448–461. doi: 10.1016/j.combustflame.2011.06.004
Ellis, P. (2015). The likelihood of ignition of dry-eucalypt forest litter by firebrands. Int. J. Wildland Fire 24, 225–235. doi: 10.1071/WF14048
Fernandez-Pello, A., Lautenberger, C., Rich, D., Zak, C., Urban, J., Hadden, R., et al. (2015). Spot fire ignition of natural fuel beds by hot metal particles, embers, and sparks. Combust. Sci. Technol. 187, 269–295. doi: 10.1080/00102202.2014.973953
Gong, J., Li, Y., Chen, Y., Li, J., Wang, X., Jiang, J., et al. (2018). Approximate analytical solutions for transient mass flux and ignition time of solid combustibles exposed to time-varying heat flux. Fuel 211, 676–687. doi: 10.1016/j.fuel.2017.09.107
Hakes, R. (2017). Thermal characterization of firebrand piles (Masters thesis). University of Maryland, College Park, MD, United States.
Hakes, R., Salehizadeh, H., Weston-Dawkes, M., and Gollner, M. (2019). Thermal characterization of firebrand piles. Fire Saf. J. 104, 34–42. doi: 10.1016/j.firesaf.2018.10.002
Lizhong, Y., Zaifu, G., Yupeng, Z., and Weicheng, F. (2007). The influence of different external heating ways on pyrolysis and spontaneous ignition of some woods. J. Anal. Appl. Pyrol. 78, 40–45. doi: 10.1016/j.jaap.2006.04.001
Manzello, S., Cleary, T., Shields, J., and Yang, J. (2006). On the ignition of fuel beds by firebrands. Fire Mater. 30, 77–87. doi: 10.1002/fam.901
Manzello, S., Park, S., and Cleary, T. (2009). Investigation on the ability of glowing firebrands deposited within crevices to ignite common building materials. Fire Saf. J. 44, 894–900. doi: 10.1016/j.firesaf.2009.05.001
Manzello, S., and Suzuki, S. (2017). Experimental investigation of wood decking assemblies exposed to firebrand showers. Fire Saf. J. 92, 122–131. doi: 10.1016/j.firesaf.2017.05.019
Manzello, S., Suzuki, S., and Hayashi, Y. (2012). Enabling the study of structure vulnerabilities to ignition from wind driven firebrand showers: a summary of experimental results. Fire Saf. J. 54, 181–196. doi: 10.1016/j.firesaf.2012.06.012
Manzello, S. L., Suzuki, S., Gollner, M. J., and Fernandez-Pello, A. C. (2020). Role of firebrand combustion in large outdoor fire spread. Prog. Energy Combust. Sci. 76:100801. doi: 10.1016/j.pecs.2019.100801
Maranghides, A., and McNamara, D. (2016). 2011 Wildland Urban Interface Amarillo Fires Report #2-Assessment of Fire Behavior and WUI MEasurement Science, NIST TN 1909. National Institute of Standards and Technology. doi: 10.6028/NIST.TN.1909
Maranghides, A., McNamara, D., Mell, W., Trook, J., and Toman, B. (2013). A Case Study of a Community Affected by the Witch and Guejito Fires: Report 2 - Evaluating the Effects of Hazard Mitigation Actions on Structure Ignitions. National Institute of Standards and Technology. doi: 10.6028/NIST.TN.1796
Maranghides, A., McNamara, D., Vihnanek, R., Restaino, J., and Leland, C. (2015). A Case Study of a Community Affected by the Waldo Fire Event Timeline and Defensive Actions. Technical Report. National Institute of Standards and Technology. doi: 10.6028/NIST.TN.1910
Maranghides, A., and Mell, W. (2011). A case study of a community affected by the witch and guejito wildland fires. Fire Technol. 47, 379–420. doi: 10.1007/s10694-010-0164-y
Mell, W., Manzello, S., Maranghides, A., Butry, D., and Rehm, R. (2010). The wildland-urban interface problem - current approaches and research needs. Int. J. Wildland Fire 19, 238–251. doi: 10.1071/WF07131
Ohlemiller, T. (1990). Forced smolder propagation and the transition to flaming in cellulosic insulation. Combust. Flame 81, 354–365. doi: 10.1016/0010-2180(90)90031-L
Radeloff, V., Hammer, R., Stewart, S., Fried, J., Holcomb, S., and McKeefry, J. (2005). The wildland-urban interface in the united states. Ecol. Appl. 15, 799–805. doi: 10.1890/04-1413
Salehizadeh, H. (2019). Critical ignition conditions of structural materials by cylindrical firebrands (thesis). University of Maryland, College Park, MD, United States.
Santamaria, S., and Hadden, R. M. (2019). Experimental analysis of the pyrolysis of solids exposed to transient irradiation. Applications to ignition criteria. Proc. Combust. Inst. 37, 4221–4229. doi: 10.1016/j.proci.2018.05.104
Tao, Z., Bathras, B., Kwon, B., Biallas, B., Gollner, M., and Yang, R. (2020). Effect of firebrand size and geometry on heating from a smoldering pile under wind. Fire Saf. J. 103031. doi: 10.1016/j.firesaf.2020.103031
Tse, S., Fernandez-Pello, A., and Miyasaka, K. (1996). “Controlling mechanisms in the transition from smoldering to flaming of flexible polyurethane foam,” in Symposium (International) on Combustion, (Naples: Elsevier), 1505–1513. doi: 10.1016/S0082-0784(96)80372-9
Urban, J., Vicariotto, M., Dunn-Rankin, D., and Fernandez-Pello, A. (2019). Temperature measurement of glowing embers with color pyrometry. Fire Technol. 55, 1013–1026. doi: 10.1007/s10694-018-0810-3
Urban, J., Zak, C., and Fernandez-Pello, C. (2018). Spot fire ignition of natural fuels by hot aluminum particles. Fire Technol. 54, 797–808. doi: 10.1007/s10694-018-0712-4
Urbas, J., Parker, W., and Luebbers, G. (2004). Surface temperature measurements on burning materials using an infrared pyrometer: accounting for emissivity and reflection of external radiation. Fire Mater. 28, 33–53. doi: 10.1002/fam.844
Vermesi, I., DiDomizio, M., Richter, F., Weckman, E., and Rein, G. (2017). Pyrolysis and spontaneous ignition of wood under transient irradiation: experiments and a-priori predictions. Fire Saf. J. 91, 218–225. doi: 10.1016/j.firesaf.2017.03.081
Vermesi, I., Richter, F., Chaos, M., and Rein, G. (2020). Ignition and burning of fibreboard exposed to transient irradiation. Fire Technol. doi: 10.1007/s10694-020-01017-6. [Epub ahead of print].
Vermesi, I., Roenner, N., Pironi, P., Hadden, R., and Rein, G. (2016). Pyrolysis and ignition of a polymer by transient irradiation. Combust. Flame 163, 31–41. doi: 10.1016/j.combustflame.2015.08.006
Wang, S., Huang, X., Chen, H., and Liu, N. (2017). Interaction between flaming and smouldering in hot-particle ignition of forest fuels and effects of moisture and wind. Int. J. Wildland Fire 26, 71–81. doi: 10.1071/WF16096
Keywords: critical ignition conditions, WUI fuels, wildland fire, firebrand ignition, embers
Citation: Salehizadeh H, Hakes RSP and Gollner MJ (2021) Critical Ignition Conditions of Wood by Cylindrical Firebrands. Front. Mech. Eng. 7:630324. doi: 10.3389/fmech.2021.630324
Received: 17 November 2020; Accepted: 22 February 2021;
Published: 16 March 2021.
Edited by:
Domingos Xavier Viegas, University of Coimbra, PortugalReviewed by:
Xinyan Huang, Hong Kong Polytechnic University, Hong KongWei Tang, National Institute for Occupational Safety and Health (NIOSH), United States
Albert Simeoni, Worcester Polytechnic Institute, United States
Copyright © 2021 Salehizadeh, Hakes and Gollner. This is an open-access article distributed under the terms of the Creative Commons Attribution License (CC BY). The use, distribution or reproduction in other forums is permitted, provided the original author(s) and the copyright owner(s) are credited and that the original publication in this journal is cited, in accordance with accepted academic practice. No use, distribution or reproduction is permitted which does not comply with these terms.
*Correspondence: Michael J. Gollner, bWdvbGxuZXJAYmVya2VsZXkuZWR1
†These authors have contributed equally to this work