 Yun Zhang1
 Jianlin Liu
- 1College of Pipeline and Civil Engineering, China University of Petroleum (East China), Qingdao, China
- 2College of Engineering, Lishui University, Lishui, China
- 3College of Mechanical and Electrical Engineering, China University of Petroleum (East China), Qingdao, China
The abalone is well known as a non-permanent adhesive organism, and its adhesion mechanism is beneficial to such areas as underwater robotics, high precision sensors, and intelligent devices. Firstly, we observe the posture response of an abalone under the action of different water flow conditions. The result shows that under a high velocity of water, it tends to make its tail comply with the water flow, and vice versa, under a low speed, its head tends to comply with the water flow. The finite element method (FEM) simulation is performed to display the stress field, which can reasonably explain this phenomenon, and the strength check is also made on the pedal and shell. Next, the critical velocity of water flow when the abalone is peeled from the substrate is calculated, where the CEL (Coupled Eulerian-Lagrangian) method is used in simulation. At last, the adhesion behaviors of an abalone located in a trough or when it is behind an obstacle are explored. Most of these findings can be supported by the experimental results. This analysis is helpful to make a deep understanding on the adhesion behaviors of marine creatures.
Introduction
In nature, being faced with the threat from predators, all kinds of marine organisms are challenged with wild environments all the time. In the process of adapting to nature, many marine organisms have mastered various and unique materials, structures and behaviors to meet the need of survival and reproduction (Ortiz and Boyce, 2008; Vincent, 2009; Wan et al., 2019). Among these, one interesting issue is the adhesion of marine creatures. For instance, mussels, barnacles and oysters have evolved to possess the ability of attachment, and actually the organic glue secreted from glands plays a key role during adhesion (Waite, 1987; Khandeparker and Anil, 2007; Burkett et al., 2010; Alberts et al., 2015; Wilker, 2015). On one hand, the adhesion phenomenon brings numerous inspirations for scientists and engineers to develop new typed materials and devices, such as adhesive robotics and underwater adhesion suckers (Autumn et al., 2006; Wang et al., 2017). On the other hand, the attachment of these adhesive animals on the surfaces of ships and other underwater devices will increase the drag and accelerate the corrosion of the surface (Eashwar et al., 1992; Coutts et al., 2007). Much effort has been made to focus on the removal of such fouling organisms, including biological, chemical, and physical methods (Clare et al., 1992; Flemming et al., 1996; Cho et al., 2001; Holm et al., 2003). One typical method is the water sweeping, which has proved to be an effective approach to removing juvenile barnacles on the ship surface (Denny et al., 1985; Larsson et al., 2010).
Another fouling organism is abalone, which has been less cared in the past decades. Although being classified as a kind of non-permanent adhesion animal, abalones seem normally very “lazy”, and they tend to stay at one place all days (Momma and Sato, 1969; Momma and Ryuhei, 1970; Nakamura and Soh, 1997). Recently, extensive studies have been performed about the adhesion behaviors of abalones from various perspectives. Firstly, it has been disclosed that the adhesion mechanism of abalone is mainly due to the van der Waals force between the substrate and the setae on the surface of abalone pedal (Li et al., 2018a). During moving in water, the abalone receives information through its eyes and cephalic tentacle (Wanichanon et al., 2004; Li et al., 2006), and once detecting potential threats it would cling tightly on the surface (Ahmed et al., 2005). In this situation the foot of abalone would generate a huge adhesion force, which is higher than many creatures, such as leech, clingfish and tree frog (Federle et al., 2006; Wainwright et al., 2013; Li et al., 2018b). It was declared that the adhesion strength of the abalone is greatly affected by the wettability and roughness of the substrate (Li et al., 2018a). The result shows that an abalone with the length of 7 cm, can generate an adhesive strength with the value of 0.5 Pa × 105 Pa, even on the PTFE (Poly tetra fluoroethylene) plane whose surface energy is very low (Li et al., 2018b). Not limited to the case of adhesion on smooth surfaces, such as the smooth plane made of glass, steel and PTFE, the abalone could crawl and even attach on the surfaces with very sharp elements, e.g., knifes and nails. The most surprising fact is that the abalone foot has no injury when it quickly climbs on these sharp surfaces (Zhang et al., 2019). Moreover, the abalone foot can not only generate a large adhesive strength, but also can perform large strain (approximately 0.65) in its self-righting process. A recent study shows that, the abalone can produce enough adhesive strength, and the muscle can generate large strain to ensure that it could correct its posture after being flipped (Zhang et al., 2020).
Although the abalone can have a very strong adhesion capability on all kinds of surfaces, the underwater environment is very complicated and the water flow may cause a serious effect on its adhesion state. Obviously, the problem is intractable and challengeable, as it deals with many difficult issues, such as interfacial adhesion, fluid-structure coupling, and flow field demonstration. Thus the current study is directed towards a comprehensive exploration on the adhesion behaviors of abalone under different conditions of water flow.
The outline of this article is organized as follows. In Materials and Methods, we conduct the experiments to observe the response of abalone under different water flows. In Smooth Substrate, the maximum stress of the foot and shell of the abalone is computed by FEM simulation, and it is compared with the tolerant strength which we have measured in our previous study (Zhang et al., 2019). The critical flow speed when the abalone is swept away from the substrate is also figured out by simulation, which is compared with the result obtained by energy analysis. In Substrate With Trough or Obstacle, the adhesion behaviors of an abalone located in a trough or an obstacle are thoroughly explored.
Materials and Methods
Materials
All of the abalones Haliotis discus hannai in the experiment are artificially cultured and bought from a marine aquaculture plant located at the coastal region in Qingdao of China. These alive abalones are selected with the length approximately 5 cm. The abalones are fed in a 480 l tank which is equipped with a thermostat to form a filtering and water circulating system. The temperature of water in the tank is 19 ± 0.5°C. The sea water is made of fresh water and sea salt. The rectangular glasses with the size of 200 mm3 × 200 mm3 × 8 mm3 are used as substrates on which the abalones are raised. All of the substrates are placed in cages which are suspended in the tank. To make sure that each abalone could adapt to the new environment, all the individuals are held in the tank for seven days at least. The abalone is fed with kelp every other three days before the experiment to ensure that all the abalones are healthy (Li et al., 2018a; Zhang et al., 2019; Zhang et al., 2020).
Adhesive Strength Measurement
The adhesive strength measurement of abalone is conducted on the universal testing machine (UTM–1432, Cheng De Jin Jian Testing Instrument Co. Ltd.). Firstly, a self-developed three-pronged steel jaw, which is designed to hold the abalone shell, is clamped by the upper fixture of the machine. And the substrate on which the abalone adheres is fixed on the sample stage. The pulling force is applied to pull the animal from the substrate with the velocity of 20 mm/min, which can be seen as a quasi-static load (Li et al., 2018b; Zhang et al., 2019). And the value of adhesion strength could be recorded by the machine.
Flow Experiment
The experiment conducted in a self-assembled circulatory system consists of a transparent cuboid aquarium with the volume of 0.8 × 0.6 × 0.5 m3, submersible pumps with various displacements and water channels with the size of 0.1 × 0.1 × 1 m3. Flowing in the water channel, the sea water with the salinity of 1.024 is pumped from the aquarium and flows back to the aquarium. In order to reduce turbulence, a rectifying net is installed near the entrance of the channel.
The number of abalone is 43, all samples are divided into three groups. Before being scoured, three groups of abalone are put in the channel with three different initial postures, i.e. facing water with tail, head and the side of the body, shown in Figure 1A. And the water velocity gradually increases to the target to guarantee that each abalone could stretch its foot and generate adhesion on the channel surface. The scouring process under the same target velocity is repeated five times. And each process is kept for at least 30 min. The number of abalones of each posture is recorded after each test. Then the probability p of these three postures is the mean value of five repeated experiments. Then we change the target velocity of water flow and repeat the same procedure.
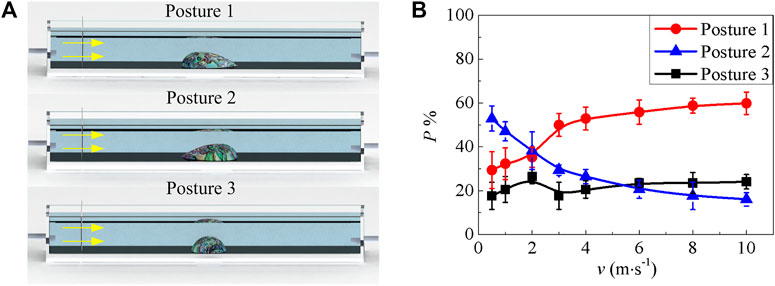
FIGURE 1. Abalone postures in the flowing experiment (A) Abalone with three postures, i.e. it uses the tail, head and side to comply with water (the yellow arrow is the direction of the water flow) (B) Probabilities of three postures under various flow velocities. Error bar is the standard error of five repeated scouring experiments.
Finite Element Method Simulation
We use the commercial software ABAQUS to simulate the pulling off process of abalone from the substrate. Both of the substrate and the abalone are considered as isotropic materials. The Young’s modulus of the abalone foot and shell are 1 MPa and 20 GPa respectively (Menig et al., 2000; Zhang et al., 2019). The Poisson’s ratios of the foot and the shell are 0.16 and 0.3 respectively. For convenience of calculation, the substrate, includes the trough and obstacle, could be treated as a rigid body in simulation. All the substrates are set as the fixed boundary in simulation. The density of water, the abalone foot and the shell are 1,024, 1,500, and 2,700 kg/m3 (Zhang et al., 2020). The foot and shell of abalone is tied via a small area (about 36 mm2) on the top surface of the foot.
The Eulerian and Lagrangian grids are used in liquid and solid parts respectively. The velocities of liquid area walls are set as that the vertical component is zero to avoid the penetration from the walls. The entrance boundary is set as the velocity condition, and the exit boundary is set as the Eulerian boundary with “nonreflecting” to avoid liquid reflection. In order to reduce the calculation, the adhesion between the abalone foot and the substrate is set as the “cohesive behavior”, as the mucus layer is very thin. The contact between solid and liquid is set as the “general contact”. The number of element is 17,839, which consists of 1671 C3D4 elements (abalone foot and shell), 168 C3D8R elements (substrate) and 16,000 EC3D8R elements (liquid).
Smooth Substrate
Experimental Result
In water, three potential postures of the abalone might occur to deal with the water flow. When the abalone faces water with its tail, head and side body, the postures are named as posture 1, posture 2 and posture 3 respectively, which are shown in Figure 1A. The probability for these three postures p with respect to the water velocity v is demonstrated in Figure 1B. It can be observed that, if the velocity is in the range from 0.5 to 2 m/s, the probability of posture 2 is the biggest, and that of posture 3 is the smallest. This indicates that the creature tends to face the water current with its head when the water is in a low velocity. However, with the increase of the velocity, the probability of posture 2 becomes the smallest, especially after v = 6 m/s. On the contrary, the probability of posture 1 increases and it is bigger than that of posture 2 after v = 2 m/s. It is guessed that, under the condition of low speed of water, the abalone can capture necessary information about the water under posture 2. However, when the water has a big velocity it may produce an impact on the abalone, and the abalone will modulate the posture to avoid the impact of water. In addition, the probability of posture 3 fluctuates with the increase of flow velocity, and its values are maintained at about 21%, which are smaller than those of posture 1 throughout the whole process. This is the reason that we have seldom observed posture 3 of abalone during water flow.
Stress Field on the Abalone Pedal
We then use the finite software ABAQUS to simulate the stress field of abalone and the flow field of water. Firstly, at three typical velocities, i.e. the submarine flow velocity (v = 0.5 m/s), the speed of ship (v = 15.43 m/s) and the speed of speedboat (v = 22 m/s), the stress cloud diagrams of abalone pedal are shown in Figure 2. The von Mizes stress of the pedal is defined as
where
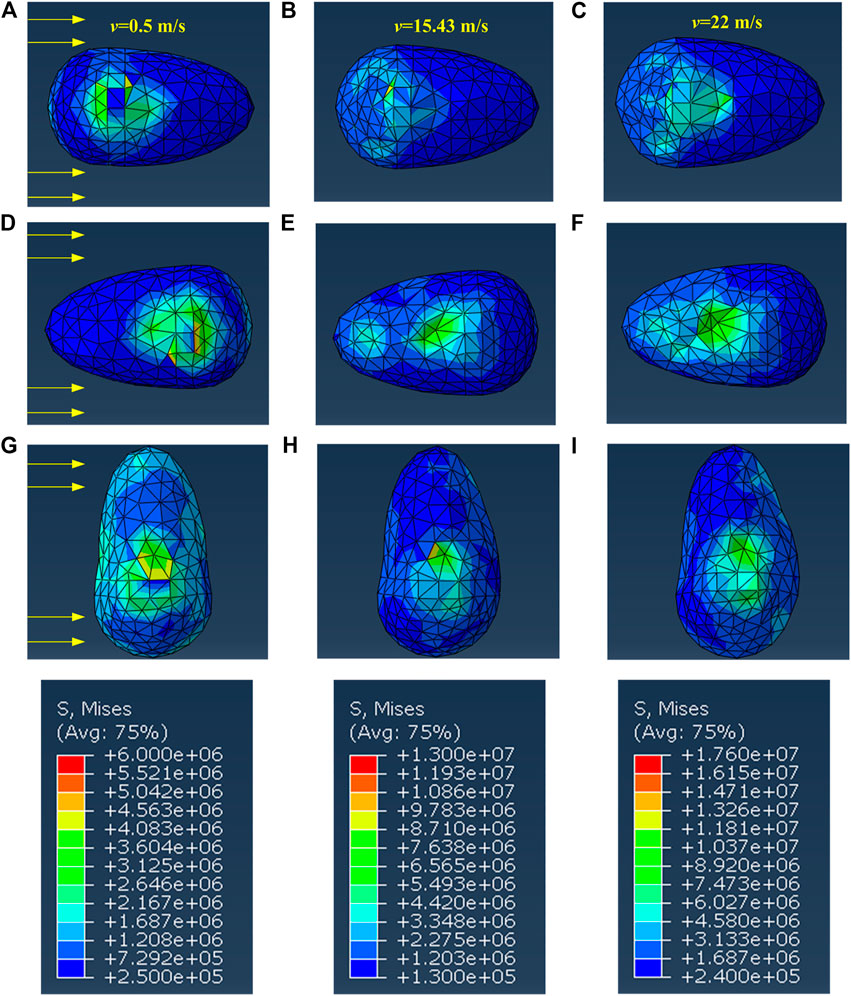
FIGURE 2. The cloud diagram of the pedal’s stress with (A–C) posture 1 (D–F) posture 2 (G–I) posture 3.
When the fluid velocity v = 0.5 m/s, the maximum stress of posture 2 is the biggest in comparison with the two other postures, as shown in Figures 2A,D,G. This stress distribution is not beneficial for the abalone keeping posture 2, but in the experiment we observe that this posture has the highest probability. This phenomenon could be explained from the perspective of the physiological structure of the abalone. Indeed, the animal can capture various information through the antennae and eyes on its head (Wanichanon et al., 2004; Li et al., 2006), and its mouth can also filter algal debris from the current. Although the maximum stress is bigger than those of the other postures, posture 2 is used to deal with water flow, indicating that the abalone can adapt to this stress field conveniently.
Moreover, the locations of the pedal maximum stress for the three postures all change with the increase of the fluid velocity. In detail, when v = 0.5 m/s, the maximum stress appears at the junction between the shell and the foot, see Figures 2A,D,G. With the increase of the current speed, the maximum stress location has transferred to the surface impacted by water, as shown in Figures 2C,F,I. This means that, under the low velocity condition, it is the abalone shell that bears the water impact. However, when the flow velocity further increases, the abalone shell is lifted slightly by water, and thus the abalone pedal is impacted directly by water.
In addition, more cases of the abalone under different fluid velocities are also simulated via FEM. For convenience, the Reynold number is defined as
where
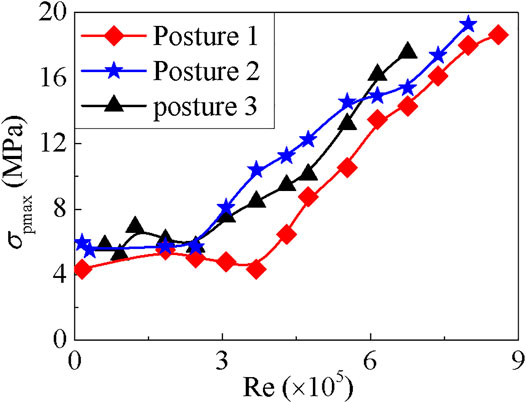
FIGURE 3. The relationship between the maximum pedal’s stress and the Reynold number Re.
However, when the velocity is in the low range, such as when 0 < Re < 3
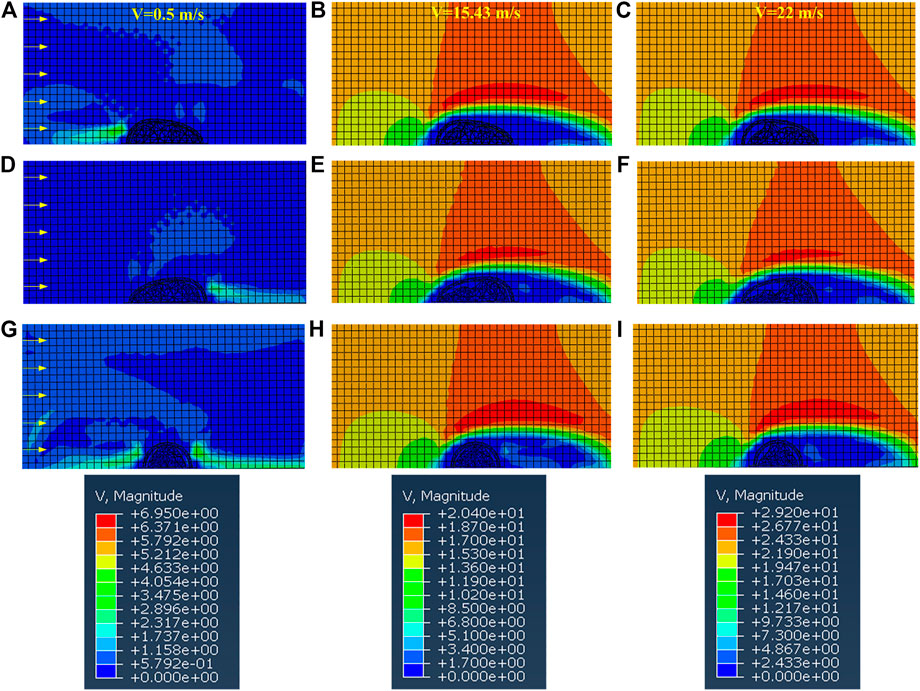
FIGURE 4. The cloud diagram of the velocity field when the abalone faces the water flow with (A–C) posture 1 (D–F) posture 2 (G–I) posture 3.
As shown in Figure 3, the maximum stress of abalone pedal is
Stress Field on the Abalone Shell
Under the action of water flow, the impact is directly applied on the abalone shell. Although the shell looks much stiffer than the muscle, its experimental value was measured as
Based on the FEM simulation, the stress field of the shell for the above three postures is given in Figure 5. It can be seen that the maximum stress increases by 1.38–1.67 times when the velocity changes from v = 0.5 m/s to v = 22 m/s. Moreover, the maximum stress on the shell for posture 1 is the smallest, and that for posture 3 is the biggest when v = 0.5 m/s, v = 15.43 m/s, and v = 22 m/s. This again stresses that posture 3 is seldom observed in experiments.
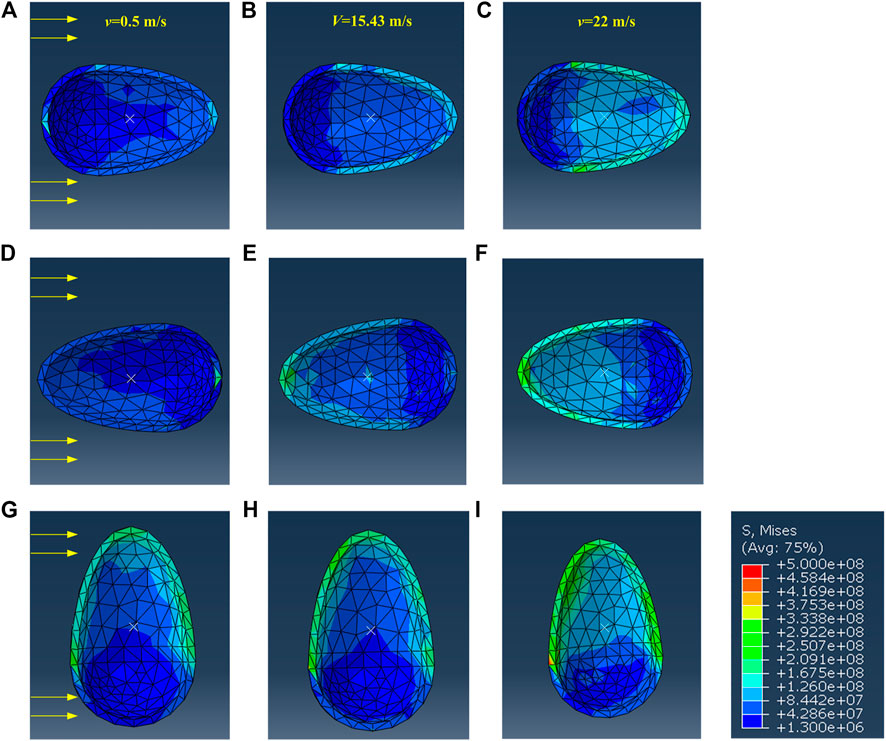
FIGURE 5. The cloud diagram of the shell’s stress when the abalone faces the water flow with (A–C) posture 1 (D–F) posture 2 (G–I) posture 3.
The maximum stress of the shell is located at the side impacted by the water flow, except the case of posture 2 at v = 0.5 m/s. When v = 0.5 m/s, the maximum stress appears at the contralateral side of the impacted aspect of the shell, as during this situation one vortex appears at the tail of the shell. Furthermore, the curves on the maximum stress always fluctuate at low Re values (see Figure 6), and this phenomenon may be due to the appearance of vortex, as shown in Figures 4A,D,G. The curves grow monotonically with the increase of Re, which is the result of the reduction of the vortex, as shown in Figures 4C,F,I.
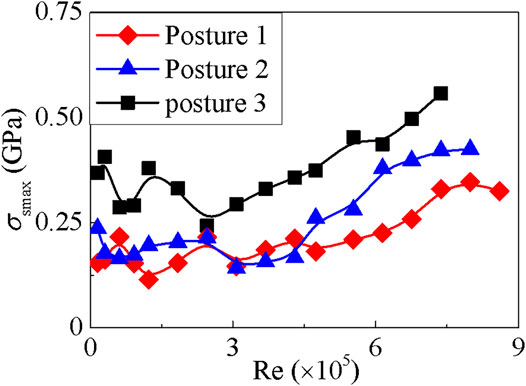
FIGURE 6. The relationship between the maximum stress of the shell and the Reynold number Re.
For the strength check, we select the maximum stress value of the shell shown in Figure 6 as
Calculation of Critical Water Velocity
It can be easily imagined that, when the flow velocity increases continuously, the adhesion of the abalone on the substrate would fail. The critical cases that the abalone is detached from the substrate in these three postures, are thus investigated. Generally speaking, the energy required for detachment of the abalone pedal comes from the water current. For convenience of simplification, the kinetic energy of the muscle is ignored. As the resistance of the abalone, the kinetic energy varies not much even at the critical case.
According to the balance of energy, all the work W done by the current as well as the work W1 done by normal force in normal detachment experiment are converted into the strain energy U and used to overcome the interfacial energy E of the pedal-substrate interface, which can be expressed as
The uniaxial tension experiment on the peeling process of the abalone is schematized in Figure 7A, and then the stress-strain curve is given in Figure 7B. The dimensionless stress is defined as
Thus, W1 can be deduced as
where h is the initial maximum height of the abalone,
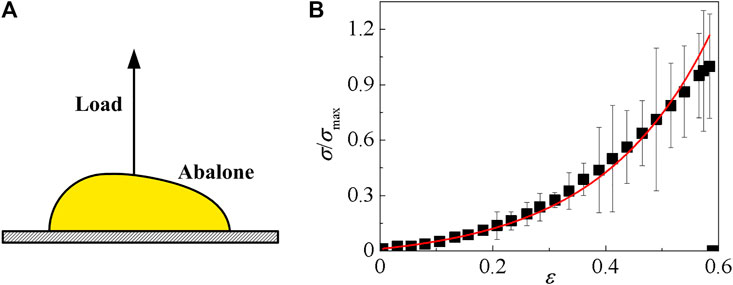
FIGURE 7. Strength measurement experiment on the abalone (A) Schematic of the Experiment (B) The relationship between the dimensionless pulling stress and the strain.
The abalone is subjected to the effect of the flow, which consists of the lift force
where CL and CD are the lift coefficient and drag coefficient respectively, and AD is the frontal area which is measured as 3.5 cm2 for posture 1, 2, and 5.5 cm2 for posture 3. The work of water applied to the abalone can be written as
where UL and UD are the displacements of the abalone when it is peeled, which are obtained via simulation. The symbols CL and CD are affected by the characteristic length L of the abalone and the flow velocity. The values of CL and CD used in this study are obtained at Re ≈ 105, and all of our experimental parameters fall in this range. Since the shape and size of abalone are similar to that of limpet, CL and CD are selected as 0.35 and 0.45 respectively (Denny et al., 1985).
As a consequence, the critical velocities of three postures are theoretically computed as vc = 26.2 m/s for posture 1, vc = 25.8 m/s for posture 2 and vc = 23.02 m/s for posture 3. The results obtained via FEM simulation are vc = 32 m/s for posture 1, vc = 28 m/s for posture 2 and vc = 26 m/s for posture 3 respectively. It can be seen that the errors between two results are 18.12% for posture 1, 7.86% for posture 2 and 11.46% for posture 3. These discrepancies mainly come from the simplification process and energy loss of the water flow, but the theoretical computation and the simulation results are on the same order. According to these results, posture 1 is the best strategy to avoid detachment from the substrate, which agrees with our experimental results.
Substrate With Trough or Obstacle
Another issue is the protective strategy of the abalone, i.e. they can select proper areas to face with the water flows. In the daily life, it is found that many abalones tend to live in narrow crevices whose sizes are similar to abalones, in order to avoid high velocity flows and predators (Shepherd, 1973). Thus, in this section, we discuss the influence of the trough with different heights H on the abalone foot stress field under v = 22 m/s. For convenience, the dimensionless height H/h is used as below. As the trough is narrow and the gap between the abalone and the trough wall is very small, the length between the abalone and the wall is set as 2 mm in the model. This is in agreement with the observations on living abalones. As a contrast, we also conduct the simulation that the abalone hides behind an obstacle. The gap between the obstacle and the abalone is also set as 2 mm. Two terrain models of trough and obstacle are shown in Figures 8A,B respectively, and the parameter H/h ranges from 0 to 6.
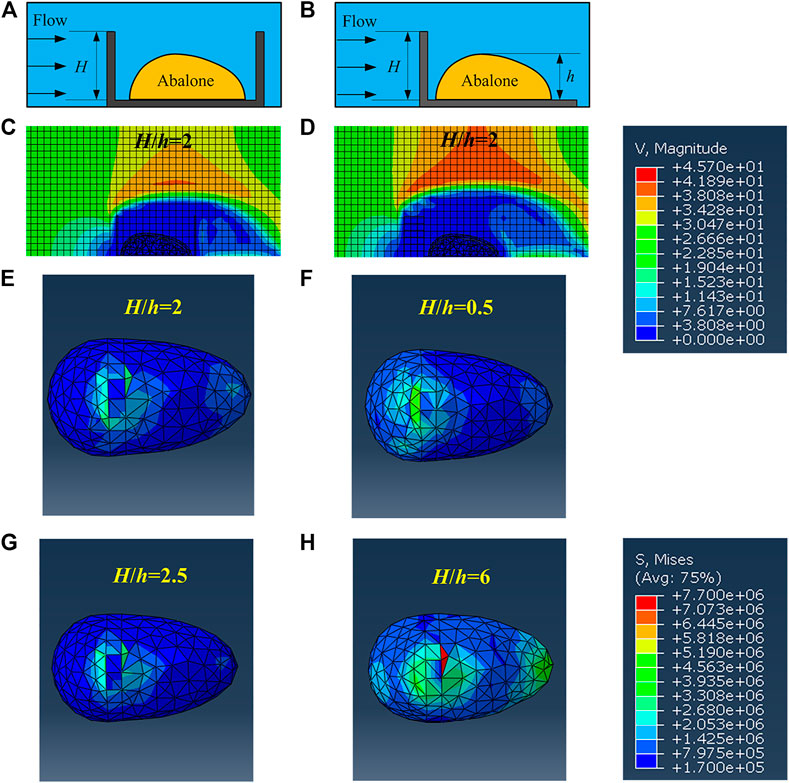
FIGURE 8. Two models including the trough and the obstacle related with the abalone and the cloud diagram of the velocity field and the pedal’s stress (A) and (B) are schematics of the models of trough and obstacle (C) and (D) are the cloud diagrams of the velocity field in the trough and behind the obstacle (E) and (F) are the cloud diagrams of the pedal’s stress in the trough (G) and (H) are the cloud diagrams of the pedal’s stress behind the obstacle.
Compared with Figure 4C, water field has been changed by the trough and obstacle (Figures 8C,D). Thus, the stress state of abalone pedal must be different. Shown in Figure 8, the minimum stress of the foot appears at H/h = 2 for trough (Figure 8E) and H/h = 2.5 for obstacle (Figure 8G). Moreover, the locations of the pedal’s maximum stress appears at the junction between the shell and the foot, even when the pedal’s maximum stress meets its biggest value, i.e. H/h = 0.5 for the trough and H/h = 6 for the obstacle (Figures 8F,H). The similar phenomenon only appears when the abalone adheres on the planar substrate, i.e., H/h = 0 under the low water flow. It implies that two terrains, i.e. trough and obstacle, can significantly reduce the effect of water impact. In particular, the pedal’s maximum stress under the two terrains decreases by 65.89–77.58% for the trough, and 46.2–78.51% for the obstacle respectively, as shown in Figure 9.
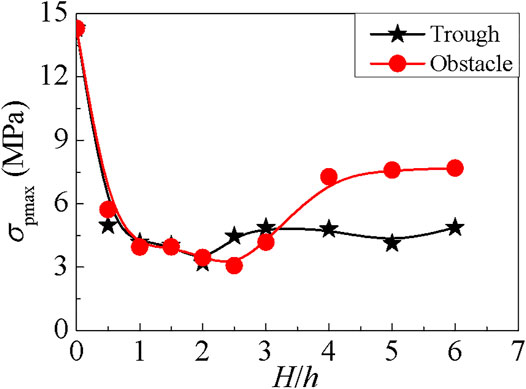
FIGURE 9. The maximum stress of the abalone foot in the trough or behind the obstacle with various values of H/h, where the red curve represents obstacle and the black curve represents trough.
Additionally, when the abalone hides behind the obstacle, the curve of the foot’s maximum stress reduces to the smallest value of 3.071 MPa when H/h = 2.5, then increases and stabilizes at the value of 7 MPa around. When the abalone is in the trough, the curve decreases firstly and attains to the minimum value of 3.2 MPa when H/h = 2, then increases and stabilizes near the value of 4.8 MPa.
It is obvious that the two minimum values are very close, and the foot’s maximum stress is maintained a smaller value when the abalone is located inside the trough. Therefore, the trough is more suitable for the abalone to stay than the obstacle, and this phenomenon has already been observed in previous study (Shepherd, 1973).
Conclusions
In conclusion, the adhesion behaviors of abalone under the action of fluid dynamics is comprehensively studied in this work. We observe that the abalone can adjust its posture in different water flows, and its tail tends to comply with the water flow. We performed the FEM simulation to demonstrate the stress field, and the strength check shows that the shell and pedal are tough enough not to be damaged. The behavior that abalone tends to face water with its tail under high velocity flows as its maximum stress has a small value. Next, the critical water flow velocities of these three postures when the abalone is peeled off from the substrate are calculated via energy analysis and FEM simulation. The results show that the critical velocity obtains the biggest and smallest values when the abalone faces water with tail and head respectively. And this again stresses that the abalone tends to use its tail to deal with water flow. Moreover, the trough and obstacle have both proved to be effective in reducing the pedal’s stress, and the trough may be the better one.
Although more detailed experiments and simulation can be done in future, it is expected that these findings can provide some inspirations to engineer new-typed sensors and devices under water. Indeed, trough-shaped shell could be utilized to protect the core components from the water flow, during the sensor developing.
Data Availability Statement
The original contributions presented in the study are included in the article/Supplementary Material, further inquiries can be directed to the corresponding author.
Ethics Statement
Ethical review and approval was not required for the animal study because The experiments in this study cause no harm to the animal.
Author Contributions
JL (6th author), YZ and SL proposed the theoretical and experimental strategy. YZ, PZ, XX, and JL (5th author) performed the experiment, and YZ carried out the FEM simulation. JL (6th author) wrote the paper. All authors discussed the results and commented on the manuscript.
Funding
This project was supported by the National Natural Science Foundation of China (11972375, 11911530691), and Key R & D Program in Shandong Province (ZR202011050038, 2017GGX20117).
Conflict of Interest
The authors declare that the research was conducted in the absence of any commercial or financial relationships that could be construed as a potential conflict of interest.
References
Ahmed, F., Yokota, M., Watanabe, S., Koike, Y., Segawa, S., and Strüssmann, C. A. (2005). Time to Recover the Upright Posture in Juvenile Abalones (Haliotis Discus Discus Reeve, H. Gigantea Gmelin and H. Madaka Habe). Aquac. Res. 36, 799–802. doi:10.1111/j.1365-2109.2005.01289.x
Alberts, E. M., Taylor, S. D., Edwards, S. L., Sherman, D. M., Huang, C.-P., Kenny, P., et al. (2015). Structural and Compositional Characterization of the Adhesive Produced by Reef Building Oysters. ACS Appl. Mater. Inter. 7, 8533–8538. doi:10.1021/acsami.5b00287
Autumn, K., Dittmore, A., Santos, D., Spenko, M., and Cutkosky, M. (2006). Frictional Adhesion: a New Angle on Gecko Attachment. J. Exp. Biol. 209, 3569–3579. doi:10.1242/jeb.02486
Burkett, J. R., Hight, L. M., Kenny, P., and Wilker, J. J. (2010). Oysters Produce an Organic−Inorganic Adhesive for Intertidal Reef Construction. J. Am. Chem. Soc. 132, 12531–12533. doi:10.1021/ja104996y
Cho, J. Y., Kwon, E. H., Choi, J. S., Hong, S. Y., Shin, H. W., and Hong, Y. K. (2001). Antifouling Activity of Seaweed Extracts on the Green Alga Enteromor Phaprolifera and the Mussel Mytilus edulis. J. Appl. Phycol. 13, 117–125. doi:10.1023/A:1011139910212
Clare, A. S., Rittschof, D., Gerhart, D. J., and Maki, J. S. (1992). Molecular Approaches to Nontoxic Antifouling. Invertebrate Reprod. Dev. 22, 67–76. doi:10.1080/07924259.1992.9672258
Coutts, A. D. M., Taylor, M. D., and Hewitt, C. L. (2007). Novel method for assessing the en route survivorship of biofouling organisms on various vessel types. Mar. Pollut. Bull. 54, 97–100. doi:10.1016/j.marpolbul.2006.09.014
Denny, M. W., Daniel, T. L., and Koehl, M. A. R. (1985). Mechanical Limits to Size in Wave‐Swept Organisms. Ecol. Monogr. 55, 69–102. doi:10.2307/1942526
Eashwar, M., Subramanian, G., Chandrasekaran, P., and Balakrishnan, K. (1992). Mechanism for Barnacle-Induced Crevice Corrosion in Stainless Steel. Corrosion 48, 608–612. doi:10.5006/1.3315979
Federle, W., Barnes, W. J. P., Baumgartner, W., Drechsler, P., and Smith, J. M. (2006). Wet but Not Slippery: Boundary Friction in Tree Frog Adhesive Toe Pads. J. R. Soc. Interf. 3, 689–697. doi:10.1098/rsif.2006.0135
Flemming, H.-C., Griebe, T., and Schaule, G. (1996). Antifouling Strategies in Technical Systems - a Short Review. Water Sci. Technol. 34, 517–524. doi:10.1016/0273-1223(96)00687-710.2166/wst.1996.0591
Holm, E. R., Haslbeck, E. G., and Horinek, A. A. (2003). Evaluation of Brushes for Removal of Fouling from Fouling-Release Surfaces, Using a Hydraulic Cleaning Device. Biofouling 19, 297–305. doi:10.1080/0892701031000137512
Khandeparker, L., and Anil, A. C. (2007). Underwater Adhesion: the Barnacle Way. Int. J. Adhes. Adhesives 27, 165–172. doi:10.1016/j.ijadhadh.2006.03.004
Larsson, A. I., Mattsson-Thorngren, L., Granhag, L. M., and Berglin, M. (2010). Fouling-release of Barnacles from a Boat Hull with Comparison to Laboratory Data of Attachment Strength. J. Exp. Mar. Biol. Ecol. 392, 107–114. doi:10.1016/j.jembe.2010.04.014
Li, J., Zhang, Y., Liu, S., and Liu, J. (2018a). Insights into Adhesion of Abalone: A Mechanical Approach. J. Mech. Behav. Biomed. Mater. 77, 331–336. doi:10.1016/j.jmbbm.2017.09.030
Li, N., He, S., Li, H., and Ke, H. (2006). Microstructure and Ultrastructure of the Cephalic Tentacle of Haliotis Diversicolor. Acta Zool. Sin. 52, 755–764. doi:10.1016/S1004-4132(06)60023-6
Li, S., Zhang, Y., Dou, X., Zuo, P., and Liu, J. (2018b). Hard to Be Killed: Load-Bearing Capacity of the Leech Hirudo Nipponia. J. Mech. Behav. Biomed. Mater. 86, 345–351. doi:10.1016/j.jmbbm.2018.07.001
Menig, R., Meyers, M. H., Meyers, M. A., and Vecchio, K. S. (2000). Quasi-static and Dynamic Mechanical Response of Haliotis rufescens (Abalone) Shells. Acta Materialia 48, 2383–2398. doi:10.1016/S1359-6454(99)00443-7
Momma, H., and Ryuhei, S. (1970). The Locomotion Behavior of the Disc Abalone, Haliotis Discus Hannai Ino, in a Tank. Tohoku J. Agr. Res. 21, 20–25.
Momma, H., and Sato, R. (1969). The Locomotion Behavior of the Disc Abalone, Haliotis Discus Hannai Ino, and the Siebold’s Abalone, Haliotis Sieboldi Reeve, in the Fishing Grounds. Tohoku J. Agr. Res. 20, 150–157. doi:10.1016/j.ijpara.2006.09.009
Nakamura, K., and Soh, T. (1997). Mechanical Memory Hypothesized in the Homing Abalone Haliotis Diversicolor Supertexta under Experimental Conditions. Fish. Sci. 63, 854–861. doi:10.2331/fishsci.63.854
Ortiz, C., and Boyce, M. C. (2008). MATERIALS SCIENCE: Bioinspired Structural Materials. Science 319, 1053–1054. doi:10.1126/science.1154295
Shepherd, S. (1973). Studies on Southern Australian Abalone (Genus Haliotis). I. Ecology of Five Sympatric Species. Mar. Freshw. Res. 24, 217–258. doi:10.1071/MF9730217
Vincent, J. F. V. (2009). Biomimetics - a Review. Proc. Inst. Mech. Eng. H 223, 919–939. doi:10.1243/09544119JEIM561
Wainwright, D. K., Kleinteich, T., Kleinteich, A., Gorb, S. N., and Summers, A. P. (2013). Stick Tight: Suction Adhesion on Irregular Surfaces in the Northern Clingfish. Biol. Lett. 9, 20130234. doi:10.1098/rsbl.2013.0234
Waite, J. H. (1987). Nature's Underwater Adhesive Specialist. Int. J. Adhes. Adhesives 7, 9–14. doi:10.1016/0143-7496(87)90048-0
Wan, C., Ma, Y., and Gorb, S. N. (2019). Compromise between Mechanical and Chemical Protection Mechanisms in the Mytilus edulis Shell. J. Exp. Biol. 222, jeb201103. doi:10.1242/jeb.201103
Wang, Y., Yang, X., Chen, Y., Wainwright, D. K., Kenaley, C. P., Gong, Z., et al. (2017). A Biorobotic Adhesive Disc for Underwater Hitchhiking Inspired by the Remora Suckerfish. Sci. Robot. 2, eaan8072. doi:10.1126/scirobotics.aan8072
Wanichanon, C., Laimek, P., Chitchulanon, N., Suphamungmee, W., Apisawetakan, S., and Linthong, V. (2004). Sensory Receptors on Cephalic and Epipodial Tentacles of Haliotis Asinina Linnaeus. J. Shellfish Res. 23, 1097–1107.
Wilker, J. J. (2015). Positive Charges and Underwater Adhesion. Science 349, 582–583. doi:10.1126/science.aac8174
Zhang, Y., Li, S., Zuo, P., Ji, J., and Liu, J. (2019). The Mechanics of Abalone Crawling on Sharp Objects without Injury. Sci. Rep. 9, 1–7. doi:10.1038/s41598-019-40505-w
Keywords: abalone, adhesion, water flow, stress field, critical flow velocity
Citation: Zhang Y, Li S, Zuo P, Xu X, Li J and Liu J (2021) Adhesion Behaviors of Abalone Under the Action of Water Flow. Front. Mech. Eng 7:659468. doi: 10.3389/fmech.2021.659468
Received: 27 January 2021; Accepted: 03 May 2021;
Published: 26 May 2021.
Edited by:
Ken Nakano, Yokohama National University, JapanCopyright © 2021 Zhang, Li, Zuo, Xu, Li and Liu. This is an open-access article distributed under the terms of the Creative Commons Attribution License (CC BY). The use, distribution or reproduction in other forums is permitted, provided the original author(s) and the copyright owner(s) are credited and that the original publication in this journal is cited, in accordance with accepted academic practice. No use, distribution or reproduction is permitted which does not comply with these terms.
*Correspondence: Jianlin Liu, bGl1amlhbmxpbkB1cGMuZWR1LmNu