 Elias Bearinger
 Brian Y. Lattimer
 Jonathan L. Hodges
 Christian Rippe
 Anil Kapahi2
- 1Virginia Tech, Blacksburg, VA, United States
- 2Jensen Hughes, Blacksburg, VA, United States
Firebrands are known to cause ignition of structures far from the primary fire front, resulting in significant damage to structures before firefighting can be attempted. To make structures more resilient to firebrand ignition, a better understanding of the heat transfer from firebrands to surfaces is needed. This paper provides a statistical assessment of different factors expected to have an impact on the heat flux from firebrand piles to a flat surface. The factors included in the study were wood moisture content, wood type (hardwood or softwood), wood density, wood state (live, dead, or artificial), wind speed, pile mass, firebrand diameter, and firebrand length. Using design of experiments, test matrices were developed that permitted a statistical analysis to be performed on the data. This statistical analysis was used to quantify which factors had a statistically significant impact on the heat flux from the pile as well as ranking the importance of the different factors. Artificial firebrands were found to have statistically higher heat fluxes compared with natural firebrands. Other factors that had a statistically significant impact on the heat flux were wind speed, firebrand length, and firebrand length-diameter interaction. Firebrand aspect ratio (related to the firebrand length-diameter interaction) is directly related to the pile porosity, which is a measure of the volume of air in the pile. Increasing the aspect ratio (which increases the pile porosity) results in higher heat fluxes across a larger region of the pile and was found to be an important factor. Firebrand diameter and pile mass were found to affect the burning duration but not as significantly as other parameters. The number of firebrands in the pile was also observed to potentially affect the heat flux, with a critical number required to reach the highest heat flux for a given firebrand geometry.
Introduction
For much of the world, wildland fires present a serious and reoccurring threat to life, property, and the environment. The recent 2019–2020 fire season in Australia for example was so severe that it was named the Black Summer (Deb et al., 2020), with a cumulative 97,000 km2 of vegetation burned (Ward et al., 2020). Tragically, Australia’s Black Summer resulted in the destruction of 3,000 homes and 33 direct fatalities (Filkov et al., 2020). This type of destruction from wildland fires has been increasingly seen around the world. The 2017 fires in Portugal killed 112 people (Turco et al., 2019). In 2018, fires in Greece burned 3,000 houses (Lagouvardos et al., 2019). In the United States, the 2018 Camp Fire alone killed 85 people and destroyed 19,000 structures (Brown et al., 2020). Much of the human toll from these fires occurred in the wildland urban interface (WUI), the confluence of rural and developed environments. As the wildland urban interface continues to expand (Theobald and Romme, 2007), there is a pressing need to design structures to withstand the potential destruction caused by wildfires.
Wildfires produce airborne pieces of burning vegetation and debris known as firebrands, which have been shown to be a prominent mode of home ignition (Mell and Alexander, 2009). Firebrands are particularly dangerous due to their lofting potential. The high winds associated with wildland fires can transport these firebrands 1–2 km from the fire front (Koo et al., 2010), where they have been witnessed to cause home ignition without direct flame contact. Experimental work has shown that during wind-driven firebrand showers, firebrands can accumulate in piles and easily ignite common building materials (Manzello and Suzuki, 2014). Understanding heat transfer from piles of firebrands is an important step in engineering fire-resistant structures.
One of the difficulties in identifying the risk of a structure igniting due to firebrand piles is the uncertainty and variability in the heat transfer from firebrand piles to surfaces. Early work in the field conducted by McArthur and Lutton investigated the ignition of mock building assemblies by radiata pine wood cribs at 3–5% moisture content. Crib masses from 0.8–12.0 g were tested in the absence of wind and it was found that burning damage to the structure increased with crib mass (Mcarthur and Lutton, 1991). Dowling collected embers from burned wood cribs which were then used to test the ignition of timber bridges. It was found that 7.0 g of firebrands deposited in a 10 mm gap was sufficient to cause ignition with no wind applied (Dowling, 1994).
Tests were conducted by Manzello et al. (2008) using machined Douglas fir firebrands to assess ignition in various fuel beds. The firebrands were cylindrical and came in two sizes. The first size had a diameter of 5 mm and a length of 51 mm, while second size had diameter of 10 mm and length of 76 mm. The study included tests with single and groups of four firebrands. It was found that increasing the number of deposited glowing firebrands led to an increased likelihood of ignition when all other factors were held constant. Increasing firebrand size and wind speed also led to increased ignition (Manzello et al., 2008). In another similar study, also by Manzello et al. (2006) ponderosa pine disks were used for firebrands. The authors point out that compared with disks, approximately half the mass of cylindrical Douglas fir firebrands are required to cause ignition under identical conditions (Manzello et al., 2008).
Filkov et al. (2016) investigated the effects of firebrand size, firebrand quantity, and wind speed on the ignition of pine needle beds at 9.3% moisture content. The firebrands were made from pine bark 5 mm thick with lengths and width dimensions of 10 × 10, 15 × 15, 20 × 20, 25 × 25, and 30 × 30 mm depending on the test. Firebrand quantity ranged from 1 to 10, and wind speed was varied between 0 and 3 m/s. It was found that the ignition of the fuel beds depended on the size and quantity of firebrands, with ignition being more likely with a greater quantity of large firebrands. For a given firebrand size and quantity, the likelihood of ignition increased with wind speed (Filkov et al., 2016).
Two separate studies investigated the ignition of recipient fuels by firebrand piles based on the geometric configuration of the piles and the substrate. Santamaria et al. (2015) used slices of bark to assess ignition on flat and angled (120°) configurations and concluded that ignition depends on pile mass. Manzello et al. (2009) also looked at the effect of configuration using plywood and oriented strand board with ponderosa pine firebrands. The size of a crevice between two boards was varied by changing the crevice angle. Results show that there was an interplay between configuration, wind, and mass/number of firebrands. Generally, the likelihood of ignition increased with increasing wind speed and decreasing crevice angle (Manzello et al., 2009).
The studies mentioned so far have mainly relied on binary observation data to assess heat transfer from firebrand piles (i.e., the pile did or did not cause ignition under certain conditions). Hakes et al. (2018) were some of the first to characterize the heat transfer from firebrand piles. Heat flux data was taken with both a 1.27 cm water-cooled heat flux gauge (WC-HFG) and an array of thin-skin calorimeters (TSC). The TSC’s were used to resolve the distribution of heat flux across the surface area but suffered from poor spatial resolution (1.5 cm). All firebrands used in this study were 25 mm long, with diameters of 6.35, 9.5, and 12.7 mm. Deposited piles masses ranged from 0.1 to 9.6 g, and cases with and without wind were tested. It was found that for a given firebrand diameter, increasing the pile mass resulted in increased heat flux and duration. Additionally, it was found that if two piles had the same mass, the diameter of the firebrands within the piles made little difference on the recorded heat flux, a finding at odds with previous studies which point to firebrand geometry as an important parameter (Manzello et al., 2008). It was also found that wind substantially increased the heat flux from the firebrand pile but shortened the burning duration (Hakes et al., 2018). Bearinger et al. (2020) conducted a similar study where heat fluxes were measured at a high resolution (0.4 mm × 0.4 mm) using inverse heat transfer with infrared thermography. The authors observed local heat fluxes significantly higher than the critical heat fluxes for many building materials in single firebrand configurations which were not expected to cause ignition from previous studies.
Tao et al. (2020) further investigated the effects of firebrand size and geometry on heat transfer from piles of firebrands. In this study, a combination of firebrands collected from natural vegetation and those made from commercially available materials such as dowel rods were used. Piles were subjected to 0.5–1.4 m/s winds in a wind tunnel and heat flux measurements were again taken using a water-cooled heat flux gauge and TSC array. It was noted that based on the type of firebrand, piles exhibited differing bulk densities (i.e., mass divided by pile volume). The bulk density was found to have a significant impact on the measured heat transfer, but there are likely competing effects between oxygen availability and reradiation within the pile. There also appeared to be a difference in the heat transfer from piles made with natural firebrands compared with those made from dowel rods. As found in all previous studies, increasing wind led to increased heat flux (Tao et al., 2020).
It is apparent that there are many factors that could potentially affect the heat transfer from firebrand piles. Some of these factors such as pile mass, wind speed, firebrand size, and whether the firebrand was made from natural or processed wood have been at least partially explored in previous work. Other factors such as wood moisture content and density have received little attention. The goal of this work was to test the effect of as many independent factors as possible and statistically evaluate their importance. This work explored the impact of eight factors including wood moisture content, wood type (hardwood or softwood), wood density, wood state (live, dead, or artificial), wind speed, pile mass, firebrand diameter, and firebrand length on the heat flux from firebrand piles to a flat surface. Design of experiments was used to develop tests that would permit a statistical analysis of this data to determine the statistically significance of the factors as well as rank their importance on the heat flux from a firebrand pile. The data was then further analyzed to examine the impact of the important factors on the heat flux distributions.
Experimental Methods
A series of tests were conducted using a custom testing apparatus to investigate the impact of the different factors on the heat flux from firebrand piles. High resolution heat transfer measurements from the firebrand piles were collected through time by a method of inverse heat transfer (IHT) using thermographs from an infrared (IR) camera. The test details were developed using design of experiments through the methodologies described below. In addition, analysis methods are described highlighting how the statistical analysis was used to analyze the test data and determine the significance of the various factors.
Experimental Setup
Apparatus
A custom experimental apparatus was developed for this testing (shown in Figure 1) consisting of a wind tunnel, support structure, an infrared (IR) camera, a wire mesh cage, and a black 304 stainless steel plate. The wind tunnel was 2.4 m long by 0.31 m wide with a flow-conditioning section in the middle. The wind tunnel exit was 0.31 m wide and 0.10 m high with a uniform flow across 90% of the opening. The flow through the tunnel was driven by an American Fan Company AF-8 blower, controlled by a 1 hp, 3-phase AC motor and a Reliance Electric SP500 variable speed drive. The maximum flow rate for the tunnel was 3.5 m/s corresponding to volumetric flow rate of 0.106 m3/s (225 cfm).
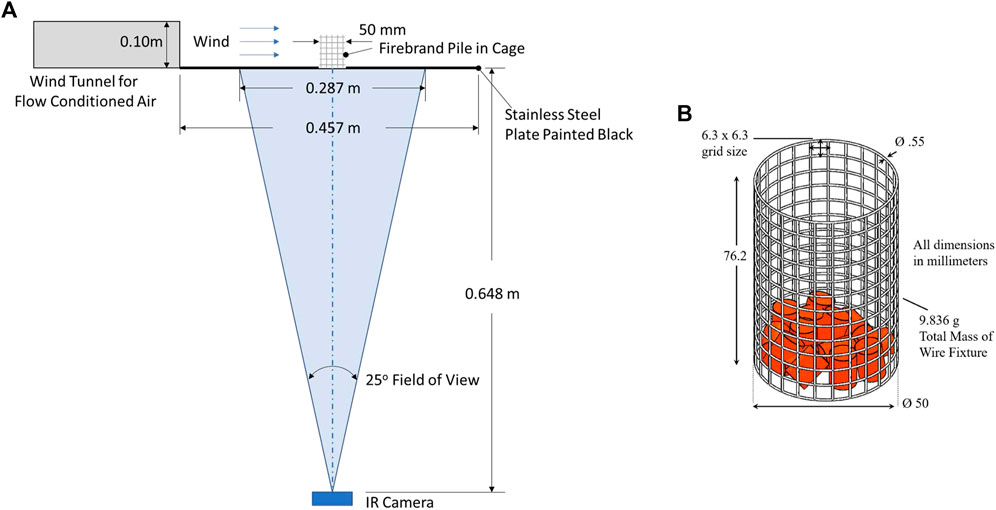
FIGURE 1. Overview of test details including (A) test setup and (B) metal mesh cage used to contain firebrand piles.
The firebrand piles were supported on a 304 stainless steel plate having dimensions 457 mm × 457 mm x 0.762 mm. The plate was painted black on both sides using Rust-oleum™ High Heat black enamel paint. The paint thickness was approximately 20 μm and has been shown by Cholewa et al. (2016) to have an emissivity of ε = 0.97. The plate was clamped to the support structure and carefully leveled such that the top face of the plate aligned with lower edge of the wind tunnel exit. A thin piece of aluminum tape (not pictured in Figure 1) connected the inside of the wind tunnel exit to the top side of the plate, ensuring no wind reached the underside of the plate.
A FLIR A655sc IR camera was used in the testing and controlled by ResearchIR™ acquisition software. The A655sc camera records in the longwave infrared spectrum (7.5–14.0 μm), have 640 × 480 pixel resolution, and used a 25°lens. The camera recorded at 3.13 Hz with the data being down-sampled to 0.28 Hz post-process. The IR camera was used to measure the temperature on the underside of the stainless steel plate, and it was operated in the 100–650°C mode with an emissivity equal to that of the plate (ε = 0.97). In all these tests, the IR camera was positioned 0.648 m below the bottom surface of the plate resulting in a pixel resolution of 0.44 mm × 0.45 mm the plate surface. Plate temperature data from the IR camera was used for the inverse heat transfer calculations as described below.
Firebrand piles have been observed to accumulate on flat surfaces with external wind and remain in a pile due to the larger surrounding pile preventing them from moving (Manzello and Suzuki, 2014). To quantify the heat flux from small piles of firebrands, the firebrands in this study were placed inside a lightweight cage made of steel mesh with dimensions shown in Figure 1. In addition to keeping the firebrands from prematurely blowing off the plate, the cage helped the pile maintain a circular shape with diameter of 50 mm. The 6.3 mm by 6.3 mm gridding was sufficiently porous to allow wind to access the pile while still securing small firebrands.
Inverse Heat Transfer
Inverse heat transfer (IHT) analysis is the method through which the stainless steel plate temperature measurements recorded with the IR camera were used to calculate the heat flux from the firebrands onto a horizontal surface. The advantage of this method is that heat flux measurements can be resolved with the same spatial and temporal resolution as recorded by the infrared camera.
The IHT method using infrared images was originally developed by Rippe and Lattimer (2015) and relies on a thermally-thin interstitial medium (in this case the black 304 SS plate) of known optical and thermal properties between the infrared camera and the heat source. The IR camera was used to obtain a series of 2D temperature measurements of the unexposed side of the plate through time. Each pixel recorded by the camera corresponds to a small, discrete area on the plate and a known temperature. By knowing each temperature value through time and ambient conditions, an energy balance (see Figure 2) was conducted on every pixel to obtain a temporally-resolved 2D heat flux map.
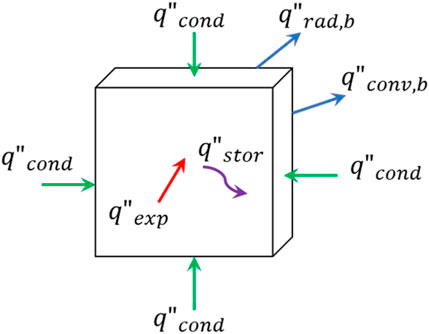
FIGURE 2. Schematic of the energy balance on the stainless steel plate used in the inverse heat transfer analysis.
The net heat flux into each pixel,
where
As the plate temperature increases, the actual net heat flux from the firebrand pile to the plate will decrease as the temperature difference is minimized. For this reason, it is convenient to express the measured heat transfer as the heat flux that would be experienced by a surface maintained at a standard temperature of 20°C (293K). This is also equivalent to the heat flux that would be measured with a water-cooled heat flux gauge. This heat flux at the standard temperature,
where
The above approach was previously verified for measuring heat transfer at this scale over the range of heat fluxes expected for firebrand piles (Bearinger et al., 2020). Based on the error analysis performed in Ref. (Rippe and Lattimer, 2015), the uncertainty in the heat flux measurements is 2.6 kW/m2.
Test Procedure
The details pertaining to each separate test will be discussed in the following sections. Unless otherwise stated, the wood used to make the firebrands was harvested from living trees in the Eastern United States. A single tree of each species provided wood for all tests to reduce variability. To make the unburned firebrands, tree branches were cut to length using a bandsaw and bark was left intact. The length tolerance for firebrands was ±0.5 mm relative to the reported lengths in Table 1. Due to imperfections in the natural samples, some variability existed in the diameter of the firebrands. A diameter tolerance of ±1.0 mm was specified and samples not within this window were discarded. Prior to testing, the firebrands were dried to 0% moisture content (MC) by storing them in an oven at 75°C for several days. It was confirmed that this time and temperature was sufficient to bring the samples to <0.3% MC.
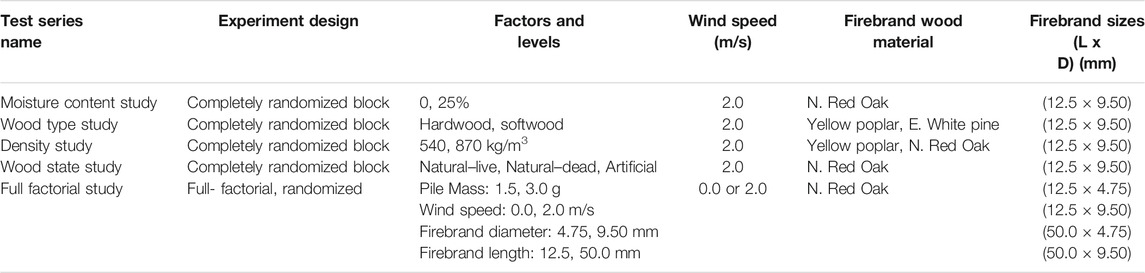
TABLE 1. Tests used to evaluate the impact of eight factors on heat transfer from firebrand piles.
Prior to each test, the metal cage shown in Figure 1B was centered 127 mm from leading edge of the 304 SS plate. For tests with wind, the wind tunnel was started and the wind speed inside the metal cage was verified using an Extech Hot Wire Thermo-Anemometer with 0.1 m/s resolution. A custom funnel was placed on top of the cage to facilitate firebrand placement. Initially it was found that during tests with wind, the firebrands were blown to the trailing edge of the cage during the placement process. For this reason, a wind shield was added in front of the cage during the setup and removed at the start of testing. Data acquisition for the IR camera was started prior to the heating of the firebrand pile.
To make the firebrand pile, a carefully measured mass of unburned firebrands was heated in a wire mesh basket over a propane gas burner. Heating times and initial masses of unburned firebrands are recorded in the following sections. The initial heat time corresponded to when all the firebrands reached a state of self-sustaining flaming combustion after which the propane burner was turned off. The firebrands were allowed to flame and transition to smoldering combustion while the mass was monitored using a Sartorius FB6CCE-S scale with 0.1 g resolution. Once the total mass of the firebrands reached the desired deposited mass (approximately 60–120 s after the flames went out), the glowing firebrands were poured into the funnel and allowed to fall randomly within the cage. The funnel and wind shield were removed, and the firebrand pile burned unhindered until the peak temperature within the pile dropped below 100°C, at which point the test was ended. The firebrand piles left some residue on the plate during burning, so no more than two tests were conducted on the same plate before the plate was cleaned with acetone and repainted. No paint discoloration was observed following the firebrand pile exposures.
Design of Experiments
Experimental design was used to assess the impact of eight factors on the heat flux (response) from the firebrand piles through a series of five different studies, see Table 1. Using experimental design, the details of the tests that need to be performed are established so that the statistical analysis can be conducted on the data. This was done either by tests designed to evaluate main effects only (impact of a factor on the response) or assess the main effects and interactions with other main effects (impact of multiple factors on the response). Using this approach, a total of 33 tests were conducted in this study.
To assess the main effects only, the experimental design was a completely randomized block design to assess the impact of a single factor. Four separate experimental designs were performed to evaluate different factors including wood moisture content, wood type, wood density, and wood state on the heat flux from firebrand piles. In these experimental designs, all variables were kept constant except for the factor being considered. The factor had different treatment levels, which were either a high and low value or a categorical change. The goal of these tests was to determine whether these factors needed to be considered in the full-factorial design which can be time consuming if there are many factors.
To evaluate main effects and their interactions, a full-factorial design was developed based on the four factors expected to influence the heat flux from the firebrand pile. These factors included pile mass, wind speed, firebrand diameter, and firebrand length. For a full-factorial design with four factors (n = 4), this requires 2n = 16 tests without repeats. For each factor, a high and a low treatment level were chosen. These high and low levels were selected to represent the extremes that would likely be seen in a realistic wildfire scenario, but in some cases were subject to constraints of the test setup.
Moisture Content Study
To assess the impact of starting moisture content on the heat flux from firebrand piles, tests were designed with two moisture content levels (0 and 25%) as shown in Table 2. One replication was conducted per level for a total of four tests. Prior to heating, all the firebrands used in this study had length of 12.5 mm, diameter of 9.5 mm, and were made from live Northern Red Oak
where
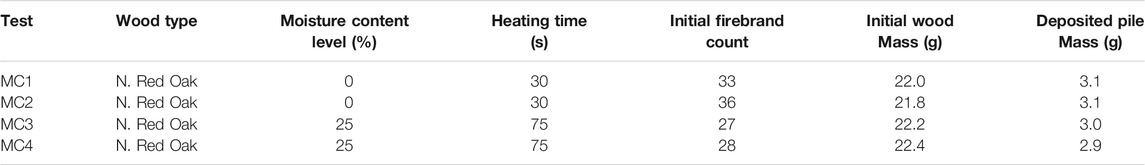
TABLE 2. Test matrix used to assess the impact of starting moisture content factor on the heat flux from firebrand piles. Firebrand diameter 9.5 mm and length 12.5 mm with wind speed 2.0 m/s.
The test details are provided in Table 2. The firebrands at 25% MC had to be heated substantially longer to reach self-sustaining combustion, which was attributed to the fact that more energy was required to also drive off the moisture in the wood before ignition would occur. The number of wood samples used in the testing was determined by preserving the initial mass of wood. The deposited mass is the mass of smoldering firebrands deposited onto the plate and was constant in all tests.
Wood Type Study
Differences exist in the basic cellular structure of hardwoods and softwoods. Char from wood burning is a byproduct in the decomposition of lignin and hemicellulose in the wood with approximately 45% of the lignin mass converted to char and 25% of the hemicellulose converted to char (Yang et al., 2007). Hardwood contains 18–25% lignin and 20–25% hemicellulose while softwood contains 25–30% lignin and 15–20% hemicellulose (Rowell et al., 2012). Based on average values for the lignin and hemicellulose contents, hardwood and softwood would be expected to generate approximately the same amount of char (char fractions of 0.21 and 0.22, respectively). Therefore, differences that may appear in firebrands generated by these types of wood would be attributed to their microstructure or other characteristics.
Hardwoods include many vessel elements that make the wood porous, while softwoods contain an abundance of tracheid cells with no vessels making the wood non-porous (Conners, 2015). Hardwoods come from trees that typically have broad leaves, which they typically loose during autumn, while softwoods are cone bearing trees with needle/scale-like evergreen leaves (Conners, 2015). The sapwood, which the smaller branches are primarily composed from and is on the outside of the trunk and large branches, generally has a higher moisture content in softwood vs. hardwood in living trees. The effects of this higher living tree moisture content was not explored here. Instead, assuming that both types of trees have similar moisture content, the research investigated whether firebrand piles produced from hardwood and softwood trees would result in different heat fluxes to a surface.
This experimental design was developed to have different wood type categorical levels (hardwood and softwood) with similar density. Yellow Poplar
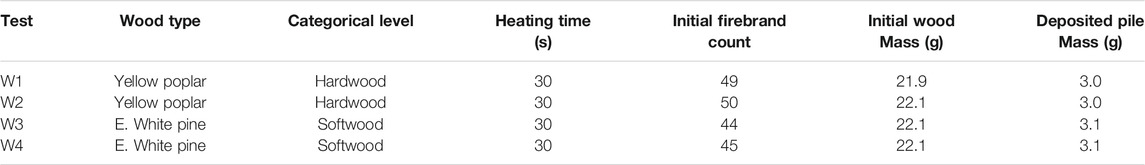
TABLE 3. Test matrix used to assess the impact of firebrand wood type factor on the heat flux from firebrand piles. Firebrand diameter 9.5 mm, length 12.5 mm, and MC 0% with wind speed 2.0 m/s.
Density Study
The impact of firebrand wood density on pile heat flux has received little attention in the literature. To evaluate the impact of this parameter, tests were performed with hardwood but at different density levels using Yellow Poplar
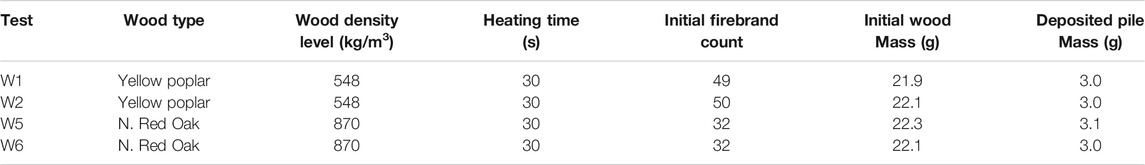
TABLE 4. Test matrix used to assess the impact of firebrand wood density factor on the heat flux from firebrand piles. Firebrand diameter 9.5 mm, length 12.5 mm, and MC 0% with wind speed 2.0 m/s.
Wood State Study
Much of the previous work in the field of firebrand research has used dowels or other commercially-available processed woods to simulate firebrands naturally occurring in wildfires. These “artificial” firebrands typically lack bark, have very consistent sizes, and are made from wood harvested from the trunk of trees instead of the branches. It is unclear how well these artificial firebrands simulate natural results. Tao et. al. (2020) has reported some differences in heat transfer from piles made with natural and artificial firebrands. For cases using natural firebrands, a difference may also exist between firebrands made from living or dead wood.
To explore the impact of firebrand wood state factor, the experimental design included three different categorical levels (artificial, live, and dead) all of the same wood type (Northern Red Oak). Tests at each level was replicated for a total of six tests, shown in Table 5. The unburned live
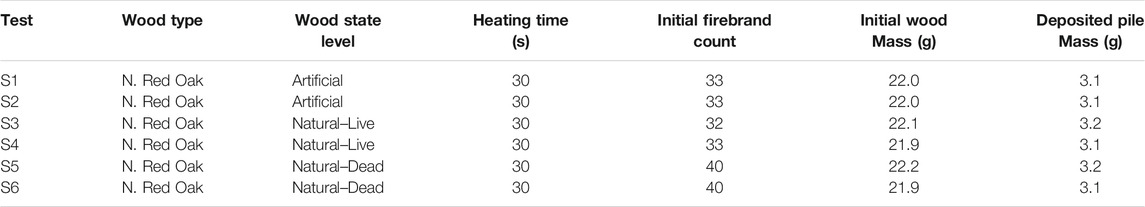
TABLE 5. Test matrix used to assess the effect of firebrand wood state on the heat transfer from firebrand piles. Firebrand diameter 9.5 mm, length 12.5 mm, and MC 0% with wind speed 2.0 m/s.
Full-Factorial Study
The previously described test series have examined the effect of a single factor at different levels on the heat flux from the firebrand pile. While the main effects associated with each factor are important, the interaction between factors may be significant as well and cannot be evaluated using a single factor block design. Recent studies have pointed to a complex influence of pile mass, pile bulk density, and wind speed on the heat transfer from firebrand piles (Hakes et al., 2018; Tao et al., 2020). Pile bulk density is related to pile porosity or the percentage of the pile volume occupied by gases instead of smoldering firebrands. Porosity is of particular interest due to its effect on oxygen availability and reradiation within the pile.
The porosity can be attributed to the packing density of the cylindrical firebrands which has been shown to depend on the aspect ratio
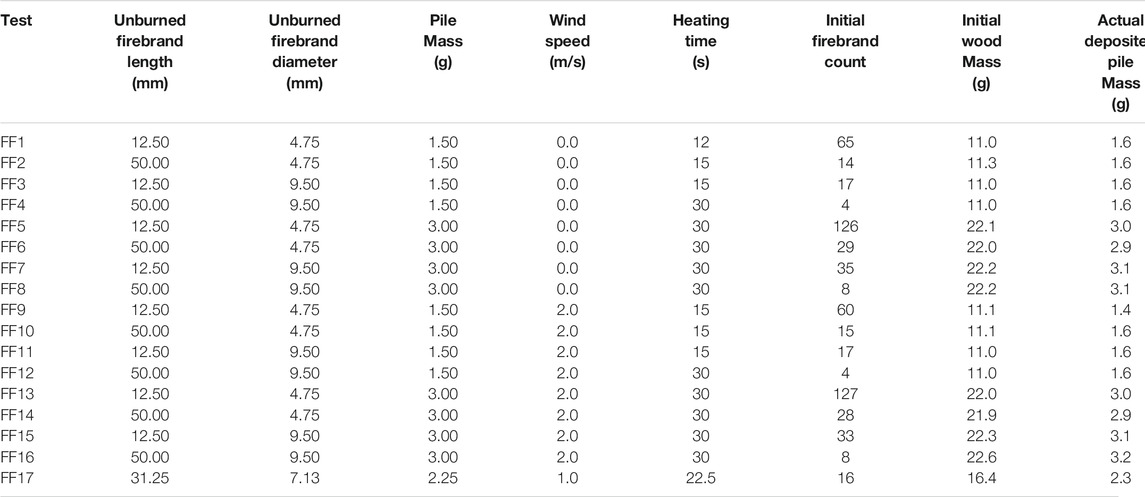
TABLE 6. Full-factorial test matrix used to assess the effect of unburned firebrand length and diameter, pile mass, and wind speed on the heat transfer from firebrand piles from live N. Red Oak branches.
Analysis
The data produced from the tests described were used to produce heat flux distributions from the firebrand piles with time. Additional processing was conducted on this data to reduce it in size to support determining a single heat flux level that could be used to represent the test, which is necessary for the statistical analysis. The details of the statistical analysis performed on each of the five different experimental designs is also provided below.
Heat Flux Data Processing
The infrared images from the IR Camera were used to generate high resolution maps of the heat flux through time. Each pixel corresponded to a 0.44 mm
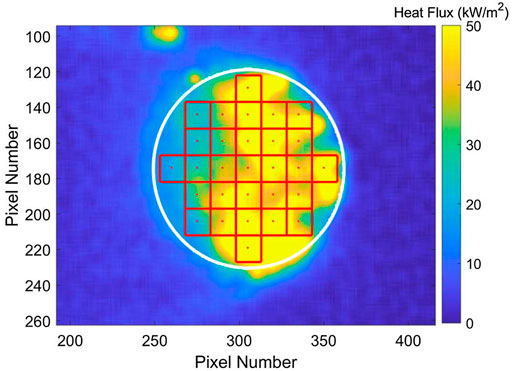
FIGURE 3. 6.6 mm
Statistical Analysis
Three different experimental designs were used in these studies: one factor with two treatment levels, one factor with three treatment levels, and full-factorial (four factors and two treatment levels). For all cases, the objective of the statistical analysis was to determine whether the factor or interaction of factors in question significantly affected the heat flux from the firebrand piles.
One Factor, Two Treatment Levels
The analysis of the experimental designs with one factor (moisture content, wood type, or density) and two different treatment levels (high and low or categorical) was conducted using one-way analysis of variance (ANOVA) to assess whether there was a statistically significant difference in the mean,
One Factor, Three Treatment Levels
For the tests with one factor (wood state) and three treatment levels (artificial, live, dead), Fisher’s Least Significant Difference (LSD) method was chosen to conduct the pairwise comparison on the categorical treatment level means (
Full-Factorial Design (Four Factors, Two Treatment Levels)
The full-factorial design was developed to simultaneously evaluate the four independent factors (wind, pile mass, firebrand diameter, and firebrand length) and all interactions between factors with each factor at two treatment levels (a high and low value) through a series of
Results
Select experimental data produced in this study is provided in this section along with the statistical analysis of this data. An overview of the data produced from individual tests is first provided along with an analysis to determine the appropriate response variable for the statistical analysis (i.e., a single heat flux value to represent the test). In addition, the repeatability of the test is assessed. Using this response variable, statistical analysis was performed on the different experimental designs to determine the impact of the different factors on the firebrand pile heat flux.
Data Overview
The data for the tests consisted of the average flux within each of the 29 grids at every point in time. Figure 4 contains plots of heat flux at each grid as well as the mean heat flux for all grids with time for tests with no wind and 2.0 m/s wind speed.
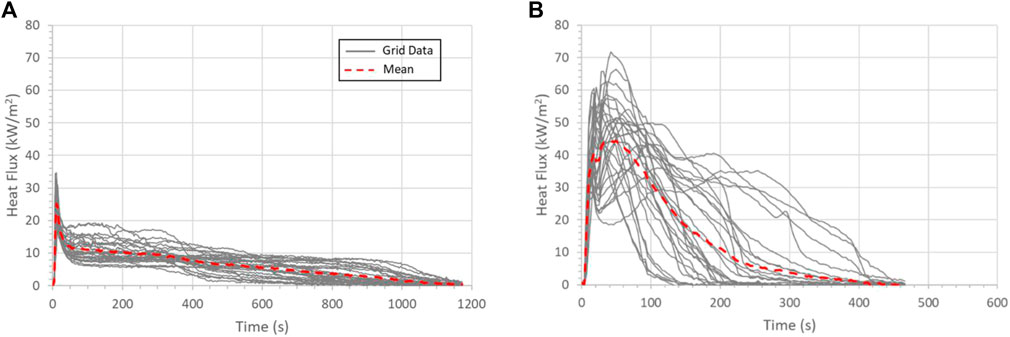
FIGURE 4. Sample grid heat flux data with time for (A) FF6 with no wind and (B) FF14 with 2.0 m/s wind. Tests had a pile mass of 3.0 g containing firebrands with a diameter 4.75 mm, length 50 mm, and 0% MC.
The plots illustrate a trend seen in much of the data where the highest heat fluxes were measured early in the test and then the heat fluxes decreased with time as the firebrands burned out. In general, the effects of wind seen in Figure 4 are indicative of the trends in the data collected in this study. Tests with no wind have lower heat fluxes but longer exposure durations, while the 2.0 m/s wind speed tests resulted in heat fluxes 2–3 times higher but shorter burning durations.
In the statistical analysis, only a single value for the response variable (heat flux) can be used to represent the heat flux for the firebrand pile test. Since this data will be used to assess whether a firebrand pile may cause material ignition, the selected heat flux must represent the high end of the values with space and time. For the spatial variation, a percentile approach was adopted. The 75th percentile of all of the heat flux data was selected since this heat flux would be a level that would bound 75% of all of the measured heat fluxes for a pile. An example of this is shown in Figure 5 for the 120 s average heat flux for the same tests in Figure 4. The histogram represents the frequency of grids at that range of heat flux while the cumulative distribution function (CDF) represents the likelihood (percentile divided by 100) that this heat flux would occur. Since the likelihood is the percentile divided by 100, the 75th percentile would be the heat flux corresponding to a likelihood of 0.75 on the CDF line. For the data shown in Figure 5, the 75th percentile heat flux would be 13.8 kW/m2 for the no wind case and 39.7 kW/m2 for the 2.0 m/s wind case. To include time, different averaging times were considered based on averaging times used in standard material fire testing such as the cone calorimeter. The results of the different averaging times are provided in Figure 6 for both no wind and 2.0 m/s wind speed tests in the full-factorial test matrix, where heat fluxes are the 75th percentile values for each of the averaged quantities. Based on these data, the test average is generally low while the peak values are high compared with the other averages, so these values were not used. The 120 s average heat flux represents a value between the 60 s average, which corresponds to the early time higher heat flux levels, and the longer averaging times which can be skewed low due to firebrand burnout (as seen in Figure 4). As a result, the response variable used in the statistical analysis was the 75th percentile value of the 120 s average heat fluxes for all grids in the test.
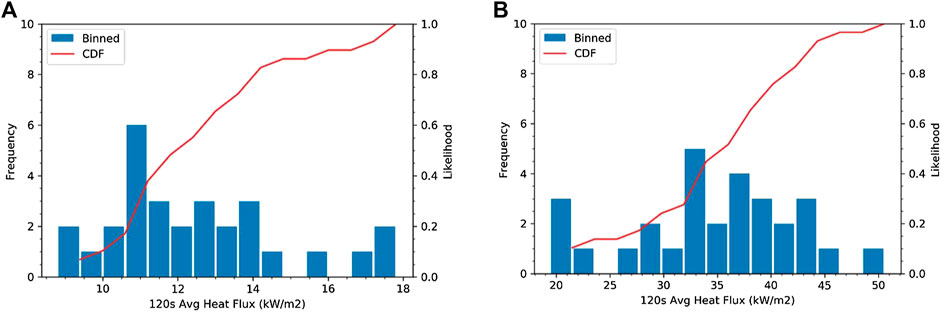
FIGURE 5. Histogram of 120s average heat flux along with CDF for data from test (A) FF6 with 0 m/s wind and (B) FF14 with 2.0 m/s of wind. Tests had a pile mass of 3.0 g containing firebrands with a diameter 4.75 mm, length 50 mm, and 0% MC.
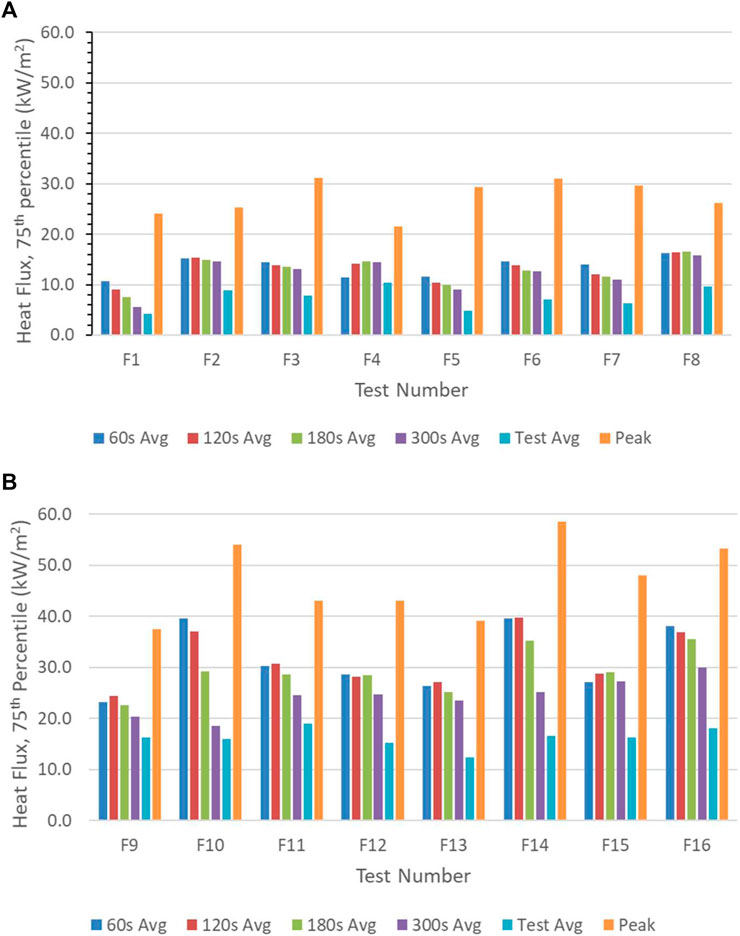
FIGURE 6. The 75th percentile heat flux over different average times and for the peak with (A) a wind speed of 0 m/s and (B) with a 2.0 m/s wind speed for all the full-factorial tests.
The repeatability of the tests was quantified through comparing results of the same test that was performed seven separate times during this study. In these tests, the pile had a mass of 3.0 g and was composed of firebrands with a diameter of 9.5 mm, length of 12.5 mm, and 0% MC. Tests were conducted with a wind speed of 2.0 m/s. The mean heat flux for all grids with time in the repeat tests is provided Figure 7, showing that the heat flux had a similar magnitude and trend in all tests. In addition, the 75th percentile average and peak heat fluxes are provided in Figure 7 along with error bars corresponding to the standard deviation in the data. These results further demonstrate the similarity in results between the repeat tests. For the 120 s average heat flux, the standard deviation in the repeat test data was 3.6 kW/m2.
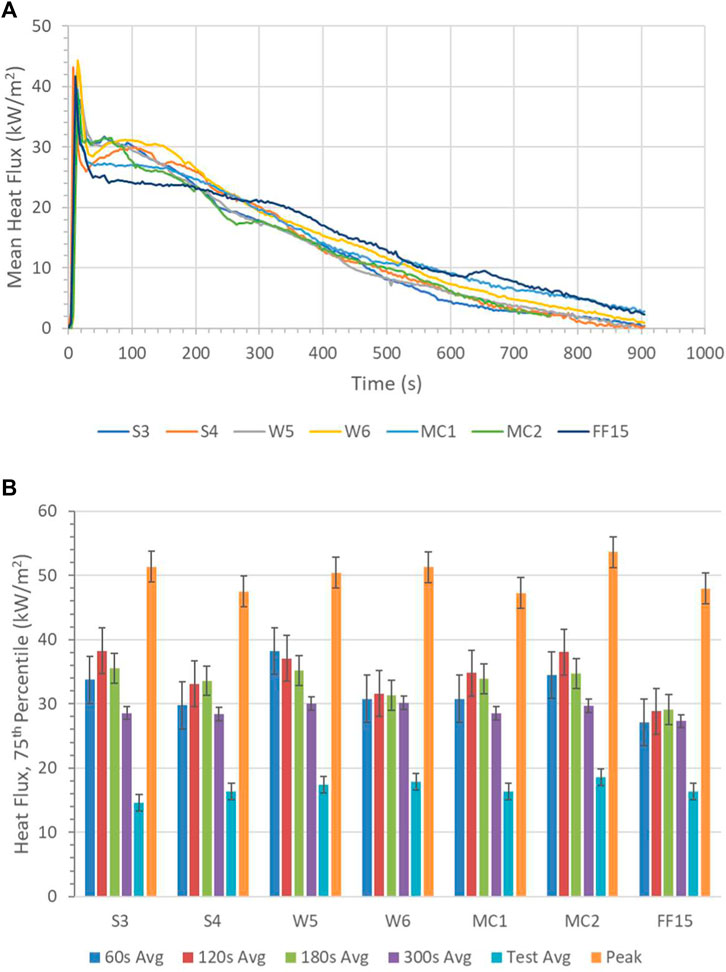
FIGURE 7. Repeat test (A) mean heat flux with time and (B) 75th percentile average heat fluxes. Pile had a mass of 3.0 g with firebrands having a diameter of 9.5 mm, length of 12.5 mm, and 0% MC with a wind speed of 2.0 m/s.
Statistical Analysis of Single Factor Data
Statistical analysis was conducted to evaluate the performance of select single factors including moisture content, wood type, wood density, and wood state. The focus of this analysis was to determine which factors had an impact on the heat flux from a firebrand pile. The results from the tests on the different factors are provided in Figure 8. Heat fluxes are the 75th percentile of the 120 s average heat fluxes at all grids. Each bar represents the mean from the two tests at level while the error bars correspond to the population estimated 95% confidence interval.
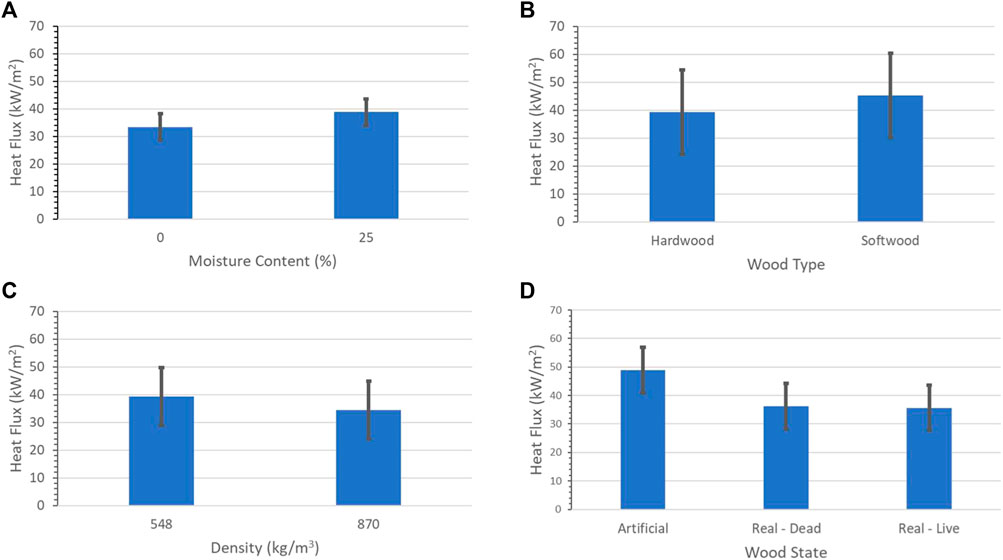
FIGURE 8. Results from the experimental designs to evaluate the impact of single factors (A) moisture content, (B) wood type, (C) wood density, and (D) wood state. Error bars correspond to 95% confidence intervals.
The impact of starting moisture content of the unburned firebrands were statistically analyzed using the one-way ANOVA with the results summarized in Table 7 and Figure 8A. Piles made from firebrands with a starting moisture content of 0% were found to have a mean heat flux of 33.4 kW/m2, while piles made from firebrands with 25% starting MC were found to have a mean heat flux of 38.8 kW/m2 with a population estimated 95% confidence interval of ±4.76 kW/m2. The resulting p-value of 0.075, indicates that this difference does not meet the threshold for statistical significance. As a result, the null hypothesis could not be rejected, and it was concluded that firebrand starting moisture content does not have a significant impact on firebrand pile heat flux. This result was somewhat expected since the moisture was believed to be driven off during burning to form the firebrand.
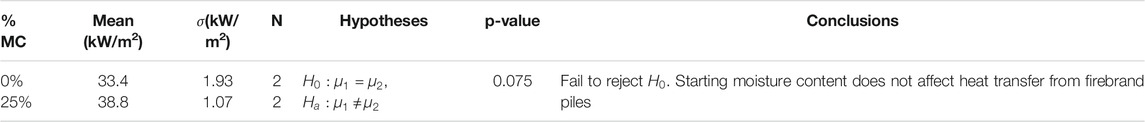
TABLE 7. Summary of the statistical analysis of the effect of starting moisture content of unburned firebrands on the heat transfer from firebrand piles.
The significance of wood type (hardwood and softwood) on the heat flux from firebrand piles is summarized through the data and statistical results provided in Table 8 and Figure 8B. The mean heat flux from firebrand piles made with hardwood firebrands was found to be 39.3 kW/m2 while the mean for the piles with softwood firebrands was 45.4 kW/m2 with a population estimated 95% confidence interval of ±15.1 kW/m2. This higher confidence interval was due to the higher standard deviation measured in these tests. The resulting p-value of 0.346 means the null hypothesis could not be rejected. It was therefore concluded that firebrand wood type does not significantly affect heat transfer from firebrand piles.

TABLE 8. Summary of the statistical analysis of the effect of firebrand wood type on the heat transfer from firebrand piles.
The density study used two types of hardwood firebrands with different unburned dry densities to evaluate whether this parameter influenced heat flux from firebrand piles. A summary of the data are contained in Figure 8C while the statistical results are provided in Table 9. It was found that for low density wood (Yellow Poplar,
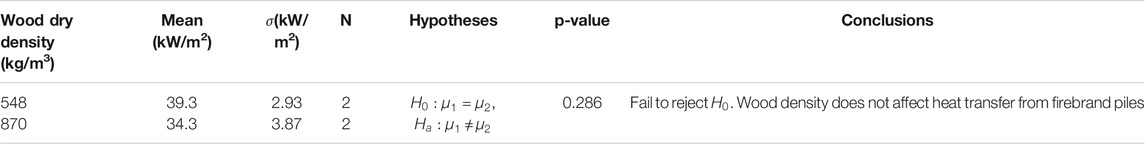
TABLE 9. Summary of the statistical analysis of the effect of unburned firebrand dry density on the heat transfer from firebrand piles.
The wood state study was an experimental design with three treatment levels (live, dead, or artificial) used to assess the impact on the heat flux from firebrand piles. A summary of the data are provided in Figure 8D with statistical analysis results using Fisher’s technique contained within Table 10. Fisher’s technique is used in this case since there are three treatment levels. The output of Fisher’s Pairwise Comparison is the ordered letter report. Treatment levels that do not share a letter have significantly different means. As seen in Table 10, piles made with artificial firebrands have a mean heat flux value of 48.9 kW/m2 which is significantly different the mean value of 36.3 kW/m2 for piles consisting of live firebrands and 35.7 kW/m2 for piles consisting of dead firebrands. The estimated population 95% confidence interval was determined to be 7.98 kW/m2. The ordered letter report confirms that no significant difference exists between piles made of live and dead firebrands. Fisher’s method also gives the p-values for the simultaneous test of the difference in treatment level means, shown in Table 11. The null hypothesis for each test is that there is no significant difference between treatment means.
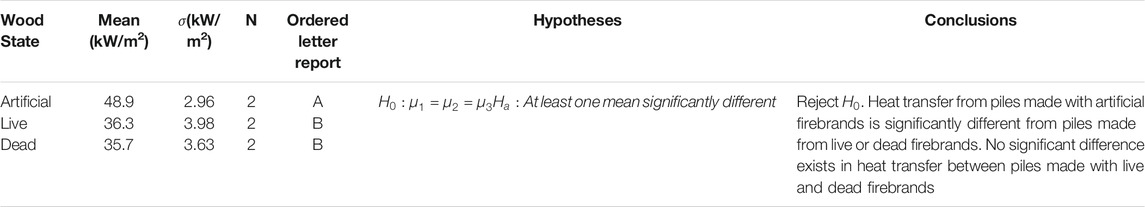
TABLE 10. Summary of the statistical analysis of the effect of wood state on the heat flux from firebrand piles.
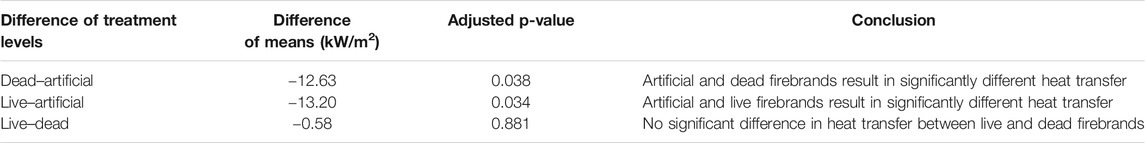
TABLE 11. Fisher’s individual tests for difference of means from wood state statistical analysis.
Statistical Analysis of Full-Factorial Data
The full-factorial experimental design was used to assess the impact of the factors and their interactions on the heat flux from firebrand piles. Results from the four-way ANOVA analysis on the data are shown in Figure 9. The Pareto chart of the standardized effects contained in Figure 9A illustrates the impact of each term ranked from largest to smallest with the threshold for statistical significance denoted by the red dashed line. The standardized effects are t-statistics used to test the null hypothesis that the term has no effect, with larger t-statistics corresponding to smaller p-values. The main effects are denoted by A, B, C, or D for firebrand length, firebrand diameter, pile mass, and wind, respectively. Interactions are denoted using the appropriate combination of letters. The normal plot in Figure 9B provides insight on the impact of the effect on the response with the red line corresponding to the response if the effect from all main effects and interactions were zero. Values positive relative to the line are effects that cause an increase in the response while negative values cause a decrease in response. The only parameter in the plot to be sufficiently far from the red line to be statistically significant is wind and since wind is on the positive side of this line increasing the wind speed is expected to increase the heat flux. From the plots in Figure 9, wind was determined to be the only statistically significant factor with firebrand length being the next most significant.
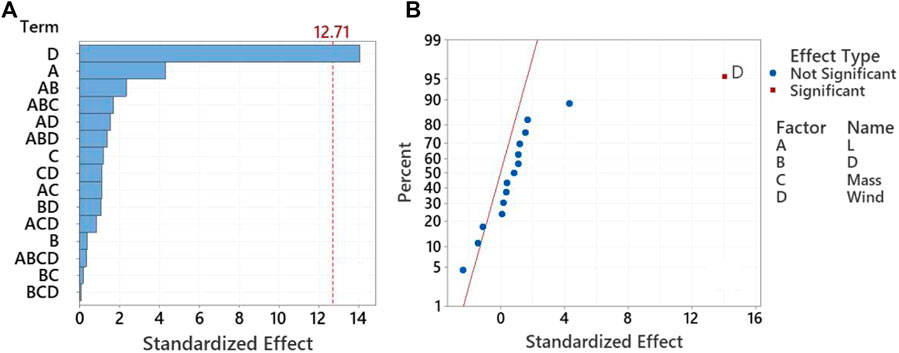
FIGURE 9. Pareto chart (A) and normal plot (B) for the full factorial tests with all terms included.
To improve the model, insignificant high-order interactions can be removed and the model redeveloped. In physical systems, high-order interactions consisting of three or more terms are rarely physically significant. The Pareto chart in Figure 10A, shows that the fourth order interaction between length, diameter, mass, and wind (ABCD) does not appear to be important. The same is true for the length-mass-wind (ACD) and diameter-mass-wind (BCD) third order interactions. These terms were removed, and the statistical analysis was conducted again. Results are shown in Figure 10 for the refined model with three terms now being predicted to be statistically significant: wind (D), firebrand length (A), and the length-diameter interaction (AB). The main effects of pile mass (C) and firebrand diameter (B) were found to have a statistically insignificant impact on the heat flux; however, firebrand length, firebrand diameter and mass (ABC) was nearly statistically significant. From the normal plot in Figure 10B, the wind and firebrand length are both statistically significant and an increase in the factors will result in an increase in the heat flux. The firebrand length-diameter (AB) interaction was also found to be significant but increasing this value results in a decrease in heat flux.
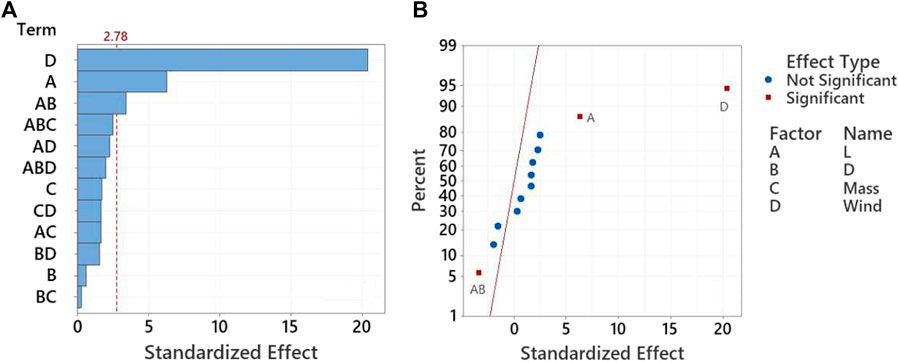
FIGURE 10. Pareto chart (A) and normal plot (B) for the full factorial tests with ABCD, ACD, and BCD terms removed.
In addition to providing the statistical significant terms as well as their relative importance, the statistical analysis of the full-factorial data also provides a linear regression fit of the data based on the terms. The linear regression fit to predict the 75th percentile of the 120 s average heat flux is
where L is the firebrand length (mm), D is the firebrand diameter (mm), m is the applied firebrand pile mass (g), and U is the wind speed (m/s). This equation has an R-squared value of 0.992 but is only valid over the range of the variables tested.
Firebrand Pile Heat Flux Distributions
Statistical analysis was performed using a single response value (i.e., 75th percentile of the 120 s average heat flux). As previously seen, the heat fluxes across the pile are non-uniform and change with time. To better observe these changes, heat flux distributions at different snapshots in time were created for select tests listed in Table 12. This table includes the factors considered in the full-factorial study as well as the firebrand aspect ratio as well as the pile porosity. The pile porosity (ratio of the volume of air in the pile to the total pile volume) was calculated using correlations from Ref. (Zou and Yu, 1996). for a loosely packed pile cylinders and is dependent only on the firebrand aspect ratio. The minimum porosity for loosely packed cylinders is 0.40 while the maximum porosity goes to 1.0 (all air). As seen in the table, decreasing the aspect ratio of the firebrands decreases the pile porosity resulting in less air volume in the pile.
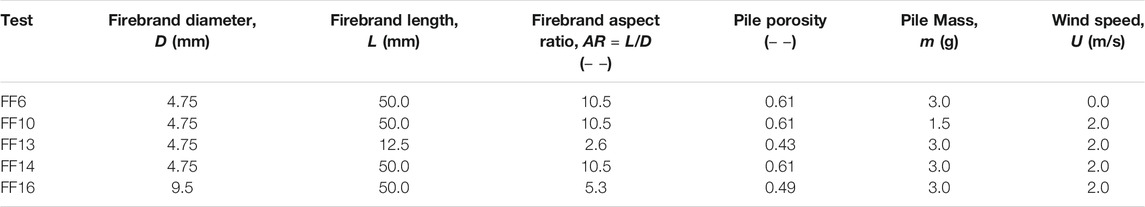
TABLE 12. Tests to compare the effects of different firebrand pile parameters on the heat flux distribution with time.
These tests were selected to highlight the trends observed in the statistical analysis to further demonstrate the impact of these factors on the heat flux from the firebrand pile. For this, tests were selected where only one of the factors was changed and all other factors remained constant. This included the effects of wind speed (FF6 and FF14), pile mass (FF10 and FF14), firebrand length (and aspect ratio) (FF13 and FF14), and firebrand diameter (FF14 and FF16). The different heat flux distributions at different snap shots in time are provided in Figures 11–15 with all figures having the same color scaling for heat flux magnitude. In all tests, the wind is applied on the right hand side (upstream side) of the firebrand pile.
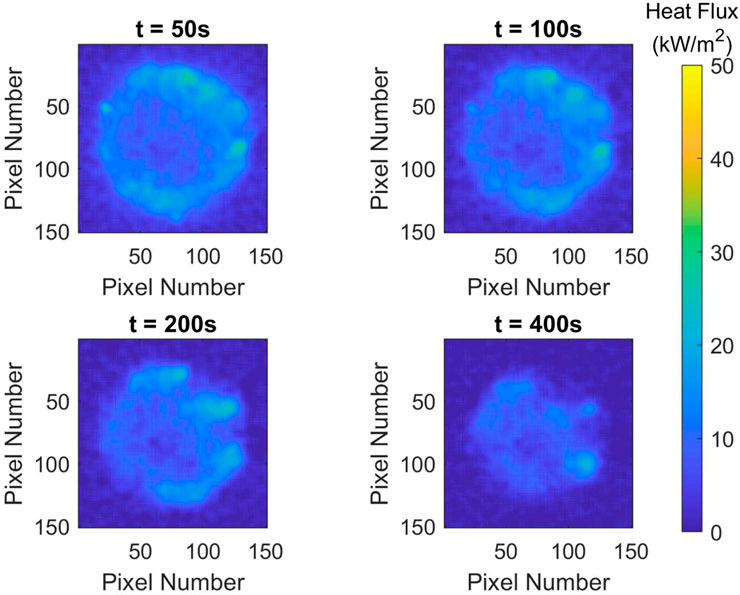
FIGURE 11. Heat flux distribution for test FF6 at different times. Firebrands: D = 4.75 mm, L = 50.0 mm, and AR = 10.5; Pile mass of m = 3.0 g; Wind speed: U = 0.0 m/s.
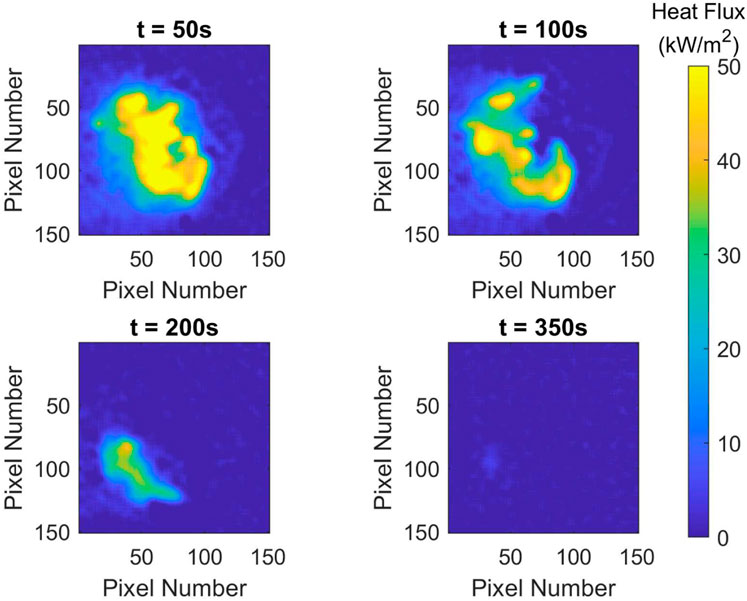
FIGURE 12. Heat flux distribution for test FF10 at different times. Firebrands: D = 4.75 mm, L = 50.0 mm, and AR = 10.5; Pile mass of m = 1.5 g; Wind speed: U = 2.0 m/s.
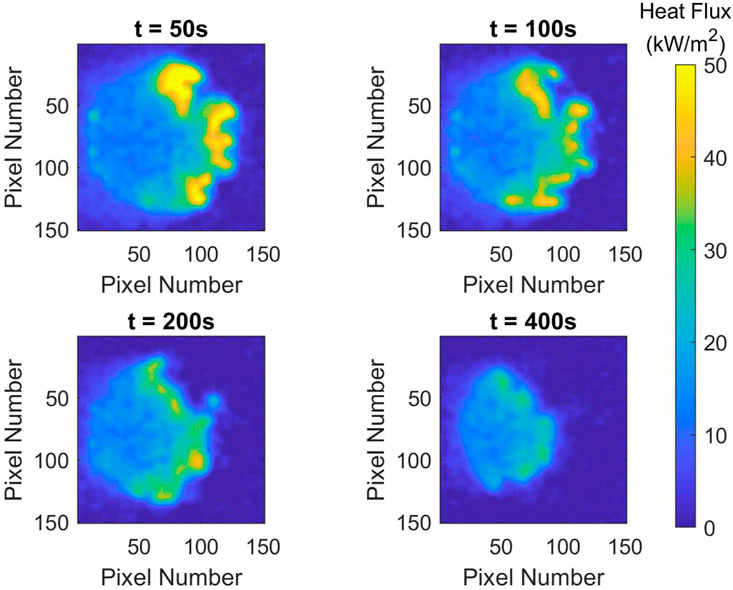
FIGURE 13. Heat flux distribution for test FF13 at different times. Firebrands: D = 4.75 mm, L = 12.5 mm, and AR = 2.6; Pile mass of m = 3.0 g; Wind speed: U = 2.0 m/s.
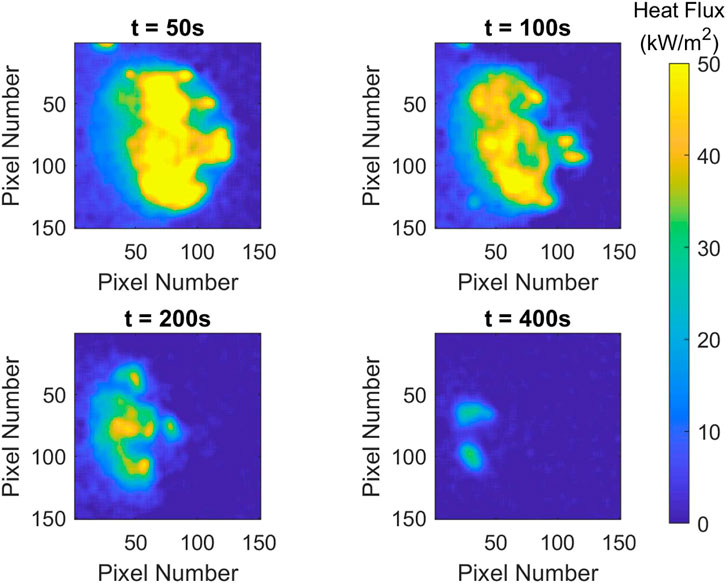
FIGURE 14. Heat flux distributions for test FF14 at different times. Firebrands: D = 4.75 mm, L = 50.0 mm, and AR = 10.5; Pile mass of m = 3.0 g; Wind speed: U = 2.0 m/s.
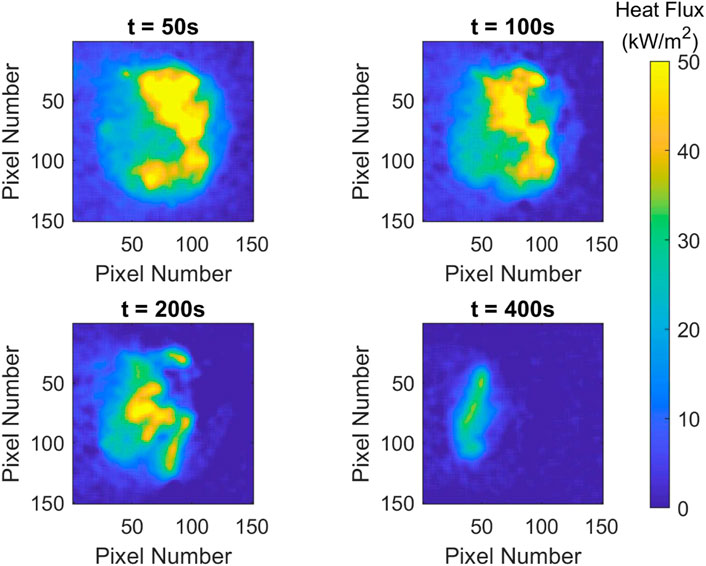
FIGURE 15. Heat flux distribution for test FF16 at different times. Firebrands: D = 9.5 mm, L = 50.0 mm, and AR = 5.3; Pile mass of m = 3.0 g; Wind speed: U = 2.0 m/s.
Discussion
The full-factorial study highlighted factors that were statistically important and ranked them in order of importance based on the 75th percentile 120 s average heat flux. The results from the statistical analysis were compared with the heat flux distribution data measured for the firebrand piles as different snapshots in time to further evaluate the impact of these factors.
The effects of wind speed on the heat flux can be seen through comparing the FF6 test with no wind in Figure 11 to the FF14 test with 2.0 m/s of wind in Figure 14. All other factors were constant. The time data for these tests at each grid location (not shown in these figures) is also provided in Figure 4. In the test with no wind (Figure 11), the heat flux was relatively uniform over the pile and remained constant over the times shown. Tests with 2.0 m/s of wind (Figure 14) had a more non-uniform distribution with the highest heat fluxes on the side where the wind was applied. With time, this high heat flux region migrated from right to left which corresponded to the firebrands being consumed on the upstream side of the pile which allowed downstream firebrands to be exposed to higher wind velocities and more intense burning. Though these firebrand piles had the same mass, the one with no wind was burned for 1,170 s while the one with 2.0 m/s of wind burned for only 465 s. Clearly, wind speed has an impact on the heat flux from the firebrand pile which supports the findings of the statistical analysis as this being the most significant factor.
The impact of firebrand length on the heat flux distribution is seen by comparing Test FF13 in Figure 13 where the length was 12.5 mm with Test FF14 in Figure 14 where the length was 50.0 mm. This also provides a comparison of the effect of aspect ratio, which dictates the pile porosity (or volume of air within the pile). All other factors were constant. Test FF13 had an aspect ratio of 2.6 and low porosity (0.43) while Test FF14 had an aspect ratio of 10.5 and high porosity (0.61). Test FF13 (shorter length, lower aspect ratio, and lower pile porosity) had high heat fluxes at the upstream side of the firebrand pile. However, these high heat fluxes were only measured to be present along the perimeter of the pile with low heat fluxes in the pile downstream of the where the wind was introduced. With time, the pile reduced in size as firebrands were consumed, but the highest heat fluxes always existed at the upstream perimeter with lower heat fluxes downstream. In Test FF14 (longer length, higher aspect ratio and higher porosity pile), the wind was able to penetrate into the pile more compared with Test FF14 resulting in a larger band of high heat fluxes across the upstream portion of the firebrand pile. As a result, the firebrand pile in Test FF14 (465 s) was consumed faster compared with Test FF13 (1,205 s) despite both piles having the same mass. These results confirm that firebrand length has a significant impact on the heat fluxes, which confirms the statistical analysis that had this as the second most important parameter. In addition, these tests also demonstrate the importance of aspect ratio (pile porosity) on the heat flux distribution in the pile. Aspect ratio was not explicitly identified as important in the statistical analysis. However, length times diameter was the third most important parameter and is directly related to aspect ratio in tests where the diameter is constant, AR=(L/D)D2.
The impact of the firebrand diameter on the heat flux distribution is seen by comparing Test FF14 in Figure 14 where the diameter was 4.75 mm with Test FF16 in Figure 15 where the diameter was 9.5 mm. This also resulted in a change in the aspect ratio, with Test FF14 having an aspect ratio of 10.5 and Test FF15 having an aspect ratio of 5.3. All other factors were constant. The firebrand pile in Test FF16 (high diameter, lower aspect ratio) produced a band of high heat fluxes on the upstream side of the pile where the wind was introduced. However, this band of high heat fluxes did not cover as much of the firebrand pile as that measured in Test FF14 (lower diameter, higher aspect ratio). This was attributed to the differences in aspect ratio (pile porosity) in the two tests. Test FF16 with the higher diameter did have a longer burning duration (600 s) compared with Test FF14 with the lower diameter (465 s), which was attributed to the larger firebrand diameter taking longer to be consumed within the pile. These results support the statistical analysis in that firebrand diameter does not seem to have a significant impact on the heat flux; however, the burning duration time was affected as indicated by the times above.
The impact of the pile mass on the heat flux distribution is seen by comparing Test FF10 in Figure 12 where the piles mass was 1.5 g with Test FF14 in Figure 14 where the pile mass was 3.0 g. All other factors were kept constant. The heat flux distributions between these two tests with time are similar. In both tests, there was a high heat flux band on the upstream side of the pile with the heat flux band somewhat larger in Test FF14 with the larger mass compared with the Test FF10 that had the lower mass. With time, this high heat flux band migrated downstream along the pile. The burnout time of Test FF10 (350 s) with the lower mass was shorter than Test FF14 (465 s) with twice the mass; however, the difference in these burning durations is less compared to the effects of other factors on the burning duration. In review of the data, pile mass did not appear to have an impact on the heat flux level unless the number of firebrands in the pile was made small. For example, Test FF12 and Test FF16 had the same factors but different pile mass (see Table 6). In addition, Test FF12 had four firebrands while Test FF16 had eight firebrands. Based on the data in Figure 6, Test FF16 had a higher heat fluxes compared with Test FF12. In cases with more firebrands in the pile (over 15), increasing the pile mass did not have a significant impact on the heat flux as seen in Figure 6 for Test FF9 vs. Test FF13, Test FF10 vs. Test FF14, and Test FF11 vs. Test FF15. This indicates that number of firebrands in the pile is likely a more important factor compared with pile mass and that above a critical number of firebrands the effects of the number of firebrands on the heat flux is not significant. Based on available data, this critical value is between 4 – 8 firebrands that are 50 mm in length over the 50 mm diameter pile area. The magnitude of the heat flux will still be dependent on the firebrand size (aspect ratio and length) as well as wind speed.
Many of the results found in these tests agree well with the developing knowledge of heat transfer from individual firebrands and firebrand piles. The moisture content study showed that the moisture content of the unburned firebrands had no effect on the heat transfer from firebrand piles. The important caveat is that the firebrands in this study were heated until they reached a state of flaming combustion, likely driving off any internal moisture in the process. In a real fire scenario, branches with more moisture may be less likely to form a firebrand in the first place. Firebrands with 25% MC had to be heated 2.5 times longer than those at 0% MC to reach the same state of self-sustaining flaming. This suggests that moisture content may play an important role in the actual formation of firebrands during a wildfire scenario, but not on the burning and heat transfer from an existing firebrand.
The wood type study found that there was no significant difference in heat transfer between Yellow Poplar and E. White Pine, a hardwood and a softwood with similar densities. These results were generalized to say that the wood type does not affect the heat transfer from firebrand piles despite there being fundamental biological differences between hardwoods and softwoods. The closely related density study showed that there were also no differences in pile heat transfer based on the starting dry density of the wood used to make the firebrands.
The wood state study showed that the heat transfer was not statistically different between piles made with firebrands collected from live or dead tree branches. There was however a statistically significant difference between natural firebrands (from live or dead wood) and artificial firebrands made from dowel rods. For the limited data collected in this study, the artificial firebrands generated higher mean heat fluxes compared with the natural firebrands. A difference between artificial and natural firebrands was also reported by Tao et al. (2020), although the trend was opposite of that observed in these tests. This may be in part due to the firebrand diameters and aspect ratios not being the same in these comparison tests as well as the ability of the measurement technique being able to capture the spatial resolution. Based on the results in this study, using artificial firebrands may produce higher heat flux levels compared with natural firebrands. For cases involving safety testing of building materials, a modest overestimation of the heat flux may be desirable and artificial firebrands have the distinct advantage of consistent sizing and ample availability.
Conclusion
A series of tests were conducted to evaluate the impact of different firebrand pile factors on the heat flux from the pile to a flat surface. This included wood moisture content, wood type (hardwood or softwood), wood density, wood state (live, dead, or artificial), wind speed, pile mass, firebrand diameter, and firebrand length. Design of experiments was used to develop test matrices to evaluate the different factors so that statistical analysis could be performed on the results and the statistical significance of the different factors could be determined. An inverse heat transfer method was used to produce high spatial resolution heat flux data under the firebrand piles. The 75th percentile of the 120 s average flux was used to represent the heat flux from the firebrand pile and used to performed the statistical analysis.
It was found that wood moisture content, wood type, and density did not affect the heat flux. Statistically different heat fluxes were measured between natural and artificial (dowels) firebrands with higher heat fluxes from the artificial firebrands. The result suggests that artificial firebrands may be a conservative surrogate for natural firebrands. Based on a full-factorial test series, wind speed and firebrand length were found to have a statistically significant impact on heat flux while firebrand diameter and pile mass did not statistically impact the heat flux. In addition, the interaction between firebrand length and firebrand diameter (length times diameter) was also found to be statistically significant. In tests with constant diameter, the length times diameter is directly related to the firebrand aspect ratio. The aspect ratio controls the pile porosity (ratio of volume of air in the pile to pile volume). Increasing the aspect ratio (which increases the pile porosity) results in higher heat fluxes across the pile and shorter burning times (i.e., a shorter but more intense heat flux to the surface). Pile mass and firebrand diameter were observed to have an impact on burning duration, but not as significant as other effects such as decreasing the pile porosity. Lastly, reducing the number of firebrands in the pile was observed to impact the heat flux when it was decreased below a critical value. This value was not explicitly determined in these experiments but based on the available data is somewhere between 4 – 8 firebrands for firebrands 50 mm long over a 50 mm diameter region. The magnitude of the heat flux will still be dependent on the firebrand size (aspect ratio and length) as well as wind speed.
Data Availability Statement
The raw data supporting the conclusion of this article will be made available by the authors, without undue reservation.
Author Contributions
BL–data and statistical analysis writing paper, paper review EB–experiments, writing paper JH–input on experiments, paper review CR–input on experiments, paper review AK–input on experiments, paper review.
Funding
This research was funded by the National Institute of Standards and Technology (NIST) under contract NIST Grant No. 70NANB19H052.
Conflict of Interest
BL has an ownership/equity interest in Jensen Hughes. Authors JH, CR, and AK were employed by the company Jensen Hughes.
The remaining authors declare that the research was conducted in the absence of any commercial or financial relationships that could be construed as a potential conflict of interest.
Acknowledgments
The authors appreciate the support of the Virginia Tech Statistics Institute (SAIG) for discussions on the statistical analysis.
References
Bearinger, E. D., Hodges, J. L., Yang, F., Rippe, C. M., and Lattimer, B. Y. (2020). Localized Heat Transfer from Firebrands to Surfaces. Fire Saf. J. 120, 103037. doi:10.1016/j.firesaf.2020.103037
Brown, T., Leach, S., Wachter, B., and Gardunio, B. (2020). The Extreme 2018 Northern California Fire Season. Bull. Am. Meteorol. Soc. 101 (1), S1–S4. doi:10.1175/BAMS-D-19-0275.1
Cholewa, N., Summers, P. T., Feih, S., Mouritz, A. P., Lattimer, B. Y., and Case, S. W. (2016). A Technique for Coupled Thermomechanical Response Measurement Using Infrared Thermography and Digital Image Correlation (TDIC). Exp. Mech. 56, 145–164. doi:10.1007/s11340-015-0086-1
Conners, T. (2015). Distinguishing Softwoods from Hardwoods. Agric. Nat. Resour. Publ. 105, 1–5. Available at: https://uknowledge.uky.edu/anr_reports/105
Deb, P., Moradkhani, H., Abbaszadeh, P., Kiem, A. S., Engström, J., Keellings, D., et al. (2020). Causes of the Widespread 2019–2020 Australian Bushfire Season. Earth’s Futur 8 (11), e2020EF001671. doi:10.1029/2020ef001671
Dowling, V. P. (1994). Ignition of Timber Bridges in Bushfires. Fire Saf. J. 22 (2), 145–168. doi:10.1016/0379-7112(94)90070-1
Filkov, A. I., Ngo, T., Matthews, S., Telfer, S., and Penman, T. D. (2020). Impact of Australia's Catastrophic 2019/20 Bushfire Season on Communities and Environment. Retrospective Analysis and Current Trends. J. Saf. Sci. Resilience 1 (1), 44–56. doi:10.1016/j.jnlssr.2020.06.009
Filkov, A., Kasymov, D., Zima, V., and Matvienko, O. (2016). “Experimental Investigation of Surface Litter Ignition by Bark Firebrands,” in AIP Conference Proceedings, 6-9 October 2015, Tomsk, Russia, 1698, 060004.
Hakes, R. S. P., Salehizadeh, H., Weston-dawkes, M. J., and Gollner, M. J. (2018). Thermal Characterization of Firebrand Piles. Fire Saf. J. 104, 34–42. doi:10.1016/j.firesaf.2018.10.002
Koo, E., Pagni, P. J., Weise, D. R., and Woycheese, J. P. (2010). Firebrands and Spotting Ignition in Large-Scale Fires. Int. J. Wildland Fire 19 (7), 818–843. doi:10.1071/wf07119
Lagouvardos, K., Kotroni, V., Giannaros, T. M., and Dafis, S. (2019). Meteorological Conditions Conducive to the Rapid Spread of the Deadly Wildfire in Eastern attica, Greece. Bull. Am. Meteorol. Soc. 100 (11), 2137–2145. doi:10.1175/bams-d-18-0231.1
Li, S., Zhao, J., Lu, P., and Xie, Y. (2010). Maximum Packing Densities of Basic 3D Objects. Chin. Sci. Bull. 55 (2), 114–119. doi:10.1007/s11434-009-0650-0
Manzello, S. L., Cleary, T. G., Shields, J. R., Maranghides, A., Mell, W., and Yang, J. C. (2008). Experimental Investigation of Firebrands: Generation and Ignition of Fuel Beds. Fire Saf. J. 43 (3), 226–233. doi:10.1016/j.firesaf.2006.06.010
Manzello, S. L., Cleary, T. G., Shields, J. R., and Yang, J. C. (2006). On the Ignition of Fuel Beds by Firebrands. Fire Mater. 30 (1), 77–87. doi:10.1002/fam.901
Manzello, S. L., Park, S.-H., and Cleary, T. G. (2009). Investigation on the Ability of Glowing Firebrands Deposited within Crevices to Ignite Common Building Materials. Fire Saf. J. 44 (6), 894–900. doi:10.1016/j.firesaf.2009.05.001
Manzello, S., and Suzuki, S. (2014). Exposing Decking Assemblies to Continuous Wind-Driven Firebrand Showers. Fire Saf. Sci. 11, 1339–1352. doi:10.3801/iafss.fss.11-1339
Mcarthur, N. A., and Lutton, P. (1991). Ignition of Exterior Building Details in Bushfires: An Experimental Study. Fire Mater. 15, 59–64. doi:10.1002/fam.810150204
Mell, W., and Alexander, M. (2009). NIST Technical Note 1635: A Case Study of a Community Affected by the Witch and Guejito Fires. Gaithersburg, MD: National Institute of Standards and Technology.
Rippe, C. M., and Lattimer, B. Y. (2015). Full-field Surface Heat Flux Measurement Using Non-intrusive Infrared Thermography. Fire Saf. J. 78, 238–250. doi:10.1016/j.firesaf.2015.10.004
Rowell, R., Pettersen, R., and Tshabalala, M. (2012). Cell Wall Chemistry. Gaithersburg, MD: National Institute of Standards and Technology.
Santamaria, S., Kempna, K., Thomas, J. C., and Houssami, M. E. (2015). “Investigation of Structural Wood Ignition by Firebrand Accumulation,” in The First International Conference on Structural Safety under Fire & Blast, Glasgow, Scotland, UK, July 2016, 1–13.
Tao, Z., Bathras, B., Kwon, B., Biallas, B., Gollner, M. J., and Yang, R. (2020). Effect of Firebrand Size and Geometry on Heating from a Smoldering Pile under Wind. Fire Saf. J. 120, 103031. doi:10.1016/j.firesaf.2020.103031
Theobald, D. M., and Romme, W. H. (2007). Expansion of the US Wildland-Urban Interface. Landscape Urban Plann. 83 (4), 340–354. doi:10.1016/j.landurbplan.2007.06.002
Turco, M., Jerez, S., Augusto, S., Tarín-Carrasco, P., Ratola, N., Jiménez-Guerrero, P., et al. (2019). Climate Drivers of the 2017 Devastating Fires in Portugal. Sci. Rep. 9 (1), 1–8. doi:10.1038/s41598-019-50281-2
Ward, M., Tulloch, A. I. T., Radford, J. Q., Williams, B. A., Reside, A. E., Macdonald, S. L., et al. (2020). Impact of 2019-2020 Mega-Fires on Australian Fauna Habitat. Nat. Ecol. Evol. 4 (10), 1321–1326. doi:10.1038/s41559-020-1251-1
Yang, H., Yan, R., Chen, H., Lee, D. H., and Zheng, C. (2007). Characteristics of Hemicellulose, Cellulose and Lignin Pyrolysis. Fuel 86 (12–13), 1781–1788. doi:10.1016/j.fuel.2006.12.013
Zou, R.-P., Lin, X.-Y., Yu, A.-B., and Wong, P. (1997). Packing of Cylindrical Particles with a Length Distribution. J. Am. Ceram. Soc. 80 (3), 646–652. doi:10.1111/j.1151-2916.1997.tb02880.x
Keywords: firebrand, piles, heat transfer, statistics, experiments
Citation: Bearinger E, Lattimer BY, Hodges JL, Rippe C and Kapahi A (2021) Statistical Assessment of Parameters Affecting Firebrand Pile Heat Transfer to Surfaces. Front. Mech. Eng 7:702181. doi: 10.3389/fmech.2021.702181
Received: 29 April 2021; Accepted: 22 June 2021;
Published: 07 July 2021.
Edited by:
Domingos Xavier Viegas, University of Coimbra, PortugalReviewed by:
Xinyan Huang, Hong Kong Polytechnic University, ChinaMichael John Gollner, University of California, Berkeley, United States
Copyright © 2021 Bearinger, Lattimer, Hodges, Rippe and Kapahi. This is an open-access article distributed under the terms of the Creative Commons Attribution License (CC BY). The use, distribution or reproduction in other forums is permitted, provided the original author(s) and the copyright owner(s) are credited and that the original publication in this journal is cited, in accordance with accepted academic practice. No use, distribution or reproduction is permitted which does not comply with these terms.
*Correspondence: Brian Y. Lattimer, bGF0dGltZXJAdnQuZWR1