 Christopher A. Brown
- Surface Metrology Laboratory, Mechanical Engineering Department, Worcester Polytechnic Institute, Worcester, MA, United States
Recent advances in surface metrology science are applied to understanding friction with snow and ice. Conventional surface metrology’s measurement, analyses, and characterizations, have inherent limitations for elucidating tribological interactions. Strong functional correlations and confident discriminations with slider surface topographies, textures, or “roughness”, have largely eluded researchers using conventional methods. Building on 4 decades of research using multiscale geometric methods, two surface metrology axioms and corollaries are proposed with good potential to provide new technological insights.
1 Introduction
This paper shows, based on recent advances in surface metrology, how to select topographic measurements, analysis, and characterizations to find strong correlations with friction and with preparation variables. It explains how multiscale topographic analyses and characterizations with clear physical interpretations (Brown, 2018) can be used in research to understand how ski base topographies, aka, structure, textures, or “roughness” influence performance, and how processing influences topographies. This is applicable, of course, to all kinds of friction and motion over snow and ice, not just for snow-sports and skating. Energy consumption for winter road maintenance, like plowing and snow blowing might be reduced with better concepts and knowledge for designing topographies advantageously.
Two empowering aspects of recent advances applied here to friction with snow and ice are scale sensitivity and pertinent geometric characterizations. Scales here refers to certain ranges of sizes, wavelengths, or spatial frequencies. Other factors, like base composition, wax, snow compaction, pressure distribution, and ski flex, are not addressed.
Ski base preparations seem to involve more secrets than science. Apparently, bases are prepared and evaluated using experience and best practices, rather than basic scientific principles. Scientific methods are used, of course. However, scientific principles relating to measuring and analyzing topographies have been missing, and not just for ski bases (Brown et al., 2018). Scientific principles for surface metrology can elucidate productive selections of experimental methods and parameters, which can improve probabilities of finding relations between ski base preparations and tribological behavior through topographies.
Ski and snow surfaces can have complex microgeometries, i.e., topographies, that are challenging to characterize and analyze adequately for understanding their influence on friction, lubrication, and wear of ski-snow interfaces. Classical characterizations, such as average heights like Ra and Sa have not provided many quantitative evaluations that predict performance (Rohm et al., 2016). Literature shows that dynamic ski-snow friction phenomena are complex (Colbeck 1993, 1994). Many kinds of interactions have been discussed, including dry friction, asperity shearing, phase change, melt water lubrication, and capillary adhesion. Liquid layers might start forming near ski tips and grow towards their tails. Friction coefficients and mechanisms can vary with position on skis, depth into textures, pressure, speed, temperature, and snow conditions. Consensus on which mechanism is dominant seems to be lacking, melt layer lubrication or abrasion and dry sliding, although a combination of these two mechanisms seems likely (Kietzig et al., 2010, Nachbauer et al., 2016).
Functional correlations for processing and performance are valuable for designing ski base and other slider topographies and for designing processes to create them. Two kinds of functional correlations (ASME 2019 B46.1 appendix K) are considered here, first processing, between ski base structuring methods and resulting topographies, and second performance, between ski-snow friction and ski and snow topographies. Experimentally, topographies would be dependent variables in the first kind and independent variables in the second. Combining knowledge of both would enable development of design concepts for simultaneous, or concurrent, engineering of products and processes to produce them (Sohlenius 1992; Albano and Suh, 1994; Le Masson et al., 2017). Surface metrology can create value by elucidating relations that support rigorous, evidence-based product and process design for movement over and handling of snow and ice, including, ski bases, snowboards, skate blades, snow groomers, snow plows, snow blowers, and snow making.
2 Approach
Selection of experimental methods and parameters for surface metrology of ski bases should be based on knowledge of and hypotheses relating to fundamental, microscopic topographic interactions contributing to phenomena that produce tribological macroscopic behavior. Scales of interaction and geometric natures of these interactions, in particular, should be considered. Literature on snow and ice tribology is reviewed below from a perspective of measuring and analyzing surfaces to find strong functional correlations with topographies and to discriminate with confidence topographies that were processed or that perform differently.
Scales and scale ranges considered here are generally narrow windows in the spatial frequency spectrum. Topographic measurements can be bandpass-filtered to provide datasets for scale specific and multiscale analyses.
The perspective here comes from four principles for surface metrology presented in section six of a multi-authored review of multiscale analyses and characterizations (Brown et al., 2018). These principles emerged from commonalities observed in surface metrology research applied to diverse kinds of processing and performance. Those that were successful in finding strong functional correlations and discriminating with confidence had those principles in common. Surface metrology historically is based on experience, standards, and best practices. Scientific principles, a small set of simple, self-consistent rules that can be applied to solving a wide variety of problems, have been missing. They provide understanding that simplifies problem solving.
These principles from Brown et al. (2018), topographically related phenomena influencing processes and performance of interest, can be expressed as two axioms and two corollaries to advance a science of surface metrology.
2.1 Axioms
1) Scale. Scales of fundamental interactions should be included in measurements, analyses, characterizations, and statistics.
2) Characterization. Geometric characterizations should be pertinent to geometric natures of interactions.
2.2 Corollaries
1) Measurement. Measurements should have sufficient resolution for pertinent characterizations and size to support adequate statistics.
2) Statistics. Statistics should be appropriate for the natures of interactions, average, variance, extreme value, or some combination.
2.3 Discrete Interaction Models
Discrete interaction models for topographically related phenomena can be helpful for interpreting and applying these principles. An atomistic approach considers topographical surface features at the smallest scales of fundamental interactions controlling the phenomena of interest. Macroscopic behaviors in processing and performance, are agglomerations of these discrete interactions over a surface.
2.4 Terms in Surface Metrology
In this paper the term “sample” is used in a statistical sense. Measurements heights (z) are sampled on a surface (x,y) at sampling intervals. Sensors sense surface heights over finite sampling zones in which heights can vary. Commonly these zones are referred to as points, although heights cannot be sampled at a point.
Area, a geometric property, is used in characterizing topographies as standardized in ISO 25178-2:2012 Geometrical product specifications (GPS), 2012. Areas vary with scales of observation on irregular topographies and can provide useful multiscale geometric characterizations when normalized by nominal areas projected on an x-y plane. The terms region and zone are preferable when not talking about areas with units of length squared with a projection plane or scale indicated.
Multiscale characterizations purposefully calculate parameters, systematically over series of small-scale ranges. Multiscale regressions and discriminations test correlations and confidences in multiple scale ranges using multiscale characterizations. Multiscale characterizations are useful because fundamental scales of interaction usually are not known. Multiscale methods are used to discover fundamental scales (ASME 2019 appendix K).
Roughness is often use colloquially or imprecisely even in technical papers. Often it is difficult to understand what is meant, perhaps a general sense of irregularity, perhaps fine scale topographic features, or peak to valley or arithmetic average roughness. If it is the latter then filtering cutoff wavelengths need to be stated for numerical results too be meaningful.
3 Selected Literature on Snow and Ice Tribology
According to Bowden and Hughes (1939) frictional forces result from minute adhesions acting across contact regions. In addition, in the interface between skis and snow there is a melt layer which provides lubrication. These observations can lead to hypotheses for scales of fundamental interactions, and geometric characterizations, which reflect natures of fundamental interactions. Selections of scales to measure and study should include thicknesses of melt layers and sizes of adhesive bonds. Geometric characterizations should consider geometries and sizes of contact regions.
Melt layer lubrication and capillary adhesion are primary mechanisms in Colbeck’s substantial review of ski-snow friction in 1992. He notes that a mixture of phenomena influence ski-snow friction. Melt layer thicknesses develop along sliders depending on snow and ski surface temperatures, speed, and load. These factors influence how much heat is generated and resulting interface temperatures. Heat generation results in more liquid in melt layers. Melt layers lubricate and promote capillary adhesion. There appears to be an optimal liquid layer thickness for minimum friction. Colbeck emphasizes that topographic elements and contact regions must be characterized to better understand fundamental phenomena responsible for ski-snow friction. This reinforces presumptions from Bowden and Hughes (1939).
Abrasion has received consideration as a ski snow friction mechanism. In studying wear of ski bases, Mathia et al. (1992) take a refreshingly sophisticated approach to surface metrology. They report the stylus tip radius and filtering cutoff used to characterize wear of measured surface profiles with anisotropy, variance, skew, and kurtosis of surface heights, currently Sq, Ssk and Sku, respectively (ASME B46.1 2018, 1–6.3). They note that fine-scale topographic features’ geometric natures should vary with depth in ground surface topographies. Abrasion is the wear mechanism they considered for wearing ski bases. Tribological mechanisms’ complexities, are discussed. Shear strengths of bases, waxes, and snow crystals are hypothesized to influence friction, as opposed to significant melt layers. Ice topographies in sliding contact with polyethylene are characterized with asperities’ inclination angles, “attack angles,” a hybrid parameter composed of height and spatial elements. Attack angles seem to be pertinent, with clearer physical interpretations for abrasion mechanisms than height parameters (Ducret et al., 2005). Ducret et al. noted that friction coefficients depend on attack angle and hardness of ice, consistent with an abrasion mechanism combined with liquid lubrication.
Recent lab tests found no support for melt layers and capillary adhesion at asperities between their slider and compacted snow (Lever et al., 2018). Their circular polyethylene slider caused inter-granular bonds in the snow to fail, moving snow grains with no melting of persistent contacts (friction coefficient, μ < 0.03). At other contact locations, where persistent contacts developed, sliders abraded grains (μ < 0.05). Base topography is treated perfunctorily, with a single value of average roughness, Ra of 0.65 μm, calculated from a measurement made with a stylus profiler. Contact area ratios are calculated in two dimensions from infrared images made up of 15 μm pixels, i.e., sampling intervals, using relatively elevated temperatures to indicate contacts. These contain no knowledge of distributions of sizes of areas or of shapes of individual contact zones.
Average roughness, Ra, a simple height parameter might find optimal roughness for minimal friction when processing conditions, like grinding or sanding of polyethylene, are similar. Systematically varying a process variable through sufficiently narrow ranges can produce topographic features with similar geometric characteristics and different magnitudes. Giesbrecht et al. (2010) did such an experiment using sandpapers with grain sizes from 25 to 200 µm on several kinds of polymer bases. Base chemistries were less important than topographies at Ra values above 200 nm. Optimal Ra values (upper wavelength roughness cutoff, Lc, or λc, 0.8 mm) were 500 nm at a minimum, calculated perpendicular to sliding, regardless of chemistry. Structure direction, or lay, parallel to sliding or circular made remarkably little difference at that scale. They concluded that the dominant mechanism is capillary adhesion in smooth, unstructured bases. Plowing by protruding topographic features starts to dominate when Ra values exceed 100 nm. Ra also gave qualitative indications of dominate mechanisms transitioning from dry to wet. Increasing roughness decreases friction for wet sliding and increases it for dry friction (Velkavrh et al., 2019), Unfortunately these authors do not report their filtering or stylus tip radius as Mathia et al. did in already 1992, so scales of characterization are lost for Velkavrh et al., and their work cannot be repeated or verified. They do not report any other topographic characterization. Sadly, they are not unique in these limitations, many other publications suffer similarly.
Rohm et al. (2016) selected process variables to produce different topographies and performance, although with similar areal averages (Sa) and peak to valley roughness (Sz, S10z) calculated with an upper roughness cutoff, Lc, 1.5 mm. They also reported more sophisticated parameters derived from bearing ratio curves and density functions, like, core roughness depth (Sk), reduced peak height (Spk), reduced valley height (Svk), core material volume (Vmc), core void volume (Vvc), ratio (Vvc/Vmc). Average profile roughness, Ra, can discriminate these surfaces, when measured perpendicular to sliding and calculated with a 0.8 mm upper roughness cutoff, Lc (Rohm et al., 2016). These results support tribological interactions with asperity abrasion and a quasi-liquid water layer. Bearing ratios and density functions can be insightful for understanding mechanism, by quantifying volume available in topographies where liquid water could go. However, these characterizations do not quantify scales or geometries of volume elements nor statistics on their distribution.
Jansons et al. (2021) address shortcomings in surface metrology found in previous works on ski-snow friction by including measurement scales, pertinent geometric characterization, and regression analyses. Measurements were made with a 2 µm radius stylus, over a region 15 × 32 mm with 8000 × 400 measured heights. Sampling intervals are therefore 1.9 and 80 µm. Average roughness (Sa), slope (Sdq), skew (Ssk), and kurtosis (Sku) were calculated according to ISO 25178. They calculated bearing ratios at several depths. Notably, correlation coefficients between sliding times and several topographic characterization parameters are given. A procedure for quantifying functional correlations was recently described in a national standard (ASME 2019 B46.1 appendix K). Correlations between sliding speed and bearing ratio as high as R2 of 0.91 are reported. No trends were observed for skew, kurtosis, or slopes. The latter seems similar to attack angles reported as an indicator of friction by (Ducret et al., 2005), and noted above to be pertinent for friction interactions. Values calculated for slopes depend on sampling intervals (ASME 2019 B46.1). The sampling intervals in Jansons et al., 2021 are rather large, maybe too large to calculate slopes at sufficiently fine scales to observe correlations with sliding times in these experiments.
4 Selected Literature on Surface Metrology
Value in surface metrology largely comes from discovering functional discrimination and correlations of the first and second kinds (ASME 2019 B46.1 appendix K). Knowledge of these functional correlations support evidenced-based design of topographies of products and process to produce them. In addition, there is value in the ability to discriminate, distinguish or differentiate, topographies that were produced or that perform differently. In this section literature is reviewed that has demonstrated value and led to surface metrology principles.
A discrete interaction model for understanding influences of topographies on adhesion was proposed by Brown, 2001. This model supposes that there are fundamental, or characteristic, scales for interactions with topographies. Consider an adhesive bond, perhaps there is a certain minimum size or area required for bonding interactions. Below this scale an adhesive bond cannot be formed. Individual, or discrete bonds, form at this scale. The relation between macroscopic adhesive strength and topographies can be determined from this fundamental scale of a single bond, the strength of a single bond, and the total area available at that scale.
Apparent areas of irregular topographies change with scales of observation, or calculation. At finer scales more topographic details are apparent and actual surface areas increase. Areas at many scales were calculated from areal topographic measurements using a patented triangular tiling algorithm (Brown et al., 1994). Rather than use calculated areas directly they are normalized by dividing by nominal areas of each tiled region to determine relative areas (ISO 25178-2, ASME 2019 B46.1 chapter 10, Brown, 2001). Relative areas can be related to a weighted average of cosines of local inclinations on topographies (Brown et al., 2018). At the largest scales relative areas tend towards one, at finer scales they tend to increase as long as irregularities do. At the limits of resolution, in the absence of high frequency noise in measurements, calculated relative areas remain constant.
Results of an experiment conducted at a Swiss federal lab were consistent with the discrete interaction model for adhesion using relative areas (Brown and Siegmann 2001). A certain pattern in correlation coefficients with scale should be evident if discrete interactions are appropriate for modeling interactions with topographies. Correlation coefficients for adhesive strengths, measured experimentally on several different topographies, are regressed against relative areas many times at individual scales, covering a large range of scales. When these regression coefficients are plotted versus scales at which they were calculated, a maximum should occur around a particular scale. Brown and Siegmann (2001) found increasing regression coefficients with decreasing scales over a significant range of scales, to an R2 of about 0.9, at about the resolution of their contact stylus measurement instrument. Below this scale R2 values remained constant. Greater regression coefficients might have been found if the resolution of their measurements were finer.
Multiscale geometric characterizations using relative areas are not restricted to adhesive applications. Berglund et al. (2010a, b) found strong correlations over narrow scale ranges for friction of aluminum sheet against steel dies with six different topographies. Friction coefficients correlated strongly (R2 ∼ 0.9) with relative areas with a maximum at about 20 µm2 (Berglund et al., 2010b). Because relative areas increase with increasing inclinations, this is consistent with results relating friction to attack angles of inclinations on asperities (Ducret et al., 2005). A series of bandpass filters was applied to these topographic data. Conventional parameters, including average roughness, Sa, resulted in strong correlations (R2 > 0.9), indicating a premier importance of scale specificity in finding strong correlations. With a sufficiently narrow bandpass filter, height parameters should be indicative of slopes at those scales. Bartkowiak et al. (2020) analyzed this same data and found strong correlations with statistics on curvatures at certain scales, which were calculated as second order tensors as functions of scale everywhere on these measurements.
These second order tensor curvature characterizations vary with position, orientation, and scale. Selecting appropriate statistical analyses can be challenging with these three variations.
Curvatures can also be calculated from three points on profiles (z = z(x)). Curvature on profiles correlates strongly (R2 ∼ 0.96) with fatigue limits over a narrow range of scales (Vulliez et al., 2014). For this fatigue work a combination of extreme value and variance statistics provided the strongest correlations. Certainly, extreme value statistics of curvatures are pertinent and appropriate for correlating fatigue life with topographies because cracks initiate at the most extreme stress concentrations and stress concentrations increase with increasing curvatures. Fundamental scales might logically depend on materials’ notch sensitivity and surface conditions.
Wetting contact angles, which have been associated with a basic mechanism of snow friction (Colbeck 1993), can be correlated strongly (R2 ∼ 0.98) with topographies, using multiscale geometric methods (Daniello et al., 2019). Contact angles were measured on water droplets on PDMS (polydimethylsiloxane) surfaces formed by casting against abrasive papers, with grit sizes from 180 to 3000 (80 to 8 μm approximately). Topographies were measured with a scanning laser confocal microscope. Sampling intervals were 0.28 μm. Calculations were done on regions 214 × 214 μm.
Relative areas were calculated as a function of scale following ISO 25178 and ASME B46.1 using Sfrax (the model for Digital Surf's, Mountains Map, Scale-sensitive Analysis Module). Area-scale plots for PDMS formed with seven grits, as indicated, are shown in Figure 1, of relative areas versus the scales of calculation, i.e., areas of triangles used in the triangular tiling algorithm mentioned above.
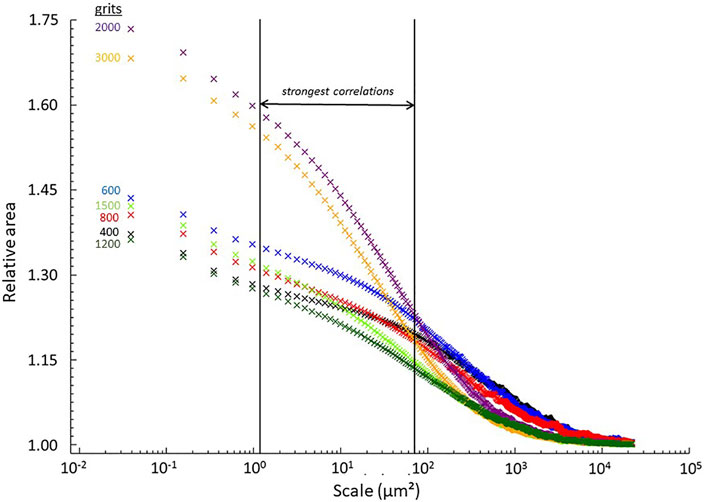
FIGURE 1. Relative area versus scale. Grit sizes are noted on the figure along with the scale range for the strongest correlations of advancing contact angles regressed versus area-scale complexities.
Plots of area-scale complexities (ISO 25178-2, ASME B46.1) versus scale are shown Figure 2. Area-scale complexities are a scale-based finite derivative of relative areas, i.e., best fit slope, calculated over a decade-wide sliding window. These complexities are related to fractal dimensions (Mandelbrot, 1975). These complexities are a kind of bandpass filter, sensitive only to scale-local topography. Relative areas are a kind of lowpass filter, which are sensitive to all scales on topographies above those being analyzed. Note that near the scales of strongest correlations, complexities monotonously increase, according to the grit number the surfaces were formed on, from coarsest to finest. This is not the case for relative areas, in Figure 1.
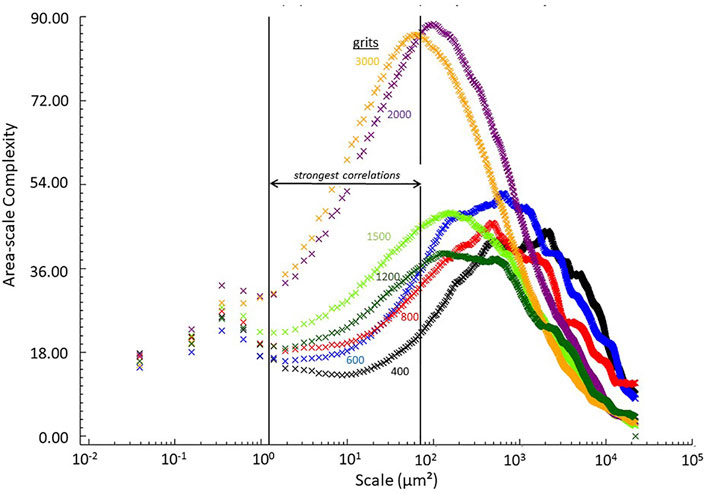
FIGURE 2. Area-scale complexity versus scale. Grit sizes are noted on the figure along with the scale range for the strongest correlations of advancing contact angles regressed versus area-scale complexities.
Contact angles were regressed linearly versus area-scale complexities of surfaces they were measured on. Regression coefficients (R2) are plotted versus scale and shown in Figure 3. At larger scales, above 1000 μm2, R2 varies erratically with scale. At these scales the area-scale complexities vary little, so variations might be due to chance. At finer scales correlations get progressively stronger, reaching a maximum close to 0.99 between 2 and 60 μm2. A regression at the scale of strongest correlation is shown inset in Figure 3. These scales are, phenomenologically at least, good candidates for scales of fundamental interactions. At the finest scales, below about 1.5 μm2, correlation strengths drop precipitously.
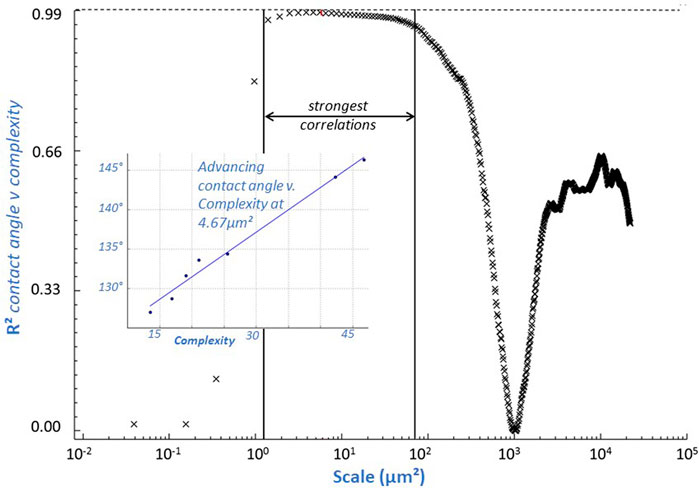
FIGURE 3. R2 versus scale. Regression coefficients for advancing contact angles regressed versus area-scale complexities. The scale range for the strongest correlations are noted. The insert shows a regression line in this range, at 4.67 μm2.
Wetting droplets, which might be considered discrete fundamental interactions, also appear to have discrete finite interactions along the wetting line with the solid. A water droplet on a structured ski base (Jordan and Brown, 2006) is shown in Figure 4. Note that contact line is not smooth. There are local variations in contact angles along the line. This suggests that local contact angles are due to inclinations of facets at scales of certain fundamental sizes. Below a certain size there might also be inclined facets, although their influence is not observable. Some surfaces might be considered smooth in a particular instance, if they have topographic irregularities only at scales below the fundamental scale of interaction of a phenomenon of interest. On surfaces with irregularities large enough to influence contact angles, local contact angles vary with local inclinations. These facets would have to be large enough to overcome surface tension's smoothing effects on droplets' surfaces. At some height above solid surface interfaces, liquid surface tension pulls droplets into smooth shapes, which agglomerates apparent contact angles at larger scales.
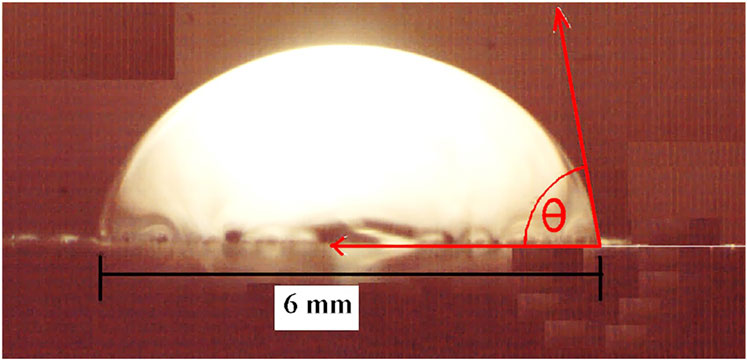
FIGURE 4. Water droplet contact angle, θ on a ground ski base. Viewed from an edge across the ski base.
Interactions considered discrete, like droplets causing capillary adhesion in snow and ice friction, can themselves be made up of agglomerations of discrete interactions.
These and other results (Brown et al., 2018) reinforce the value of discrete interaction models, and of multiscale characterizations and analyses for discovering strong functional correlations and confident discriminations. It was these works that lead to formulation of the axioms and corollaries above.
5 Experimental Research Design Using Surface Metrology
Success in finding strong functional correlations and confident discriminations depends on appropriate experimental designs. For work involving surface metrology this is facilitated by applying the axioms and corollaries.
Two kinds of experimental studies are considered here for finding the first and second kinds of functional correlations or discriminations (ASME 2019 B46.1 appendix K). The first kind relates processing and topographies, where processes and process variables are independent variables and topographies are dependent variables. Processes and process variables can relate to base preparations, like grinding, and to wear. The second kind relates topographies, independent variables now, and performance, dependent variables, like tribological behaviors. In both kinds, selection of independent variables should be varied enough to avoid potentially confusing results due to restrictions of range.
There are essentially two kinds of analyses in surface metrology experiments, one to calculate characterization parameters and another to test the strength of correlations and confidence of discriminations. Both involve statistics and scales.
Although the importance of selecting appropriate scales, measurements, characterizations, and analyses are emphasized here, it is not necessary to know these to design an experiment. Ranges of scales, many measurements, characterizations, and analyses can be tried. Discovering which of these works best for finding strong correlations and confident discriminations can help elucidate natures of topographically related interactions.
5.1 Scales, Axiom One
Scales are a largely unexplored territory for making discoveries with surface metrology (Brown et al., 2018). Scales of interaction for topographically related interactions involved in producing phenomena of interest should be included in measurements, characterizations, and analyses. Data flow and passages from measurements to characterizations, and analyses are shown in Figure 5. Approximate values for possible fundamental scales of interaction are shown in Table 1.
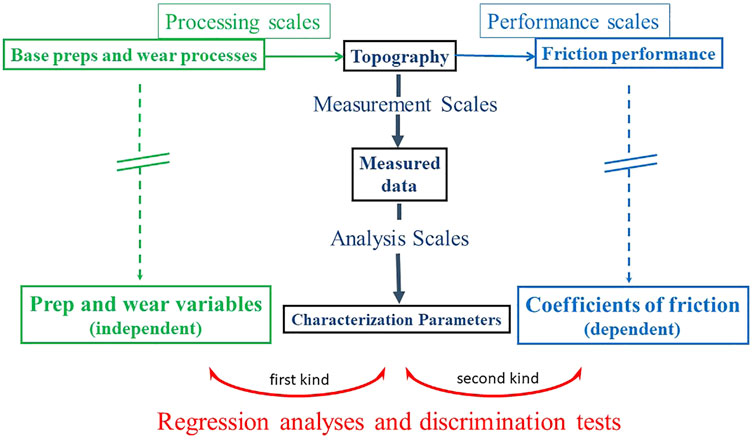
FIGURE 5. Scales and relations in surface metrology. Processing influencing topographies,are the first kind,on the left. Topographies influencing performance are the second kind, on the right.
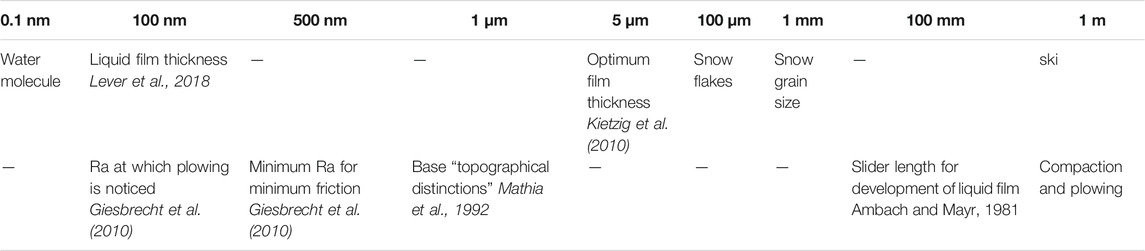
TABLE 1. Orders of magnitude of scales for topographically related phenomena for snow and ice friction. Sources are supposed general knowledge or as cited.
Scales of interaction with topographies often are not known a priori, and they do not need to be. Experimental work can be designed to find candidate scales of interaction phenomenologically using multiscale characterizations and analyses.
5.2 Measurements, Corollary One
Measurements are representations of topographies as detected by sensors. Measurements are not the surface, although they are often referred to as if they were. They are not the true topography. True topographies are a philosophical concept outside the scope of this work. Some researchers suggest that SEM (scanning electron microscope) images represent true surfaces. While SEMs have better lateral resolution than light metrology, heights are not part of SEM images. Heights can be extracted, although height resolution is poor. SEM images are of limited use in surface metrology.
There are over a million heights sampled in individual measurements made with many current optical and atomic probe instruments, e.g., confocal, interferometric, focus variation, and atomic force microscopes. Each individual measurement is inherently multiscale. Scales range from sampling intervals or sensor resolutions, which ever is larger, to sizes of measured regions. There is no need to make multiple measurements at multiple scales to support multiscale analyses and characterizations.
Optical measurements with current measuring microscopes can be the easiest way to measure many kinds of surfaces’ topographies. Fine scale resolution is limited by numerical apertures and wavelengths according to Sparrow (1916), usually to a few hundred nanometers at best. Smaller sampling intervals can be selected and recorded on some instruments, however sampling intervals below the resolution do not record additional topographic variations at these scales. Adjacent measurements can be stitched, to achieve larger measured regions at smaller sampling intervals than would be possible with one measurement, thereby addressing the measurement corollary.
The pertinent scales for a phenomenon of interest may not be known therefore, to include fundamental interaction scales, small sampling intervals should be selected. Sizes of measurement regions could be selected to scales where topographies appear homogeneous, and relative areas tend toward one, indicating little or no further topographic detail at larger scales.
Optical instruments generally rely on sophisticated, proprietary algorithms to calculate “measured” topographies from light reflected from surfaces. On some surfaces these algorithms can produce height measurements that are doubtful. Outliers were defined as doubtful observations by Peirce, 1852. Outliers can obscure or distort good results. Outliers might be present when peak to valley values appear extreme compared to average values. They can be detected as high and low spikes when observing images of measurements at grazing angles. Color maps might also seem confined to a small range of colors when outliers are present.
5.3 Characterizations, Axiom Two
Characterizations should be pertinent for supposed geometric natures of topographic interactions that influence phenomena of interest, which, like scales of interactions, are not always known prior to experimentation. Selected characterizations can be used to test hypotheses about natures and mechanics of these interactions. If the essence of these interactions is not captured by selected characterization parameters, it seems unlikely that robust correlations and discriminations, can be found.
Characterization parameters should include the usual standard parameters available in commercial software. These are important for comparisons with previous studies. Most conventional parameters are calculated over large scale ranges. Some, like power spectral density are frequency decompositions, and multiscale, although perhaps with less clear physical interpretations than area, slope, and curvatures. Developed area ratios, Sdr, are determined at sampling intervals, and slopes, Sdq, are calculated using scales near the sampling intervals, although this is rarely recognized. Sdr and Sdq correlate strongly to each other as well as to what should be the greatest relative areas, i.e., those calculated near scales of sampling intervals.
There are advantages to developing new characterization parameters. Conventional parameters have been disappointing when looking for strong correlations and confident discriminations.
Multiscale characterizations of slopes or inclinations on topographies, particularly on peaks, appear to have potential for elucidating natures and scales of topographic interactions. These could be calculated after valley suppression. Spatial derivatives, or finite differences, of heights produce slopes, and spatial derivatives of slopes are good approximations of curvatures.
Complexities are scale-based derivatives. Complexities often correlate more strongly with processing and performance variables and have maximum R2 values at different scales than the multiscale geometric characterizations on which they are based. Complexities are the slopes of plots of multiscale geometric characterizations versus scale (ISO 25178, ASME B46.1). Complexities act like bandpass filters, with band widths equal to finite differences used in their calculations.
Jansons et al. (2021) found strong functional correlations with contact areas at different depths. This suggests further work on characterizing bearing areas. Bearing area curves only give total area ratios, without regard to size, shape, or orientation of “contact” zones, or topographies within those zones.
5.4 Statistics, Corollary Two
Topographies are generally irregular over some scale ranges. Their character generally varies with scale. Topographic irregularities result from processing and influence performance. Irregular topographic data require statistical treatments.
Statistics are sometimes unrecognized in characterizations. Some researchers confuse average roughness with a measurement. All topographic characterization parameters are calculated from measurements. Mathia et al. (1992) recognized statistics inherent in height parameters, citing the first four statistical moments for arithmetic average, root mean square average, skew and kurtosis, Sa, Sq, Ssk, and Sku respectively. Relative areas are averages over measurements. Consider extreme value, average, and variance and combinations of them for kinds of statistics for particular appropriateness in analyzing topographical phenomena. Some characterizations, like curvature, vary with position on the surface as well as with scale. Curvatures require appropriate statistical treatment to be pertinent. If uncertain about which statical or combination treatment to use, try several to see which provide value, as in Vulliez et al. (2014).
6 Discussion and Conclusion
Research in surface metrology is valuable for discovering relations, functional discriminations and correlations, with ski base processing, preparation, and wear, and with other tribological phenomena. Recent advances in surface metrology can be applied to selecting topographic measurements methods, analyses, and characterizations that have good potential for producing valuable research results.
Selection of experimental methods and parameters should be made to in order facilitate development of understandings of fundamental interactions for phenomena that produce tribological behaviors. Two axioms have been proposed along with two corollaries, for selecting and preserving scales of interaction through measurement and analyses, and for characterizing geometric natures of these interactions appropriately. Measurement methods and filtering need to be adequate. Statistics in characterization and analyses need to be appropriate for the application and interactions that influence phenomena of interest. A discrete interaction model for topographically related phenomena can be helpful for interpreting and applying these principles.
Functional correlations have been found to be relatively strong at certain scales and weak at others by using multiscale characterizations and regression analyses. Regression analyses between process parameters or performance measurements, and multiscale topographic characterization parameters, are made repeatedly over a progression of different scales. Coefficients of determination (R2) determined at each scale are plotted versus scale (ASME 2019). Similarly, statistical discrimination tests, like F-tests, between different surfaces can be made over ranges of scales and illustrated by plots of mean square ratios versus scale (Jordan and Brown 2006).
Multiscale characterizations and analyses do not benefit from filtering for roughness, waviness, or form as described in standards and is done automatically in much software (ASME 2019). Multiscale analyses will show which scales are pertinent. Geometric properties, like lengths of profiles or coastlines, areas of surfaces, slopes, and curvatures, change with scales of observation or calculation on surfaces with irregular topographic components, which are practically all surfaces at sufficiently fine scales. Probable scales of relevant interactions must be in measurements, characterizations, and analyses. Of course, these experiments can only find correlations. Establishing causations is another issue.
Multiscale analyses and characterizations have found strong correlations between topographies and lubricated sheet metal on die friction coefficients, using relative areas, curvatures, and other parameters, provided they are calculated in certain narrow scale ranges using multiscale regression analyses (Bartkowiak et al., 2020, Berglund et al., 2010a, Berglund et al., 2010b). Ski base grinds have been discriminated statistically with high confidence using multiscale geometric characterizations by relative areas, also in certain scale ranges using multiscale discrimination tests (Jordan and Brown 2006).
Optimal topographies for minimizing base friction could vary with hydrophobicity and the amount of liquid water in the interface. Optimal topographies might not be independent of base composition or of wax, snow conditions, or position on a ski (Giesbrecht et al., 2010; Rohm et al., 2016; Nachbauer et al., 2016; Velkavrh et al., 2019). Topographies influence liquid lubrication’s capillary adhesion through wetting contact angles and abrasion mechanisms with asperity peak inclinations (Ducret et al., 2005; Kietzig et al., 2010).
Regions, vertical and longitudinal, on sliders could be characterized differently depending on different sorts of interactions that are expected. In contact phenomena characterizations might be more effective when applied by depth. On ski bases high regions are in contact and low regions can be reservoirs for removing small ice particles and liquid water from contact regions. Regions of high and low elevations have different interactions suggesting separate characterizations. On long sliders on snow and ice, like skis, tribological conditions change along their lengths, more dry sliding and abrasion initially and modified ice crystals, and possibly more liquid or quasi liquid layers finally.
Considering all the complexities inherent in tribological phenomena with snow and ice, it should be expected that reasonably sophisticated experiments and analyses will be required to discover functional correlations and discriminations, and the natures and scales of discrete interactions. Multiscale analyses and characterizations can be helpful, although they are only part of the solution to understanding these interesting topographically related phenomena.
Data Availability Statement
The original contributions presented in the study are included in the article/Supplementary Files, further inquiries can be directed to the corresponding author.
Author Contributions
The author confirms being the sole contributor of this work and has approved it for publication.
Conflict of Interest
Digital Surf, Besancon, France, which sells area-scale analysis software, and Sensofar, Barcelona, Spain, which sells optical measuring microscopes, support WPI’s Surface Metrology Laboratory.
Publisher’s Note
All claims expressed in this article are solely those of the authors and do not necessarily represent those of their affiliated organizations, or those of the publisher, the editors and the reviewers. Any product that may be evaluated in this article, or claim that may be made by its manufacturer, is not guaranteed or endorsed by the publisher.
Acknowledgments
The author would like to acknowledge the generosity of Digital Surf, Sensofar, and Gelsight for their support of WPI’s Surface Metrology Lab and contributions of students in his graduate courses on surface metrology and axiomatic design who have shown him so many imaginative ways to misinterpret what he has written.The author is grateful for his salary for the last 32 years from WPI and for space provided for the Surface Metrology Laboratory that have given him some space and time to think.
References
Albano, L. D., and Suh, N. P. (1994). Axiomatic Design and Concurrent Engineering. Computer-Aided Des. 26 (7), 499–504. doi:10.1016/0010-4485(94)90081-7
Ambach, W., and Mayr, B. (1981). Ski Gliding and Water Film. Cold Regions Sci. Tech. 5 (1), 59–65. doi:10.1016/0165-232x(81)90040-9
ASME (2019). Surface Texture: Surface Roughness, Waviness, and Lay: (Revision of ANSI/ASME B46.1-2009) an International Standard. New York, N.Y: American Society of Mechanical Engineers (ASME). B46.1-2019.
Bartkowiak, T., Berglund, J., Brown, C. A., Bartkowiak, T., Berglund, J., and Brown, C. A. (2020). Multiscale Characterizations of Surface Anisotropies Establishing Functional Correlations between Multiscale Areal Curvatures and Coefficients of Friction for Machined Surfaces. Materials (Basel) 13 (3), 034002. doi:10.3390/ma13133028
Berglund, J., Agunwamba, C., Powers, B., Brown, C. A., and Rosén, B.-G. (2010a). On Discovering Relevant Scales in Surface Roughness Measurement-An Evaluation of a Band-Pass Method. Scanning 32 (4), 244–249. doi:10.1002/sca.20168
Berglund, J., Brown, C. A., Rosén, B.-G., and Bay, N. (2010b). Milled die steel surface roughness correlation with steel sheet friction. CIRP Ann. 59 (1), 577–580. doi:10.1016/j.cirp.2010.03.140
Bowden, F. P., and Hughes, T. P. (1939). The Mechanism of Sliding on Ice and Snow. Proc. R. Soc. Lond. A. 172, 280–298. doi:10.1098/rspa.1939.0104
Brown, C. A., Hansen, H. N., Jiang, X. J., Blateyron, F., Berglund, J., Senin, N., et al. (2018). Multiscale Analyses and Characterizations of Surface Topographies. CIRP Ann. 67 (2), 839–862. doi:10.1016/j.cirp.2018.06.001
Brown, C. A., Johnsen, W. A., and Charles, P. D. (1994). Method of Quantifying the Topographic Structure of a Surface. US Patent 5 (307), 292.
Brown, C. A. (2001). “Machining of Metals”, in Encyclopedia of Materials: Science and Technology. Editors S. Mahajan, K. Buschow, R. Cahnet al. (Amsterdam: Permagon), 4703–4708.
Brown, C. A., and Siegmann, S. (2001). Fundamental Scales of Adhesion and Area–Scale Fractal Analysis. Int. J. Machine Tools Manufacture 41 (13-14), 1927–1933. doi:10.1016/s0890-6955(01)00057-8
Brown, C. A. (2018). Specification of Surface Roughness Using Axiomatic Design and Multiscale Surface Metrology. Proced. CIRP 70, 7–12. doi:10.1016/j.procir.2018.03.094
Colbeck, S. C. (1994). A Review of the Friction of Snow Skis. J. Sports Sci. 12 (3), 285–295. doi:10.1080/02640419408732174
Colbeck, S. C. (1993). Bibliography on Snow and Ice Friction. Cold Regions Research and Engineering Lab Hanover NH, Defense Technical Information Center, Fort Belvoir, Virginia.
Ducret, S., Zahouani, H., Midol, A., Lanteri, P., and Mathia, T. G. (2005). Friction and Abrasive Wear of UHWMPE Sliding on Ice. Wear 258 (1-4), 26–31. doi:10.1016/j.wear.2004.09.026
Giesbrecht, J. L., Smith, P., and Tervoort, T. A. (2010). Polymers on Snow: Toward Skiing Faster. J. Polym. Sci. B Polym. Phys. 48 (13), 1543–1551. doi:10.1002/polb.22033
ISO 25178-2:2012 Geometrical product specifications (GPS) (2012). — Surface Texture: Areal — Part 2: Terms, Definitions and Surface Texture Parameters.
Jansons, E., Lungevics, J., Jerane, I., and Gross, K. (2021). A Smaller Bearing Ratio, as a Surface Texture Measure, Promotes Faster Sliding on Ice. J. Tribology, 1–17. doi:10.1115/1.4049704
Jordan, S. E., and Brown, C. A. (2006). Comparing Texture Characterization Parameters on Their Ability to Differentiate Ground Polyethylene Ski Bases. Wear 261 (3-4), 398–409. doi:10.1016/j.wear.2005.12.011
Kietzig, A. M., Hatzikiriakos, S. G., and Englezos, P. (2010). Physics of Ice Friction. J. Appl. Phys. 107 (8), 4. doi:10.1063/1.3340792
Le Masson, P., Weil, B., and Hatchuel, A. (2017). Design Theory. Springer International Publishing AG.
Lever, J. H., Taylor, S., Song, A. J., Courville, Z. R., Lieblappen, R., and Weale, J. C. (2018). The Mechanics of Snow Friction as Revealed by Micro-scale Interface Observations. J. Glaciol. 64 (243), 27–36. doi:10.1017/jog.2017.76
Mathia, T. G., Zahouani, H., and Midol, A. (1992). Topography, Wear, and Sliding Functions of Skis. Int. J. Machine Tools Manufacture 32 (1-2), 263–266. doi:10.1016/0890-6955(92)90087-w
Nachbauer, W., Kaps, P., Hasler, M., Mössner, M., Braghin, F., Cheli, F., et al. (2016). “Friction between Ski and Snow,” in The Engineering Approach to winter Sports, Ch. 2. (New York: Springer-Verlag), 17–32. doi:10.1007/978-1-4939-3020-3_2
Peirce, B. (1852). Criterion for the Rejection of Doubtful Observations. Astronomical J. 2, 161–163. doi:10.1086/100259
Rohm, S., Knoflach, C., Nachbauer, W., Hasler, M., Kaserer, L., van Putten, J., et al. (2016). Effect of Different Bearing Ratios on the Friction between Ultrahigh Molecular Weight Polyethylene Ski Bases and Snow. ACS Appl. Mater. Inter. 8 (19), 12552–12557. doi:10.1021/acsami.6b02651
Scott, R. S., Ungar, P. S., Bergstrom, T. S., Brown, C. A., Grine, F. E., Teaford, M. F., et al. (2005). Dental Microwear Texture Analysis Shows Within-Species Diet Variability in Fossil Hominins. Nature 436 (7051), 693–695. doi:10.1038/nature03822
Sohlenius, G. (1992). Concurrent Engineering. CIRP Ann. 41 (2), 645–655. doi:10.1016/s0007-8506(07)63251-x
Velkavrh, I., Lungevičs, J., Jansons, E., Klien, S., Voyer, J., and Ausserer, F. (2019). The Influence of Isotropic Surface Roughness of Steel Sliders on Ice Friction under Different Testing Conditions. Lubricants 7 (12), 106. doi:10.3390/lubricants7120106
Keywords: surface metrology, axioms, topography, texture, roughness, multiscale
Citation: Brown CA (2021) Surface Metrology Principles for Snow and Ice Friction Studies. Front. Mech. Eng 7:753906. doi: 10.3389/fmech.2021.753906
Received: 05 August 2021; Accepted: 25 October 2021;
Published: 16 December 2021.
Edited by:
Werner Nachbauer, University of Innsbruck, AustriaReviewed by:
Maxence Bigerelle, Université Paris Dauphine, FranceT. V. V. L. N. Rao, Madanapalle Institute of Technology and Science (MITS), India
Copyright © 2021 Brown. This is an open-access article distributed under the terms of the Creative Commons Attribution License (CC BY). The use, distribution or reproduction in other forums is permitted, provided the original author(s) and the copyright owner(s) are credited and that the original publication in this journal is cited, in accordance with accepted academic practice. No use, distribution or reproduction is permitted which does not comply with these terms.
*Correspondence: Christopher A. Brown, YnJvd25Ad3BpLmVkdQ==