 J.L. Hall1,2
 J.L. Keddie
- 1Department of Physics, University of Surrey, Guildford, United Kingdom
- 2Syngenta Jealott’s Hill International Research Centre, Bracknell, United Kingdom
- 3School of Mechanical Engineering Sciences, University of Surrey, Guildford, United Kingdom
Waterborne coatings emit a low amount of harmful volatile organic compounds (VOCs) into the atmosphere compared to solvent-cast coatings. A typical waterborne formulation for agricultural applications consists of colloidal thermoplastic particles (latex) as the binder, a thickener to raise the viscosity, inorganic filler particles with a water-soluble dispersant, and a colloidal wax to modify surface properties. The formulations typically contain hygroscopic species that are potentially subject to softening by environmental moisture. The hardness, tack adhesion, and coefficient of friction of formulated coatings determines their suitability in applications. However, the relationship of these properties to the components in a coating formulation has not been adequately explored. Furthermore, the relationship between hygroscopic components and properties is an added complication. Here, we have characterized the hardness and tack adhesion of model formulated coatings using a single micro-indentation cycle with a conical indenter under controlled temperatures (above and below the glass transition temperature of a latex binder) and relative humidities. In parallel, we measured the coefficient of kinetic friction, μk, for the same coatings using a bespoke testing rig under controlled environmental conditions. Across a range of temperatures, RH and compositions, we find an inverse correlation between the coating hardness and μk. Any correlation of μk with the roughness of the coatings, which varies with the composition, is less clear. Formulations that contain wax additives have a higher μk at a low RH of 10%, in comparison to formulations without wax. For the wax formulations, μk decreases when the RH is raised, whereas in non-wax formulations, μk increases with increasing RH. Wax-containing coatings are hydrophilic (with a lower water contact angle), however the wax has a lower water permeability. A lubricating layer of water can explain the lower observed μk in these formulations. The addition of wax is also found to planarize the coating surface, which leads to higher tack adhesion in dry coatings in comparison to coatings without wax. Greater adhesive contact in these coatings can explain their higher friction. Our systematic research will aid the design of seed coating formulations to achieve their optimum properties under a wide range of environmental conditions.
1 Introduction
Waterborne colloidal polymers, called latex, are used as the binder material in films applied in a range of sectors: infrastructure (Jiang et al., 2017) and automotive (Nobel et al., 2007) (as protective coatings), packaging (in adhesives and binders) (Chen et al., 2015), printing (in inks) (Zhang et al., 2012), cosmetics (e.g., in nail varnish) (Peng et al., 2020), agriculture (to contain active ingredients in coatings) (Mulqueen, 2003; Pedrini et al., 2017), and pharmaceuticals (e.g., encapsulants (Lecomte et al., 2004)). Latex films have been growing in use over the past several decades because primarily water evaporates from them during their deposition and film formation, unlike coatings with an organic solvent carrier, which emit volatile organic compounds (VOCs) into the environment. Depending on the particular application, the waterborne binder is formulated with additives, such as viscosity modifiers, fillers, wetting agents, and dispersants. The particular application determines the requirements for properties and influences the selection of formulants. In applications in protective coatings, a high hardness and mar resistance are of great importance. In applications as coatings on objects, such as drug tablets (Hancock et al., 2010) or seeds (Steffen et al., 1999), friction and tack adhesion should be low to ensure ease of production and handling.
The coefficient of friction, μ, is related directly to the friction force, F, and to the normal applied load, L, via the relationship known as Amontons’ Law (Amontons, 1699):
This simple, well-known relationship is surprisingly good at describing both smooth and rough surfaces in sliding contact, in dry and lubricated conditions (Gao et al., 2004), as long as the surfaces are not in adhesive contact. For adhering surfaces, there is an additional contribution to the friction force that is proportional to the “real” contact area. For perfectly smooth surfaces the adhesive contribution to friction is very high, because the “real” contact area is the same as the “apparent” contact area. When adhesion-controlled friction exists, the friction force is proportional to the number of contacts. Roughness can thus play an important role in the coefficient of friction. Additionally, the hardness of the surfaces in contact is also very important: a hard, rough surface can have a very low “real” contact area, whereas a soft, rough surface can have a higher “real” contact area than the “apparent” contact area, leading to a very high friction force.
As formulated, waterborne coatings are invariably textured and chemically heterogeneous, the complex interplay of roughness and adhesion is necessary to consider. He et al. (2008) studied how surface texture affects the friction of polydimethylsiloxane. They found that pillar-textured surfaces resulted in a much lower coefficient of friction than smooth-surface alternatives of the same material in both macro-scale and micro-scale experiments. This reduced friction coefficient was attributed to the reduced contact areas between the sample and probe. Santner and Czichos (1989) investigated tribological behavior of several thermoplastic polymers in dry sliding conditions. They found that the friction coefficient decreased as the surface roughness of the steel counter-face increased, until a critical value was attained. At higher roughness values, the coefficient of friction began to increase. For small values of surface roughness, adhesion forces can dominate, and at higher roughness values, abrasion plays a more important role (Menezes and Kailas, 2016).
There have been numerous studies of the hardness and friction of homogeneous materials in coatings. However, in formulated coatings, the microstructure is heterogeneous because it is made from multiple components. The composition typically contains mixtures of materials with soft adhesion (such as the binder and dispersants) and hard, non-adhering components such as inorganic fillers. There have been far fewer investigations of the complex relationship between the formulation of latex films and their friction and hardness. However, Divry et al. (2017) found that water and coalescing aids softened the polymer phase, which resulted in decreased hardness coupled with higher friction coefficients. A water-soluble thickener in their formulation provided a lubricating effect that reduced the friction. However, the addition of hard inorganic pigment particles decreased the friction. Although the influence of atmospheric conditions was inferred from the polymer softening from water absorption, the effects of relative humidity (RH) and temperature were not investigated by them. In our previous research (Hall et al., 2021), we provided conclusive evidence for the effects of RH and temperature on the hardness and tack adhesion of waterborne acrylic latex films.
In the present work, we investigate the influence of several different additives on the friction and micromechanical surface properties of waterborne coatings under low and high relative humidities. Specifically, we consider the effects of a water-absorbing (hygroscopic) polymer, used as a thickener, with an expectation of softening with moisture sorption. We also consider the effects of an inorganic filler, which is expected to increase the surface roughness. We explore the effects of a waxy additive, with an expectation that it will reduce friction. Additionally, we consider more complex formulations that contain more than one additive. Our aim is to correlate systematically the components in the coatings formulations and the environmental conditions with their performance properties. This research will aid the future materials design of coatings used in challenging environmental conditions.
2 Materials and Methods
2.1 Latex Synthesis
A latex dispersion of copolymer particles in water was synthesized by emulsion polymerization of styrene (St), butyl acrylate (BA) and acrylic acid (AA) monomers at POLYMAT (University of the Basque Country, San Sebastián, Spain). Sodium dodecyl sulfate surfactant was used as the emulsifier. A detailed description of the latex synthesis is given in Hall et al. (2021). The resulting latex dispersion had a solids content of 40 wt% with a particle size of 89 nm, found using dynamic light scattering (Malvern Zetasizer Nano Series, Malvern, UK). Differential scanning calorimetry analysis, reported previously (Hall et al., 2021), found a glass transition temperature (Tg) of the material to be 23.2°C (on the second heating). The copolymer in the latex dispersion will be called P(St-BA-AA) hereafter.
2.2 Coating Formulation
The latex described in Section 2.1 was diluted to 30 wt% using de-ionized water. This blank formulation is referred to hereafter simply as Latex. This material was used as the binder in the coating formulations listed in Table 1.
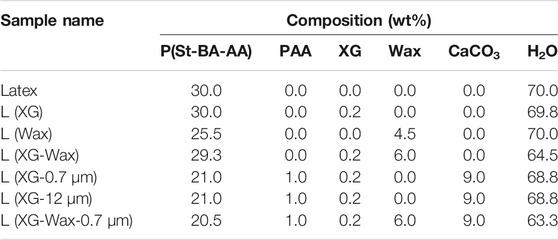
TABLE 1. Sample nomenclature and percentage weight of each component for wet formulated mixtures.
To investigate the effects of a hydrophilic component used as a thickener, xanthan gum was added to a formulation. A 2 wt% solution of xanthan gum (Rhodopol 23, Solvay) in water was prepared. This aqueous solution also contained 0.4 wt% dipropylene glycol solution of 1,2-benzisothiazolin-3-one (Proxel GXL, Lonza) as a biocide to prevent spoilage from bacteria, yeasts, and fungi. For simplicity, xanthan gum and the biocide are jointly referred to hereafter as XG. The formulation with a small amount (0.2 wt%) of XG added to the latex is called L (XG).
Another formulation contained waterborne waxy particles, added with the intention of exploring the effect on the friction. A non-ionic emulsion containing a modified high-density polyethylene (HDPE) wax (Aquacer 583, 40 wt% in H2O, supplied by BYK) in water was used as received. Differential scanning calorimetry confirmed that the HDPE was semi-crystalline at room temperature, with a melting temperature of approximately 125°C. This additive for coatings is marketed as increasing the ease of handling and flow of coated seeds in agricultural applications. It was used as an additive to the latex in the sample called L (Wax).
A more complex formulation was made with three components: latex, XG, and wax. This formulation is known as L (XG-Wax).
2.2.1 Calcium Carbonate Formulations
Two different precipitated calcium carbonate (CaCO3) powders, with mean sizes of 0.7 and 12 μm, were obtained from Minerals Technologies (New York, NY) and used as inorganic fillers in formulated coatings. The density of the particles is reported by the manufacturer to be 2.71 g cm−3.
Poly (acrylic acid, sodium salt) solution (PAA, average Mw ∼ 8, 000 g/mol, 45 wt% in H2O, Sigma Aldrich) was used as a dispersant for the filler particles. PAA was diluted with water and stirred by hand until clear before the filler particles were added. CaCO3 was added slowly to the diluted PAA solution and stirred before being placed in an ultrasound bath for 5 minutes at room temperature to ensure any initial aggregates were broken up. Note the concentration of PAA in the CaCO3 suspensions was fixed despite the particle size to enable a fair comparison of the mechanical properties. As a consequence, the density of surface area coverage is lower for the 0.7 μm particle size. XG was added after sonication to prevent sedimentation of the CaCO3 and the suspensions were placed on a roller mixer for 24 h.
The resulting suspensions contained 30 wt% CaCO3 and used either 0.7 μm or 12 μm CaCO3 exclusively. A similar suspension containing 0.7 μm CaCO3 and wax was also made using the same method. In this suspension some of the de-ionized water was replaced with Aquacer 583.
The 0.7 and 12 μm CaCO3 suspensions were mixed with L (XG) in a mass ratio of 3:7, along with XG as a thickener, making two new formulations, L (XG-0.7 μm) and L (XG-12 μm). The 0.7 μm CaCO3 suspension containing wax was mixed with L (XG-Wax) in a mass ratio of 3:7, making L (XG-Wax-0.7 μm).
Tables 1 and 2 provide a summary of the compositions of each formulation along with the names used to describe them in the wet and dry states, respectively.
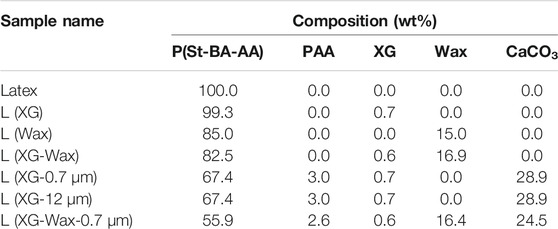
TABLE 2. Sample nomenclature and percentage weight of each component for dry coatings.
2.3 Film Formation of Samples for Micro-indentation
The formulated mixtures described in Section 2.2 and Table 1 were spread onto clean glass substrates (76 mm × 52 mm). The coatings were placed in an oven in air held at 30°C for 24 h to ensure complete film formation. The final compositions of the dry coatings are shown in Table 2. The resulting coatings had a thickness of approximately 400 μm. The thicknesses were measured using digital calipers and recorded prior to mechanical testing.
Following film formation, the coatings were placed in one of two bespoke chambers with humidity-controlled environments (relative humidity (RH) values of 10% or 90%). The two different RH environments were created using open containers of silica gel and de-ionized water, respectively. The coatings were left at room temperature in the humidity-controlled chambers to reach equilibrium, typically for 1 week.
2.4 Micro-indentation
Analysis of the hardness, viscoelasticity, and tack adhesion of the coatings was carried out using a single cycle on a micro-indenter (Texture Analyser, Stable Micro Systems, Godalming, Surrey). A conical, stainless-steel indenter with its semi-angle at the apex of α = 70.3° (as in Wang et al. (2010) and Hall et al. (2021)) was used to indent the samples using a force of 0.98 N over a period of 300 s. The indenter tip was polished to minimize its surface roughness and cleaned with acetone between measurements. The contact area of the indenter, A, is related to the depth of indentation, h, through the angle, α, as A = πh2 tan2α = 24.5h2. The hardness, H, was found by dividing the applied load (0.98 N) by A.
Under certain environmental conditions some coatings had measurable tackiness. The analysis that is used for the probe-tack tests on pressure-sensitive adhesives was applied Deplace et al. (2009), although typically probe-tack experiments use a spherical or flat-punch probe and a short contact time of a few seconds. When withdrawing the indenter from the coatings the opposing force, caused by the tack adhesion, was measured as a function of distance above the coating’s surface. The nominal stress, σ, was found from the measured load divided by A at the start of unloading. The strain, ɛ, is defined as the increase in the height of the indenter divided by its height at the end of the identation. The energy of adhesion upon the probe withdrawal (WAdh) of a coating with an initial thickness h0 was calculated as Deplace et al. (2009):
where the maximum strain, ɛmax, was found from the indenter height that corresponds to the detachment between the probe and the coating. As the thicknesses of the coatings were very similar in value, comparison of WAdh values between samples is valid.
Prior to measurements, coatings were stored in environmental chambers that were designed to enable fast and easy attachment to the micro-indenter. Thus, the samples were both stored and analysed inside the humidity chambers with minimal disruption. The chambers were also designed to allow lateral movement, so samples were probed in multiple locations along one plane without disruption to the RH and temperature inside the chamber. The environmental chambers are described in more detail in Hall et al. (2021).
Two Peltier modules (TEC1-12 706), fitted with heat sinks and 12 V fans attached to either side of the module, were used inside the chambers to control the temperature. Three temperatures (16°C, 21°C, and 30°C) were chosen to investigate how the mechanical and tack adhesion properties change when going above and below the sample Tg. The temperature and relative humidity were monitored using three Arduino-controlled sensors (Telaire T9602 IP67 Harsh Environment Humidity & Temperature Sensor, ± 2% RH, ± 0.5°C). The samples were allowed to reach the set temperature for 1 hour before micro-indentation experiments began.
2.5 Friction Experiments
A state-of-the-art, custom-built test rig was used to measure the friction characteristics of the coatings described in Table 2. The rig consists of a linear actuator that pulls the sample along a support rail at a constant, user-defined speed (see Figure 1A). 330 × 160 × 5 mm aluminium sheets, with elongated pilot holes to allow lateral movement and fixing with bolts, were used as substrates for the coatings for friction measurements (Figure 1B). The friction probe is made of a steel sphere, with an 80 mm diameter, embedded in a hardened two-part epoxy resin within an acrylic well (Figure 1C), which is attached to a 3-axis force sensor. The steel sphere of the probe is pressed into contact with the coating by a fixed normal load imposed by hanging weights. As the coating sample moves beneath the probe, the frictional, normal, and lateral forces are measured. The coefficient of friction, μ, was calculated by dividing the frictional force by the measured normal load (using Eq. 1). The entire rig is placed inside an environmental chamber (MKF240, BINDER, Tuttlingen) that controls the temperature to within 0.5°C and the relative humidity within 2.5%.
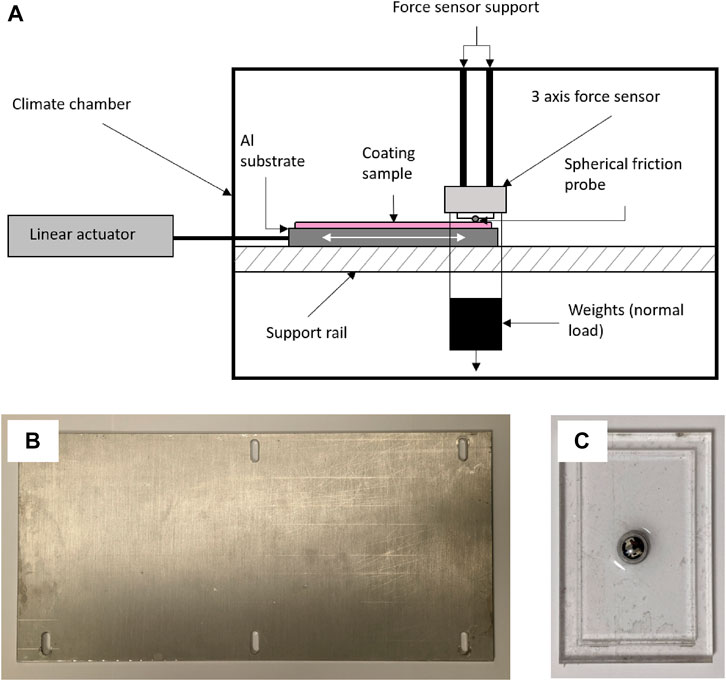
FIGURE 1. (A) Schematic drawing of the friction test rig, adapted from O’Neill et al. (2021). (B) Aluminium substrate prior to being coated. Its dimensions are 33 cm by 16 cm. (C) Steel sphere (used as the friction probe) with a diameter of 80 mm partially embedded in an acrylic well and attached with a two-part epoxy resin.
Prior to the friction measurements, the environmental chamber was set to the desired environmental condition for testing by setting the temperature (16°C, 20°C or 30°C) and the RH (10% or 90%). The coated substrates were fixed to the rig using six bolts. Each sample was allowed to equilibrate in the environmental chamber for at least 30 min before the friction testing began.
A sliding distance of 20 mm was chosen, with three repetitions, amounting to a total travel distance of 60 mm in each experiment. The travelling speed in all measurements was set to be 0.5 mm/s, and three different normal loads were used: 7 N, 15 N, and 20 N. The elongated drilled holes in the sample substrate allowed some lateral movement to shift the sample to a new testing site when changing the normal load.
2.6 Stylus Profilometry
Following friction experiments there was visible deformation in the sample surface (shallow trough-like tracks, which should increase in depth with increased normal load). The depth of the troughs was evaluated using a stylus profilometer (Dektak XT, Bruker) with a 2 μm radius stylus and a stylus force of 0.03 mN. The stylus traced a profile across the three troughs created during friction experiments roughly perpendicular to the direction of friction probe travel.
2.7 Confocal Laser Scanning Microscopy
The roughness of each of the samples characterised in the friction rig was quantitatively determined using a confocal laser scanning microscope (CLSM, LSM 700, Zeiss, Oberkochen). Areas of the coating that had not been in contact with the friction probe were selected for the analysis by confocal microscopy.
The instrument uses a 10× objective lens and a 405 nm laser to scan the sample, producing an image as the light is reflected through a pinhole into a detector. Given some start and end parameters, the height of the sample stage is incrementally adjusted automatically during the acquisition of the image. Incremental steps of the height of the sample stage make it is possible to focus on different parts of a rough sample, creating a series of ‘slices’. At the end of the scan, these slices are collated to produce a 3-D model.
Roughness values were calculated using the Confomap software, provided with the CLSM. The average roughness, Ra, was calculated via the following equation:
In this equation, yi is the amplitude of any protrusions or cavities that deviate from the mean at position i.
The average roughness, Ra, was characterised according to a standard (ISO 4287:1997, 1997). Ra is the most commonly used parameter for statistical comparisons. Ra represents the mean of the absolute values of the profile deviations from the mean line. Using the Confomap software a randomised profile, 4 mm in length, was taken from the sample surface. The cut-off was set at 0.8 mm.
2.8 Contact Angle Measurements
A drop shape analyser (DSA, DSA25B, Krüss, Hamburg) was used to study the contact angle (θ) of water on coatings created following the procedure in Section 2.2. In each experiment a drop of deionized water with a volume of 1 μL was placed onto the sample surface. A video recorded the contact angle over the first 10 s after contact, the value at 10 s is reported here. Values of the contact angle were obtained by using the ADVANCE software. The results are given as mean values of three measurements. Prior to analysis, the coatings were stored in humidity-controlled environments at either 10% RH or 90% RH before being transferred to a smaller, in-situ chamber used on the DSA, allowing RH control during the experiments. Silica gel was used to adjust the RH to 10%, and liquid water was use to create the RH of 90%.
2.9 Time of Flight Secondary Ion Mass Spectrometry (SIMS)
Three samples were prepared by casting formulations on 18 × 18 mm glass coverslips and film-forming at 30°C for 24 h. Two of the samples were pure components (latex and wax), which were used to obtain characteristic spectra or “fingerprints” from the components. The final sample was L (Wax). The surfaces of these samples were analysed with the ToF-SIMS 5 time-of-flight mass spectrometer (IONTOF GmbH, Münster). SIMS spectra were acquired using a 25 keV Bi3+ primary ion beam rastered over an area of 100 × 100 μm at a resolution of 64 × 64 pixels. Each sample was probed three times in three different areas to investigate the reproducibility. Both positive and negative SIMS spectra were acquired in the high current bunched mode over a mass range of 1–800 u. In addition to acquiring spectra, SIMS images were obtained for L (Wax) by raster scanning the Bi3+ primary ion beam over a 500 × 500 μm area at a resolution of 128 × 128 pixels. Spectral acquisition, processing, and mapping was achieved using ION-TOF GmbH SurfaceLab v6.4 software, and a principal component analysis (PCA) tool, simsMVA (Trindade et al., 2018), was used to help identify unique peaks within the spectra.
3 Results and Discussion
An example of the data from a friction measurement is shown in Figure 2A. The coefficient of friction, μ, and the normal load are both shown as a function of time. The three peaks in the measurement correspond to the static coefficient of friction. The level plateau that follows is the sliding or kinetic friction coefficient, μk, which corresponds to 20 mm of travel. The relatively low level of variability in the coefficient of friction is evident in this plot. Following the plateau is a dip; this indicates the 5-s period during which the probe is stationary before beginning a new measurement. For a data set comprising three sliding measurements, the mean and the standard deviation are taken from all μ data points within the plateau regions. This same method of analysis was used for all experiments.
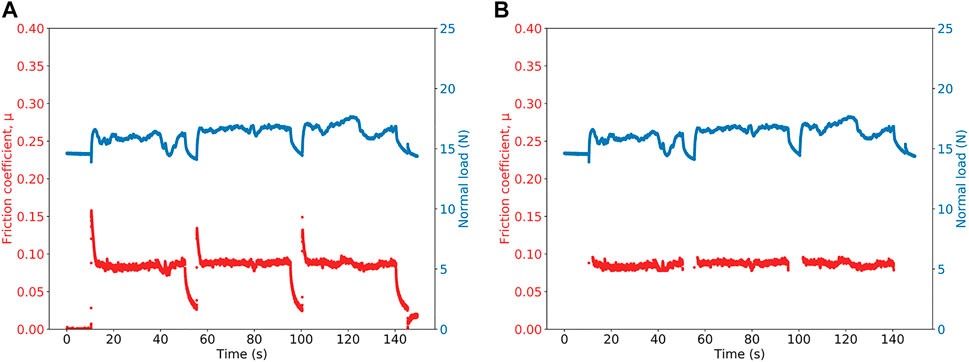
FIGURE 2. Typical raw data from a friction measurement (A) showing friction coefficient, μ, and normal load as a function of time. At the end of each of three slides when the probe is static, the values decrease. The data after processing is shown in (B). The mean coefficient of kinetic friction, μk, is found using these data. This measurement was made on a L (XG) coating at 10% RH and 20°C.
3.1 Correlations of Friction and Coating Hardness
We first investigate the influence of the temperature on the kinetic coefficient of friction, μk (Figure 3). The Tg of the L (XG) sample was measured to be 23.3°C using differential scanning calorimetry (Hall et al., 2021). Hence, the kinetic coefficient of friction was measured for L (XG) films at a temperature below Tg (16°C), above it (30°C), and near it (20°C). Measurements were made on dehydrated films (equilibrated at an RH of 10%) and in hydrated films (equilibrated at an RH of 90%). The friction coefficient was measured at three different normal loads: 7, 15 and 20 N. As μk was found to be independent of the applied normal load only results obtained with a load of 15 N are presented here for the sake of clarity and brevity. There is a clear trend showing an increase in μk with increasing temperature for both values of RH. At the temperature of 16°C, the P(St-BA-AA) copolymer binder is in a glassy state, where limited plastic deformation is expected during the sliding of the probe. However, at 30°C, the binder is in a rubbery melt state where viscous deformation will dissipate energy during the measurement. Tracks from the sliding indenter could be observed by eye on the film surfaces after the experiments, suggesting plastic deformation. An example profilometer trace on L (Wax) at 10% RH and 20°C is shown in Supplementary Figure S1. As the applied normal load increased from 7 to 20 N, the depth of plasticly deformed traces typically increased from approximately 2–6 μm.
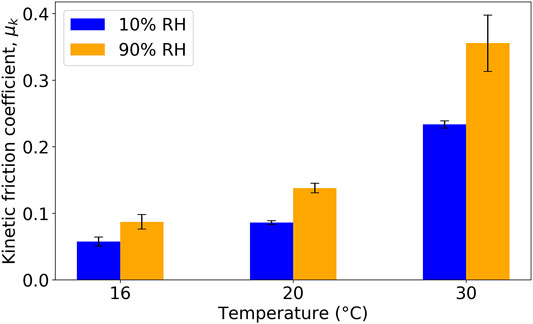
FIGURE 3. Kinetic friction coefficient for L (XG) in a range of environmental conditions. Error bars indicate the standard deviation in μk.
Interestingly, in Figure 3, there is a consistent effect of the environmental RH on the coefficient of friction. At each measured temperature, samples at an RH of 90% consistently have a greater μm value than at 10%. As the formulation contains XG, which is a hygroscopic macromolecule, there is a softening of the material because of water sorption. In our previous work (Hall et al., 2021), the Tg of this L (XG) formulation was found to be similar to the Latex, but hardness and viscosity values were lower under a high RH.
As a way to interpret the results, the inverse of the hardness of L (XG) films, which was measured in micro-indentation experiments, is plotted against μk in Figure 4. There is a clear inverse relation, wherein at both higher temperatures and higher RH, the hardness is lower, and then the μk is greater. The combined effects of temperature and RH can explain the results. With greater deformation during the sliding in the surfaces softened by heating and water sorption, the sliding friction is greater.
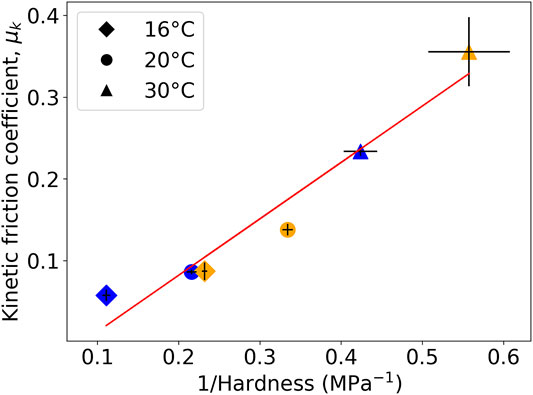
FIGURE 4. Inverse correlation between the hardness and kinetic friction coefficient for L (XG) coatings in a range of environmental conditions. Blue data points represent a storage and test RH of 10%; orange points represent an RH of 90%. Vertical error bars indicate the standard deviation in μk, horizontal error bars indicate the propagated standard error in the mean hardness.
Having established the dependence of μk on temperature, subsequent experiments were performed only at 20°C and at 10 and 90% RH.
Figure 5 shows the measured friction coefficient for the entire selection of samples at two humidities. Considering just the dry samples (10% RH, blue bars), the coefficient of friction clearly depends on sample composition. In general, the addition of wax causes the μk to increase above the value for the “blank” coating (Latex), and the addition of CaCO3 causes it to decrease. To put the results into context, we compare the μk for the samples containing wax to literature values for steel and HDPE, which is the main constituent of the wax. There is a report of the coefficients of friction ranging from 0.13 to 0.26 as the load increases from 0.5 to 20 N with a pin-on-disk geometry (Da Silva et al., 1999). Although the test geometry is different, the loads and materials are similar to the measurements reported here. For the RH of 10% (dry coatings), the values of μk for L (Wax) and L (XG-Wax) are in the range for HDPE under a high load and hence are not unreasonable. Considering that Latex has a μk value of approximately 0.2, an HDPE additive on its own will not reduce the μk greatly considering the literature value for HDPE on steel.
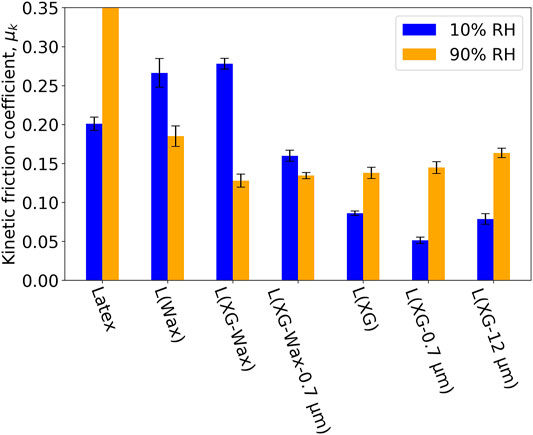
FIGURE 5. Kinetic friction coefficient for a range of samples tested at 20°C and two RH conditions. Error bars indicate the standard deviation.
We have considered how temperature can affect hardness above and below the Tg of the polymer, but we have not yet considered the effect of sample composition on hardness. Supplementary Figure S2 shows the hardness of all samples at 20°C and two humidities. Here we can see that at 10% RH, the additives have an inverse effect on hardness. That is, the addition of CaCO3 increases hardness, and the addition of wax lowers hardness. This influence helps to explain the change of μk with sample composition.
In Figure 6, the coefficient of friction at 10% RH is plotted against the inverse of hardness. There is a general trend in which the coefficient of friction increases as the hardness decreases, which is as expected. In coatings with a lower hardness, there is greater plastic indentation. There is a clear outlier in the trend shown in Figure 6. That is, the kinetic friction coefficient for the Latex (XG) sample is less than 0.1 despite its lower value of hardness, which suggests that other factors (such as the roughness or lack of adhesive contacts) are having an influence.
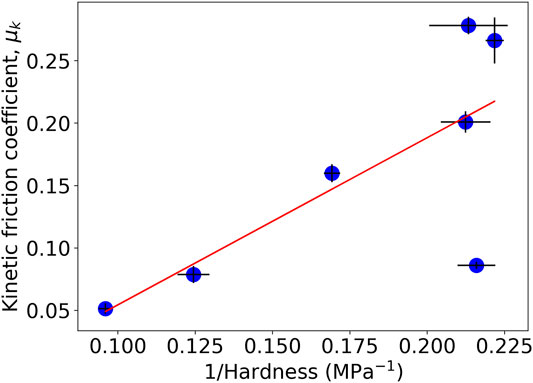
FIGURE 6. Inverse correlation between the hardness and kinetic friction coefficient for a range of coatings at 10% RH and 20°C. Vertical error bars indicate the standard deviation in μk, horizontal error bars indicate the propagated standard error in the mean hardness. The line is a guide to the eye. The outlier point in the lower right is data from the Latex (XG) sample.
Next we consider the effect of RH. As can be seen in Figure 5, the effect of RH - whether increasing or decreasing μk - depends on the specific formulation. As a general trend, the three formulations that contain the wax additive and the formulations without wax show an opposite friction behaviour at high RH. Specifically, when the wax is present in the formulation, μk is lower at the high RH (90%). One explanation is that at the RH of 90%, a thin layer of water acts as a lubricating film. In contrast, when the wax is not present, the μk is higher at the high RH, perhaps as a result of a softening of the composite material because of water sorption. Supplementary Figure S2 shows the hardness of all samples at 20°C and two humidities. It reveals that samples containing wax are less likely to soften in the presence of high RH compared to their wax-free counterparts, which could be another factor causing a relatively low coefficient of friction at high RH. Note that although the wax was added as particles suspended in water, the particle cores are not hygroscopic and is not plasticised by the presence of water (liquid or vapour).
3.2 Characterisation of Surface Roughness
Although according to the simple theory, the roughness should not influence the friction of hard surfaces, the situation can be different on heterogeneous and partially adhesive surfaces, such as are studied here. The surface roughnesses were measured to help to explain the differences in the trends under changing RH storage and experimental conditions. Figure 7 shows topographic images and the corresponding roughness values for each of the formulations. The three formulations that contain the wax additive (B, C and D in the figure) have a lower roughness in comparison to the corresponding formulations without wax. It is apparent from these results that the addition of wax to the formulation has the effect of planarizing the surfaces. In contrast, the addition of the non-deformable calcium carbonate filler particles increases the roughness above the values without the filler.
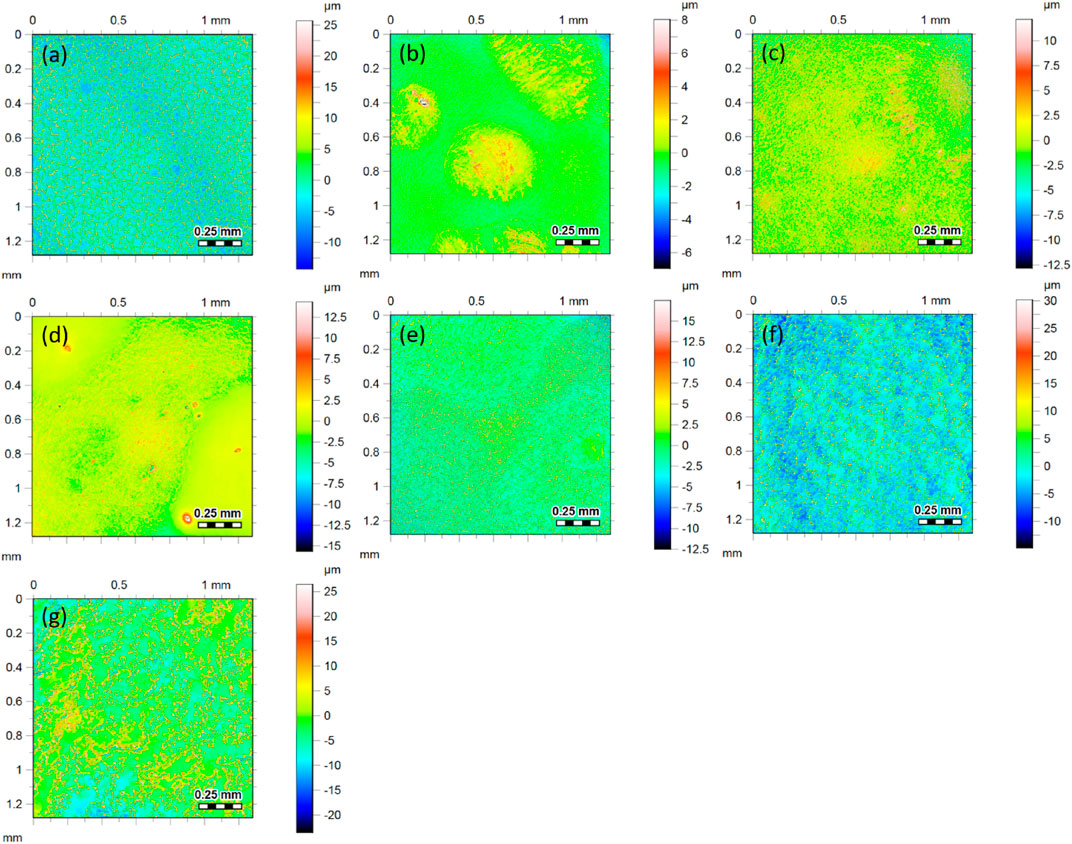
FIGURE 7. Topographic surface images (and corresponding roughness values) obtained using CLSM surface from each of the coatings: (A) Latex (Ra = 4.4 μm), (B) L (Wax) (Ra = 0.5 μm), (C) L (XG-Wax) (Ra = 1.2 μm), (D) L (XG-Wax-0.7 μm) (Ra = 0.7 μm), (E) L (XG) (Ra = 2.0 μm), (F) L (XG-0.7 μm) (Ra = 3.3 μm), (G) L (XG-12 μm) (Ra = 3.8 μm). The images show the same area (1.2 mm by 1.2 mm), but the scale bars for the z-direction are different for each image. The areas analysed here are not the same regions studied by the friction analysis.
In this sample series, the compositions of the coatings (and hence their potential to form adhesive contacts) are varied, and hence any effect of the roughness cannot be de-coupled from other factors. Consequently, there is indeed no correlation between the kinetic friction coefficients and the corresponding roughness values, as is shown for completeness in Supplementary Figure S3. These data are presented for completeness. We note, however, that the Latex sample has a relatively high friction considering its high roughness, which could be explained by the predominance of adhesive contacts, which are lacking in the other formulations with the calcium carbonate fillers.
This roughness analysis led us to speculate that the smoother surfaces achieved with the wax addition will work in combination with a condensed water layer present at 90% RH to contribute to the lubrication, thus explaining the effectiveness of the wax in reducing μk at high humidity. To investigate the effect of roughness on this lubricating water layer the water contact angle for a range of samples at two RH was measured. The effects of wetting and surface lubrication are considered in the next section.
3.3 Effects on Wetting and the Water Contact Angle
The water contact angle measurements are shown in Figure 8. The contact angle varies greatly with sample composition. In all cases, the contact angle is less than 90°, meaning that all sample surfaces are classified as hydrophilic. The samples that contain wax in combination with XG have a very low contact angle compared to the other samples, including L (Wax) and L (XG). This is a surprising result, as the general consensus is that wax (and any nonpolar hydrocarbons) makes surfaces more hydrophobic compared to polar polyacrylates. However, the wax is described as “modified HDPE,” which could indicate that it has been oxidised. The combination of wax plus XG could have a synergistic effect whereby both co-formulants together increase hydrophilicity. To help to explain the contact angle results, ToF-SIMS was used to investigate the surface of Latex, wax, and one wax-containing sample, L (Wax).
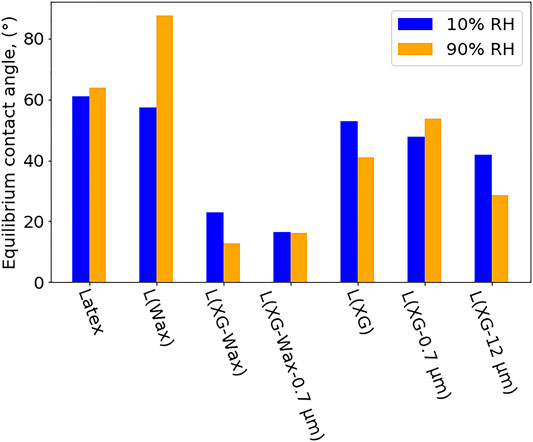
FIGURE 8. Measured contact angle for a range of samples at 20°C and two RH conditions. These values were obtained after 10 s of wetting.
3.4 Chemical Composition of Coating Surfaces via SIMS Analysis
Our strategy in this analysis is to identify characteristic SIMS peaks for the Latex and wax and then compare them to L (Wax), as a means to identify surface composition in the mixture.
Figure 9 shows the positive ion mass spectra of Latex, wax, and L (Wax). The Latex has characteristic peaks at 23 u (Na+), 63 u (
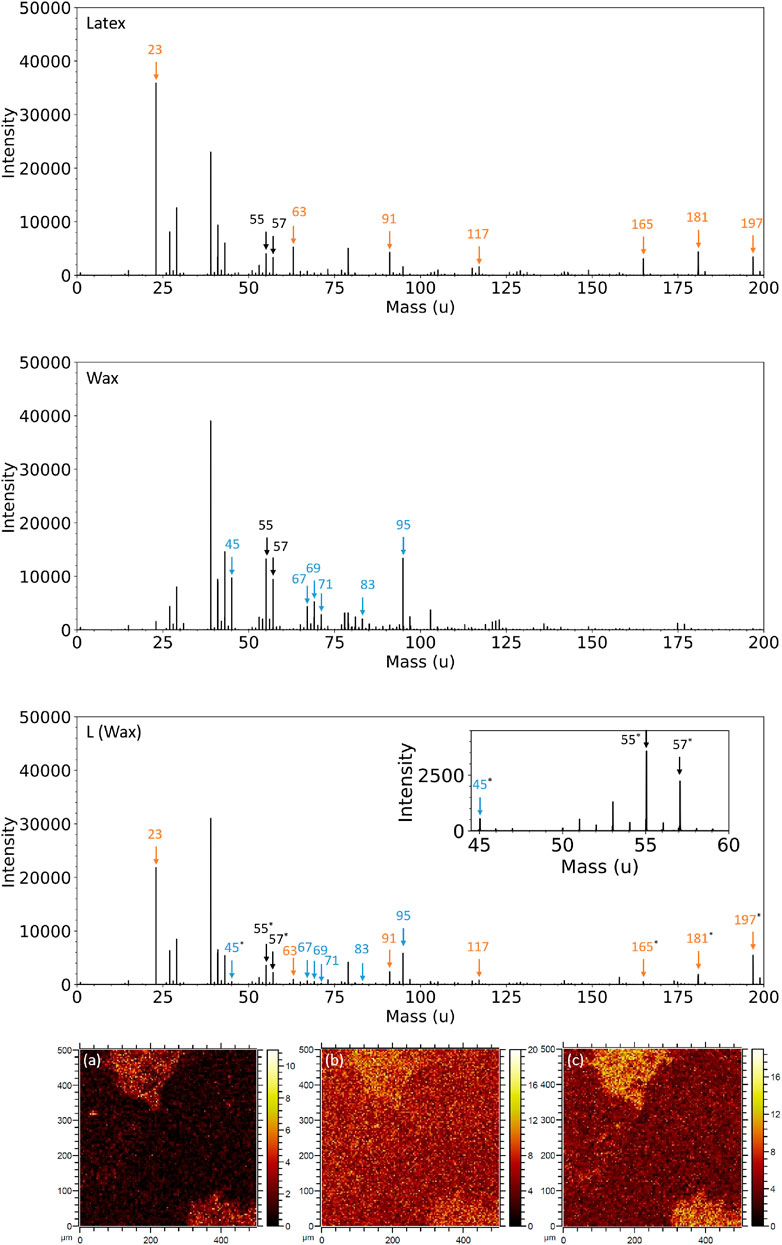
FIGURE 9. Positive ion mass spectra in the range 0–200 u for Latex (top row), as-received wax (second row), and L (Wax) (third row). Black arrows indicate peaks clearly present in both Latex and wax fingerprints, orange arrows represent peaks present in the latex fingerprint, blue arrows represent peaks specific to the wax and * represents peaks from which SIMS images have been created. Positive ToF-SIMS images of L (Wax) are shown at (A) 45 u (C2H5O+), (B) 55 u (
The as-received wax sample has characteristic positive ion peaks at 45 u (C2H5O+), 67 u (
TABLE 3. Summary of the polarity, mass, assignment, identity and association of ToF-SIMS peaks of interest in the L (Wax) sample.
A selection of these peaks were chosen to create SIMS images to understand the homogeneity (or lack thereof) of wax at the surface of the L (Wax) composite (Figure 9A–C). The images show that the surface of the L (Wax) sample is heterogeneous in this scan region, with greater intensity in the two regions in the top left and bottom right of each map. Even so, there are still counts visible in the darker region that makes up most of the map. This is evidence to suggest that the mapped fragments in Figure 9A–C are ubiquitous, but in the darker regions the intensity is lower due to coverage of sodium dodecyl sulfate (SDS) surfactant and/or potassium persulfate (KPS) initiator. In the two other scanned regions (Supplementary Figure S4), there is more homogeneity, which is increasing evidence of the uniform distribution of wax within the latex.
Supplementary Figure S5 shows maps obtained via SIMS for L (Wax) for peaks at 23 u (Na+, counterion in surfactant headgroup), 165 u (
The HDPE wax emulsion is made using a non-ionic surfactant, the details of which are withheld by the manufacturer. There is evidence of surfactant coverage in the positive ion spectrum of wax above 400 u, as there is a repeating loss of 44 u (Supplementary Figure S7). This repeating unit is attributed to an alcohol ethoxylate, a typical non-ionic surfactant used in emulsions (Huang and Rood, 1999), with general formula R(OCH2CH2)nOH). The HDPE wax has likely been oxidized, and some positive peaks, such as 45 u (C2H5O+), show evidence of oxidized polyethylene (Briggs et al., 2003). Both the non-ionic surfactant and the oxidation process can improve wettability, which helps to explain why the contact angle is so low for XG and wax-containing formulations.
3.5 Possible Water Interactions With Coatings
To explain the observed effects of RH on the friction of wax-containing coatings, we consider how water can interact with the materials. There are at least three distinct possibilities.
1. Water vapour can be sorbed into hygroscopic components of a coating.
2. An equilibrium water film will develop on the coating surface because of the disjoining pressure.
3. Water can condense onto the surface.
We briefly consider each possibility hereafter.
1. Water sorption. At higher RH, more water is sorbed into the hydrophilic components, as is expected from a sorption isotherm. There will be a softening of the phases because of hydroplasticization when the Tg is reduced below the ambient temperature. Greater deformation of the plasticised polymer under the friction probe will lead to a higher coefficient of friction, just as a higher coefficient was found at temperatures above the Tg. Higher μk is seen at higher RH at each temperature for L (XG) in Figure 3, owing to the hygroscopic, hydrophilic XG component. The wax is composed of non-polar molecules, and the amount of water sorption in it is expected to be very low. It is not expected to be plasticized. The SIMS shows the presence of the wax phase at the coating surface. If the wax formed a non-permeable barrier on the surface of the coating, then the effects of hydroplasticization could be diminished. Water should have a low permeability in the non-polar HDPE wax, despite the hydrophilic surface of the oxidised wax. This is one reason why the wax-containing coatings do not have a higher friction coefficient at the higher RH.
2. Equilibrium water film. The refractive index of water is intermediate to that of air and the wax (and polymeric components in the coatings). Consequently, it is expected that water/air/wax will have a negative Hamaker constant (Israelachvili, 2011). With this condition, an equilibrium water film is stable at the interface between air and wax. According to theory, the thickness of an adsorbed water film will be thicker at a higher RH. The thickness will vary as (ln (RH))−1/3. At an RH of 10%, the thickness of the adsorbed water later will be negligible. However, at an RH of 90%, the thickness will be greater. However, without a reliable value of the Hamaker constant, we cannot calculate the value of the thickness. The Hamaker constant for the water/air/wax system will differ slightly from the water/air/P(St-BA-AA) system, however the effect on the equilibrium water layer thickness will be small.
3. Condensed water layer. At the measured RH of 90% at a temperature of 20°C, the dewpoint is at a temperature only 2°C lower (that is, 18°C) (Lawrence, 2005). Any small fluctuations in temperature of the coating within the environmental chamber will drive water condensation. Additionally, on surfaces that are hydrophilic, such as the wax coating, there will be capillary condensation into nanoscale crevices or pores (Israelachvili, 2015). The contact angle of water is lower on the wax coatings in comparison to the non-wax coatings. Therefore, when water droplets condense onto the wax coating, they will spread to form a lubricating layer. The SIMS analysis showed the presence of SDS surfactants on the L (Wax) coating surface. Condensed water could dissolve the surfactant to create a soapy layer to reduce the friction.
In conclusion, the addition of wax to the coatings has two important effects. One, it reduces the amount of hydroplasticization by reducing the volume fraction of hygroscopic material and creating a hydrophobic surface barrier. Two, its hydrophilic surface allows condensed water to spread, dissolve surfactant, and then act as a lubricating layer.
3.6 Relative Humidity and Roughness Effects on Tack Adhesion
Having explored how roughness affects friction, we will now consider the possible link between roughness and the tack adhesion.
WAdh was calculated following the micro-indentation experiments. Figure 10 shows the WAdh for three samples: Latex, L (Wax) and L (XG-Wax). The micro-indentation experiments were performed at 20°C and at two RH, 10 and 90%. At higher RH the tack adhesion increases for Latex, but the opposite trend is seen for the two samples containing wax. The increase in tack adhesion for Latex at high RH is attributed to slight hydroplasticization of the copolymer. The wax-containing samples should largely prevent this phenomenon both by acting as a barrier to water sorption and by replacing some of the hydrophilic components with non-polar wax molecules. The adhesion is also expected to be reduced for these samples at high RH because of the lubricating water layer described in Section 3.5. The loss of tack adhesion for the wax-containing samples at the high RH can also explain the low values of friction for these same samples. Likewise, the higher tack adhesion at higher RH for the Latex sample can explain the higher friction that was also observed.
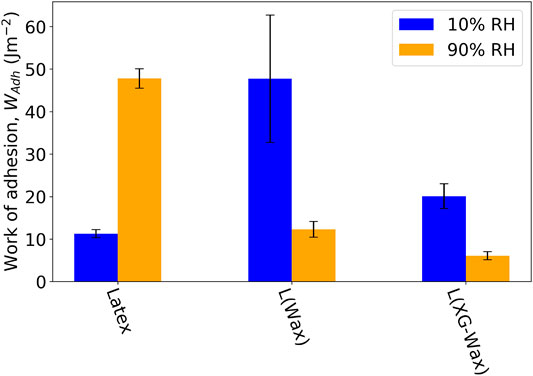
FIGURE 10. Average WAdh for Latex, L (Wax), and L (XG-Wax) at 20°C at a relative humidity of 10 and 90%. The error bars indicate the standard error in the mean WAdh value.
Figure 11A shows tack adhesion curves for three CaCO3-containing samples at 90% RH. The peak tack adhesion and WAdh is much higher for L (XG-Wax-0.7 μm) compared to both L (XG-0.7 μm) and L (XG-12 μm). We have established that with the addition of wax the surface is planarized. This smoothing of the surface appears to be increasing the measured tack adhesion of these samples. Conversely, the larger CaCO3 particles increase the roughness and decrease the tack adhesion, as is shown in Figure 11B. Tack adhesion requires close contact between the probe and the adhering surface. With a lower roughness this contact is achievable. These results are consistent with the findings of Chiche et al. (2000) on a pressure-sensitive adhesive in contact with stainless steel surfaces of varying roughness, where an inverse correlation between tack and roughness.
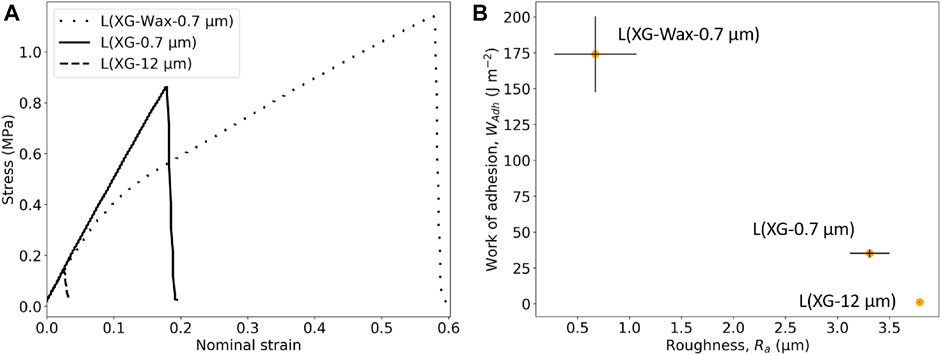
FIGURE 11. (A) Probe-tack curves of CaCO3-containing samples at 90% RH, (B) correlation between the WAdh at 90% RH and Ra for CaCO3-containing samples. Vertical error bars indicate the standard error in the mean WAdh value, horizontal error bars indicate maximum and minimum Ra values.
4 Conclusion
We have investigated the complex relationships between coating formulations, environmental conditions, and the properties of friction and tack adhesion.
For the L (XG) formulation, there is a strong increase in μk as temperature is increased, which can be explained by the softening of the binder above its Tg, allowing viscous deformation and energy dissipation during the measurement in which there is plastic deformation. The hardness, in turn, is affected by the composition, and, depending on the hydrophilicity of the co-formulants in any given sample, the storage and test RH. After storage at higher RH, the samples containing hydrophilic and/or hygroscopic components are softened because of hydroplasticization. However, adding wax appears to largely prevent the softening of these samples by both acting as a barrier to preventing water sorption and reducing the amount of hydrophilic, polar molecules.
There is a clear and obvious trend that as the hardness increases, the coefficient of friction decreases under dry (low RH) conditions. The surface roughness, which is governed by the sample composition, adds another level of complexity. The addition of CaCO3 increases the roughness, whereas the addition of wax reduces roughness by comparison. There appears to be a weak inverse relationship between roughness and friction. However, as hardness, roughness, and adhesive contacts are all varied, it is impossible to distinguish the impact that each factor alone has in affecting μk.
At a low value of RH (10%), when the film is dehydrated, the addition of wax does not reduce the friction coefficient, despite initial expectations. The roughness, however, is reduced because the wax has a planarizing effect on the sample surface. A greater contact area between the friction probe and the sample surface—on its own—should not affect the friction according to Amontons’ Law. However, under the high RH storage, the wax does indeed reduce the friction coefficient, possibly by preventing plasticization and through the creation of a lubricating film. There is SDS surfactant at the sample surface, as found in ToF-SIMS analysis of L (Wax) samples, which may dissolve in the water layer on the sample surface, thus creating a soapy, lubricating film. At the low RH, without the effects of this surface layer, the friction on the same samples is higher, and the effect of wax is lost.
The study of tack adhesion offers additional insights. The addition of wax to the formulation results in a lower adhesion at the high RH, probably because of a water layer, whereas the Latex formulation has a higher adhesion, possibly because of the softening of the polymer by hydroplasticization. In turn, there is a correlation between the tack adhesion and friction for the same samples, which suggests that adhesive contacts are having an influence on the latter.
Our results show the importance of a number of major components used in formulated waterborne coatings, and the role of these additives under challenging environmental conditions. These results can be used by formulators in the future to develop coatings for targeted applications.
Data Availability Statement
The raw data supporting the conclusions of this article will be made available by the authors, without undue reservation.
Author Contributions
JH: Conceptualization, formal analysis, investigation, methodology, visualization, writing original draft. CB: formal analysis. EK: Resources, supervision. CL: Conceptualization, resources, supervision. SH: Methodology, writing—reviewing and editing. PG: Methodology, writing—reviewing and editing. JK: Conceptualization, methodology, supervision, writing—reviewing and editing.
Funding
This work was funded by the EPSRC (Grant EP/L016788/1) through the Doctoral Training Centre in Micro- and NanoMaterials and Technology (MiNMAT). The EngD studentship of JH was partially funded by Syngenta.
Conflict of Interest
The authors declare that the research was conducted in the absence of any commercial or financial relationships that could be construed as a potential conflict of interest.
Publisher’s Note
All claims expressed in this article are solely those of the authors and do not necessarily represent those of their affiliated organizations, or those of the publisher, the editors and the reviewers. Any product that may be evaluated in this article, or claim that may be made by its manufacturer, is not guaranteed or endorsed by the publisher.
Acknowledgments
We thank Violeta Doukova and Dave Jones (University of Surrey) for laboratory assistance, Dr. Agata Gajewicz-Jaromin (University of Surrey) for performing DSC analysis, and Dr. Marco Ramaioli (INRAE) for useful discussions.
Supplementary Material
The Supplementary Material for this article can be found online at: https://www.frontiersin.org/articles/10.3389/fmech.2021.796853/full#supplementary-material.
References
Amontons, G. (1699). De la résistance causée dans les machines. Mémoires de l’Académie Royale A, 257–282.
Briggs, D., Brewis, D. M., Dahm, R. H., and Fletcher, I. W. (2003). Analysis of the Surface Chemistry of Oxidized Polyethylene: Comparison of Xps and Tof-Sims. Surf. Interf. Anal. 35, 156–167. doi:10.1002/sia.1515
Chen, H., Jiang, B., and Cai, Z.-Q. (2015). Preparation and Properties of Paper-Plastic Laminating Adhesive Used for Medical Packaging Materials. Polym. Adv. Technol. 26, 1065–1069. doi:10.1002/pat.3533
Chiche, A., Pareige, P., and Creton, C. (2000). Role of Surface Roughness in Controlling the Adhesion of a Soft Adhesive on a Hard Surface. Comptes Rendus de l'Académie des Sci. - Ser. IV - Phys. 1, 1197–1204. doi:10.1016/s1296-2147(00)01133-1
Da Silva, C. H., Tanaka, D. K., and Sinatora, A. (1999). The Effect of Load and Relative Humidity on Friction Coefficient between High Density Polyethylene on Galvanized Steel-Preliminary Results. Wear 225-229, 339–342. doi:10.1016/s0043-1648(98)00365-2
Deplace, F., Carelli, C., Mariot, S., Retsos, H., Chateauminois, A., Ouzineb, K., et al. (2009). Fine Tuning the Adhesive Properties of a Soft Nanostructured Adhesive with Rheological Measurements. J. Adhes. 85, 18–54. doi:10.1080/00218460902727381
Divry, V., Jacomine, L., Le Houérou, V., Collin, D., Gauthier, C., and Holl, Y. (2017). Influence of Formulation on Friction Properties of Latex Films. Prog. Org. Coat. 113, 189–199. doi:10.1016/j.porgcoat.2017.09.012
El-Khouri, R. J., and Johal, M. S. (2003). Fine-tuning the Wetting Behavior of Polyelectrolyte Films with Sodium Dodecyl Sulfate. Langmuir 19, 4880–4883. doi:10.1021/la034174g
Gao, J., Luedtke, W., Gourdon, D., Ruths, M., Israelachvili, J., and Landman, U. (2004). Frictional Forces and Amontons’ Law: from the Molecular to the Macroscopic Scale. J. Phys. Chem. B 108 (11), 3410–3425. doi:10.1021/jp036362l
Hall, J. L., Pérez, A., Kynaston, E. L., Lindsay, C. I., and Keddie, J. L. (2022). Effects of Environmental Conditions on the Micro-mechanical Properties of Formulated Waterborne Coatings, Accepted in Prog. Organ. Coat. 163, 11. doi:10.1016/j.porgcoat.2021.106657
Hancock, B. C., Mojica, N., St.John-Green, K., Elliott, J. A., and Bharadwaj, R. (2010). An Investigation into the Kinetic (Sliding) Friction of Some Tablets and Capsules. Int. J. pharmaceutics 384, 39–45. doi:10.1016/j.ijpharm.2009.09.038
He, B., Chen, W., and Jane Wang, Q. (2008). Surface Texture Effect on Friction of a Microtextured Poly(dimethylsiloxane) (PDMS). Tribol Lett. 31, 187–197. doi:10.1007/s11249-008-9351-0
Huang, S. K., and Rood, M. H. (1999). The Analysis of Alkyl-Capped Alcohol Ethoxylates and Alcohol Ethoxycarboxylates from Alcohol Ethoxylates by Atmospheric Pressure Chemical Ionization Mass Spectrometry. Rapid Commun. Mass. Spectrom. 13, 1152–1158. doi:10.1002/(sici)1097-0231(19990630)13:12<1152:aid-rcm631>3.0.co;2-z
ISO 4287:1997 (1997). Geometrical Product Specifications (GPS) — Surface Texture: Profile Method — Terms, Definitions and Surface Texture Parameters. Geneva, CH: Standard, International Organization for Standardization.
Israelachvili, J. N. (2011). Intermolecular and Surface Forces. London, United Kingdom: Academic Press.
Jiang, S., Van Dyk, A., Maurice, A., Bohling, J., Fasano, D., and Brownell, S. (2017). Design Colloidal Particle Morphology and Self-Assembly for Coating Applications. Chem. Soc. Rev. 46, 3792–3807. doi:10.1039/c6cs00807k
Lawrence, M. G. (2005). The Relationship between Relative Humidity and the Dewpoint Temperature in Moist Air: A Simple Conversion and Applications. Bull. Amer. Meteorol. Soc. 86, 225–234. doi:10.1175/bams-86-2-225
Lecomte, F., Siepmann, J., Walther, M., MacRae, R. J., and Bodmeier, R. (2004). Polymer Blends Used for the Coating of Multiparticulates: Comparison of Aqueous and Organic Coating Techniques. Pharm. Res. 21, 882–890. doi:10.1023/b:pham.0000026443.71935.cb
Menezes, P. L., and Kailas, S. V. (2016). Role of Surface Texture and Roughness Parameters on Friction and Transfer Film Formation when Uhmwpe Sliding against Steel. Biosurface and Biotribology 2, 1–10. doi:10.1016/j.bsbt.2016.02.001
Mulqueen, P. (2003). Recent Advances in Agrochemical Formulation. Adv. Colloid Interf. Sci. 106, 83–107. doi:10.1016/s0001-8686(03)00106-4
Nobel, M. L., Picken, S. J., and Mendes, E. (2007). Waterborne Nanocomposite Resins for Automotive Coating Applications. Prog. Org. Coat. 58, 96–104. doi:10.1016/j.porgcoat.2006.08.017
O’Neill, A., Prins, J., Watts, J. F., and Gruber, P. (Forthcoming 2021). Enhancing brush Tyre Model Accuracy through Friction Measurements. Vehicle Syst. Dyn., 1–23. doi:10.1080/00423114.2021.1893766
Pedrini, S., Merritt, D. J., Stevens, J., and Dixon, K. (2017). Seed Coating: Science or Marketing Spin? Trends Plant Science 22, 106–116. doi:10.1016/j.tplants.2016.11.002
Peng, X., Liu, Y., Xin, B., Guo, H., and Yu, Y. (2020). Preparation and Characterization of Waterborne Polyurethane Nail Enamel Modified by Silane Coupling Agent. J. Coat. Technol. Res. 17, 1377–1387. doi:10.1007/s11998-020-00358-9
R. Steffen, R., R. Wolff, R., R. Iltis, R., M. Albers, M., and D. S. Becker, D. (1999). Effect of Two Seed Treatment Coatings on Corn Planter Seeding Rate and Monitor Accuracy. Appl. Eng. Agric. 15, 605–608. doi:10.13031/2013.5824
Santner, E., and Czichos, H. (1989). Tribology of Polymers. Tribology Int. 22, 103–109. doi:10.1016/0301-679x(89)90170-9
Trindade, G. F., Abel, M.-L., and Watts, J. F. (2018). Simsmva: A Tool for Multivariate Analysis of Tof-Sims Datasets. Chemometrics Intell. Lab. Syst. 182, 180–187. doi:10.1016/j.chemolab.2018.10.001
Wang, T., de las Heras Alarcón, C., Goikoetxea, M., Beristain, I., Paulis, M., Barandiaran, M. J., et al. (2010). Cross-linked Network Development in Compatibilized Alkyd/acrylic Hybrid Latex Films for the Creation of Hard Coatings. Langmuir 26, 14323–14333. doi:10.1021/la102392x
White, L. J., Taylor, A. J., Faulk, D. M., Keane, T. J., Saldin, L. T., Reing, J. E., et al. (2017). The Impact of Detergents on the Tissue Decellularization Process: a Tof-Sims Study. Acta Biomater. 50, 207–219. doi:10.1016/j.actbio.2016.12.033
Zafar, A., Schjødt-Thomsen, J., Sodhi, R., Goacher, R., and de Kubber, D. (2013). Investigation of the Ageing Effects on Phenol-Urea-Formaldehyde Binder and Alkanol Amine-Acid Anhydride Binder Coated mineral Fibres. Polym. Degrad. Stab. 98, 339–347. doi:10.1016/j.polymdegradstab.2012.09.007
Keywords: friction coeffcient, coatings, tack adhesion, hardness, latex, roughness, relative humidity
Citation: Hall J, Bevas C, Hinder S, Kynaston E, Lindsay C, Gruber P and Keddie J (2022) Environmental Effects on the Coefficient of Friction and Tack Adhesion of Formulated Waterborne Coatings. Front. Mech. Eng 7:796853. doi: 10.3389/fmech.2021.796853
Received: 17 October 2021; Accepted: 17 December 2021;
Published: 18 January 2022.
Edited by:
Daniele Dini, Imperial College London, United KingdomReviewed by:
Yijie Jiang, University of North Texas, United StatesShanhua Qian, Jiangnan University, China
Copyright © 2022 Hall, Bevas, Hinder, Kynaston, Lindsay, Gruber and Keddie. This is an open-access article distributed under the terms of the Creative Commons Attribution License (CC BY). The use, distribution or reproduction in other forums is permitted, provided the original author(s) and the copyright owner(s) are credited and that the original publication in this journal is cited, in accordance with accepted academic practice. No use, distribution or reproduction is permitted which does not comply with these terms.
*Correspondence: J.L. Keddie, ai5rZWRkaWVAc3VycmV5LmFjLnVr