 Bryan Abel Zavala
 James E. McCarthy
  Thomas Harris3
- 1Southwest Research Institute, San Antonio, TX, United States
- 2Eaton, Southfield, MI, United States
- 3Tenneco, Grass Lake, MI, United States
Commercial vehicles require fast aftertreatment heat-up to move the SCR catalyst into the most efficient temperature range to meet upcoming NOX regulations while minimizing CO2. One solution to this challenge is to add a fuel burner upstream of the con`ventional heavy-duty diesel aftertreatment system. The focus of this paper is to optimize a burner based thermal management approach. The objective included complying with CARB’s 2027 low NOX emissions standards for on-road heavy duty diesel engines. This was accomplished by pairing the burner system with cylinder de-activation on the engine and/or a light-off SCR sub-system. A system solution is demonstrated using a heavy-duty diesel engine with an aged aftertreatment system targeted for 2027 emission levels using various levels of controls. The baseline layer of controls includes cylinder deactivation to raise the exhaust temperature more than 100°C in combination with elevated idle speed to increase the mass flowrate through the aftertreatment system. The combination of operating the fuel burner, cylinder deactivation and elevated idle speed (during cold start) allows the aftertreatment system to heat up in a small fraction of the time demonstrated by today’s systems. Performance was quantified over the cold FTP, hot FTP, low load cycle (LLC) and the U.S. beverage cycle. The improvement in NOX reduction and the CO2 savings over these cycles are highlighted.
1 Introduction
Updated low NOX (oxides of nitrogen) emission regulations for commercial vehicles have been adopted by the California Air Resources Board (CARB) (California Air Resources Board, 2020; California Air Resources Board, 2019a), and will be adopted soon by US, Europe, and China government agencies. The regulations consider updates to reduce tailpipe NOX, but also to ensure that the system maintains high NOX conversion performance for the application life. CARB has also introduced extended durability, which further poses challenges for manufacturers as catalyst deterioration must be maintained to a minimum. For the 435,000-mile regulation, CARB adopted the FTP/RMCSET NOX limit of 0.02 g/hp-hr. The LLC, which is a new cycle introduced for certification, has a NOX limit of 0.05 g/hp-hr. Beyond the laboratory certification process, there are additional requirements that the engine and aftertreatment system needs to meet. For example, in-use testing will now undergo a 3-bin MAW analysis that broadens the amount of data considered for in-use emissions. This means that emissions control devices will now have to extend the performance range to low temperature operation (<250°C). Thus far, several technology packages have been proposed and tested to meet the low NOX regulations. The technical feasibility of one technology package to meet the CARB low-NOx limit, 0.02 g/hphr on the FTP test cycle, has been demonstrated (Sharp et al., 2021; Neely et al., 2019; Matheaus et al., 2021; Sharp, 2020; Zavala et al., 2022; McCarthy, 2027). That technology package included the addition of cylinder de-activation (CDA) to the engine and a light-off SCR (selective catalytic reduction) sub-system upstream of the conventional heavy-duty diesel aftertreatment system (Sharp et al., 2021; Zavala et al., 2020; Neely et al., 2019).
Not surprisingly, alternatives to the “CDA + dual-dosing technology” package have been proposed. One alternative involves adding an exhaust burner upstream of the conventional aftertreatment system. Recently, the technical feasibility of this alternative was investigated (McCarthy et al., 2022; Harris et al., 2021). This study demonstrated that it is possible to achieve very low tail-pipe NOx emissions on the composite FTP emissions compliance test (e.g., 0.023 g/hphr, with the aftertreatment system hydrothermally aged to 435,000 miles equivalent). Perhaps surprisingly, this result was achieved without increasing CO2 emissions, and without making any changes to the engine’s production calibration. A detailed analysis of the data indicated that the burner’s operation enabled the engine to transition from thermal management to fuel economy mode much earlier in the cycle, such that the engine consumed less fuel overall, and the amount of fuel saved equaled that consumed by the burner.
The NOX vs. CO2 performance of the burner-based system on low-load test cycles was also quantified in this technology feasibility demonstration. Under such conditions, the system provided very low NOx emissions, but increased CO2 emissions by ∼10% (McCarthy et al., 2022).
While the results from this fuel burner study were impressive, the need for improvement is obvious. First, the new CARB limit of 0.02 g/hphr was not attained. While it is reasonable to believe that co-optimization of the controls for the engine and burner can reduce the NOX by an additional 0.003 g/hphr, the creation of significant engineering margin is unlikely. Second, the significantly higher CO2 emissions under low-load operation will make it more difficult to meet greenhouse gas regulations, so something must be done to reduce overall fuel consumption under such operation as well. Therefore, this study has now been extended to consider two additional burner-based technology packages. Both of these packages included CDA on the engine, which has been shown to have a positive effect on CO2 emissions, particularly on low-load test cycles. One of the packages included the addition of a light-off SCR sub-system upstream of the burner, to reduce NOx emissions during the first 300s of the cold-start FTP cycle. Importantly, the performance of both technology packages was able to be compared directly to an additional “baseline” system that had been developed and thoroughly tested in a previous study (Neely et al., 2020).
2 Heavy duty test engine
The engine platform utilized was a MY2017 Cummins X15 designed to comply with the U.S. 2010 on-road heavy duty emission regulations. The engine was provided in a production state and then underwent several engine calibration and hardware updates (Neely et al., 2019; Neely et al., 2020). Engine calibration updates included changes to VGT position, intake throttling, EGR rates, multiple injection, and combustion phasing (Sharp et al., 2021; Neely et al., 2020). One notable hardware update to the engine included the integration of a cylinder deactivation system (CDA), which provided critical thermal management and GHG control characteristics (Sharp et al., 2021; Neely et al., 2019; ECFR, 2022; Pieczko et al., 2021; Reinhart et al., 2020; Morris and McCarthy, 2020; McCarthy, 2019a; McCarthy, 2019b; McCarthy, 2017b; Joshi et al., 2018). CDA also enabled flexibility in increasing turbine outlet temperatures for specialized operation like LO-SCR de-sulfation (deSOX) (McCarthy, 2017a). The engine calibration and hardware modifications have been extensively discussed in several publications so a detailed discussion will not be provided herein (Sharp et al., 2021; Neely et al., 2019; ECFR, 2022). Figure 1 and Table 1 provide a representation of the engine installation and the Cummins X15 engine parameters, respectively.
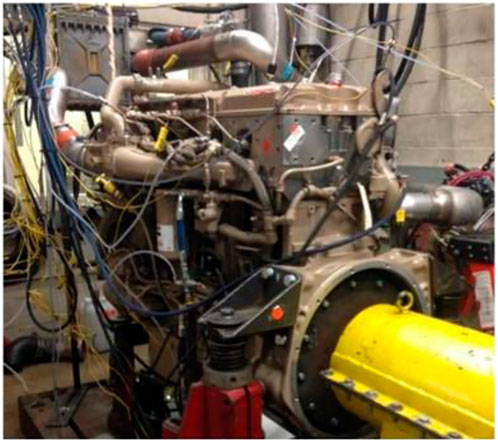
FIGURE 1. Heavy-duty engine installed in test cell.
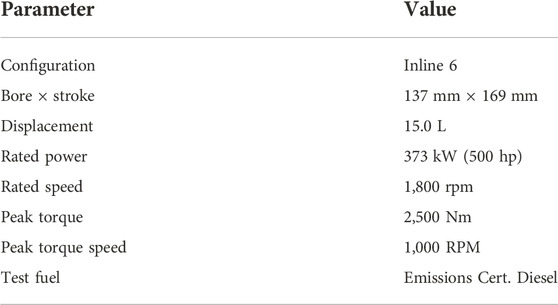
TABLE 1. Cummins X15 engine parameters.
The engine calibration used for this study utilized three dominant modes (Neely et al., 2020):
1) Thermal management mode
2) Intermediate mode
3) Fuel economy mode
Thermal management mode introduced higher turbine outlet exhaust temperatures and reduced engine outlet NOX. This mode was utilized at low temperature aftertreatment operation where the catalysts were most vulnerable to NOX reduction performance limitations. The intent of the mode was to limit the amount of tailpipe NOX emissions and increase aftertreatment temperatures. Operating with thermal management mode generated the highest CO2 of all the modes. Intermediate mode limited the amount of NOX generated by the engine and had little impact on the exhaust temperatures. This combination provided some fuel savings over thermal management mode. However, the engine had not yet achieved the lowest CO2 results. Intermediate mode was utilized when catalyst temperatures were above 225°C. At these temperatures, the aftertreatment system had high performance, but only with engine outlet NOX being restricted below a certain level. Once the aftertreatment system was at optimal performance temepratures, fuel economy mode would be utilized to allow for the best CO2 result. Along with the best CO2 results, fuel economy mode also generates the most amount of engine outlet NOX.
In this study, some changes were made to the aftertreatment system temperature threshold values that dictate the switching from one engine control mode to another. Specifically, the switching thresholds temperatures were increased for the CDA + Burner + Primary configuration to ensure that NOx control was achieved. Due to limited time in the test cell, these changes were unable to achieve optimal performance with respect to NOx and CO2. Nevertheless, the test results and analysis below do indicate how the control system can be further optimized, as well as the potential benefits of that optimization.
3 Fuel burner
The fuel burner utilized in this study was a Tenneco prototype design suitable for a heavy-duty application. The burner system was configured to be “plug-and-play” where pressurized fuel flow was created with a Fluid-o-Tech MG304 pump to simulate a fuel supply pressure on the order of 4–10 bar, typical of the low-pressure fuel circuit of a diesel engine in a commercial vehicle. An Eaton roots blower with a displacement of 180 cc, powered by an off-the-shelf 24 V electric motor, supplied the combustion air required by the burner. The intake air for the blower was taken from the test cell environment and was passed through an air filter sized to emulate the pressure and cleanliness expected on the clean side of a vehicle’s air box. Before entering the blower, the airflow rate was measured directly with a hot wire anemometer.
The burner was controlled using a “2-tier” threshold that was integrated as part of the aftertreatment controller (McCarthy et al., 2022; Harris et al., 2021). This strategy features an initial “upper threshold” that allows the burner to rapidly increase temperature during engine start sequences, and a “lower threshold” to maintain temperature in the aftertreatment system. For example, if the two-tier threshold was set to 300/200, then the burner would target a DPF outlet temperature of 300°C during startup. Once this temperature is achieved, the controller would turn the burner off. The burner would remain off until the DPF outlet temperature decreased to the lower temperature threshold, or 200°C. At this point, the burner would turn on again until the DPF outlet temperature exceeded 200°C.
4 Aftertreatment system configurations
The aftertreatment system utilized for this study was a candidate system from the CARB low NOX technology evaluation (Zavala et al., 2020). The system was procured in 2019 and reflected catalyst formulations and dimensions consistent with proposed low NOX regulations. The system was comprised of a close coupled light-off SCR (LO-SCR) catalyst and a downstream system. The LO-SCR was equipped with a heated DEF injector capable of introducing DEF at low turbine outlet temperatures (>130°C). The downstream system was equipped with a conventional DEF injector, which started introducing DEF at an SCR inlet temperature of 180°C. The downstream system included a zone-coated catalyzed soot filter (zCSF) and a dual pathway SCR + SCR/ASC configuration. It is worth noting that the zCSF had the oxidation functionality of a DOC and particulate filtering functionality of a DPF in one component. The baseline system schematic, which does not have the burner installed, is shown in Figure 2.
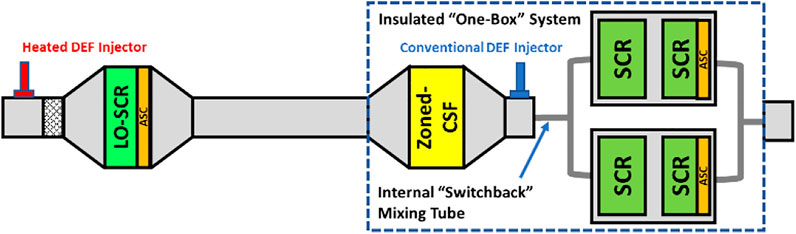
FIGURE 2. Baseline system schematic of the CDA + LO-SCR + Primary system.
The baseline system and its performance results have been extensively reported on dating back to 2019. Table 2 shows results on the composite FTP using CDA, LO-SCR, and a primary aftertreatment system over several years (Neely et al., 2019; Matheaus et al., 2021; Sharp, 2020; Zavala et al., 2022; McCarthy, 2027). At each point, the aftertreatment system was tested in its reference state. The only significant difference noted below is for the first test, which was completed in 2019. That test utilized an engine calibration that would be appropriate for the first 100,000–200,000 miles of service accumulation. Because the catalysts have yet to achieve their complete degradation state at 200,000 miles, the aftertreatment system can tolerate higher engine outlet NOX emissons in order to reduce fuel consumption.
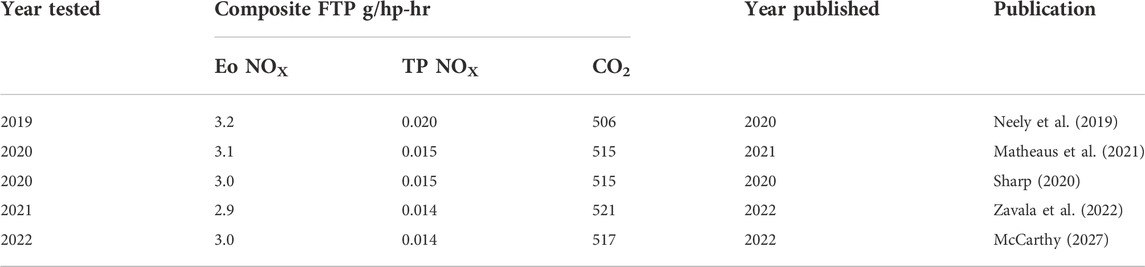
TABLE 2. Demonstrated 2027 emissions using CDA, LO-SCR, and primary aftertreatment over four (4) calendar years.
The later tests (2020+) utilized an engine calibration that was more conducive to lower tailpipe NOX emissions, but increased CO2. The decision to replace the first reference calibration was informed by catalyst degradation results from the CARB low NOX technology demonstration (Sharp et al., 2021). The demonstration results indicated that achieving a 0.02 g/hp-hr tailpipe (TP) NOX target required more thermal management mode utilization. The last four sets of results achieved 0.014–0.015 g/hp-hr NOx, yielding 25%–30% margin for 2027 emissions. However, the CO2 increased by ∼2%. Compared to a production system that meets 0.2 g/hp-hr, the latest low NOX configuration is considered CO2 neutral. This is a significant set of results that show 2027 compliance up to 8 years in advance of the regulation and showed repeatability over four calendar years.
In the current study, two burner-augmented aftertreatment system configurations were considered. The first is the LO-SCR + primary system discussed in the previous paragraph, but with the burner installed between the upstream and downstream systems. Burner placement for this system was based on leveraging the upstream and the downstream systems during low temperature exhaust conditions. That is, the LO-SCR is already in a thermally advantaged position, which provides rapid catalyst warm up characteristics. In addition to positioning, CDA operation further increases the turbine outlet temperature. The downstream system, however, is typically subjected to a delayed warm up strategy, which limits NOX abatement performance. With the burner, the downstream system can be leveraged for NOX mitigation during cold starts and low temperature exhaust conditions. Figure 3 shows the schematic for the burner augmented system.
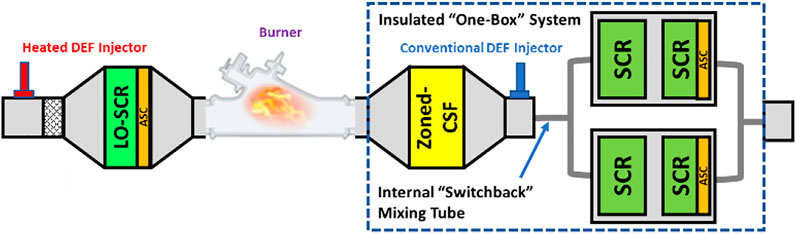
FIGURE 3. Burner configuration schematic for the CDA + LO-SCR + Burner + Primary system.
Because the burner generates high quantities of heat energy, there is potential for rapid warm-up on the downstream system catalysts. The investigators, therefore, also tested a primary system only configuration with the burner installed. The upstream catalyst system was removed, which reduced the overall system SCR volume, but provided a more compact solution. Additionally, GHG emissions could be expected to benefit as periodic deSOX events would be eliminated and active regeneration events would be reduced.
It should be noted that a system without a LO-SCR requires a large margin to the compliance standard. During regeneration events, the SCR can be exposed to temperatures in excess of 500°C, which significantly decreases NOX reduction performance (Henry et al., 2012; Luo et al., 2015). Because of this, regulators consider the increase in NOX emissions with an Infrequent Regeneration Adjustment Factor, or IRAF (Environmental Protection Agency, 2022). A system equipped with a LO-SCR has a reported IRAF of 0.002 g/hp-hr (Sharp et al., 2021). In contrast, the estimated IRAF for a system without a LO-SCR is 0.004 g/hp-hr, which has implications on the final result. For example, if a system generates a 0.016 g/hp-hr NOX on the FTP composite result and the IRAF is 0.004 g/hp-hr, then the final FTP composite result is 0.02 g/hp-hr. Though the example would meet the 2027 CARB NOX standard, there is no margin to the standard. Furthermore, the downstream system configuration would only be a viable option if margin to the compliance limit was at least 40%. Figure 4 provides a schematic of the burner configuration without the LO-SCR.
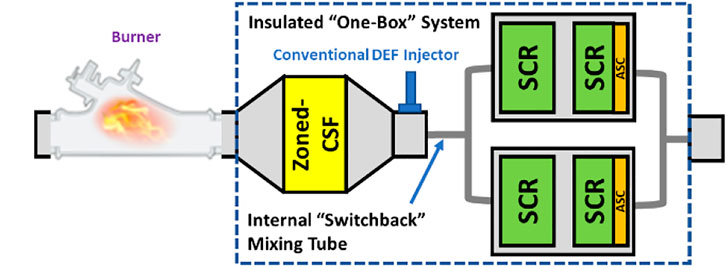
FIGURE 4. Burner configuration of the CDA + LO-SCR + Primary system.
Prior to testing, the aftertreatment system was subjected to an accelerated aging protocol utilizing a burner-based aging platform. The protocol targeted an amount of heat loading equivalent to 435,000 miles or 9,800 h of service accumulation time; this mileage is the current full useful life (FUL) but will be the intermediate useful life (IUL) in the future CARB regulation. The accelerated aging cycle lasted ∼100 h with an emphasis on regeneration and LO-SCR deSOX type conditions. These aging conditions did not include sulfur exposure or lubricant derived poisoning.
5 Drive cycles evaluated
The drive cycles evaluated in this study included the heavy-duty federal test procedure (HD-FTP), the low load cycle (LLC) and the Beverage Cycle.
The Heavy-Duty Federal Test Procedure (HD-FTP) is a regulatory drive cycle in the United States which is also referred to as the heavy-duty transient cycle which includes a cold and hot cycle. The emissions from the cold and hot cycles are weight 1/7 and 6/7, respectively, in calculating the composite emissions values. The CARB 2027 NOx regulatory standard for the FTP drive cycle drops by 90% from 0.20 to 0.02 g/hp-hr (California Air Resources Board, 2020).
The Low Load Cycle (LLC) is a real-world drive cycle consisting of data collected from different applications (California Air Resources Board, 2019b). This cycle is a new regulatory cycle that is approximately 1.5 h (California Air Resources Board, 2020; California Air Resources Board, 2019b). It focuses on sustained low load and featuresshort and long periods of engine idling, high accelerations after a pronounced cooling, and low speed cruise with motoring. The CARB NOx regulatory limit is at 0.05 g/hp-hr for the year 2027 (California Air Resources Board, 2020).
The Beverage Cycle is one of the application-specific operating behaviors that is incorporated into the LLC. This cycle is derived from a food service delivery truck. The cycle power is even less than for the LLC. It is only 800 s in length; as a result, this cycle was repeated four times in succession for thermal conditioning and the last two cycles latter were analyzed for stable results. Since this is not a certification cycle, there is no compliance limit. For the purposes of discussion, the 2027 LLC compliance standard, or 0.05 g/hp-hr, will be applied.
6 Results and discussion
The following section reports the results and provides insights for the various configurations considered. The analysis includes the examination of critical parameters that help to explain system behavior. It should also be noted that these results were generated over only 5 days of continuous testing. Therefore, system optimization was not explored for any configuration. The short time available forced the piecing together of elements of calibrations optimized for previous systems, most notably the baseline system of this study.
6.1 Heavy-duty federal test procedure
The composite FTP results are discussed first, followed by a detailed discussion of the cold and hot FTP.
Table 3 shows the composite results in quantitative form. The baseline composite FTP resulted in 0.014 g/hp-hr NOX and 517 g/hp-hr CO2. The CDA + LO-SCR + Burner + Primary (from Figure 3) showed a meaningful reduction in NOX, to 0.012 g/hp-hr, and a slight increase (0.2%) in BSCO2. It is worth noting that the historical variation for BSCO2 is ±1 g/hp-hr; therefore, it can be inferred that the burner configuration BSCO2 is statistically equivalent to the baseline. That is, the burner configuration provided a NOX improvement without changing the CO2. For the CDA + Burner + Primary system (from Figure 4), there was an increase in TP NOX, which places the result at the 2027 CARB HD-FTP compliance standard. With no margin, this result requires additional development. Additionally, this system exhibited a BSCO2 penalty of 0.8% compared to the baseline. As will be discussed, there is opportunity to optimize the system parameters and provide more meaningful results.
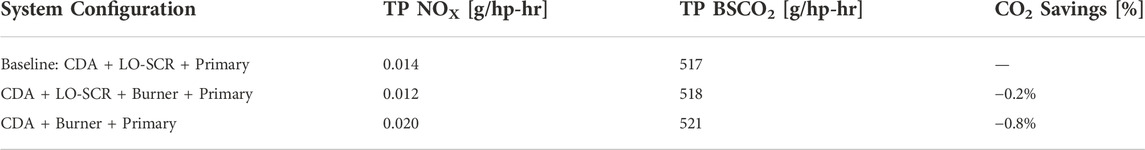
TABLE 3. Composite HD-FTP results for all the aftertreatment configurations.
6.2 Cold start heavy-duty federal test procedure
The following discussion will consider the cold start HD-FTP cycle. The cold start cycle weighting is 1/7 of the HD-FTP composite result. The cycle is carried out following an overnight soak with critical test article temperatures achieving a range of 20°C–30°C per 40 CFR Part 1065 (Matheaus et al., 2021). This included the engine oil temperature, engine coolant temperature, and exhaust temperatures. To help address the cold start temperatures, the engine calibration leveraged an elevated idle strategy for the first 220 s. Figure 5, which considers the cold start HD-FTP engine speed, shows that the elevated idle target was 1,200 rpm, and the normal idle target was 600 rpm.
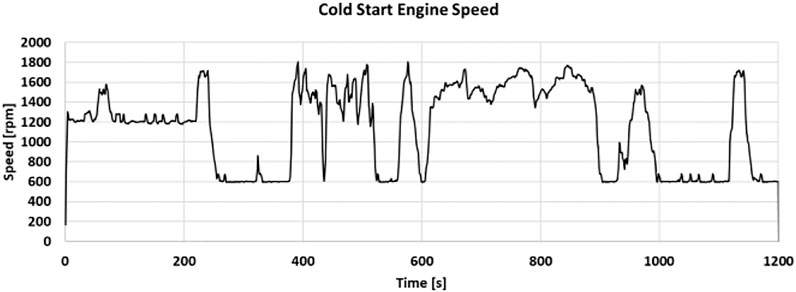
FIGURE 5. Cold Start HD-FTP engine speed measurement.
6.2.1 CDA + LO-SCR + Burner + Primary system
Table 4 compares the Baseline and the CDA + LO-SCR + Burner + Primary (from Figure 3) system emissions results. As shown, utilization of the burner provided a 17% tailpipe NOX emissions improvement. Considering cycle weighting, this improvement is equivalent to ∼0.001 g/hp-hr NOX in the composite emissions value. Inclusion of the burner increased CO2 by 1.4%, which is equivalent to a 0.2% increase in the composite result.

TABLE 4. Cold start HD-FTP results comparison between Baseline and CDA + LO-SCR + Burner + Primary system.
Figures 6A–E provide critical performance parameters for interpreting these results. Figures 6A,B provide the temperatures for the LO-SCR and primary system, respectively. As expected, differences in the primary SCR temperature were observed during the initial 200 s of the cycle. At the start of the cycle (i.e., the first 100 s), the burner operation was unable to increase the primary SCR temperature beyond 150°C. Since the SCR catalysts have no meaningful activity below this temperature, the system BSNOX emissions were similar between the experiments. This behavior can be observed in Figure 6C, which considers the cumulative tailpipe BSNOX emissions. Between 100 and 200 s, the small increase in BSNOx exhibited by the burner system is due to NOx emissions from the burner itself. After 200 s, burner operation reduced the amount of tailpipe NOX as the primary system temperatures increased. More importantly, the burner enabled the primary system to achieve 150°C within 160 s, while the baseline system required 390 s to reach this benchmark. Thus, the burner-based rapid warm-up strategy enabled significantly higher NOX conversion between 200 s and 400 s.
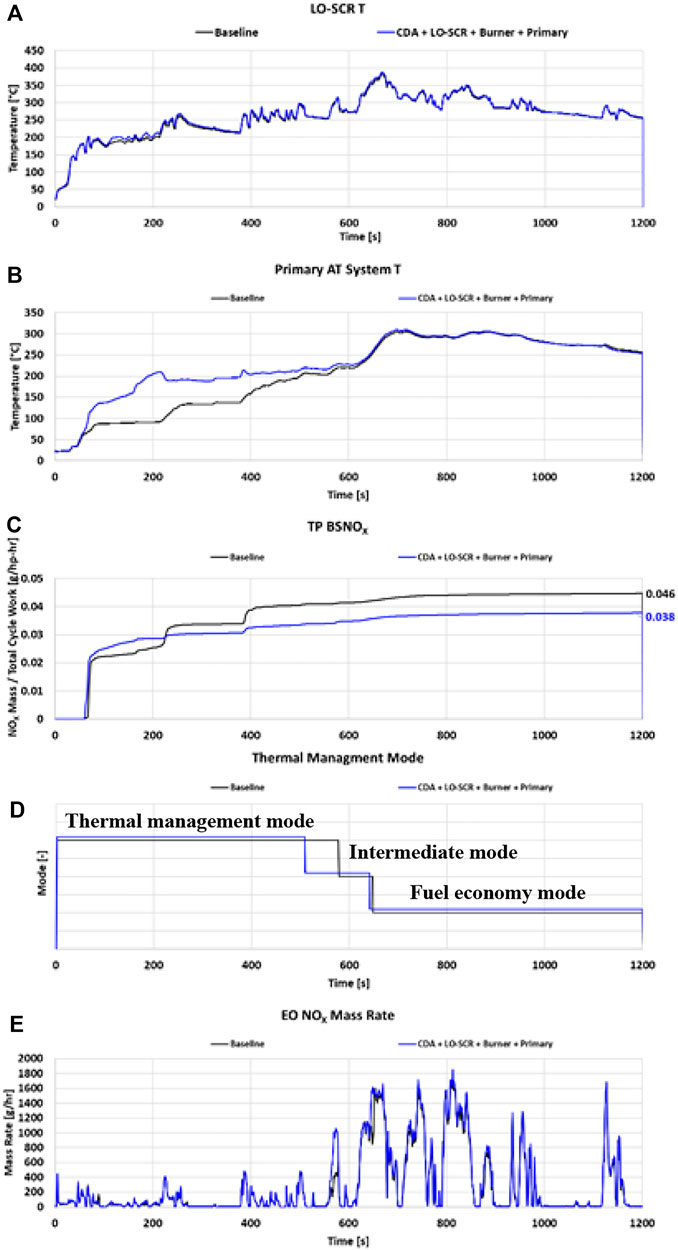
FIGURE 6. Cold start HD-FTP measurement comparisons between the Baseline and CDA + LO-SCR + Burner + Primary systems. (A) LO-SCR temperature, (B) primary system temperature, (C) cumulative TP BSNOX, (D) engine mode comparison, (E) engine outlet NOX mass rate.
After 400 s, there was no observable performance benefit for the burner configuration. There was, however, a difference in engine mode switching points resulting from the higher primary system temperatures. Figure 6D, which shows the engine mode comparison, does indicate an earlier engine mode switch from thermal management to intermediate mode for the burner configuration. This occurred at 500 s for the burner experiment and 580 s for the baseline experiment. This earlier switching reduced CO2 by ∼1 g/hp-hr CO2, but this was insufficient to offset the additional CO2 produced by the burner. Figure 6E, which shows the engine out NOX mass rates also provides insight regarding engine behavior. In this case, the burner configuration was exposed to more NOX as the engine entered the intermediate mode sooner, yet the aftertreatment system was able to tolerate it without a loss in overall NOx performance. This suggests that an even earlier switch from thermal management to intermediate mode, enabled by reducing the temperature threshold corresponding to the primary SCR, could be tolerated. This would then result in a further reduction in CO2 produced by the engine.
6.2.2 CDA + Burner + Primary system
Table 5 provides a comparison between the baseline system and the CDA + Burner + Primary system. As shown in the table, the burner configuration generated 6.5% more NOX than the baseline result. Nevertheless, this result was encouraging because this configuration was without the LO-SCR catalyst and relied solely on the burner to enable rapid warm-up. Like the previous burner result, this configuration accrued a CO2 penalty.
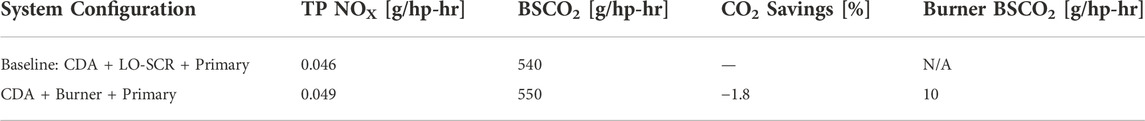
TABLE 5. Cold start HD-FTP results comparison between baseline and CDA + Burner + Primary system.
Figures 7A–D provides the measurement data assessed during the result analysis. In this group of graphs, there is no LO-SCR temperature measurement as the burner configuration was not equipped with the LO-SCR. However, if there is interest in looking at the baseline LO-SCR temperature, Figure 6A can be referenced for the baseline configuration. Figures 7A,B consider the primary system temperature comparison and cumulative TP BSNOX results, respectively. The TP NOX was higher for the burner configuration during the first 100 s, due to the NOx produced by the burner itself and the primary SCR catalyst not yet being activated. However, by 100 s, the burner had rasied the temperature of the primary SCR such that it could achieve almost 100% NOx conversion from that point onward in the test. In contrast, the baseline system continued to emit significant amounts of NOx until 400 s, largely because its primary SCR did not reach 150°C until that time.
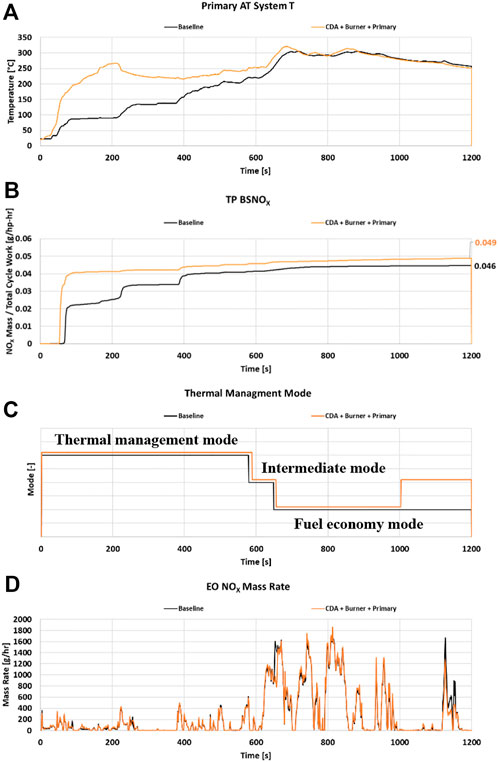
FIGURE 7. Cold start HD-FTP measurement comparison between the Baseline and the CDA + Burner + Primary systems. (A) Primary system temperature, (B) Cumulative TP BSNOX, (C) Engine mode comparison, (D) Engine outlet NOX mass rate.
As noted in a previous paragraph, the burner configuration generated higher CO2 emissions. Figure 7C provides the engine mode state comparison during the cycle for the baseline and the burner configuration. The first 1,000 s of the cycle were shown to be very similar between the experiments. In addition, the burner configuration transitioned back from fuel economy to intermediate mode at 1,000 s in the cycle. The NOx results achieved with the burner configuration suggest that it should be possible to adjust the engine mode aftertreatment temperature thresholds so that the engine transitions from thermal management to intermediate mode much sooner, and stays in fuel economy mode for the last 200 s of the cycle. These changes would have a positive impact on CO2 emissions from the engine, and could be sufficient to offset the CO2 produced by the burner.
6.3 Hot start HD-FTP
The next cycle executed in the test sequence was a hot start HD-FTP cycle, which was preceded by a 20-min hot soak period. The hot start cycle represented a weighting of 6/7 of the HD-FTP composite result. Unlike the cold start cycle, the hot start cycle did not make use of the elevated idle seen in the case of the cold start.
6.3.1 CDA + LO-SCR + Burner + Primary system
Table 6 considers the hot start results comparison between the Baseline and the CDA + LO-SCR + Burner + Primary system. As shown, there was no meaningful difference between the results generated for the hot start tests. CO2 does show 0.2% improvement for the burner experiment. However, the difference between the Baseline and burner CO2 results falls within the observed variation for historical tests (±2 g/hp-hr CO2). Therefore, the CO2 results were considered equivalent.
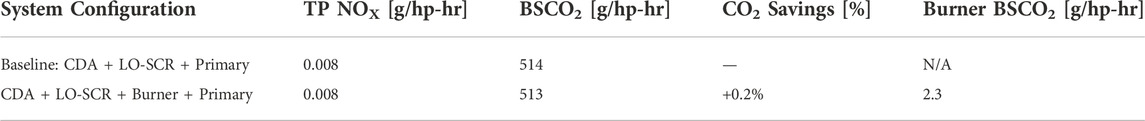
TABLE 6. Hot start HD-FTP results comparison between Baseline and CDA + LO-SCR + Burner + Primary system.
Though the burner did not provide a benefit to the BSNOX, valuable insight was gained regarding its impact to aftertreatment behavior. Figures 8A–E provides test article measurement comparisons between the baseline and the burner configuration system. This includes aftertreatment temperatures, cumulative tailpipe BSNOX, engine mode state, and engine outlet NOX mass rate. It is worth noting that the burner operated continuously for the first 60 s of the cycle. Figures 8A,B show the LO-SCR and the primary system temperatures, respectively. Primary system temperatures for the burner configuration were shown to be higher in the first 400 s. The increase brought the primary system temperatures to above 200°C whereas the baseline system remained below 200°C. This provided an improvement in tailpipe NOX emissions, which are shown in Figure 8C. At 400 s, the baseline system generated a 0.006 g/hp-hr NOX result and the burner configured system generated a 0.005 g/hp-hr NOX result, or a 17% improvement.
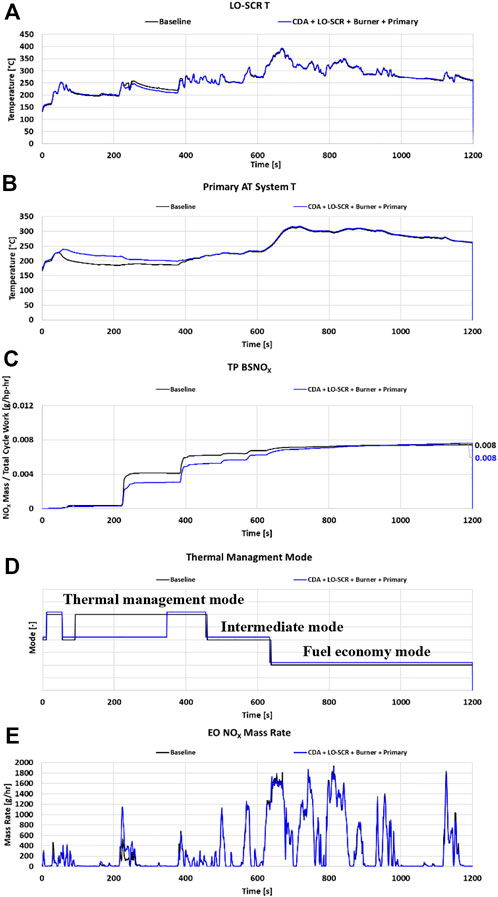
FIGURE 8. Hot start HD-FTP measurement comparisons. (A) LO-SCR temperature, (B) Primary System temperature, (C) Cumulative TP BSNOX, (D) Engine mode comparison, (E) Engine outlet NOX mass rate.
In addition to the higher aftertreatment temperatures, burner operation led to a reduction in thermal management mode duration. Figures 8D,E provide the engine mode state and engine out NOX mass rate comparisons, respectively. The intermediate mode was observed as the dominant engine mode for the first 400 s of the burner experiment. This generated additional engine out NOX emissions, which the aftertreatment system was able to tolerate due to the increase in primary SCR temperature. Moreover, the 13°C–25°C primary SCR temperature increase provided NOX performance benefits and included leveraging an engine mode that generates less CO2.
6.3.2 CDA + Burner + Primary system
Table 7 compares the Baseline and the CDA + Burner + Primary system emissions results. As shown, the burner tailpipe NOX nearly doubled with the burner configuration, but the 0.015 g/hp-hr result is still well below the 0.020 g/hp-hr limit. Also, the CO2 increased by 0.4%.
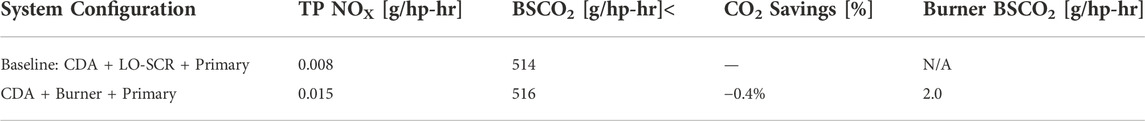
TABLE 7. Hot start HD-FTP results comparison between Baseline and CDA + Burner + Primary system.
Figures 9A–D provides the measurement comparisons for temperature, NOX emissions, and engine mode state. The primary system aftertreatment temperature comparison, which is shown in Figure 9A, indicated higher temperatures for the burner configuration. The higher temperatures were observed up to 700 s and included the low temperature challenge segment of the cycle. For example, the burner configuration was able to maintain primary SCR system temperatures in excess of 200°C and limited the amount of tailpipe NOX up to 380 s (Figure 9C). At this point, the burner configuration was able to decrease tailpipe NOX by 50% relative to the Baseline configuration. More importantly, this indicated that the primary system was able to sustain low temperature performance without the LO-SCR.
FIGURE 9. Hot start HD-FTP measurements comparisons between Baseline and CDA + Burner + Primary Systems. (A) Primary system temperature, (B) Cumulative TP BSNOX, (C) Engine mode comparison, (D) Engine outlet NOX mass rate.
Beyond 380 s, the burner configuration NOX emissions increased significantly. One contributing factor to this was the DEF management control strategy. As discussed above, the aftertreatment system was implemented with a model based aftertreatment controller, which predicted SCR catalyst NH3 storage. NH3 storage targets were generated according to system behavior during preliminary evaluations, which dictated the aftertreatment system response to various exhaust conditions. Based on the predicted storage states, a more aggressive DEF dosing strategy needed to be implemented. For reference, the LO-SCR reduced ∼75% of the engine outlet NOX in the Baseline configuration. With appropriate changes to the DEF dosing controls, the investigators estimate that an additional 0.004 g/hp-hr reduction, for a result of 0.011 g/hp-hr NOX, should be possible with the burner configuration.
Figures 9C,D show the engine mode and engine out NOX mass rate comparison, respectively. It is important to recall that for the Baseline configuration, the engine mode change is dependent on the average temperatures of the LO-SCR and the primary system. However, with the LO-SCR removed, the engine mode switching depends solely on the primary system. To ensure tailpipe NOX control, the switching thresholds temperatures were increased for the burner configuration. This resulted in the engine spending even more time in thermal management mode compared to the Baseline configuration, which is clearly not necessary given that the burner contributed significant heat to the exhaust during the beginning of the cycle. In addition, the engine once again ended the cycle in intermediate mode, when it should have remained in fuel economy mode. The threshold increase contributed to the overall 0.4% CO2 increase. Another contribution to the CO2 increase was burner utilization as it was equivalent to 2 g/hp-hr CO2.
6.4 Low load cycle
The LLC was completed following the hot start HD-FTP cycle and a 20-min soak period. The cycle was completed with a curb idle transmission torque (CITT) of 56 N-m.
6.4.1 CDA + LO-SCR + Burner + Primary system
Table 8 shows results for the LLC for the Baseline, CDA + LO-SCR + Burner + Primary with initial calibration, and CDA + LO-SCR + Burner + Primary with the fuel economy engine calibration. The fuel economy calibration enabled transitioning into engine modes that produced less CO2 at lower aftertreatment temperatures. When comparing the results for CO2, the inclusion of the fuel economy calibration reduced CO2 by 1.6% compared to the Baseline result. In contrast, the Burner configuration without the fuel economy calibration generated a 1.1% CO2 penalty. The fuel economy calibration generated higher tailpipe BSNOX, but there was still over 50% margin for the CARB 2027 LLC regulation is 0.05 g/hp-hr.
TABLE 8. LLC results comparison between Baseline and CDA + LO-SCR + Burner + Primary system. The table also includes a point with a fuel economy engine calibration.
Figures 10A–E provide several measurement comparisons that have been discussed in the HD-FTP sections. In this set of graphs, the burner state was also provided as the burner was heavily relied upon during the low temperature cycles. In the first section of the LLC, or 0–1,800 s, there were many differences between the LO-SCR temperatures (Figure 10A) and the primary system temperatures (Figure 10B). As shown, the primary system temperatures were impacted by the utilization of the burner (Figure 10C). For example, both burner experiments kept the primary system at temperatures above 190°C. In contrast, the Baseline system temperatures decreased to 170°C. Figure 10D, which shows the cumulative TP BSNOX comparison provides further system performance insight. When comparing the Baseline and the burner experiment without the fuel economy calibration (blue), the burner experiment generated less NOX. This validates that increasing the primary system temperature provides an improvement in NOX reduction performance. With the fuel economy calibration, the experiment (red) generated an equivalent amount of NOX in the first segment compared to the Baseline. It also had a significant impact on the LO-SCR average temperatures as the engine outlet exhaust temperature was lower overall. In the first segment, the burner experiment with the fuel economy calibration reduced LO-SCR temperatures to 170°C. Again, the fuel economy calibration enabled CO2 savings, but it increased engine out NOX and decreased engine exhaust temperatures.
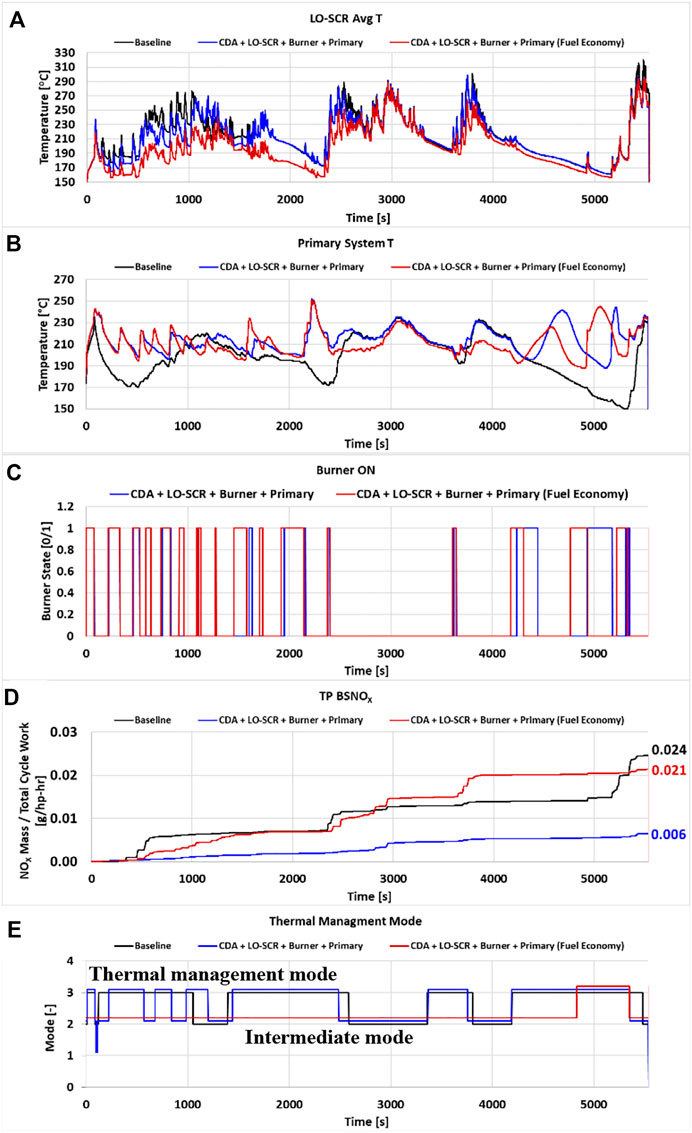
FIGURE 10. LLC measurement comparisons between Baseline and CDA + LO-SCR + Burner + Primary systems. The comparison includes an additional point with a fuel economy engine calibration. (A) LO-SCR temperature, (B) Primary system temperature, (C) Burner state, (D) Cumulative TP BSNOX, (E) Engine mode comparison.
In the next segment of the test cycle, from 1,800 to 4,000 s, the LLC enters a high load sequence, which increases aftertreatment inlet temperatures. The higher aftertreatment temperatures decreased the need for burner operation. The burner was primarily utilized during the start and end of the middle LLC segment. Consequently, these parts of the cycle are also considered parts of the extended idle sequences. During this middle section, it was noted that the fuel economy experiment generated the highest amount of NOX emissions. Still, the aftertreatment system was able control NOX emissions. The Baseline system and the other burner experiment (blue) utilized thermal management mode more frequently than in the fuel economy experiment, and resulted in lower TP NOX. Additionally, the LO-SCR temperatures were higher for both of those experiments.
The last segment, or 4,000 s to cycle end, includes an extended idle and “return to service” section. This section provided insight on burner operation during extended idle. As discussed in a previous paragraph, the primary system temperatures were maintained in excess of 190°C with burner. The Baseline system, however, showed primary system temperatures decreasing to 150°C. Near the conclusion of the cycle, there was a dynamic ramp that tested the system’s ability to return to service. For the Baseline system, the NOX rate increase was shown to be significantly higher compared to the Burner configuration. Furthermore, utilizing the burner to maintain aftertreatment performance allowed for reduced emissions.
In Figure 10E it can be noted that, in the fuel economy experiment, the engine stayed mostly in intermediate mode, which decreased overall CO2 emissions. This result indicates the path to further optimization of the NOx-to-CO2 trade-off for sustained low-load operation. Reducing the threshold temperatures for transitioning from thermal management to intermediate mode, as well as for transitioning from intermediate to fuel economy mode, will result in higher engine outlet NOx but also less CO2 being produced by the engine. In turn, the burner will operate more often (or for longer periods of time) to maintain the exhaust temperature, but this can result in less overall CO2 being produced because the burner is more efficient than a conventional engine at producing hotter exhaust (McCarthy et al., 2022; Harris et al., 2021). CDA offers an additional dimension to system optimization for minimal CO2.
6.4.2 CDA + Burner + Primary system
Table 9 provides the LLC results comparison between the Baseline and the CDA + Burner + Primary system. Like the HD-FTP results, the Burner configuration generated higher CO2 emissions compared to the baseline. TP BSNOX was observed to be significantly lower for the Burner configuration, which indicates that there is a clear opportunity to optimize the engine calibration for lower total CO2. Overall, the burner provides potential for a primary system configuration, thus avoiding the need to find packaging space for the LO-SCR.
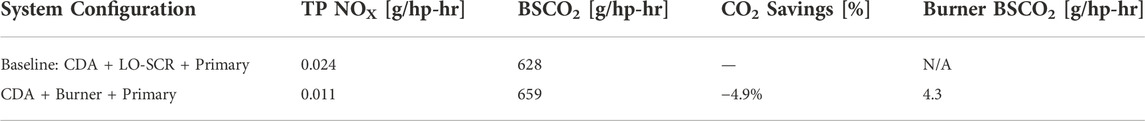
TABLE 9. LLC results comparison between Baseline and CDA + Burner + Primary system.
Figures 11A–D shows the measurement comparisons between the Baseline and the CDA + Burner + Primary systems. Figure 11A shows the primary system temperature for the Baseline and the Burner configuration. As shown, the burner generated higher temperatures across the primary system. However, removing the LO-SCR also reduced the amount of thermal inertia in front of the primary system. Therefore, the system temperature could be increased more quickly compared to a configuration with the LO-SCR installed.
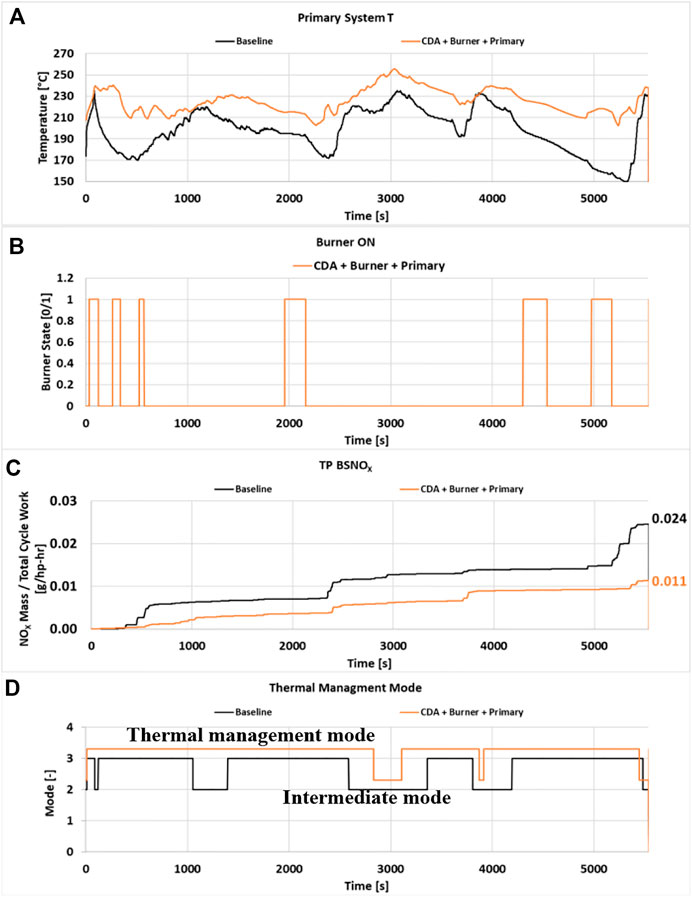
FIGURE 11. LLC measurement comparison between Baseline and CDA + Burner + Primary systems. (A) Primary system temperature, (B) Burner state, (C) Cumulative TP BSNOX, (D) Engine mode comparison.
By comparing Figures 11A,B, it can be seen that the burner operated for much less time in the CDA + Burner + Primary configuration experiment. This resulted because thermal management mode (Figure 11D) was the dominant engine mode during the cycle. Given the discussion in the previous section, it is clear that the engine calibration is far from optimal in this case. As noted previously, the temperature threshold for the transitions from thermal management to intermediate mode, and from intermediate to fuel economy mode, were set high to ensure a good NOx emissions result. However, with a burner in the system, the optimal calibration would send the engine into a lower CO2 mode as soon as possible, as well as keep it in that mode, thus allowing the burner to be mostly responsible for thermal management.
6.5 Beverage cycle
6.5.1 CDA + LO-SCR + Burner + Primary system
The following section considers three experiments involving the Baseline system, CDA + LO-SCR + Burner + Primary system, and CDA + LO-SCR + Burner + Primary system with the fuel economy calibration. Table 10 considers the brake specific results generated from the discussed experiments. Because the Beverage cycle is not a regulated cycle, there is no standard applied to it. For the purposes of this analysis, the investigators felt it appropriate to apply the 2027 LLC compliance standard of 0.05 g/hp-hr. The TP BSNOX results indicated that all of configurations were well within that imagined compliance limit. For the BSCO2 results, the beverage cycle followed a trend similar to the LLC cycle. That is, the Burner configuration without the fuel economy calibration (blue), generated higher BSCO2 than the baseline, but whenthe fuel economy calibration was utilized, the BSCO2 was 5.4% lower than the Baseline result. Overall, inclusion of the burner showed potential for reducing both the TP BSNOX and the BSCO2 emissions.
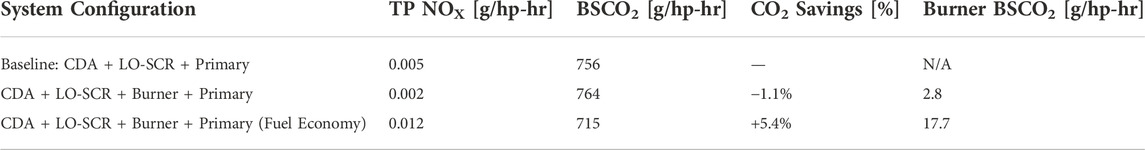
TABLE 10. BEV results comparison between Baseline and CDA + LO-SCR + Burner + Primary system. The table also includes a point with a fuel economy engine calibration.
Figures 12A–E provide measurement comparisons considered during the testing sequence. The measurement comparison was completed for the three discussed experiments. Figures 12A,B show the LO-SCR and primary system temperatures, respectively. For the primary system, the Burner experiments maintained the temperature in excess of 195°C while in the Baseline system the temperature decreased to 190°C. In the burner experiment without the fuel economy calibration (blue), the increase in minimum temperature and average temperature was shown to improve NOX emissions (Figure 12D). With the fuel economy calibration (red), the tailpipe NOX did increase, but associated significant reduction in CO2 emissions was also realized.
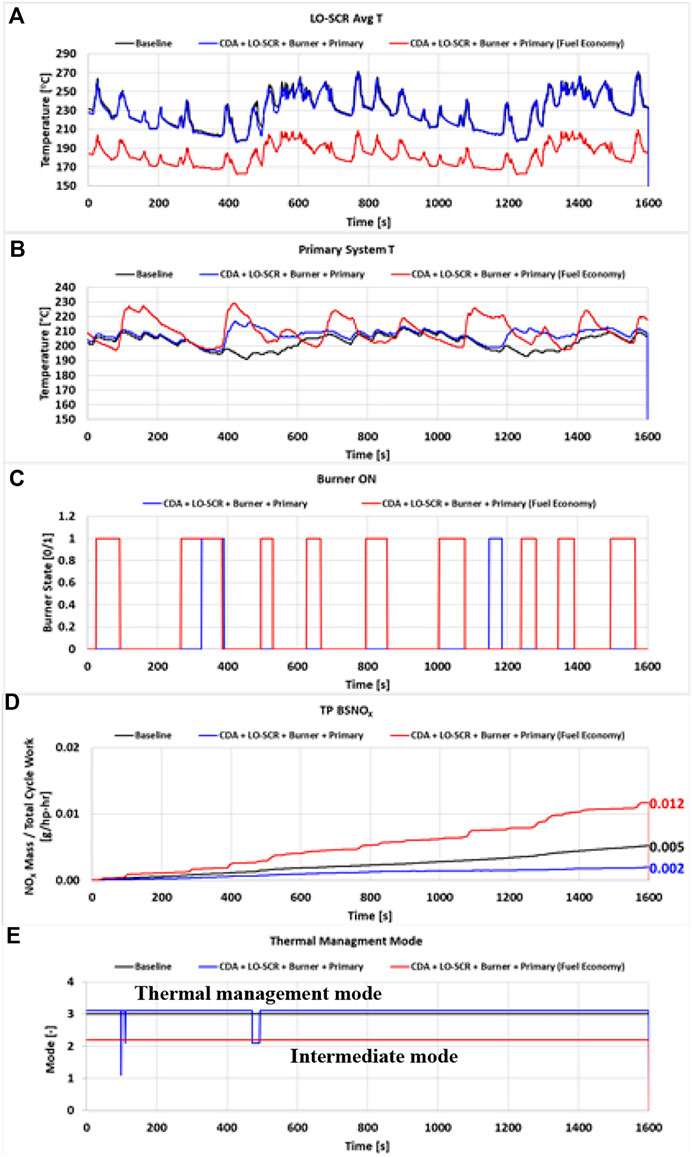
FIGURE 12. BEV measurement comparisons between Baseline and CDA + LO-SCR + Burner + Primary systems. The comparison includes an additional point with a fuel economy engine calibration. (A) LO-SCR temperature, (B) Primary system temperature, (C) Burner state, (D) Cumulative TP BSNOX, (E) Engine mode comparison.
Figure 12C shows the burner state throughout the cycle. The burner experiment with the fuel economy calibration was shown to have longer burner “ON” segments and lead to higher primary system temperatures. It is unclear if the higher temperatures were required or if the burner strategy could be optimized to further reduce the CO2 emissions. With the burner being utilized, differences were also observed in the LO-SCR temperatures. Namely, the burner experiment with the fuel economy calibration (red) showed much lower temperatures compared to the baseline and the other burner experiment (blue). Since the dominant engine mode (Figure 12E) was the intermediate mode, the LO-SCR was exposed to lower temperatures that made it less effective at reducing NOX. Despite this, the system was able to maintain control of NOX emissions and was well below the 0.05 g/hp-hr standard. This result indicates that the primary SCR becomes more critical to NOx control under sustained low-load conditions.
6.5.2 CDA + Burner + Primary system
Table 11 shows the Beverage cycle result comparison with the baseline and the CDA + Burner + Primary systems. The data indicate an increase in TP BSNOX emissions and BSCO2 emissions for the burner configuration. However, NOX emissions are still well below the imagined 0.05 g/hp-hr NOX limit for this cycle. This indicates that the engine calibration could be further optimized to enable even lower CO2 emissions. As seen with the LLC, this burner configuration provided promising results without the LO-SCR.

TABLE 11. BEV results comparison between Baseline and CDA + Burner + Primary system.
Figures 13A–D shows the measurement comparisons generated for the Baseline and the CDA + Burner + Primary systems. Figure 13A illustrates the primary system temperature and shows that the burner configuration had higher overall temperatures. For the burner experiment, the minimum primary system temperature was 205°C. The Baseline generated a minimum primary system temperature of 190°C. Figure 13B indicates that burner operation was quite limited during the cycle and Figure 13D shows that the experiments (Baseline and Burner configuration) utilized only the thermal management engine mode throughout the cycle. Once again, the temperature thresholds associated with the engine mode transitions to the lower CO2-producing modes were set to high in the burner experiment. Further optimization should enable the NOx-to-CO2 “sweet spot” provided by the combination of burner and CDA to be realized.
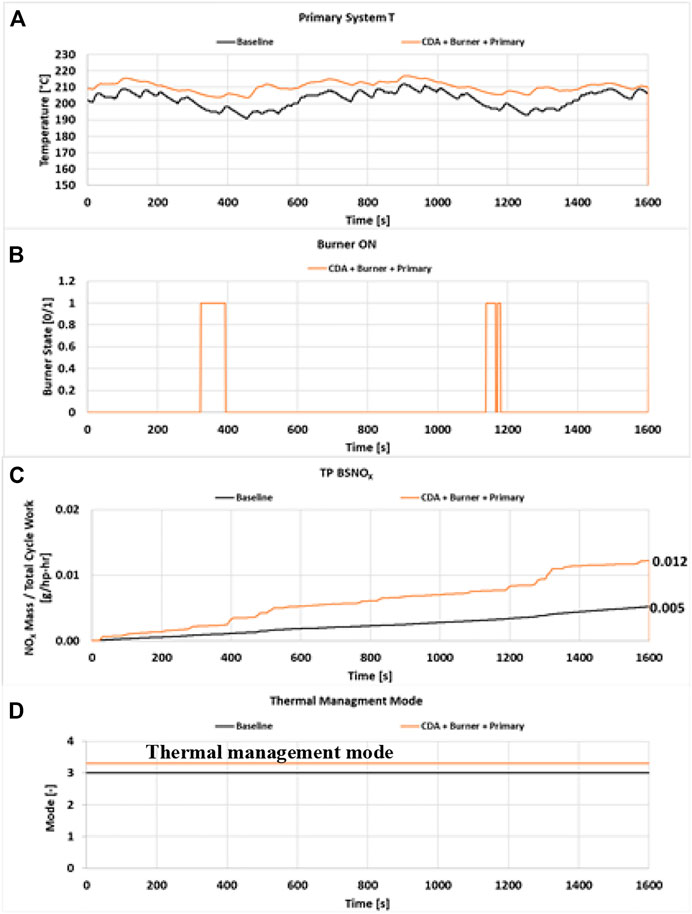
FIGURE 13. BEV measurement comparison between Baseline and CDA + Burner + Primary systems. (A) Primary system temperature, (B) Burner state, (C) Cumulative TP BSNOX, (D) Engine mode comparison.
7 Comparison w/o LO-SCR: Non-cylinder de-activation vs. cylinder de-activation
As discussed in the introduction, the following work is a continuation of efforts utilizing the fuel burner. Therefore, a brief comparison of systems with Non-CDA and CDA equipped engines is warranted. The previous effort considered the implementation of the burner with a non-CDA engine and a low NOX aftertreatment system (McCarthy et al., 2022; Harris et al., 2021). Like the engine platform utilized in the current study, the engine tested in the previous study was also a Cummins X15 engine; however, it remained in a production state (McCarthy et al., 2022; Harris et al., 2021) and was utilized with its production calibration.
The first configuration using CDA, fuel burner and the primary aftertreatment system is discussed first. The composite FTP achieved 0.020 g/hp-hr NOX which was right at the standard and was close to CO2 neutral (0.8% CO2 increase over the baseline). The non-CDA engine generated a 0.023 g/hp-hr NOX with no change in CO2. Both results provide no margin or exceed the 2027 NOX compliance standard or 0.02 g/hp-hr.
The LLC results were excellent at 0.011 g/hp-hr NOX, providing about 80% margin. The CO2 penalty was cut in about half in moving from the non-CDA to CDA engine dropping CO2 penalty from 9% (McCarthy et al., 2022) to 4.9%.
The Beverage Cycle, which is a portion of the LLC and not a regulatory cycle by itself, achieved a result of 0.014 g/hp-hr and was nearly CO2 neutral. CDA enabled fuel neutrality on the beverage cycles as the CO2 penalty without CDA was 13.2% (McCarthy et al., 2022) dropping to 0.2% penalty with CDA.
Overall, this comparison indicates that adding CDA to the engine and an exhaust burner to the conventional aftertreatment system provides a feasible technical solution for the new low-NOx regulations, as well as a solution with the potential to maintain or even reduce CO2 emissions.
8 Summary/conclusion
There have been multiple options demonstrated using development aged, full useful life aftertreatment catalysts for meeting upcoming 2027 emissions. Meeting NOx and remaining CO2 neutral or better is key to moving forward and this has been demonstrated. One such system includes using CDA, LO-SCR and primary aftertreatment system. This has been shown repeatedly over four calendar years.
The purpose of this work is to show the benefit of adding a fuel burner to the aftertreatment system. Previous work showed that a non-CDA engine with a burner upstream of a primary aftertreatment system could meet the LLC NOx comfortably with a fuel penalty while approaching 2027 composite FTP NOx yet remaining 15% too high at 0.023 g/hp-hr (McCarthy et al., 2022). The work presented in this paper adding cylinder deactivation to the engine and explored configurations with and without the LO-SCR with the fuel burner upstream of the primary aftertreatment system. It is worth noting that only five (5) days of engine testing were completed, which included a baseline day of running. Hence, further optimization could yield further reductions in NOx and CO2.
The first configuration using CDA, fuel burner and the primary aftertreatment system showed an advantage for CO2 reduction over the non-CDA results. The composite FTP achieved 0.020 g/hp-hr NOx which is right at the standard and is close to CO2 neutral (0.8% CO2 increase over the baseline). This is an improvement over the non-CDA engine work which dropped NOx from 0.023 to 0.020 g/hp-hr; however, more optimization to achieve margin would be necessary. The LLC NOx results were excellent at 0.011 which is about 80% margin. The CO2 penalty for the LLC was cut in about half moving from a non-CDA to CDA engine dropping CO2 penalty from 9% (McCarthy et al., 2022) to 4.9% while resulting in cellent NOx at 0.011 which is about an 80% margin to the CARB standard. Finally, enabled fuel neutrality on the Beverage Cycle was achieved as the CO2 penalty without CDA was 13.2% (McCarthy et al., 2022) dropping to 0.2% penalty with CDA. This NOx on the Beverage Cycle was excellent at 0.014 consistent with the LLC low NOx.
The final configuration used CDA, LO-SCR, fuel burner and the primary aftertreatment system. The composite FTP achieved 0.012 g/hp-hr NOx which 40% margin to the standard and is CO2 neutral (0.2% CO2 increase over the baseline). More optimization is warranted to drop CO2 further as this configuration was only tested for 1 day. The LLC NOx results were excellent showing a near zero NOx value at 0.006 g/hp-hr with 1.1% CO2 penalty and another calibrating with 60% NOx margin at 0.021 g/hp-hr at a 1.6% CO2 savings. The beverage cycle showed the save excellent results having a near zero NOx solution at 0.002 g/hp-hr at 1.1% CO2 penalty or a 0.012 g/hp-hr NOx (still close to zero NOx) and a 5.4% CO2 savings.
The results with combining CDA and the fuel burner together are encouraging. More work would be required to bring the system without the LO-SCR for further dropping the composite FTP NOx. The combination of CDA, LO-SCR and fuel burner upstream of the primary aftertreatment system meets all requirements with significant NOx margin with either CO2 neutrality and even savings on the LLC and beverage cycle. This combination of work with CDA and the fuel burner is another demonstration of meeting 2027 emissions using end of life aged aftertreatment catalysts within 5 years of the regulations.
Data availability statement
The original contributions presented in the study are included in the article. Further inquiries can be directed to the corresponding author.
Author contributions
BZ executed the testing, completed the data analysis, and the body of the paper. Jim McCarthy wrote the abstract, introduction, and summary of the paper. He also contributed to the data analysis and generated the experimental plan. Tom Harris wrote the burner test article paragraph and contributed to the data analysis..
Acknowledgments
The authors would like to acknowledge the support of multiple supporting organizations for this work including CHEDE-VII, CARB, EPA, MECA, SCAQMD, SwRI, Cummins, and Eaton. The authors would also like to acknowledge Matt Muhleck of Tenneco for providing engineering support for the burner prototype at SwRI, and the management of SwRI, Eaton and Tenneco for supporting this work and publication.
Conflict of interest
Author JM was employed by Eaton and Author TH was employed by Tenneco.
The remaining author declares that the research was conducted in the absence of any commercial or financial relationships that could be construed as a potential conflict of interest.
Publisher’s note
All claims expressed in this article are solely those of the authors and do not necessarily represent those of their affiliated organizations, or those of the publisher, the editors and the reviewers. Any product that may be evaluated in this article, or claim that may be made by its manufacturer, is not guaranteed or endorsed by the publisher.
Abbreviations
BMEP, brake mean effective pressure; BP, bypass; BSFC, brake specific fuel consumption; CARB, California Air Resources Board; CDA, cylinder deactivation; DEF, diesel exhaust fluid; DOC, diesel oxidation catalyst; DPF, diesel particulate filter; EH, electric heater; EO, engine-out; FTP, federal test procedure; HD, heavy-duty; LLC, low load cycle; LO-SCR, light-off SCR; NVH, noise, vibration, and harshness; RPM, revolutions per minute; PID, proportional, integral, and differential; SCR, selective catalytic reduction; TM, thermal mode; TP, Tailpipe.
References
California Air Resources Board, , et al. (2020). California adopts strong new regulation to further reduce smog-forming pollution from heavy-duty diesel trucks. Available at: https://www.arb.ca.gov/news/california-adopts-strong-new-regulation-further-reduce-smog-forming-pollution-heavy-duty Aug 28, 2020).
California Air Resources Board, (2019). Low load cycle development. CARB workshop proceedings, sacramento: California air Resources board. Available at: https://ww2.arb.ca.gov/sites/default/files/classic/msprog/hdlownox/files/workgroup_20190123/02-llc_ws01232019-1.pdf Accessed June 01, 2022).
California Air Resources Board, (2019). Staff current assessment of the technical feasibilty of lower NOX standards and associated test procedures for the 2022 and subsequent ModelYear medium-duty and heavy-duty diesel engines. Available at: https://www.arb.ca.gov/msprog/hdlownox/white_paper_04182019a.pdf April 18, 2019).
Ecfr, (2022). Ecfr - code of federal regulations, “electronic code of federal regulations (eCFR),” office of federal register. Accessed Available at: https://www.ecfr.gov/cgi-bin/text-idx?tpl=/ecfrbrowse/Title40/40cfr1065_main_02.tpl June 20, 2022).
Environmental Protection Agency, (2022). Environmental protection agency. 40 CFR Part 1065.680. Available at: https://www.ecfr.gov/current/title-40/chapter-I/subchapter-U/part-1065/subpart-G/section-1065.680 Accessed June 01, 2022).
Harris, T., McCarthy, J., Sharp, C., Zavala, B., and Matheaus, A. (2021). Meeting future NOx emissions limits with improved total fuel efficiency. presented at Heavy-Duty, On- and Off-Highway Engines 2021 (ATZ), Rostock, Germany. December 1. doi:10.3389/fmech.2022.979771
Henry, C., Kamasamudram, K., Currier, N., Yezerets, A., Castagnola, M., and Chen, H. Y. (2012). Axially resolved performance of Cu-zeolite SCR catalysts. SAE Int. J. Engines 5 (3), 975–984. doi:10.4271/2012-01-1084
Joshi, M. C., Gosala, D. B., AllenSrinivasan, S., Shaver, G. M., Ramesh, A. K., Van Voorhis, M., et al. (2018). Diesel engine cylinder deactivation for improved system performance over transient real-world drive cycles. 2018-01-0880. Warrendale, PA: SAE. Apr 3. doi:10.4271/2018-01-0880
Luo, J., An, H., Kamasamudram, K., Currier, N., Yezerets, A., Watkins, T., et al. (2015). Impact of accelerated hydrothermal aging on structure and performance of Cu-SSZ-13 SCR catalysts. SAE Int. J. Engines 8 (3), 1181–1186. doi:10.4271/2015-01-1022
Matheaus, A., Neely, G. A., Sharp, C. A., Hopkins, J., and McCarthy, J. (2021). Fast diesel aftertreatment heat-up using CDA and an electrical heater. Warrendale, PA: SAE 2021-01-0211, April 6, 2021. doi:10.3389/fmech.2022.9180
McCarthy, J. (2017). Enabled improved vehicle fuel economy and emissions,” 2017 Symposium – Engine Research Center. Lyon, France. December 2017: University of Wisconsin-MadisonJune 14.
McCarthy, J. “Demonstrated solutions for meeting 2027 NOx and CO2,” in GAMC Vehicle Efficiency, Electrification and Emissions (VEEE) 2022 Conference, Anaheim, United State, June 2022.
McCarthy, J. “Cylinder deactivation improves diesel aftertreatment and fuel economy for commercial vehicles,” in 17th Stuttgart International Symposium, Stuttgart, Germany, Mar 2017. doi:10.3389/fmech.2019.0005
McCarthy, J., Matheaus, A., Zavala, B., and Sharp, C. (2022). Meeting future NOX emissions over various cycles using a fuel burner and conventional aftertreatment system. Technical Paper 2022-01-0539. Warrendale, PA: SAE. doi:10.4271/2022-01-0539
McCarthy, J. “Meeting future low load emissions using cylinder deactivation and EGR pumps to achieve simultaneous NOX and CO2 reduction,” in keynote at Global Automotive Management Conference (GAMC) Emissions 2019 Conference, Livonia, United State, June 2019.
McCarthy, J. (2019). Meeting future low-load emissions using cylinder deactivation to achieve simultaneous NOx and CO2 reduction. SAE Int. J. Engines, 13. Sept 4. 2.
Morris, A., and McCarthy, J. (2020). The effect of heavy-duty diesel cylinder deactivation on exhaust temperature, fuel consumption, and turbocharger performance up to 3 bar BMEP. 2020-01-1407. Warrendale, PA: SAE. 4 14, 2020).doi:10.4271/2020-01-1407
Neely, G., Sharp, C., Pieczko, M., and McCarthy, J. (2019). Simultaneous NOX and CO2 reduction for meeting future CARB standards using a heavy-duty diesel CDA-NVH strategy. SAE Int. J. Engines 13 (2), 191–210. doi:10.4271/03-13-02-0014
Neely, G., Sharp, C., and Rao, S. CARB low NOX stage 3 program – modified engine calibration and hardware evaluations. Warrendale, PA: SAE. Technical Paper 2020-01-0318. doi:10.4271/2020-01-0318
Pieczko, M., McCarthy, J., and Hamler, J. (2021). Mitigating vibration for a heavy-duty diesel cylinder deactivation truck. 2021-01-0661. Warrendale, PA: SAE. April 6, 2021).doi:10.4271/2021-01-0661
Reinhart, T., Matheaus, A., Sharp, C., Peters, B., Pieczko, M., and McCarthy, J. (2020). Vibration and emissions quantification over key drive cycles using cylinder deactivation. Int. J. Powertrains 9 (4), 315–344. doi:10.1504/ijpt.2020.10033152
Sharp, C., Neely, G., Zavala, B., and Rao, S. (2021). CARB low NOx stage 3 program - final results and summary. Warrendale, PA: SAE. Technical Paper 2021-01-0589. doi:10.4271/2021-01-0589
Sharp, C. (2020). Update on the path to 2027 emissions stage 3 low NOX program results. Michigan, United State: Global Automotive Management Council. Available at: www.gamcinc.com Sept 23, 2020).
Zavala, B., McCarthy, J., Matheaus, A., and Sharp, C. (2022). Fast diesel aftertreatment heat-up using CDA and an electrical heater between 1.2 and 5.0 kW. Front. Mech. Eng. 8. accepted. 17 5, 2022).doi:10.3389/fmech.2022.918003
Keywords: cylinder deactivation, burner, aftertreatment control, low NOx, diesel engine
Citation: Zavala BA, McCarthy JE and Harris T (2023) Burner based thermal management approach utilizing in-exhaust burner technology with a CDA equipped engine. Front. Mech. Eng 8:1022570. doi: 10.3389/fmech.2022.1022570
Received: 18 August 2022; Accepted: 22 November 2022;
Published: 12 January 2023.
Edited by:
Gabriele Di Blasio, Institute of Sciences and Technologies for Energy and Mobility (CNR), ItalyReviewed by:
Yoann Viollet, Saudi Aramco, Saudi ArabiaThomas Körfer, FEV, Germany
Arvind Thiruvengadam, West Virginia University, United States
Copyright © 2023 Zavala, McCarthy and Harris. This is an open-access article distributed under the terms of the Creative Commons Attribution License (CC BY). The use, distribution or reproduction in other forums is permitted, provided the original author(s) and the copyright owner(s) are credited and that the original publication in this journal is cited, in accordance with accepted academic practice. No use, distribution or reproduction is permitted which does not comply with these terms.
*Correspondence: Bryan Abel Zavala, YnJ5YW4uemF2YWxhQHN3cmkub3Jn