 Xiaopeng Yang
 Shunliang Yin1
- 1China North Vehicle Research Institute, Beijing, China
- 2School of Mechanical Engineering, Guangxi University, Nanning, China
- 3Tianjin Key Laboratory of New Energy Automobile Power Transmission and Safety Technology, School of Mechanical Engineering, Hebei University of Technology, Tianjin, China
Helical gears are widely used in various mechanical transmissions. Thus, analysing gear contact stresses is crucial to improve the fatigue limit and life of gears. In this paper, the contact stress of helical gear is analyzed by finite element simulation and experimental verification. The effect of coefficient of friction on the contact stress of helical gears is analysed, with given coefficients of friction. The following conclusions can be drawn through simulation and test. 1) The contact stress increases with the coefficient of friction in the early stage of meshing. 2) The contact stress decreases with the increase in the coefficient of friction in the late stage of meshing. 3) The gear contact fatigue test shows that the location of fatigue pitting on the tooth surface is consistent with that of the simulated maximum stress point. The friction-reducing coating on the gear surface can decrease the coefficient of friction between the tooth surfaces and thus effectively improve the gear contact fatigue life.
1 Introduction
The helical gear drive, which is widely used in the gear transmission of various mechanical equipment (Li et al., 2018), has a good degree of recombination and low meshing noise. Thus, improving the life of helical gears has a high application value for construction machinery. At present, gear failure is mainly in the form of contact and bending fatigue damages. In order to understand the mechanisms of gear damages and to improve gear lives, gear contact stresses should be properly obtained.
Chen (Chen and Tsay, 2002) simulated helical gears based on finite elements to analyse the contact stress variation based on the theory of gearing. Litvin (Litvin et al., 2002) proposed an improved contact stress calculation method for helical gears based on the gear meshing principle. Santosh (Santosh et al., 2014) studied the effect of helix angle on contact stress in gears by finite element static analysis. Zhang (Zhang et al., 2020) analysed the effect of design parameters on contact stress in cylindrical gears by numerical simulation. Duo (Zhou et al., 2019a; Zhou et al., 2019b; Raynald and Sébastien, 2019; Zhang et al., 2019; Yang et al., 2020) studied the relationship between contact stress and tooth surface microformation through the theories of elasto-plasticity and statistical correlation analysis. Bae (Bae et al., 2020) investigated the effect of coefficient of friction on the contact stress of spur gears through finite elements and found that the effect of coefficient of friction on the contact stress of spur gears is reflected in the initial phase of meshing. Liu (Liu et al., 2019) provided the feasibility to study the effect of coefficient of friction on the contact stress of gears by investigating gear surface coating technology to reduce the gear surface coefficient of friction of gear surface.
Hertz stress theory is the most commonly used method to solve contact stress. The traditional Hertz stress contact theory based on Hertz stress cannot be solved for Hertz stresses considering the coefficient of friction. However, the method of finite element simulation can be used to calculate the contact stress of gears with different coefficient of friction. Engineering practice has shown that the advent of coating technology has led to a remarkable improvement in gear surface properties (Karimpour et al., 2010; Zang et al., 2020a; Zang et al., 2020b), resulting in a decrease in the maximum contact stress on the tooth surface and contributing to an increase in gear life. The current research on gear surfaces is focused on the study of statics and dynamics (Seok-Chul et al., 2013; Wu et al., 2013; Barbieri et al., 2014; Qin and Guan, 2014; Zhan et al., 2015). The overall research object is spur gears, and research on helical gears is scarce. The hydrostatic analysis mainly compares the influence of materials, coefficient of friction, mesh properties, modelling methods and fit tolerances on gear contact stresses (Deters and Proksch, 2005; Wang et al., 2011). The kinetic analysis mainly considers the effect of single gears throughout the operating cycle in the above parameters on gear contact stress, only a few scholars have studied the complete meshing line contact stress variation, and most studies have no experimental verification of simulation results (Faydor et al., 2000; Feng et al., 2004; Li and Li, 2007; Pedrero et al., 2010).
A dynamics simulation study of the complete gear meshing line is conducted in this paper with helical gears as the research object. The effect of coefficient of friction on the contact stress of the gear is analysed and compared by refinement study of the meshing line. The main influence points of the coefficient of friction are examined by comparing the results with the kinetic simulation of the complete gear, and the reasons for their generation are explained. In addition, the influence of the coefficient of friction on the meshing position is analysed by studying the variation of contact stresses at various points at different meshing lines for different tooth surfaces. Moreover, the gear contact fatigue test further shows that the contact fatigue life of the gear can be effectively improved by preparing an anti-friction coating on the gear surface.
2 Theoretical calculation
Contact stress is the pressure formed at the contact position when two contact surfaces squeeze each other. Contact pressure is important for the analysis and study of the gear pitting phenomenon (Refaat and Meguid, 1995).
2.1 Numerical calculation of contact stresses in helical gears based on hertz contact theory
The Hertz contact theory model is shown in Figure 1. The contact surface will be deformed elastically when the cylinder is loaded with the applied load p, producing a strip region of length L and width 2 b, with the maximum pressure in the middle of the contact surface. Hertz theory indicates the maximum contact stress in the region, as shown in Eq. 1.
where L is the length of the contact line, p is the load, b is the contact half-width and the calculation formula is shown in Eq. 2.
where
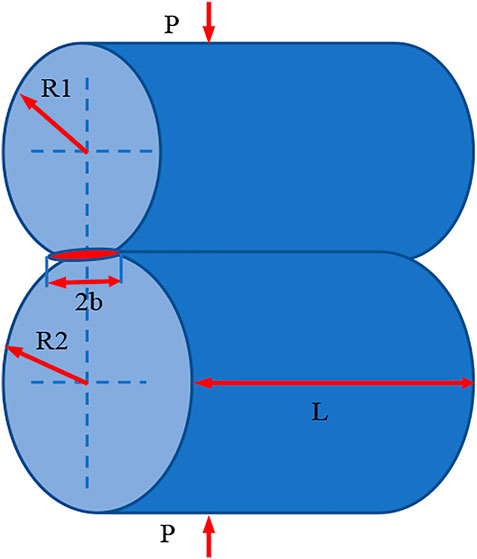
FIGURE 1. Hertzian stress schematic.
The stress calculation of helical gear is shown in Eq. 3 (Chen and He, 2019).
where
Hertz contact stress theory is applied to the above transmission gear for Hertz stress calibration, and Eq. 3 is compiled as shown in Eq. 4.
2.2 Gear contact model
When the two contacting objects, namely
where
The velocity and acceleration of the system will be zero when the system is in static condition. Therefore, the system equation is shown in Eq. 6.
2.3 Contact stress analysis
The force analysis of the gears is shown in Figure 2. The force analysis when the gears are in the initial stage of meshing and out of meshing is respectively shown in Figures 2A,B.
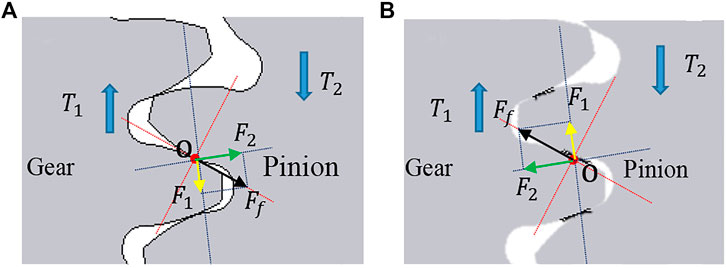
FIGURE 2. Force analysis. (A) Early engagement and (B) Late engagement.
Figure 2A shows that the friction torque direction is the same as the contact stress generating torque direction when the gears start to mesh, and the input torque must be increased to ensure normal operation. The friction torque increases with the friction force, which eventually leads to an increase in the contact stress. Figure 2B shows that the direction of frictional torque is opposite to that of torque generated by contact stress, and the input torque must be reduced to ensure normal operation. The frictional torque increases with the frictional force, which eventually leads to a decrease in contact stress. The analytical equation is shown in Eq. 7.
where
3 Finite element analysis of gear pairs
3.1 Helical gear modelling
This paper takes the first gear of new energy vehicle transmission as the research object and analyses the dynamic changes in contact stress during the gear transmission. The gear parameters are shown in Table 1.
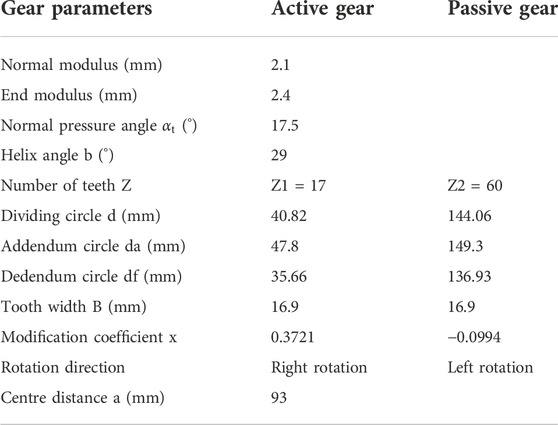
TABLE 1. Gear parameters.
The model in Figure 3 is modeled by gear modeling software and established according to the above gear parameters. Gear modeling software can accurately find the position of the lowest point of gear contact and the highest point of gear contact.
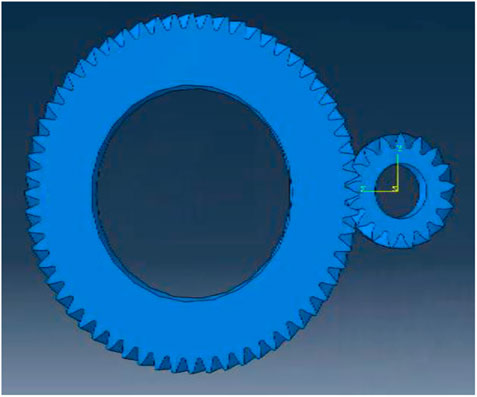
FIGURE 3. Gear model diagram.
3.2 Acquisition of coefficient of friction
The coefficient of friction of the sample was obtained through tribological tests by processing the same substrate material to obtain samples with different coefficients of friction (COF). The tribological test was conducted by SRV-IV multifunctional tribological wear tester, and the measurement results are shown in Figure 4.
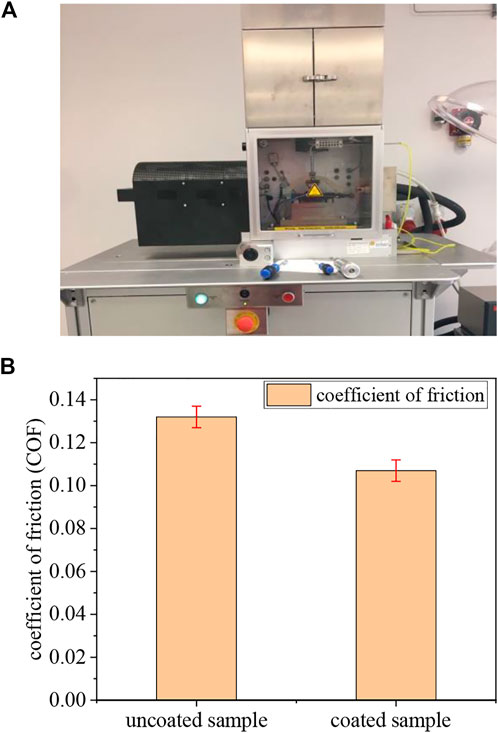
FIGURE 4. Coefficient of friction measurement results. (A) SRV test bench. (B) Test result.
Figure 4 shows that the sliding coefficient of friction of the uncoated sample is 0.132, and the coefficient of friction of the coated sample is 0.107. The type of coating is Mn3(PO4) 3, And the thickness of the coated sample is 12
The gear operation mode is rolling plus sliding, and the sliding coefficient of friction is the maximum coefficient of friction. Therefore, instead of the rolling coefficient of friction, using the sliding coefficient of friction can qualitatively illustrate the influence of the coefficient of friction on the gear contact stress.
3.3 Material properties
The gear base material is 20MnCrS5, and the material parameters are shown in Table 2.
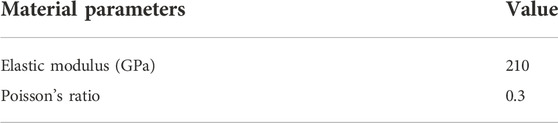
TABLE 2. Gear material parameters.
3.4 Contact stress simulation based on finite element method
The specific simulation process of the finite element method is shown below.
1) Definition of model material properties
New material property information is created in the finite element software with material property parameters as shown in Table 2.
2) Establishment of analytical steps and interactions
The analysis step plays a crucial role in the calculation of the model and the solution method. The solution method of the analysis step is chosen in this paper as “dynamic, implicit,” the simulation time is 0.0015 s and the maximum number of incremental steps is 200. The output is selected as the contact stress, and the output set is created for each of the three contact surfaces. The output sets are defined as tooth 1, tooth 2 and tooth 3, as shown in Figure 5.
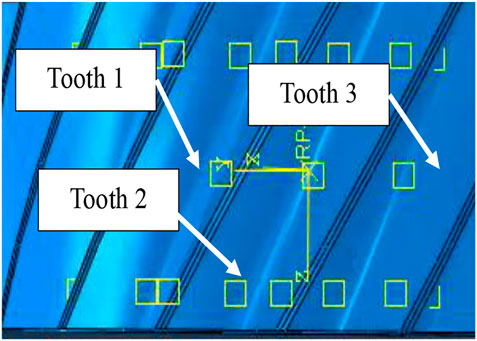
FIGURE 5. Definition of gear tooth surface.
Contact in interaction is defined as surface-to-surface contact, and the slip equation is finite. The coefficient of friction of the contact surface is set to a constant value, and different coefficients of friction are set to solve for the contact stress.
3) Setting of loads
The load setting is mainly for rotational speed and load. The driving wheel sets the rotational speed, the driven wheel sets the load, and the master and driven wheel are set to have only the degrees of freedom to turn along the Z-axis. In order to study the influence of friction factors on the contact stress of gears at low and high speeds, the contact stresses of gears at two speeds are solved respectively. In order to qualitatively analyze the influence of friction factor on the contact stress of gears, the contact stress of gears with different friction factors is solved in this paper. The setting parameters are shown in Table 3.
4) Mesh division
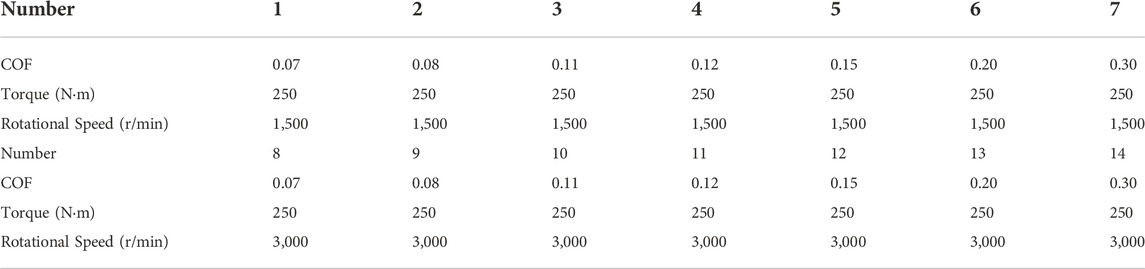
TABLE 3. Simulation parameters.
The gear mesh is selected as a tetrahedral mesh, which is combined with the surface mesh refinement to ensure the accuracy of the calculation. The total number of elements is 145,540. As shown in Figure 6.
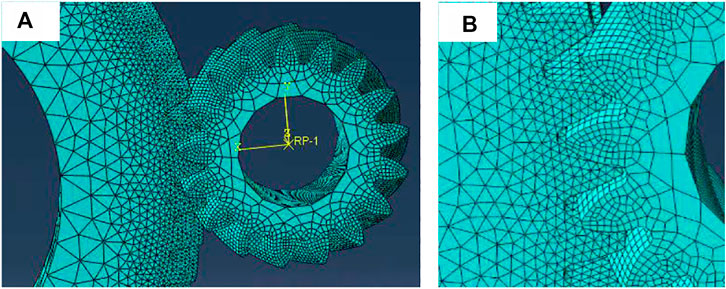
FIGURE 6. Gear meshing results. (A) results at the gear mesh and (B) partially enlarged results.
4 Results and discussion
4.1 Numerical calculation results of helical gear hertzian stress
Equations 3 and 4 are programmed to give the numerical results shown in Table 4.
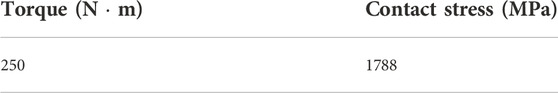
TABLE 4. Numerical simulation results.
Hertzian stress contact theory is inapplicable to the calculation of contact stress considering coefficient of friction. Therefore, the stresses must be solved by the finite element method when calculating the contact stresses of gears containing coefficient of friction.
4.2 Finite element method calculation results
The finite element software comes with a module to calculate contact stress, and its output is CPRESS. The calculation principle is based on the contact displacement and stiffness between the contact surfaces to calculate the stress, and the contact type has hard contact and contact based on the Coulomb friction principle. Compared with the Hertzian stress calibration, this method can consider the coefficient of friction between the contact surfaces and the variation of the contact surface shape, therefore, the calculation results are close to the actual contact stress (Wang et al., 2018).
The above simulation results are organised and analysed separately to examine the change in maximum contact stress at each tooth surface under different setting parameters and the change in stress value at the same node under different parameters.
4.2.1 Contact stress analysis under different coefficients of friction
In order to clearly study the influence of coefficient of friction on contact stress of tooth surface, several groups of simulation of the influence of coefficient of friction on contact stress are added on the basis of Figure 4. The simulation results of tooth 1, 2 and 3 are shown in Figure 7.
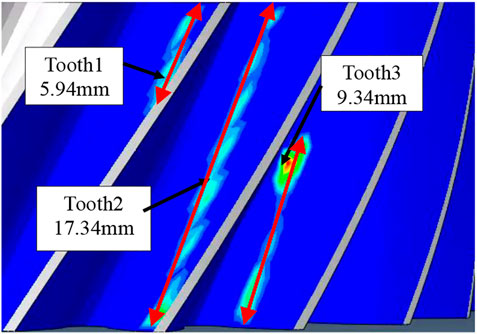
FIGURE 7. Finite element simulation results.
The simulation test data of simulation groups 1–7 were processed, and the results are shown in Figure 8. Figure 8A–C show the stress variation curves of meshing tooth 1, 2 and 3 at different coefficients of friction with gear turning angle. Figure 8 reveals that the meshing stress at the three meshing line positions of tooth 1, 2 and 3 increase first and then decrease, which is consistent with the gear meshing mechanism. The meshing lines at the top of the tooth, the pitch circle and the root of the tooth are influenced by the coefficient of friction, and an intersection point (enlarged position in the figure) is observed. The contact stress increases with the coefficient of friction from the beginning of engagement to the parting point, but the increase is minimal. The contact stress is minimal with the increase in the coefficient of friction and the decrease is large from the critical to the termination point of engagement.
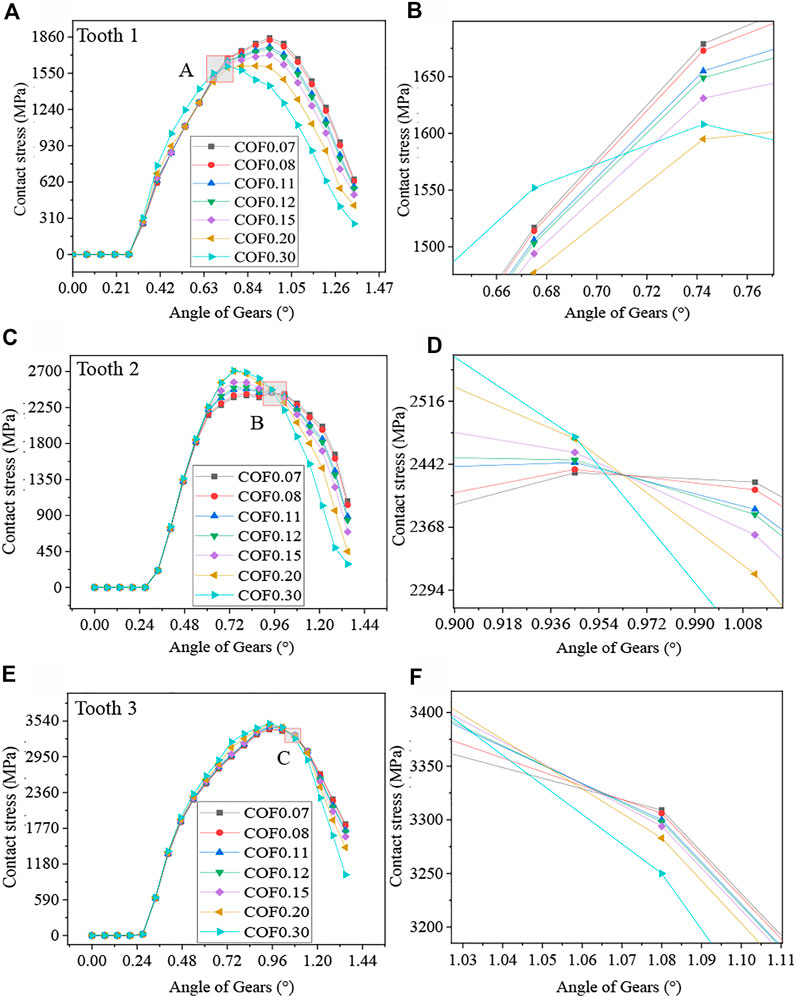
FIGURE 8. RPM 1500 SIMULATION results. (A) Contact stress of tooth 1, (B) Partial enlarged view of point A, (C) Contact stress of tooth 2, (D) Partial enlarged view of point B, (E) Contact stress of tooth 3, (F) Partial enlarged view of point C.
The data from groups 8–14 are organised to study the completeness of the simulation, and Figure 9 shows the complete change curve of the gear from meshing in to meshing out at different positions.
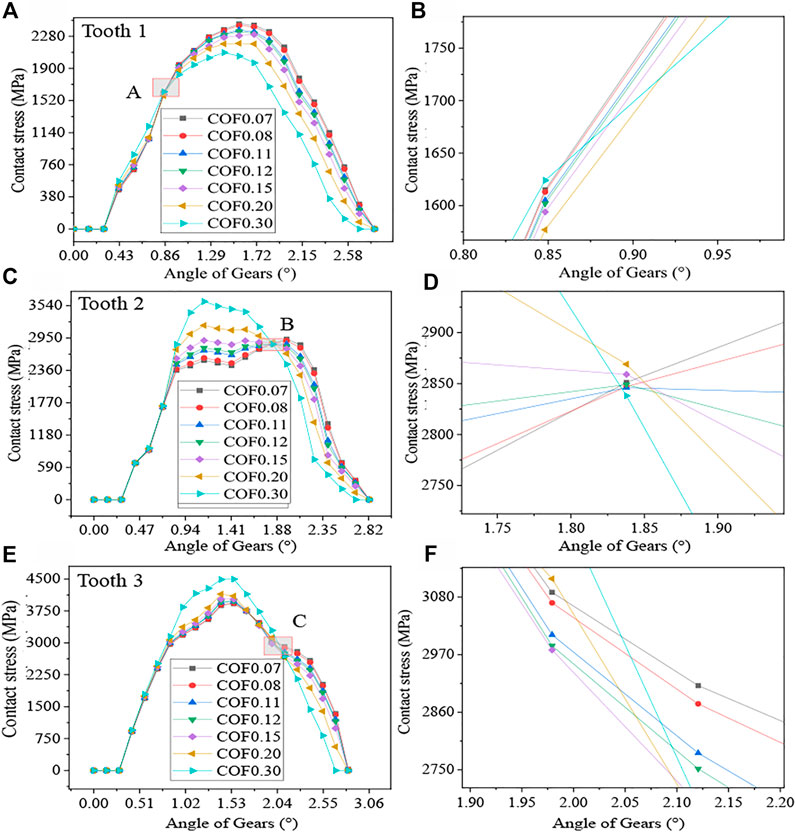
FIGURE 9. RPM 3000 simulation results. (A) Contact stress of tooth 1, (B) Partial enlarged view of point A, (C) Contact stress of tooth 2, (D) Partial enlarged view of point B, (E) Contact stress of tooth 3, (F) Partial enlarged view of point C.
Figure 9 shows that in the process of gear from meshing in to meshing out, the gear contact stress change process is asymmetric, and tooth contact stress first increases and then decreases. The comparison of the correlation between contact stress and coefficient of friction reveals the presence of a certain angle (curve intersection). When the angle is less than the intersection, the contact stress increases with the coefficient of friction, when the angle is larger than the intersection, the contact stress decreases with the increase in the coefficient of friction. The intersection point of the three meshing lines is at a different position. This phenomenon is due to the increase in tangential displacement when the friction becomes large and the need to increase gear turning angle when the same meshing position is reached. The critical point phenomenon is generated with the same results as the analysis in Article 2.2, verifying the accuracy of the simulation.
Reference (Bae et al., 2020) studied the effect of coefficient of friction on gear contact stress when spur gears were meshed in different positions and found an increase in contact stress with the coefficient of friction during gear meshing. The contact stress decreases as the coefficient of friction increases upon completion of gear meshing, and a cut-off point is available for meshing in and out. The research method is a static study. This paper uses the dynamics simulation method to study the dynamic change of contact stress in helical gears, which has approximate findings with the Reference (Bae et al., 2020). Moreover, the step value of simulation in this paper is small, and the analysis of the dynamic change in contact stress when the meshing line is generated to the end is important to study the meshing process.
Figure 10A shows the average contact stress variation curves for the three contact lines at different engagement positions with the coefficient of friction. Figure 10B shows the curve of the maximum contact stress variation at the same cell node for each tooth face in the simulation cycle.
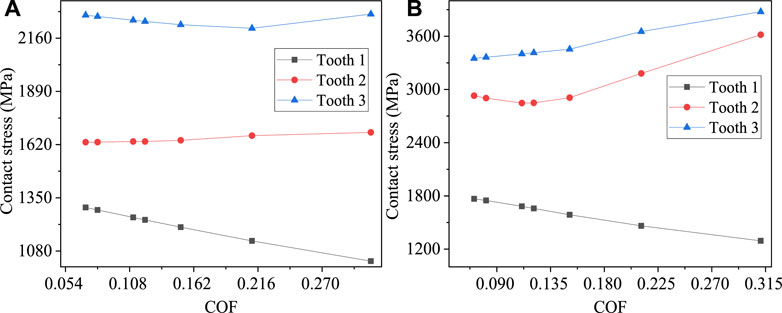
FIGURE 10. Contact stress analysis curve. (A) Average contact stress and (B) Maximum contact stress.
Figure 10A shows the average contact stress change curve during the entire meshing process of tooth 1, 2 and 3. The contact stress of the meshing line at tooth surface 1 decreases with the increase in the coefficient of friction, and the average contact stress of the contact line at tooth 2 and 3 (the position of the contact line is the middle and lower side) shows an increasing trend in the large coefficient of friction as a whole. However, the increased effect is not evident possibly due to the increase in the coefficient of friction, resulting in the rising tangential displacement and changing meshing position.
Figure 10B shows the variation of the maximum contact stress at the fixed nodes at tooth 1, 2 and 3 throughout the meshing cycle. The contact stress at the meshing line at tooth 1 decreases with the increasing coefficient of friction, and the average contact stress at the contact line at tooth 2 and 3 when the position of the contact line is the middle and lower side increases with the coefficient of friction. This phenomenon has the same variation law as Figure 10A.
The calculated results of the average contact stress at the engagement line 2 are the same as those based on the Hertzian stress calibration, further proving the accuracy of the simulation results. The above analysis reveals that the average and maximum contact stress respectively show nonlinear and approximately linear variations with the coefficient of friction at the top and root of the tooth.
4.2.2 Contact stress analysis on the engagement line
The contact stresses at the meshing line were discretised to analyse the contact stress variation in the tooth width direction. The meshing lines at tooth 2 and 3 were separately analysed to examine the stress changes at the moment of 5.25E-5s for different coefficients of friction, and the discrete way is shown in Figure 11.
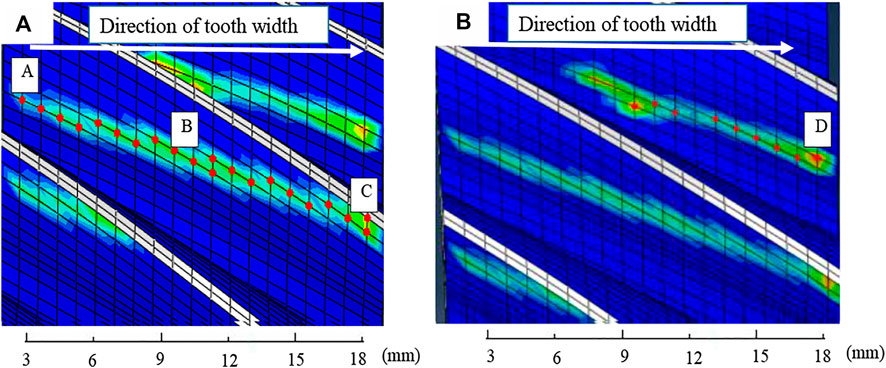
FIGURE 11. Schematic of the local points on the engagement line. (A) Contact stress of tooth 2 and (B) Contact stress of tooth 3.
The contact stresses at the discrete points are collated, and the effect of the coefficient of friction on the contact stresses is analysed for the same moment when the engagement line is at different positions. The contact stresses at Figure 11A are shown in Figure 12A and those at Figure 11B are shown in Figure 12B.
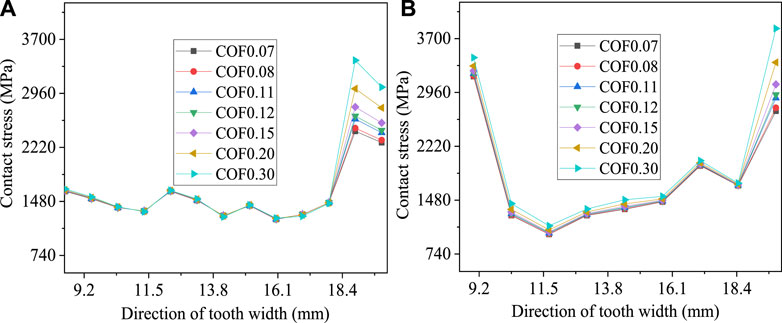
FIGURE 12. Contact stress diagram for contact points.
Ideally, the contact stress curve of the tooth meshing line is a uniform straight line, and the same meshing line at the top of the tooth root stress size is equal. The movement of the gear at the upper side of the pitch circle, pitch circle and lower side of the pitch circle is different due to friction. The movement at the pitch circle is pure rolling, and the movement at the upper and lower parts of the pitch circle is rolling plus sliding operation. Therefore, the coefficient of friction has an effect on the contact stress at the tooth top and root. The stress values at Points A, B, C and D are selected in Figure 11 for comparison, and the comparison results are shown in Figure 13.
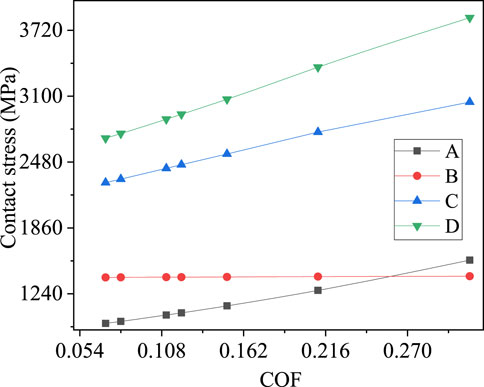
FIGURE 13. Contact stress curve at points (A), (B), (C), and (D).
Figure 13 shows that the line of engagement where point A is located runs through the pitch circle and is located on the lower side of the index circle, and the gear contact stress increases with the coefficient of friction. The meshing line where point B is located runs through the pitch circle and is located near the indexing circle. The gear contact stress does not change significantly as the coefficient of friction increases. The line of engagement where point C is located runs through the pitch circle and lies on the upper side of the index circle, and the gear contact stress increases with the coefficient of friction. The meshing line where point D is located is near the tooth root, and the gear contact stress increases with the coefficient of friction.
The analysis reveals that the degree of influence of the coefficient of friction on the contact stress is D > C > A > B, and the degree of sensitivity is A > D > C > B, as shown in Table 5.
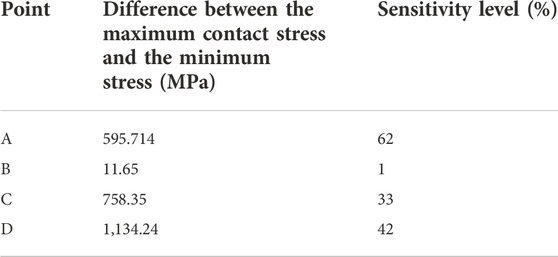
TABLE 5. Rate of increase of contact stress at ABCD.
Reference (Zang et al., 2020a) showed that the reduction in the coefficient of friction can effectively improve the lubrication performance. Therefore, the fatigue life of the gear at a low coefficient of friction will increase. The maximum contact stress in the simulation results decreases with the coefficient of friction, and fatigue life indicates the reduction in maximum contact stress and the increase in gear life. Therefore, the accuracy of the simulation results is verified.
The study of spur gears in the top of the tooth, nodal circle and tooth root contact stress variation in reference [30] has the same research objectives as the nodal contact stress variation at different locations selected in this paper. The current research results are the same as the research findings in reference (Li and Li, 2007).
4.3 Contact fatigue test of helical gears
4.3.1 Test method
A solid lubricant coating was prepared on the surface of helical gears to further demonstrate the effect of the coefficient of friction on the contact fatigue life of gears and reduce the tooth coefficient of friction. A fatigue test study of coated and uncoated gears was also conducted using a gear contact fatigue tester.
Taking the above gear as the research object, the contact fatigue test of the gear was carried out on the gear dynamic cycle test bench. As the gear is the first gear of the transmission, it often operates at 2,500 r/min. Therefore, the test speed is set at 2,500 r/min and the test load is 250 Nm to simulate the operation of the gear under actual working conditions. The condition of the tooth surface was observed every 4 hours during the test until the occurrence of the pitting phenomenon (pitting area larger than 4%). Two pairs of gears with different coefficients of friction were tested for pitting, and Table 6 shows the operating conditions. Two tests were conducted under each working condition.
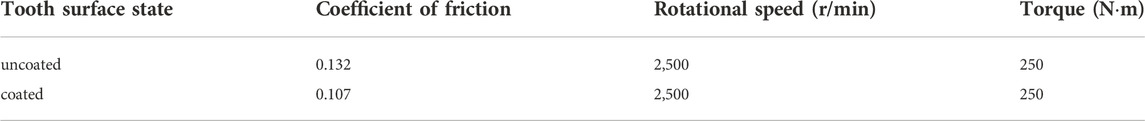
TABLE 6. Table of gear operating conditions.
4.3.2 Test results
The test in this paper is the contact fatigue test of gears, that is, to study the fatigue life of different friction factors. Therefore, when a single tooth surface fails, the test can be stopped.
The gears were tested for pitting under the above conditions, and the test results are shown in Figure 14. The fatigue life histogram is presented in Figure 15.
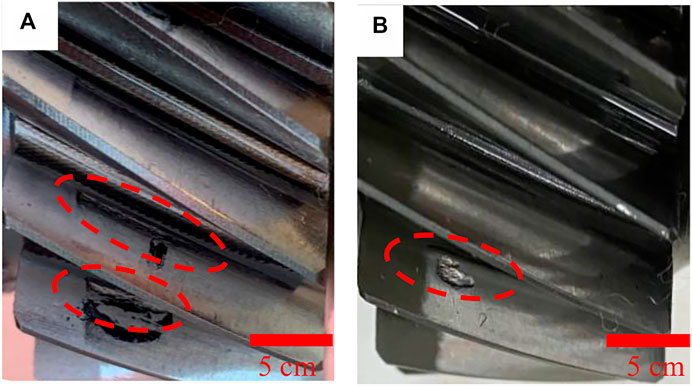
FIGURE 14. Gear after test. (A) Uncoated sample and (B) Coated sample.
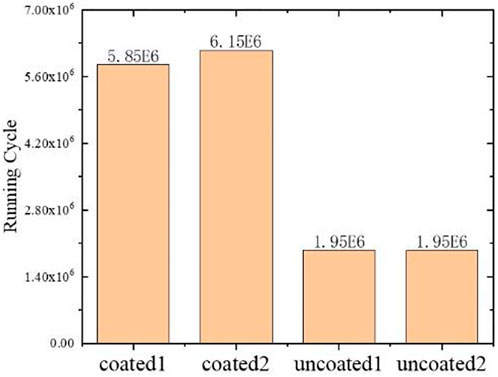
FIGURE 15. Histogram of gear fatigue life.
Figure 14 reveals that the change in the coefficient of friction has minimal effect on the location of the maximum contact stress point. The maximum contact stress point occurs at the lower position of the gear pitch line near the tooth root, which is the same location as the maximum stress point in the simulation results. This finding further indicates the accuracy of the simulation results.
Figure 15 shows that the fatigue life of coated gears is 3.15 times larger than that of uncoated gears. This indicates that the maximum contact stress of the gear decreases to some extent when the coefficient of friction is reduced, which leads to an increase in the gear running period. The test results are consistent with the simulation results, further verifying the accuracy of the model.
After the gear is coated, the friction coefficient of the gear surface is greatly reduced, and the contact fatigue life of the gear is improved. The research results are of great significance for improving the life of gear transmission. In addition, the research on the micro morphology of the coating tooth surface should be further deepened.
5 Conclusion
The effect of the coefficient of friction on the gear contact stress is investigated by performing finite element simulation analysis of the gear contact model for the entire meshing cycle. The accuracy of the model is verified by calibrating the gear pair with Hertzian theory. The conclusions are summarised as follows.
1) The contact stress increases and then decreases from the generation to the disappearance of the engagement line when the coefficient of friction is the same, thus becoming an asymmetric distribution. The contact stress changes significantly with the occurrence of the engagement line.
2) A dividing point is found in the process of meshing line generation. The coefficient of friction and the maximum contact stress increase when the meshing position is before the dividing point. By contrast, the coefficient of friction increases and the contact stress decreases when the engagement position is after the demarcation point, the decrease is fast, showing a nonlinear change. The dividing point of the three engagement line positions of the tooth surfaces is at different corners due to the increase in the coefficient of friction, resulting in the change in the tangential displacement.
3) The contact stresses at different locations on the same meshing line are different, and the point with the largest stress variation is located at the tooth root. The point with the largest sensitivity to stress values is located at the longest engagement line near the tooth root.
4) The preparation of friction-reducing coating on the gear surface can decrease the coefficient of friction. The gear fatigue test revealed that the location of fatigue pitting on the tooth surface is the same as that of the simulated maximum stress point, and the coated gear has high fatigue life.
Data availability statement
The raw data supporting the conclusions of this article will be made available by the authors, without undue reservation.
Author contributions
XY, SY, YC, YZ, SZ, and YW contributed to conception and design of the study. YC set the overall research goals and objectives. XY, SY, YZ, and SZ designed the methodology, created the models and performed the analysis. All authors contributed to manuscript revision, read, and approved the submitted version.
Funding
This study was funded by the Project of China North Industries Group Corporation Limited (5K19F048).
Conflict of interest
The authors declare that the research was conducted in the absence of any commercial or financial relationships that could be construed as a potential conflict of interest.
Publisher’s note
All claims expressed in this article are solely those of the authors and do not necessarily represent those of their affiliated organizations, or those of the publisher, the editors and the reviewers. Any product that may be evaluated in this article, or claim that may be made by its manufacturer, is not guaranteed or endorsed by the publisher.
References
Bae, S. M., Seo, K. J., and Kim, D. E. (2020). Effect of friction on the contact stress of a coated polymer gear. Friction 8, 1169–1177. doi:10.1007/s40544-020-0363-6
Barbieri, M., Zippo, A., and Pellicano, F. (2014). Adaptive grid-size finite element modeling of helical gear pairs. Mech. Mach. Theory 82, 17–32. doi:10.1016/j.mechmachtheory.2014.07.009
Chen, H., and He, J. Y. (2019). Nonlinear analysis of gear dynamic meshing based on ABAQUS. Agric. Equip. Veh. Eng. 57 (05), 87–89.
Chen, Y. C., and Tsay, C. B. (2002). Stress analysis of a helical gear set with localized bearing contact. Finite Elem. Anal. Des. 38, 707–723. doi:10.1016/s0168-874x(01)00100-7
Deters, L., and Proksch, M. (2005). Friction and wear testing of rail and wheel material. Wear 258, 981–991. doi:10.1016/j.wear.2004.03.045
Faydor, L. L., Lian, Q. M., and Alexander, L. K. (2000). Asymmetric modified spur gear drives: Reduction of noise, localization of contact, simulation of meshing and stress analysis. Comput. Methods Appl. Mech. Eng. 188, 363–390. doi:10.1016/s0045-7825(99)00161-9
Feng, S. W., Zhang, S. L., and Zhang, T. (2004). Contact line length and contact ratio coefficient of cylindrical gears. J. Chang'an Univ. Nat. Sci. Ed. 02, 101–103.
Karimpour, M., Dearn, K. D., and Walton, D. (2010). A kinematic analysis of meshing polymer gear teeth. Proc. Institution Mech. Eng. Part L J. Mater. Des. Appl. 224, 101–115. doi:10.1243/14644207jmda315
Li, H., and Li, R. F. (2007). Experimental study on superficial coat of gears of nitrided 32Cr2MoV coated with tin film by multi-arc ion plating. Chin. J. Mech. Eng. 04, 52–56. doi:10.3901/cjme.2007.04.052
Li, W., Zhai, P., Tian, J., and Luo, B. (2018). Thermal analysis of helical gear transmission system considering machining and installation error. Int. J. Mech. Sci. 149, 1–17. doi:10.1016/j.ijmecsci.2018.09.036
Litvin, F. L., Fuentes, A., Gonzalez-Perez, I., Carvenali, L., Kawasaki, K., and Handschuh, R. F. (2002). Modified involute helical gears: Computerized design, simulation of meshing and stress analysis. Comput. Methods Appl. Mech. Eng. 129, 3619–3655. doi:10.1016/s0045-7825(03)00367-0
Liu, H. J., Liu, H. L., Zhu, C. C., Wei, P. T., and Tang, J. Y. (2019). Tribological behavior of coated spur gear pairs with tooth surface roughness. Friction 7, 117–128. doi:10.1007/s40544-017-0193-3
Pedrero, J. I., Pleguezuelos, M., Artés, M., and Antona, J. A. (2010). Load distribution model along the line of contact for involute external gears. Mech. Mach. Theory 45, 780–794. doi:10.1016/j.mechmachtheory.2009.12.009
Qin, W. J., and Guan, C. Y. (2014). An investigation of contact stresses and crack initiation in spur gears based on finite element dynamics analysis. Int. J. Mech. Sci. 83, 96–103. doi:10.1016/j.ijmecsci.2014.03.035
Raynald, G., and Sébastien, L. (2019). A stochastic prediction of roughness evolution in dynamic contact modelling applied to gear mild wear and contact fatigue. Tribol. Int. 140, 105854. doi:10.1016/j.triboint.2019.105854
Refaat, M. H., and Meguid, S. A. (1995). On the contact stress analysis of spur gears using variational inequalities. Comput. Struct. 57, 871–882. doi:10.1016/0045-7949(95)00080-z
Santosh, S., PatilSaravanan, K., Ivana, A., and Azmi, A. W. (2014). Contact stress analysis of helical gear pairs, including frictional coefficients. Int. J. Mech. Sci. 85, 205–211. doi:10.1016/j.ijmecsci.2014.05.013
Seok-Chul, H., Jin-Hwan, L., Dong-Hyung, L., Seung-Ho, H., and Kwon-Hee, L. (2013). Contact stress analysis for a pair of mating gears. Math. Comput. Model. 57, 40–49. doi:10.1016/j.mcm.2011.06.055
Wang, B., Qin, L., Ren, M., and Sun, H. (2018 Effects of combination of anti-CTLA-4 and anti-PD-1 on gastric cancer cells proliferation, apoptosis and metastasis Cell. Physiol. biochem. 37, 260–270. doi:10.1159/000492876
Wang, W. J., Guo, J., and Liu, Q. Y. (2011). Effect of contact stress on rolling friction and wear behavior of wheel-rail materials. Tribology 31, 352–356.
Wu, S. S., Xu, S. L., Lin, Y. T., Chen, W. H., and Lai, Y. L. (2013). 3D contact analysis of conjugate spur gears by a complete mating process. J. Mech. Sci. Technol. 27, 3787–3795. doi:10.1007/s12206-013-0923-z
Yang, D., Tang, J. Y., Zhou, W., and Wen, Y. Q. (2020). Correlation between surface roughness parameters and contact stress of gear. Proc. Inst. Mech. Eng. Part J.-J. Eng. Tribol. 208-210, 1994–1996.
Zang, L. B., Chen, Y., Wu, Y. M., Liu, H. B., and Ran, L. X. (2020). Tribological performance of Mn3(PO4)2 coating and PC/MoS2 coating in Rolling–Sliding and pure sliding contacts with gear oil – ScienceDirect. Tribol. Int. 153.
Zang, L. B., Chen, Y., Wu, Y. M., Zheng, Y., Chen, H., You, D. L., et al. (2020). Comparative tribological and friction behaviors of oil-lubricated manganese phosphate conversion coatings with different crystal sizes on AISI 52100 steel. Wear 203427, 203427–203459. doi:10.1016/j.wear.2020.203427
Zhan, J., Fard, M., and Jazar, R. (2015). A quasi-static FEM for estimating gear load capacity. Measurement 75, 40–49. doi:10.1016/j.measurement.2015.07.036
Zhang, B., Liu, H., Zhu, C., and Li, Z. (2019). Numerical simulation of competing mechanism between pitting and micro-pitting of a wind turbine gear considering surface roughness. Eng. Fail. Anal. 104, 1–12. doi:10.1016/j.engfailanal.2019.05.016
Zhang, Q., Wen, G., Liang, S., Tong, Q., Hou, L., and Yang, G. (2020). Prediction mathematic model and influencing factors of contact stress of cylindrical gear with arc tooth. Complexity 2020, 1–15. doi:10.1155/2020/8888407
Zhou, W. H., Tang, J. Y., Chen, H. F., and Shao, W. (2019). A comprehensive investigation of surface generation and material removal characteristics in ultrasonic vibration assisted grinding. Int. J. Mech. Sci. 156, 14–30. doi:10.1016/j.ijmecsci.2019.03.026
Keywords: coefficient of friction, contact stress, fatigue analysis, gear transmission, helical gear
Citation: Yang X, Yin S, Chen Y, Zhang Y, Zhang S and Wu Y (2022) Numerical and experimental research of helical gear contact stress considering the influence of friction. Front. Mech. Eng 8:1078134. doi: 10.3389/fmech.2022.1078134
Received: 24 October 2022; Accepted: 01 November 2022;
Published: 20 December 2022.
Edited by:
Debiao Meng, University of Electronic Science and Technology of China, ChinaReviewed by:
Hui Ma, Harbin Engineering University, ChinaShiyuan Yang, University of Electronic Science and Technology of China, China
Copyright © 2022 Yang, Yin, Chen, Zhang, Zhang and Wu. This is an open-access article distributed under the terms of the Creative Commons Attribution License (CC BY). The use, distribution or reproduction in other forums is permitted, provided the original author(s) and the copyright owner(s) are credited and that the original publication in this journal is cited, in accordance with accepted academic practice. No use, distribution or reproduction is permitted which does not comply with these terms.
*Correspondence: Yong Chen, Y2hlbnlvbmcxNTg1ODExQDE2My5jb20=; Shuang Zhang, emhhbmdzaHVhbmcyMDFzdW9AMTYzLmNvbQ==