 Helen M. Saville1
 Daniel Howard2,3
 Cédric Ghevaert2,3
 Serena M. Best4
 Ruth E. Cameron4James M. Oliver1
 Sarah L. Waters1*
- 1Mathematical Institute, University of Oxford, Oxford, United Kingdom
- 2Department of Haematology, University of Cambridge, Cambridge, United Kingdom
- 3Cambridge Stem Cell Institute, Jeffrey Cheah Biomedical Centre, Cambridge Biomedical Campus, Cambridge, United Kingdom
- 4Department of Materials Science and Metallurgy, University of Cambridge, Cambridge, United Kingdom
As blood donor numbers decrease, while demand for platelets increases, hospitals worldwide are becoming increasingly vulnerable to critical platelet shortages. Alternative methods of supplying platelets are therefore required. One approach is to engineer platelets in vitro in a bioreactor. To characterise such a system, we develop a mathematical model of a novel platelet bioreactor described in Shepherd et al. (Biomaterials, 2018, 182, 135–144). The bioreactor consists of upper and lower tube systems, with a cell-seeded porous collagen scaffold situated between them. Flow through the system is driven by gravity, and controlled by valves on each of the inlets and outlets. The bioreactor is long relative to its width, a feature which we exploit to derive a lubrication reduction of the Navier-Stokes equations for flow in the tube systems, coupled to Darcy flow through the porous scaffold. Flow in the tube systems and scaffold are coupled to form a network model for the bioreactor flow. We characterise the effect of geometrical parameters and valve configuration and synchronisation, on the fluxes through the bioreactor and shear stress experienced by cells in the scaffold. The simplicity of the model means that parameter sweeps take only seconds or minutes to perform, making the model a convenient tool for future bioreactor design optimisation.
1 Introduction
In vitro bioreactor systems can be used to grow biological cells and tissues in cell culture medium. They are developed with the aim of engineering cell products of sufficient quantity and quality to replace organs, tissues, and blood products sourced from donors (Bardsley et al., 2017). When cell products are engineered using cells derived from the patient, the potential negative impacts of the immunological response can be avoided (Ng et al., 2017).
To engineer functional cell products, bioreactors enable precise control of the operating conditions, with the aim of mimicking in vivo conditions within the bioreactor. Bioreactors can control the flux of cell culture medium into the system, delivering nutrients to the cells, whilst transporting away waste products. In addition to exploiting fluid flow to enhance mass transport by advection, overcoming diffusive transport limitations, fluid flow can provide mechanical cues to cells via, for example, pressure and shear stress (Sladkova and De Peppo, 2014; Selden and Fuller, 2018). Bioreactors that exploit fluid-enhanced mass transport and fluid-induced stress include stirred-tank [e.g., Galban and Locke (1999); Sucosky et al. (2004)], rotating wall [e.g., Freed and Vunjak-Novakovic (1995); Pollack et al. (2000)], and perfusion [e.g., Carrier et al. (2002); Thon et al. (2014)] bioreactors. In bioreactor systems, cells are often seeded on substrates designed to enhance cell and tissue growth. The substrate often takes the form of a biocompatible porous scaffold (Burova et al., 2019). The scaffold geometry and its material properties can be designed to further control the local mechanical and biochemical environment experienced by the cells.
Our focus here is on the fluid dynamics of a bioreactor system used to harvest platelets from megakaryocytes seeded onto a biomaterial scaffold, as an alternative to platelets obtained from donors. Platelet transfusions are often used during surgical procedures, as well as for patients with haematological diseases or undergoing chemotherapy or stem cell treatment for cancer (Cameron et al., 2007; Charlton et al., 2014). Platelets must be stored at 18°C to preserve their functionality outside the body. However, this temperature is not sufficiently low to prevent contamination by bacteria, and the shelf life of platelets obtained from donors is limited to 5–7 days (Hess, 2010). As a result, hospitals commonly experience platelet shortages, especially during public holidays, major weather disasters, or pandemics (Dolgin, 2017). Additionally, donor-derived platelets often have high immunogenicity, and in vitro methods of platelet production may be able to produce platelets with lower immunogenicity Suzuki et al. (2020). These factors motivate the need for in vitro production of platelets within bioreactor systems.
In vivo, at the point of platelet production, megakaryocytes migrate to sit in the vascular niche, exterior to vascular sinusoids in the bone marrow (Machlus and Italiano, 2013; Machlus et al., 2014), separated from the fluid flow by the endothelial wall (see Figure 1). In this position, megakaryocytes form pseudopodia, called proplatelets, which protrude through the vessel wall, and use an extensive membrane reservoir to elongate into the bloodstream. Both platelets and proplatelets have been observed to be released into the bloodstream, where they further fragment into platelets, as shown in Figure 1 (Junt et al., 2007). This is considered to be the dominant proposed mode of platelet production, though alternative sites and modes of platelet production have been observed: whole megakaryocytes or fragments of megakaryocytes have been found to produce platelet-like structures while circulating in the bloodstream (Behnke and Forer, 1998); megakaryocytes have been observed to travel to the lungs, where they lodge in capillary beds and produce platelets (Lefrançais et al., 2017); and platelet release has been observed to occur via megakaryocytes undergoing cytoplasmic rupture, in response to inflammatory stimuli (Nishimura et al., 2015).
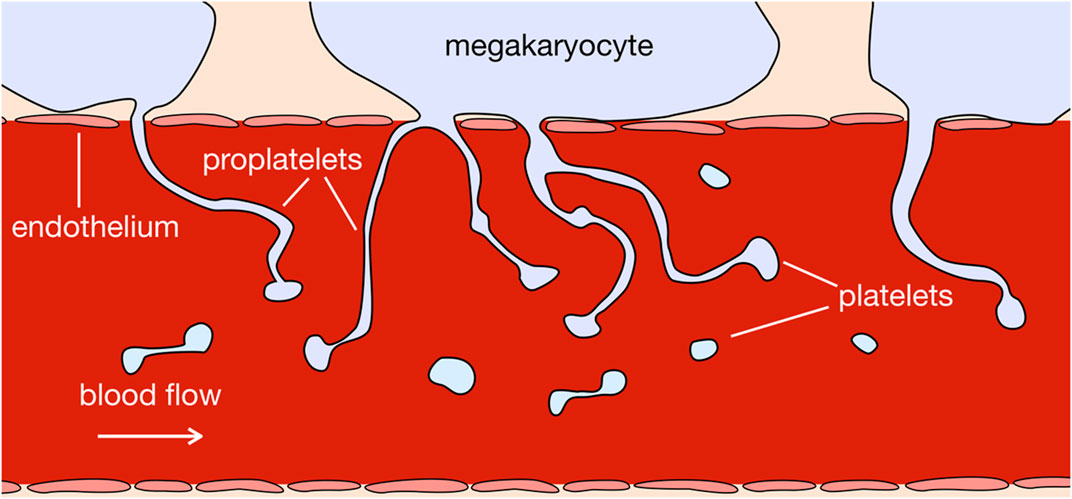
FIGURE 1. In vivo, megakaryocytes sit exterior to bone marrow sinusoids. They extend proplatelets into the sinusoid flow, which exerts a shear stress on proplatelets, aiding their release into the blood stream and further fragmentation into platelets.
In both the processes of proplatelet elongation and platelet production, fluid shear stress is important and the focus of ongoing experimental research. For example, it has been shown in vitro (Bender et al., 2015) that proplatelet elongation occurs at 30 μm/min under a flow rate of 12.5 μl/h, but only 0.85 μm/min in static culture Patel et al. (2005). In vitro experiments have also shown that exposing megakaryocytes to shear flow results in quicker platelet production and higher platelet yields per megakaryocyte as compared to static culture (Dunois-Lardé et al., 2009; Bender et al., 2015). A shear rate of 1800 s−1 triggers 30%—45% of megakaryocytes to produce platelets in 20 min in the rectangular perfusion chamber of (Dunois-Lardé et al., 2009), whereas in the absence of shear a maximum of 25% of megakaryocytes produce platelets in 24–72 h (Balduini et al., 2008).
To mimic the local mechanical environment of megakaryocytes in vivo, platelet bioreactors often seed megakaryocytes on biomaterial substrates which facilitate the elongation of proplatelets into an adjoining pore or channel. Once the proplatelets have fragmented into platelets, they are collected in solution at the bioreactor outlet. Balduini et al. (2008) (Pallotta et al., 2011; Di Buduo et al., 2015) seed megakaryocytes into a porous silk scaffold, surrounding a single biocompatible silk microtube, representing a blood vessel. Thon et al. (2014) situate megakaryocytes along a perforated barrier, to achieve a production rate of approximately 30 functionally viable platelets per megakaryocyte. The perforated barrier emulates the endothelium, through which proplatelets extend into a channel, which mimics the role of blood vessels. Though relatively high when compared to other in vitro studies, the platelet production rate achieved by Thon et al. (2014) is still much lower than the 104 platelets produced by a single megakaryocyte over the few hours of its platelet-producing lifespan in vivo (Kaufman et al., 1965; Machlus and Italiano, 2013).
Bioreactors for platelets are relatively novel in that their product are delicate cells that are washed out of the system, rather than a tissue growing on a construct. The critical challenges in the operation of platelet bioreactors are to control flow to ensure the megakaryocytes experience a sufficient level of shear stress, while keeping the product concentration as high as possible, so as to minimise the amount of expensive post-procedure concentration of suspended platelets that has to occur. Additionally, excessive back-flow in the direction of outlet to inlet should be avoided, to reduce the risk of transporting cells into the wrong parts of the bioreactor.
Our focus is an in vitro bioreactor design by Shepherd et al. (2018) for platelet production. The bioreactor has wide potential applications as a model for the bone marrow microenvironment, useful not only for in vitro production of blood cells, but also for studying the role of microenvironment parameters in the differentiation and renewal of stem cells, and for investigating disease mechanisms for haematopoeitic disorders (Bourgine et al., 2018).
The bioreactor has a collagen scaffold with graduated porosity, to retain the megakaryocyte cells [16.4 − 22.4 μm in diameter (Sola-Visner et al., 2007)] for continual platelet production, and allow the smaller platelets [1.6 − 3.9 μm in diameter (Noris et al., 2014)] to exit the scaffold once they have broken off from megakaryocytes (Shepherd et al., 2018). Flow is driven by gravity and controlled by valves near the inlets and outlets of the bioreactor, which are all closed to the atmosphere. Damage, activation, and aggregation of platelets is minimised by the passive nature of gravity-driven flow, with a lack of contact between platelets and mechanical pumping devices (Shepherd et al., 2018). Given this bioreactor setup, the question is how to control and synchronise the opening and closing of the values to ensure the megakaryocytes are exposed to sufficient levels of fluid shear stress while minimising excessive dilution of the collected cell product.
To address this question, we employ mathematical modelling. For examples, of mathematical and computational modelling of bioreactors, see Burova et al. (2019), O’Dea et al. (2012), and references therein. Theoretical models provide insights into the characteristics of bioreactor systems that are quicker and cheaper to obtain than performing numerous, time-consuming experiments. Once calibrated, the theoretical models can be validated via detailed comparison of the theoretical model predictions with experimental data, and used to inform bioreactor operating conditions.
The bioreactor system is characterised by disparate lengthscales enabling the identification of small parameters, e.g., the ratio of tube diameter to length. While the presence of small parameters makes a purely computational approach to solving the full system to governing equations challenging, they can be exploited in a systematic asymptotic analysis to derive simpler reduced models that retain the key physical mechanisms while being tractable and amenable to numerical methods. The primary aim of this work is to use such a reduced mathematical modelling approach to determine valve dynamics that address the challenges mentioned above. The mathematical model presented in this paper may also be viewed as a framework for any bioreactor build from long thin tubes, porous scaffolds, and pinch valves; thus may readily be adapted to similar bioreactors, such as those used by Jaasma et al. (2008), Brown et al. (2008) and McCulloch et al. (2004).
We use the Navier-Stokes equations and Darcy’s law, which have both been widely used in bioreactor modelling, see, for example, (Sucosky et al., 2004; Shipley et al., 2010). The bioreactor features flow in tubes with prescribed wall motion. Analytical studies of the Navier-Stokes equations in tubes with prescribed wall motion have previously been conducted in the regime of high-frequency, small-amplitude, long-wavelength motion (Secomb, 1978; Waters and Guiot, 2001; Heil and Waters, 2006; O’Dea and Waters, 2006; Whittaker et al., 2010) and large-amplitude, small-frequency long-wavelength motion (O’Dea and Waters, 2006); as well as for forced peristaltic walls, in the regime of small amplitude oscillations (Fung and Yih, 1968), and of long wavelengths with small Reynolds number (Manton, 1975), leading to lubrication equations.
Darcy’s law is appropriate for a rigid scaffold in which the pores are connected, and therefore good for a simplest-first modelling approach. To couple flow in the channels and scaffold, appropriate interface conditions must be specified at the interface. We impose continuity of normal stress, normal flux, and the Beavers-Joseph slip condition. This last condition relates the shear stress of the channel flow to the discontinuity in slip velocities of the two regions, through a slip coefficient that depends on the geometric properties of the interface and the permeability of the scaffold. Since its initial empirical justification, this condition has been analytically justified for laminar flow in a channel, which is close to our physical set-up (Saffman, 1971).
The paper is structured as follows. We first detail the geometry and operation of the bioreactor in Section 2.1. A discussion of the modelling approach is provided in Section 2.2.1, before stating, reducing, and solving the model in Section 2.2.3, 2.2.4. In Section 3 we investigate the effect of valve dynamics, bioreactor length, and scaffold permeability on the scaffold shear stress and bioreactor fluxes. We conclude with a discussion on applications of the work in Section 4.
2 Methods
2.1 Bioreactor Design and Operation
A schematic of the perfusion bioreactor setup is shown in Figure 2. The megakaryocytes are seeded in a porous collagen scaffold, inside a cuboid chamber that is sandwiched between two channels, with identical rectangular cross-sections. Fluid flows into each channel from a reservoir of cell culture media, and out of each channel into a reservoir, controlled in each case by a sequence of valve tubing, valves, and resistor tubing. Fluid can also flow freely between the channels and the scaffold. The pressure head due to gravity drives fluid into the channels: differences in pressure in the channels can result in flow through the scaffold. The porous collagen scaffold has two layers, each of which is fairly homogeneous and highly interconnected. As described in Shepherd et al. (2018), the upper layer has a higher average pore size and porosity than the lower layer, so that the megakaryocytes are trapped in the upper layer, while the smaller platelets that are produced are able to move through both layers, with the aim of them being flushed through the system and collected at the lower channel outlet.
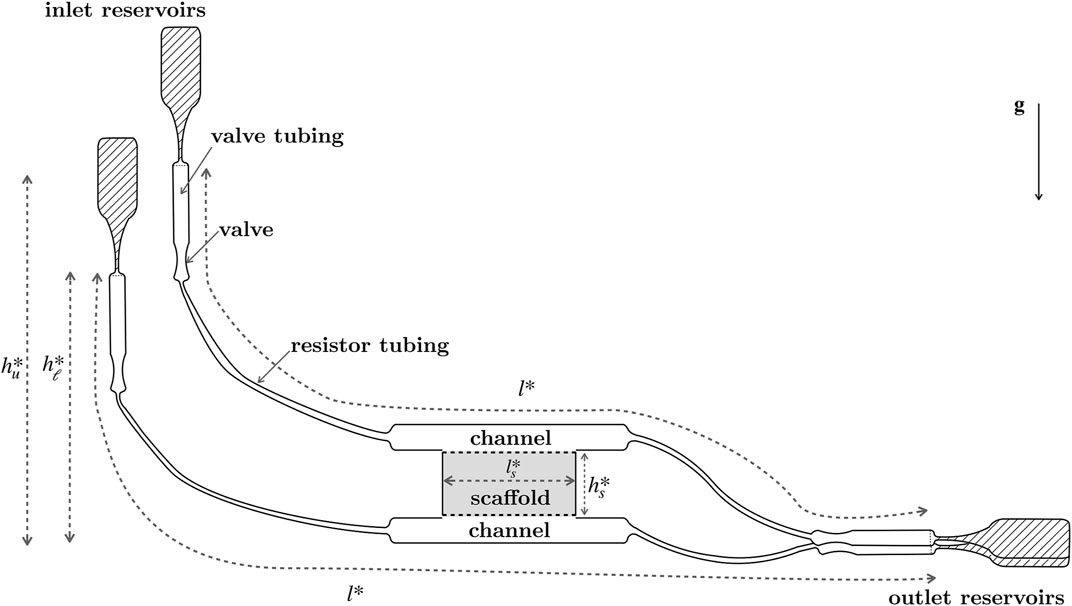
FIGURE 2. Schematic of the valve-controlled, gravity driven platelet bioreactor designed by Shepherd et al. (2018), showing the inlet and outlet reservoirs, joined by valve tubing, valves, resistor tubing, channels, and a collagen scaffold. Megakaryocytes sit in the collagen scaffold and produce platelets, which are washed out into the lower outlet reservoir. The upper and lower tubing systems have equal axial lengthscales, l*; the heights of the inlet reservoirs above the base of the bioreactor are
Throughout the bioreactor, materials with low platelet reactivity are used to reduce occurrence of platelets being preemptively activated: polycarbonate for the channel and scaffold walls, and medical grade polyvinyl chloride for the tubing.
To seed the bioreactor scaffold with megakaryocytes, Shepherd et al. (2018) deliver 400, 000 megakaryocytes suspended in 5 ml of culture media over a 5 min period, with the suspension entering the system through the (fully open) upper valve tubing, driven by gravity. Three doses of 5 ml of culture media are then passed through the system to remove unbound cells. After seeding, the bioreactor is in operation for the next 20 h. Each valve opens and shuts periodically to control the fluid flow. The valves are open for approximately one in every 20 s, and the opening and closing of valves occurs over tens of milliseconds. The four valves have staggered timings, rather than opening and closing in unison, so as to reduce the chance of air bubbles forming.
2.2 Model
2.2.1 Overview of Modelling Approach
We model the cell culture media as a Newtonian viscous fluid, with viscosity μ and density ρ. We neglect the effect of cells and scaffold deformation, and assume that the scaffold is a homogeneous rigid porous material. We note that the analysis may be readily extended to include two or more distinct porous layers. The heights of the inlet reservoirs, as well as the valve configurations can be varied to control fluid flow through the bioreactor system. Throughout this paper we use tube system to mean the combined channel, resistor tubing, valve and valve tubing. Flow is governed by the incompressible Navier-Stokes equations in the upper and lower tube systems, and by Darcy’s law in the scaffold. We impose no-slip and no-flux conditions on the impermeable rigid boundaries of the channels, tubes and valves. To model valves opening and closing, we prescribe time-dependent wall geometry. At the channel-scaffold interface we impose continuity of normal flux, continuity of normal stress, and the Beavers-Joseph slip condition (Beavers and Joseph, 1967).
In this paper, we present a simple model that captures the flow in the numerous different regions of the bioreactor system. In particular, we assume that the aspect ratio and flow rate are everywhere small enough that we can adopt the lubrication approximation, and thus we neglect inertia in the system. We note that for junctions in which there are sharp changes in cross-sectional area, the lubrication approximation breaks down. However, as discussed at the end of Section 2.2.4, we can systematically justify imposing continuity of flux and pressure conditions at these junctions.
2.2.2 Geometry
The (equal) centreline arclengths of the upper and lower tube systems are denoted l*. The upper and lower tube systems are labelled by i = u, ℓ respectively, throughout the following. We denote by
The upper and lower tube systems have four regions differing in their cross section, shown in Figure 3: channels, with fixed, rectangular cross-sections of width 2c* and height
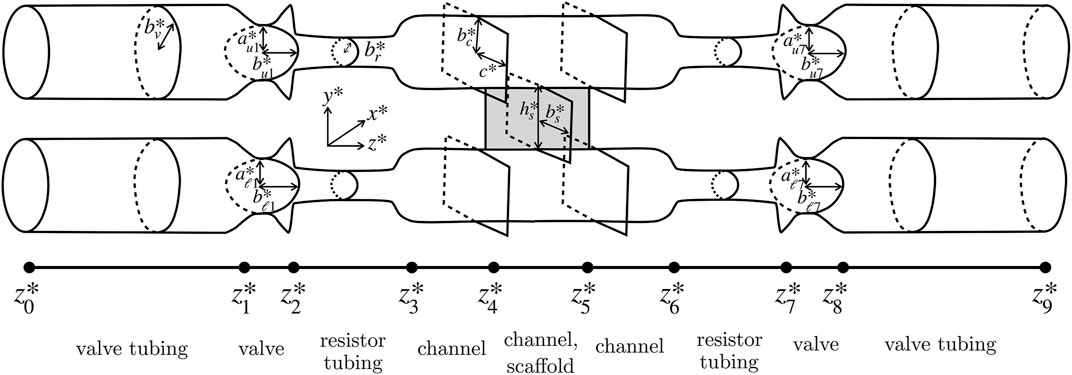
FIGURE 3. Simplified modelling domain, showing cross-sectional shapes of each of the valve tubing, valve, resistor tubing, channel, and scaffold regions.
We denote by
The elliptical cross-sections of the valves have semi-major axes
if the valve is moving between being closed and open, with period T for one full opening and closing cycle. The small parameter δ controls how completely the valve can close. (For numerical convenience, the valves are prevented from closing completely.) Note that as the exact functional form of the time dependency in (2) is unknown, for modelling purposes we have chosen an illustrative cosine form for simplicity. The valve is most heavily constricted at its centre, where
The velocities of the walls in the bioreactor are
The scaffold has centreline arclength,
The cross-sections of the upper tube system, lower tube system, and scaffold are labelled as Ωu, Ωℓ and Ωs, respectively, with boundaries ∂Ωu, ∂Ωℓ, ∂Ωs, and interfaces Γi = ∂Ωi ∩ ∂Ωs between scaffold and channel cross-sections.
Typical values for
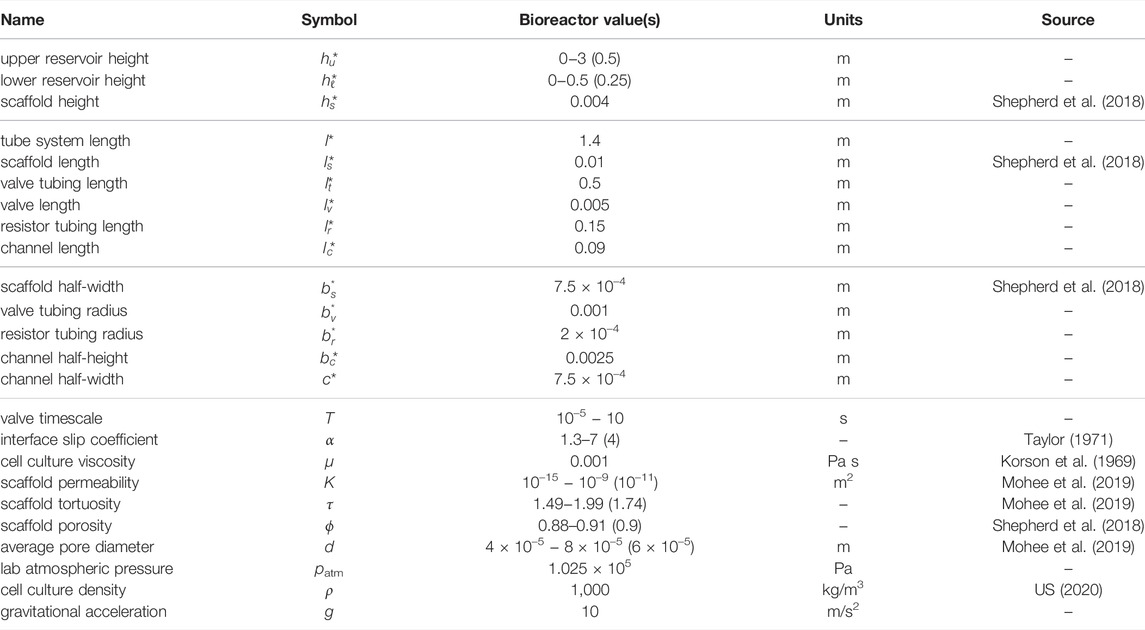
TABLE 1. Model parameters, chosen to mimic the bioreactor of Shepherd et al. (2018). Where a range is give, values or ranges in brackets have been used in simulations. The values without a citation are reported here for the first time.
2.2.3 Governing Equations, Boundary Conditions, and Interface Conditions
We consider flow of a viscous Newtonian fluid of viscosity μ and density ρ. Neglecting the effects of curvature, as the ratio of transverse lengthscale to radius of curvature of the tube centreline is small, the flow in the upper and lower tube systems,
and the flow in the scaffold,
Here,
At the solid walls of the tube systems we impose the usual no-slip and no-flux conditions given by
We prescribe normal stress and no tangential velocity at the inlet and outlet of the upper and lower tube systems, viz.
where t is any tangent to the cross-section,
At the interfaces Γu and Γℓ between scaffold and channels, we prescribe continuity of normal flux, continuity of normal stress, and the Beavers-Joseph-Saffman condition:
where α is the Beaver-Joseph slip coefficient, and t is any tangent to the interface. The system is closed by imposing the initial fluid velocities
2.2.4 Non-Dimensionalisation and Model Reduction
We exploit the slender geometry of the bioreactor to derive systematically a reduced model, where we consider the lubrication regime in which the aspect ratio and reduced Reynolds number are small in each tubing section. For the purposes of non-dimensionalisation, we introduce the aspect ratio
The reduced pressures are non-dimensionalised with respect to the pressure head across the upper tube system. We choose the velocity scaling U to reflect a balance between viscous dissipation and the axial pressure gradient, so that
The governing Eq. 4 and boundary conditions (7) and (Section 2.2.3) in the scaffold are non-dimensionalised using the following scalings
The scale for the reduced pressure is the same as in the tube systems, motivated by the continuity of stress condition (8b) at the interfaces Γu,ℓ. Darcy’s law (4) sets the cross-sectional velocity scaling as
In addition to ϵ and the various dimensionless lengths in the bioreactor (see Tables 2, 3 for lists of dimensionless lengths and coordinates, respectively), the resulting dimensionless governing equations are characterised by the dimensionless parameters
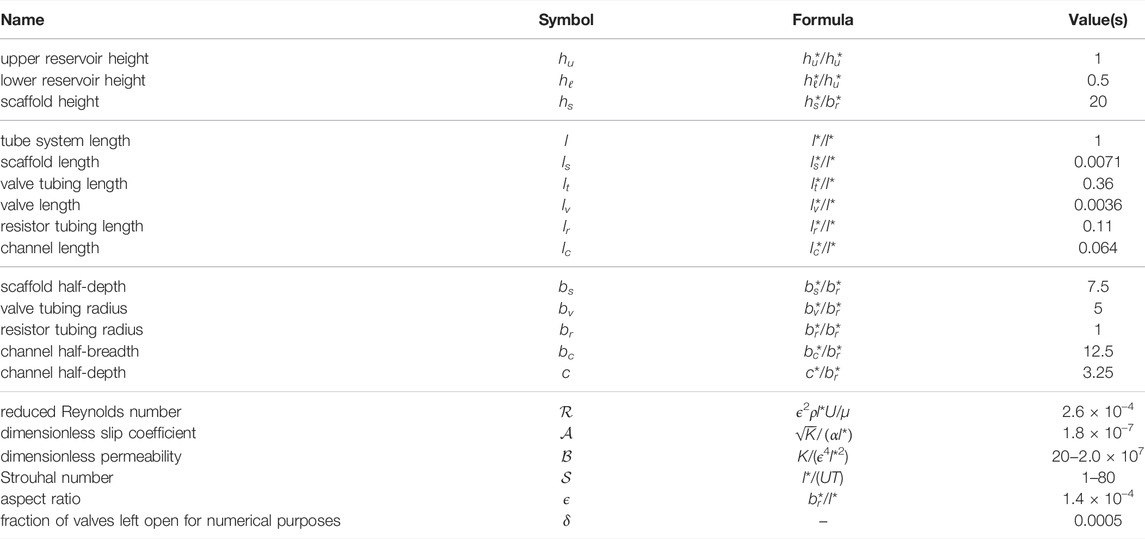
TABLE 2. Dimensionless parameters corresponding to the bioreactor geometry of Shepherd et al. (2018), given to 2 s.f.

TABLE 3. Dimensionless coordinates, separating valve tubing, valve, resistor tubing, channel, and scaffold regions, computed from dimensional values are
The reduced Reynolds number,
We work in the physically relevant regime in which the reduced Reynolds number
We reduce the system to a network of pressure—cross-sectional area—flux relations at leading order as follows. Integrating the continuity Eq. 3 over the cross-sections Ωi, imposing the kinematic boundary conditions (5) and the interface flux condition (8a), and using Reynold’s transport theorem, we find that the relationship between the axial flux and cross-sectional areas in the upper and lower tube systems is given, for 0 < z < 1, by
Here, the cross-sectional area, axial flux and net flux out of the adjoining scaffold are given by
with ∂/∂n being the derivative in the direction of the outward unit normal to the scaffold cross-section, so that positive Ji indicates flux from the scaffold into the tube system.
The pressure-flux relations in the upper and lower tube systems are determined as follows. The transverse components of the momentum Eq. 3 imply that the leading-order pressure in both tube systems is independent of the transverse coordinates x and y.
To determine Qi we must solve the leading-order axial momentum Eq. 3, which is given by
We solve (16) subject to no slip on the impermeable walls of the tube systems. We impose the leading-order version of the Beavers-Joseph slip condition (8c) at the scaffold-channel interface when
Substitution of Darcy’s law into the continuity equation in (4) and retaining leading order terms gives at leading order Laplace’s equation in the scaffold cross-section, namely
We solve (18) subject to the leading-order versions of the boundary conditions of 1) continuity of normal stress at the scaffold-channel interfaces (8b), and 2) no flux at the impermeable walls of the scaffold, which are given by
We solve Poisson’s Eq. 16 subject to the no-slip condition (17) to determine wi in terms of the pressure gradient, and use (15a) to obtain the following flux-pressure relation
where Ci are the tube system conductivities, determined by the various cross-sectional geometries, in the valve tubes, valves, resistor tubes, and channels, respectively:
where λn = (n + 1/2)π/bc, νm = (m + 1/2)π/c,
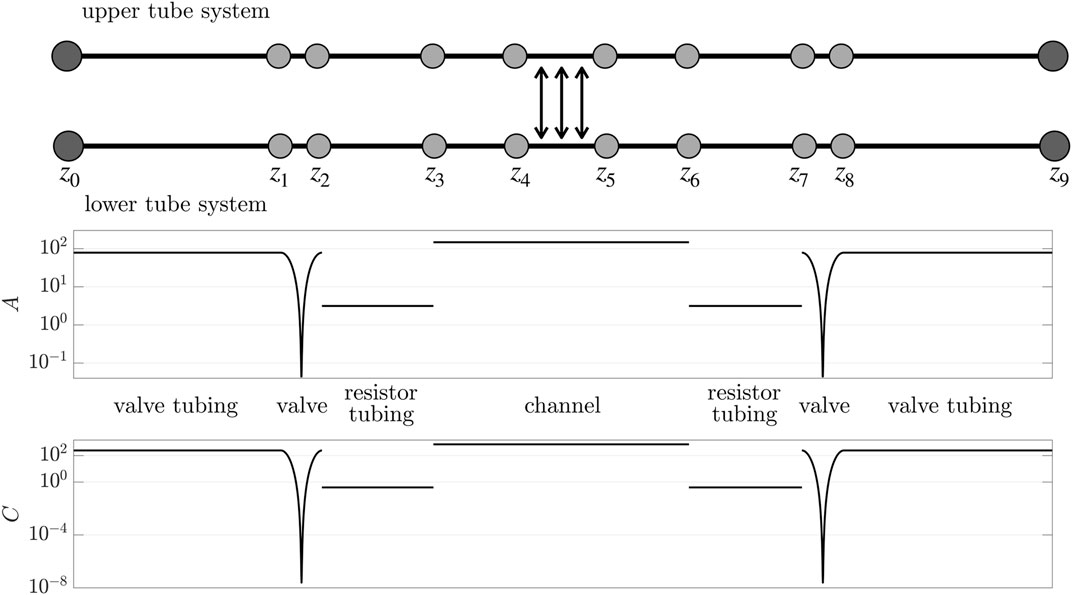
FIGURE 4. Network diagram of the reduced bioreactor system. At the edges we impose the reduced system (14) and (20) with (1), (21), (23), and (24). The edges are joined by continuity of flux and pressure (the light grey nodes). Pressure is prescribed at inlets and outlets (the dark grey nodes). The upper and lower tube systems are coupled due to the scaffold in z ∈ (z4, z5), see Eqs 14,23. Below are plots of the cross-sectional areas and conductivities of each region, where the valve regions are closed (z-axis not to scale). Parameters are in Table 2.
To determine the scaffold pressure, and hence the net flux out of the scaffold into the adjoining channel Ji, we solve (18) subject to (19). Since we have assumed that the scaffold cross section is a rectangular domain with Dirichlet and Neumann boundary conditions holding on horizontal and vertical sides respectively, the solution is simply
and hence
The dimensionless cross-sectional areas (1) in the channels, valve tubing, and resistor tubing are the same with stars dropped. The dimensionless cross-sectional area (2) of the moving valves is
The cross-sectional area along the centreline, when the valves are closed, is plotted in Figure 4.
To summarise, the pressure—cross-sectional area—flux relations are given by Eqs 14, 20, with tube conductivities (21), flux (23) from scaffold to channels, valve cross-sectional areas (24) and the dimensionless version of tube cross-sectional areas (1). This system of second-order linear differential equations is solved subject to the specification of inlet and outlet tube system pressures (Section 2.2.3), which in dimensionless form are
and continuity of pressures pi and fluxes Qi (i = u, ℓ) at the interfaces between the valves, resistor tubing and channels, as illustrated in Figure 4. When there is a jump discontinuity in the cross-sectional area, these conditions can be derived systematically using a matched asymptotic analysis, as follows. We rescale the governing Eq. 3 such that the axial and radial lengthscales are both
Using the parameters given in Table 1, the lower inlet pressure is hℓ = 0.5. Having computed the pressures in the tube systems, the flux through the scaffold can be computed from (23).
We analytically solve the system of second order differential equations for the velocities and pressures in each of the 18 regions, with each pair of velocities and pressures having two degrees of freedom. By imposing the conditions at the inlets, outlets, and junctions between regions, as described above, we obtain a system of 36 linear algebraic equations relating the 36 degrees of freedom. These are readily solved numerically in MATLAB using the backslash command.
2.3 Metrics
2.3.1 Shear Stress
Within the bioreactor, the aim is to ensure the MKs are subject to sufficient levels of shear stress to ensure effective platelet production, while the shear stress stays below the level at which platelet activation and aggregation occurs. Although the precise values of these bounds are unknown, in vivo the MKs and proplatelets in the bone marrow experience shear stress in the range 0.10−0.70 Pa (Pries et al., 1992; Mazo and von Andrian, 1999). These values provide motivation for desired levels of shear stress in vitro [although it has been shown that successful platelet production in vitro can occur at substantially higher shear rates (Dunois-Lardé et al., 2009)].
We estimate the shear stress distributions from predictions of the Darcy velocity through the porous scaffold following a model that has previously been used in the literature to relate flux to shear stress in porous scaffolds that are modelled using Darcy’s law Whittaker et al. (2009). In this model the pores are assumed to be cylindrical tubes and the geometry of the scaffold enters only via the average pore size and the scaffold tortuosity. The model does not account for scaffold deformability and elasticity, similarly to Darcy’s law.
We idealise the pores as cylinders of diameter d through which there is Poiseuille flow. Then the dimensional axial pore velocity is
We consider various norms of the stress as part of our analysis, and define the following shear stress metrics:
which are the average shear stress, taken over the length of the scaffold; the time-averaged shear stress over the interval t ∈ (0, T1) during which at least one valve is moving; and the maximum instantaneous shear stress, over the interval t ∈ (0, T1).
2.3.2 Fluxes
In addition to shear stress metrics, we also report the following fluxes:
which are the vertical flux through the scaffold, defined as positive when flow is from the upper to lower channels; the minimum instantaneous flux through the scaffold, over a period t ∈ (0, T1) during which valves are moving; the total flux through the scaffold, over a period t ∈ (0, T1); the axial fluxes halfway along each channel, and the flux out of the lower outlet. Dimensional versions of the above quantities are indicated with stars.
3 Results
The fluid flow generated within the bioreactor fulfils three functions: to provide the cross-flow through the scaffold that exerts shear stress on megakaryocytes; to wash platelets out of the system to be collected; and to supply nutrients to the scaffold and remove waste products. These three functions can be promoted by choosing which valves are open or shut. To understand how the valves influence each of these aspects, we first consider valves in different combinations of static configurations: fully open, partially open, or shut. For static valves, we first use the parameters of Shepherd et al. (2018) given in Table 1 for illustration, and then vary the bioreactor length and permeability to give a fuller characterisation of this class of bioreactor. Next we consider dynamic scenarios in which a single valve is periodically opened and shut, while the others remain static, before considering scenarios with multiple valves moving.
3.1 Static Valves
3.1.1 Shear Stress and Scaffold Flux
We compute the average scaffold shear stress, σ, and the scaffold flux,
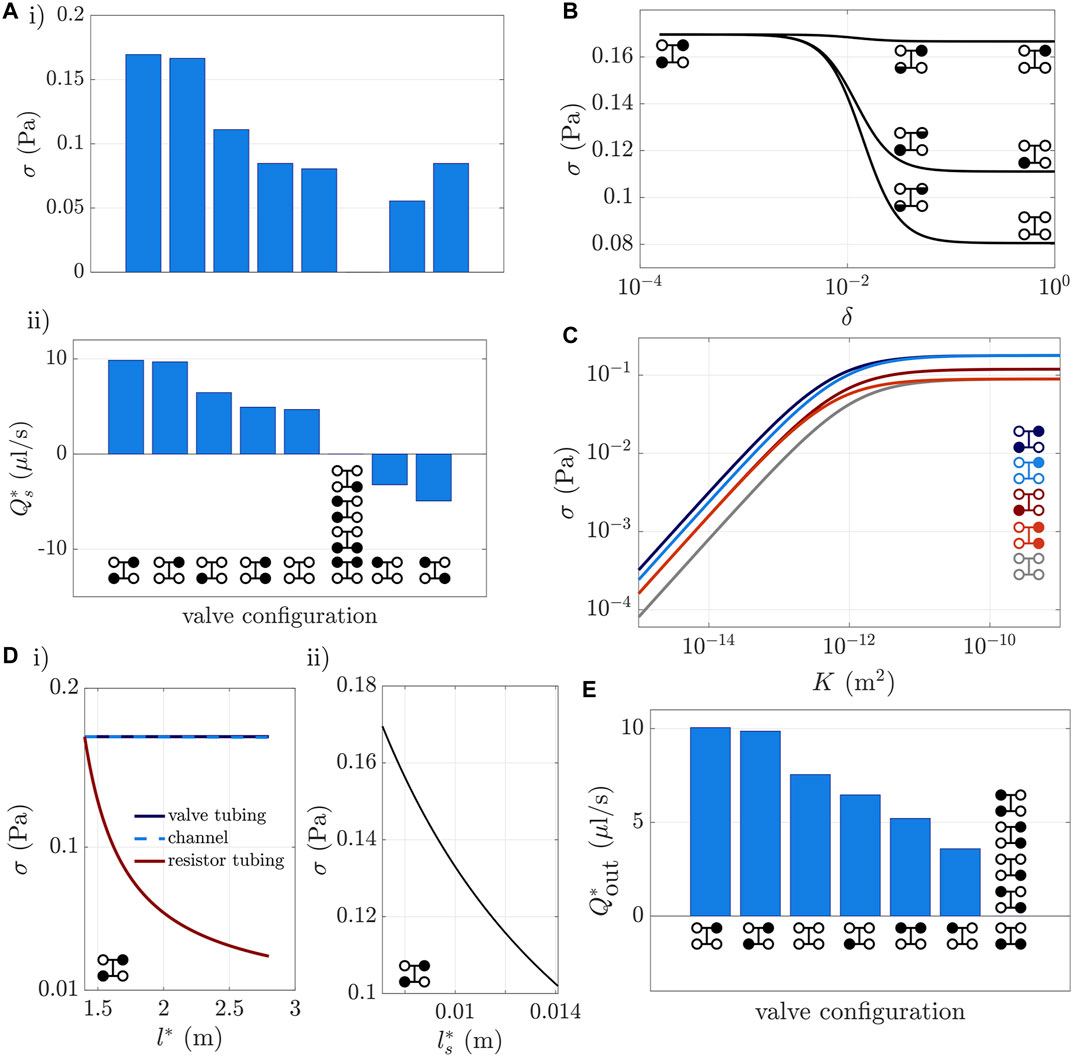
FIGURE 5. Trends in fluxes and shear stress for static valves. (Ai) Average scaffold shear stress and (Aii) scaffold flux under different static valve configurations with two, three, or four valves open. The diagram(s) under the bars in (Aii) show which valves are open (white) or closed (black). The sixth columns have
In Figure 5B we consider the shear-maximising configuration and explore how opening either one, or both, of the shut valves modulates the scaffold shear stress. Note that opening either one, or both, of the closed valves results in scenarios that have downward scaffold flux and open lower outlet valves, which we anticipate will promote platelet collection (see below). Recall that the degree of valve opening is controlled by the dimensionless parameter δ in (2), which varies between 10–4 (almost fully shut) and 1 (fully open). We see that either opening the upper outlet valve, or both the upper outlet and lower inlet valves, by as little as 3%, at δ = 0.03, reduces shear stress by 44% and 31%, respectively.
We compute the average shear stress σ as we vary the scaffold permeability, K, for all the valve configurations shown in Figures 5Aii that have positive scaffold flux. For all of these configurations, Figure 5D shows that increasing K from 10–15 m2 to 10–11 m2 increases the shear stress σ by approximately three orders of magnitude, but increasing K further has minimal effect on the shear stress, as the limiting factor is no longer permeability but boundary pressures and tube system geometry. Additionally, within the range of permeabilities K = 10–12 m2 to 10–9 m2 for the scaffold used by Shepherd et al. (2018) (see Mohee et al. ,2019), the shear stress for the two shear-maximising configurations fall within the physiological target range of 0.1–0.7 Pa, as shown by the dark and light blue lines in Figure 5D. In the bioreactor operation of Shepherd et al., the configurations with all valves open (grey line), and with all but the lower inlet valve open (dark red line) were used. Figure 5D shows that the latter of these reaches the target shear stress in the permeability range K = 10–11 m2 to K = 10–9 m2, but the former does not.
For scaffold permeabilities between 10–15 m2 and 10–12 m2, opening the lower inlet valve, in addition to the upper inlet and lower outlet valves, significantly decreases scaffold shear stress, as shown by the blue dashed line in Figure 5C being visibly lower than the dark blue line. This is because, for small enough scaffold permeabilities, flow in the lower tube system dominates flow through the scaffold, in that it substantially increases pressure in the lower tube, relative to its value when the lower inlet is closed. In contrast, for large scaffold permeabilities, opening the lower inlet valve barely increases the pressure in the lower tube system, thus the shear stress is only slightly less than when the lower inlet valve is closed.
The average scaffold shear stress is also affected by varying the tube system length l*. In Figure 5D, we plot the change in scaffold shear stress as we increase the overall tube length by lengthening each of the regions: valve tubing, channels, resistor tubing, and the scaffold with its adjoining channel regions. We only present results for the shear-maximising valve configuration depicted in the bottom left inset, as we obtain the same qualitative results as all the valve configurations shown in Figures 5Aii that have non-negligible scaffold flux (i.e., all but those in the sixth column). Varying l* by lengthening one particular region affects the model in three places. First, increasing l* acts to decrease velocities in the tube systems, reflected in the velocity scaling (10). Second, increasing l* increases the dimensionless permeability
Figure 5Di shows that doubling l* from 1.4 to 2.8 m by increasing either the valve tubing or channels reduces the scaffold shear stress by less than 1%. This is because the increase in axial length is approximately balanced out by the increase in proportion of relatively wide tubing in the tube systems, so that flow rates in the upper and lower channels change by less than 1%. Thus there is little change in the flux through the scaffold, so that the scaffold velocity, and therefore shear stress, are virtually unchanged. In contrast, increasing the resistor tubing from 1.4 to 2.8 m reduces the shear stress by 81%. This is because the axial lengthscale increases and the proportion of the system with relatively narrow tubing increases, so that the velocity in the upper channel decreases, as does the velocity in the scaffold.
Figure 5Dii shows that doubling the scaffold length (and also the section of channel adjoining the scaffold) reduces shear stress by 40%. The flow rates in the upper and lower channels change by less than 3%, as the increase in proportion of relatively wide tubing in the tube systems again approximately balances the increase in axial length. Thus the volume of media that passes from upper to lower channels at each instant in time stays roughly constant. As the length of the scaffold increases, the velocity in the scaffold therefore decreases, as does the shear stress.
3.1.2 Platelet Collection and Diffusive Nutrient Transport
After platelets break off from their parent cell, they should be washed out of the system quickly, so as to minimise risk of damage or activation. This requires sufficient flux down the scaffold and out of the lower outlet. In Figure 5E, we measure the flux
To allow diffusive nutrient transport, where there is a relatively high flux along the upper channel, while avoiding excessive collection volume at the lower outlet (i.e., dilute product), the configuration with the upper valves open and lower valves closed can be used. As seen in Figure 5E, there is no flow out of the lower outlet when the lower valves are closed. In this configuration advection in the upper tube system maintains the concentration at the inlet value throughout the upper tube system (at leading order in the high Peclet number limit), allowing diffusion across the scaffold (where there is no flow) to deliver the oxygen or nutrient to the cells, on a timescale much longer than the advective timescale.
3.2 Dynamic Valves
To move between static configurations, valves must be opened and closed. This should be done by optimising some combination of shear stress, nutrient supply, and platelet collection, and without inducing back-flow in the scaffold, upper channel, or lower channel.
In Figure 6 we illustrate the effect of each individual valve on the dimensionless fluxes
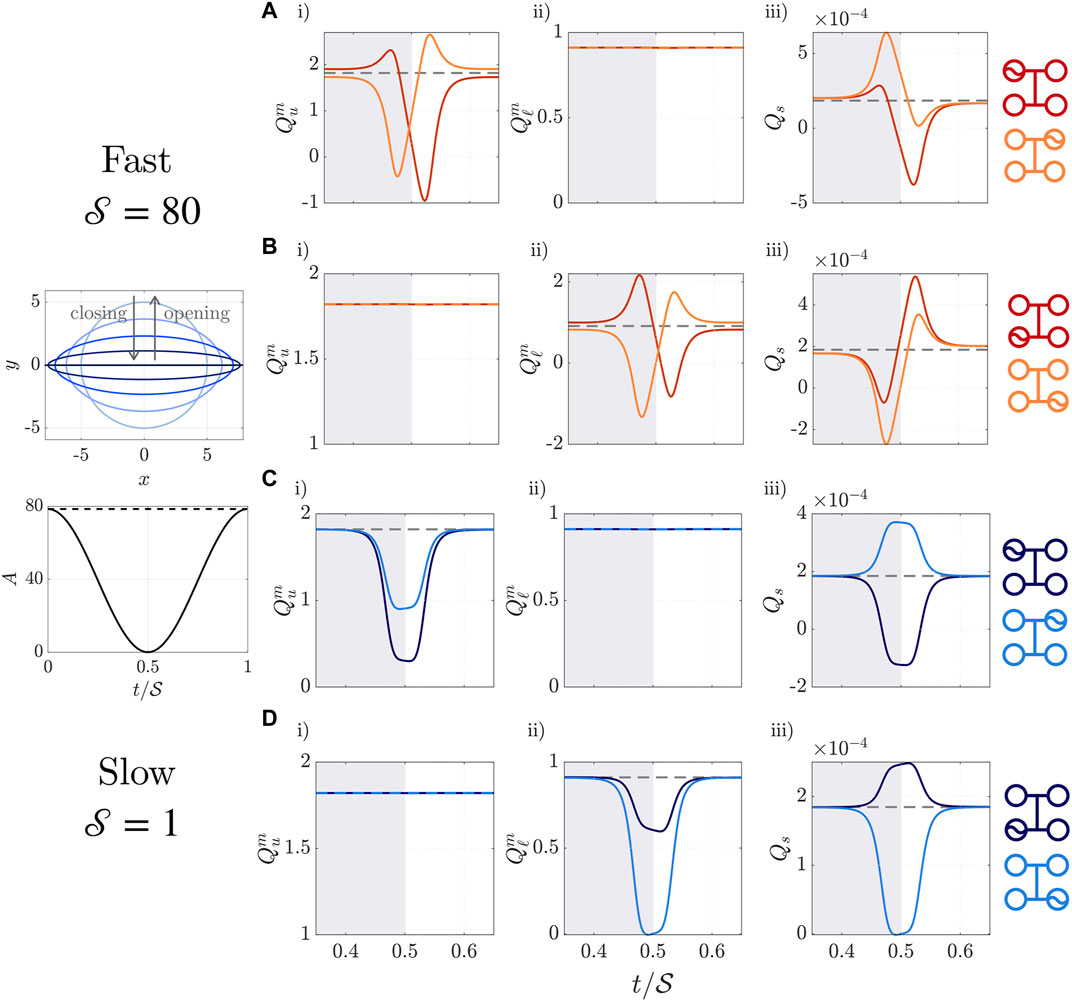
FIGURE 6. Dimensionless fluxes
Although we impose the valve area to vary sinusoidally in time, as shown in Figure 6 lower left and Eq. 24, changes in fluxes occur almost exclusively when the valve is at least 90% closed, in the interval
3.2.1 Fast Valves
Broadly, Figures 6Ai,Bii show that while a valve is closing (opening), the resistance of the valve increases (decreases), and flux away from (towards) the valve is enhanced. Flux down the scaffold is therefore enhanced (diminished) during most of the time that an upper valve is closing (opening) or a lower valve is opening (closing), as illustrated by Figures 6Aiii,Biii. Figures a i), a iii), b ii) and b iii) all contain negative fluxes. This indicates that back-flow, where channel flow is from outlet to inlet, or scaffold flow is from bottom to top, can be induced when outlets are closing or inlets are opening. As seen in Figures 6Aii,Bi, the movement of upper (lower) valves has minimal effect on the lower (upper) channel flux, because contribution from the change in scaffold flux is small relative to the lower (upper) channel flux induced by the prescribed pressure drop.
3.2.2 Slow Valves
When the valves move on a slow timescale with
3.2.3 Controlling Fluxes and Shear Stresses Using Valve Synchronisation
The above principles seen from moving individual valves can be applied to determine what valve combinations should be used in transitioning between static configurations. There is freedom to choose the ordering of valve movements, and the extent to which different valves move in sync with each other, by choosing when each valve starts opening or closing. We first discuss valve ordering for fast valves, and then examine slow valves.
To illustrate valve ordering for fast valves, suppose we wish to maximise shear stress in the scaffold when transitioning from the configuration with only upper valves open (promoting diffusive nutrient transport) to the configuration with only lower valves open (promoting platelet collection). Then, to take advantage of the enhanced scaffold fluxes shown in Figure 6Aiii while upper valves are closing and b iii) while lower valves are opening, the upper valves should be closed simultaneously with the lower valves opening. Closing both of the upper valves simultaneously additionally reduces back-flow in the upper channel, as the increase in upper channel flux caused by closing the inlet valve (red line Figure 6Ai) counteracts the back-flow in the upper channel caused by closing the upper outlet valve (orange line Figure 6Ai).
If the aim is relatively simple, then the principles explained above may be sufficient to pinpoint an appropriate set of valve configurations. More generally, when moving between any two static configurations, we may wish to optimise some function of
Suppose we move from the static configuration promoting shear stress, advective nutrient transport, and platelet collection, to the static configuration promotive diffusive nutrient transport, as shown in the upper right panel of Figure 7A. The upper outlet valve must open and the lower outlet valve must close. The two valves move with a relative delay time of θ ∈ [ − 0.5, 0.5], where θ = 0 corresponds to valves in-sync, θ = 0.5 is the upper outlet valve opening completely, then the lower outlet valve closing, and θ = −0.5 is the lower outlet valve closing completely, then the upper outlet valve opening. In Figure 7A we predict the proportion of time above an illustrative threshold shear stress of 6.5 × 10⁻³ Pa, the total scaffold flux total (Qs), and the minimum instantaneous scaffold flux min (Qs), while varying the synchronisation of valves. The total time is considered to be the time during which at least one valve is moving. From Figure 7, we see we can for example choose θ to maximise the proportion of time that the shear stress is above the chosen threshold, under the constraint that min (Qs) is above some value, so that instantaneous back-flow is sufficiently weak, and the constraint that total (Qs) is below some chosen value, so that collection volume is sufficiently low.
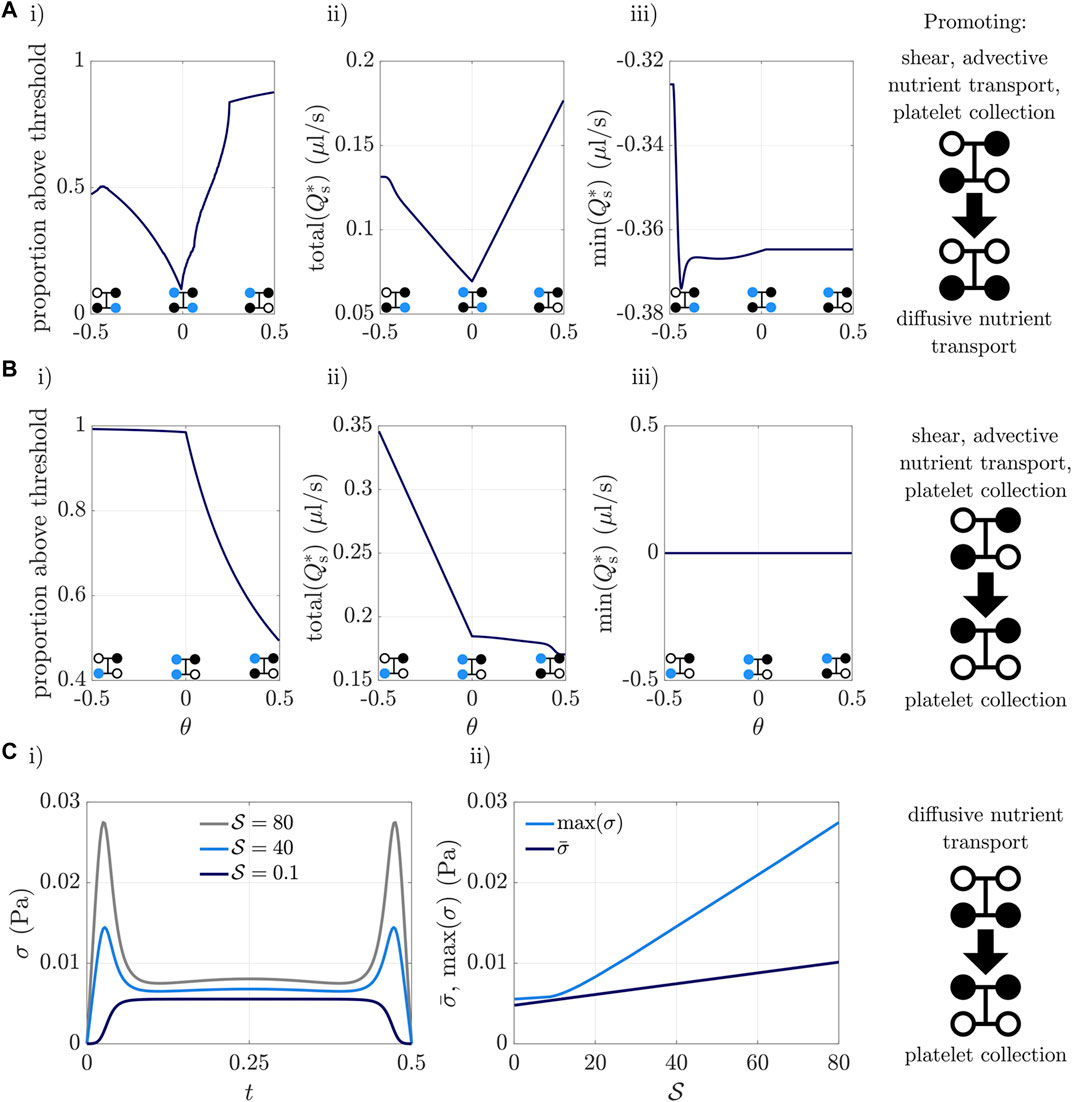
FIGURE 7. (Ai,Bi) Proportion of the total time the valves are moving, for which the shear stress is above an illustrative threshold value of 6.5 × 10⁻³ Pa, (Aii,Bii) total scaffold flux over the time at least one valve is moving, and (Aiii,Biii) minimum instantaneous scaffold flux. Here relative delay time θ between valves is varied while transitioning between two static configurations, shown on the right panels. The blue dots in the valve diagrams indicate which valve(s) starts moving first at that value of θ. (C) Shear stress dependence on Strouhal number, i.e., on valve speed (fast for high
In moving from the lower outlet valve closing first (θ = −0.5), to the upper outlet valve opening first (θ = 0.5), we see from Figure 7Ai that the proportion of time spent above the threshold shear stress slightly increases in θ ∈ (−0.5, −0.44), then decreases in θ ∈ (−0.44, 0), before increasing in θ ∈ (0, 0.5). This is because the earlier (later) the lower outlet valve is closed, the less (more) time there is during which flow can pass from an upper valve, to a lower valve, exerting shear stress on the scaffold. Figure 7Aii shows that the total scaffold flux is smallest when the upper and lower outlet valves are in-sync, at θ = 0. Opening the upper outlet valve and closing the lower outlet valve promotes back-flow through the scaffold, in competition with the externally imposed pressure drop from upper inlet to lower outlet. Figure 7Aiii shows that the highest degree of instantaneous back-flow, captured via min (Qs), occurs for θ = −0.5, where the upper outlet valve only starts opening after the lower outlet has fully closed. Away from θ = −0.5, there is little variation in min (Qs).
In Figure 7B, we show the proportion of time above the threshold shear, the total scaffold flux, and minimum instantaneous scaffold flux when moving from the shear-promoting static configuration, to the collection-promoting static configuration depicted on the right panel. Now θ = −0.5 is opening the lower inlet valve first, and θ = 0.5 is closing the upper inlet valve first. As predicted earlier, closing the upper inlet valve and opening the lower inlet valve pushes fluid down the scaffold, and from Figure 7Biii we see that back-flow never occurs. Closing the upper inlet valve simultaneously with opening the lower inlet valve (θ = 0) gives a high proportion of time above the threshold shear, but a lower total scaffold flux than first opening the lower inlet (θ = −0.5), as seen in Figures 7Bi,ii, respectively. The total flux is lower because the time during which at least one valve is moving is only half a period (i.e., the time for either closing or opening) for θ = 0, but is one full period for θ = −0.5.
We have so far studied advantages and disadvantages from varying the synchronisation of valves when the valves are moving quickly
Finally, we examine how valve speed affects shear stress, illustrated in Figure 7C using the transition from the valve configuration with only upper valves open, to only lower valves open, with valves moving simultaneously. Figure 7Ci shows the instantaneous spatially-averaged shear stress during transition for three valve speeds, and Figure 7Cii shows the maximum and mean shear stress for
4 Discussion
We have constructed a lubrication model of the gravity-driven, valve-controlled platelet bioreactor of Shepherd et al. (2018), consisting of an upper and lower tube system joined by a scaffold, with the four inlets and outlets controlled by valves. The components of the model are the cell culture media, modelled as a Newtonian fluid; the collagen scaffold, modelled as a rigid porous scaffold; and the valves, which are included via moving boundaries. The model prescribes the bioreactor geometry and material parameters, including lengthscales of bioreactor regions, reservoir heights, and the scaffold permeability; as well as valve speed, valve synchronisation, and the time valves spend open or closed.
We exploit the small aspect ratio throughout the bioreactor, assuming that cross-sectional lengthscales are small compared to axial lengthscales. We consider the regime in which the following two parameters are order one: the dimensionless permeability, measuring the relative velocities in the scaffold and tubing systems, and the Strouhal number, measuring the velocity of fluid driven by the pressure head, relative to the valve wall velocity. We further consider the following two parameters to be small: the reduced Reynolds number, measuring the ratio of inertial to viscous effects, and the dimensionless interface-slip coefficient, which depends on the permeability and geometry of the scaffold material. This means that we can employ the lubrication approximation for the Navier-Stokes equations, which we solve subject to no slip and continuity of normal velocity and pressure at the scaffold-channel interfaces, and no slip on the rigid walls. We obtain equations relating the flux through each cross-section of bioreactor tubing to axially-dependent pressure gradients, via cross-sectional conductivities. The upper and lower channels are coupled via their interface with the scaffold, and the full three-dimensional time-dependent system of PDEs is reduced to a one-dimensional quasi-steady system of PDEs.
The aim of our modelling is to understand how different bioreactor geometries and valve configurations affect fluxes in the bioreactor, and shear stress in the scaffold, and to control valve dynamics so as to optimise these quantities in a computationally-efficient manner.
We have tested different static valve configurations, and measured their effects on fluxes and scaffold shear stresses. Having computed the flux along the upper channel, lower channel, and the scaffold, we have demonstrated that there are some static valve configurations that should be avoided, as they induce significant back-flow in the scaffold. Additionally, we have ranked static configurations in order of highest to lowest scaffold shear stress, and shown that the greatest scaffold shear stress arises from an open upper inlet and lower outlet, and closed upper outlet and lower inlet.
Geometric parameters affect shear stress as follows. First, shear stress increases linearly with the upper reservoir height, which provides the driving pressure for the flow; this is reflected in the model via the upper reservoir height only appearing in the scaffold velocity scaling (12). The scaffold permeability and bioreactor length appear in the dimensionless model via the permeability parameter, and have nonlinear influence on the solution. At small permeabilities (10–15 m2 − 10–12 m2), increasing the scaffold permeability by an order of magnitude increases the shear stress by approximately an order of magnitude; at larger permeabilities (10–12 m2 − 10–9 m2), further increasing the permeability has little effect on the shear stress. The scaffold must also be designed to capture megakaryocytes and allow platelets to escape, which sets porosity bounds; if there is room within such design restrictions to tune permeability, then in low permeability ranges, permeability may be an effective way to control shear (see, for example, Ali and Sen 2017; Vossenberg et al., 2009). Increasing the bioreactor length while maintaining a constant driving pressure has different effects on shear stress, depending on which part of the bioreactor is lengthened. Lengthening a narrow section of tubing, such as resistor tubing, reduces the average transverse lengthscale in the tubing systems, and causes tubing system velocities, and thus also the scaffold shear stress, to drop. Lengthening the scaffold with the adjoining channels has little effect on tubing system velocities. However, when the scaffold is lengthened the scaffold shear stress decreases, because a lower velocity is required to maintain approximately the same flux through the scaffold. If we instead lengthen the valve tubing or the channels, both of which are wider than resistor tubing, then there is almost no change in shear stress: the reduction in resistance, due to increase in the proportion of relatively wide tubing in the tube systems, offsets the increase in resistance caused by lengthening the tubing.
We have investigated the effect of valve movement on the bioreactor flow. When transitioning between two static valve configurations with valves moving slowly (opening and closing over 40 s), fluxes vary monotonically. Therefore, to determine what valve combinations should be used in transitioning between static configurations, it is sufficient to pay attention to any intermediate configurations that are passed through en route (for example, to avoid passing through configurations that induce high back-flow).
In contrast, when opening and closing valves more quickly (say over 0.5 s), time-dependent effects are more significant. When a valve is closing, flow away from it is enhanced, and when it is opening, flow towards it is enhanced. To avoid huge spikes in back-flow, and take advantage of large spikes in scaffold shear stress, nutrient transport, or platelet collection, our model can be used to sweep through dynamic valve configurations that transition between static valve configurations. We have illustrated two examples of such transitions, and the model can in future be used to quickly obtain the exact configuration of valve movement that optimises some given function of tubing and scaffold fluxes, and scaffold shear stress.
The work thus far suggests further extensions. A restriction that may quite readily be lifted is the scaffold being long and thin. In the bioreactor of Shepherd et al. (2018) the scaffold has aspect ratio of a half, which could be made larger in our model without excessive additional computational burden, i.e., by solving a three-dimensional Laplace’s equation in the scaffold (instead of two-dimensional). We have chosen the valve timescale to match the timescale of flow induced by the pressure head, whereas in the physical bioreactor set-up of Shepherd et al. the valve timescales may be faster (see Table 1). Thus, in future work it would be interesting to see to whether the qualitative behaviour for fast valves that we have simulated holds for even faster timescales. To do so will require reintroduction of inertia in the Navier-Stokes equations, thereby significantly increasing the computational cost of the model. To validate future and present bioreactor models, it would be important for future experimental work to take measurements of fluxes out of the bioreactor outlets, over a period of time, for various valve configurations, and compare these to model predictions.
We have exploited a reduced mathematical model, retaining the key physics, to characterise the flow conditions in a valve-controlled bioreactor for platelet production. We have demonstrated how design parameters and operating conditions affect the bioreactor fluxes and shear stresses experienced by cells. This model can be used to aid experimentalists to mimic the in vivo production environment, with the aim of increasing clinical and commercial viability of in vitro platelet production.
Data Availability Statement
The raw data supporting the conclusion of this article will be made available by the authors, without undue reservation.
Author Contributions
SW, JO, DH, CG, SB, and RC initiated the project. HS, SW, and JO constructed the model, in discussion with DH, CG, SB, and RC. HS, SW, and JO wrote the manuscript. All authors reviewed the manuscript.
Funding
This publication is based on work supported by the EPSRC project grant 2100109.
Conflict of Interest
The authors declare that the research was conducted in the absence of any commercial or financial relationships that could be construed as a potential conflict of interest.
Publisher’s Note
All claims expressed in this article are solely those of the authors and do not necessarily represent those of their affiliated organizations or those of the publisher, the editors, and the reviewers. Any product that may be evaluated in this article, or claim that may be made by its manufacturer, is not guaranteed or endorsed by the publisher.
References
Ali, D., and Sen, S. (2017). Finite Element Analysis of Mechanical Behavior, Permeability and Fluid Induced wall Shear Stress of High Porosity Scaffolds with Gyroid and Lattice-Based Architectures. J. Mech. Behav. Biomed. Mater. 75, 262–270. doi:10.1016/j.jmbbm.2017.07.035
Balduini, A., Pallotta, I., Malara, A., Lova, P., Pecci, A., Viarengo, G., et al. (2008). Adhesive Receptors, Extracellular Proteins and Myosin Iia Orchestrate Proplatelet Formation by Human Megakaryocytes. J. Thromb. Haemost. 6, 1900–1907. doi:10.1111/j.1538-7836.2008.03132.x
Bardsley, K., Deegan, A. J., El Haj, A., and Yang, Y. (2017). Current State-Of-The-Art 3d Tissue Models and Their Compatibility with Live Cell Imaging. Multi-Parametric Live Cel Microsc. 3D Tissue Models 2017, 3–18. doi:10.1007/978-3-319-67358-5_1
Beavers, G. S., and Joseph, D. D. (1967). Boundary Conditions at a Naturally Permeable wall. J. Fluid Mech. 30, 197–207. doi:10.1017/s0022112067001375
Behnke, O., and Forer, A. (1998). From Megakaryocytes to Platelets: Platelet Morphogenesis Takes Place in the Bloodstream. Eur. J. Haematol. Suppl. 61, 3–23. doi:10.1111/j.1600-0609.1998.tb01052.x
Bender, M., Thon, J. N., Ehrlicher, A. J., Wu, S., Mazutis, L., Deschmann, E., et al. (2015). Microtubule Sliding Drives Proplatelet Elongation and Is Dependent on Cytoplasmic Dynein. Blood 125, 860–868. doi:10.1182/blood-2014-09-600858
Bourgine, P. E., Martin, I., and Schroeder, T. (2018). Engineering Human Bone Marrow Proxies. Cell stem cell 22, 298–301. doi:10.1016/j.stem.2018.01.002
Brown, M. A., Iyer, R. K., and Radisic, M. (2008). Pulsatile Perfusion Bioreactor for Cardiac Tissue Engineering. Biotechnol. Prog. 24, 907–920. doi:10.1002/btpr.11
Burova, I., Wall, I., and Shipley, R. J. (2019). Mathematical and Computational Models for Bone Tissue Engineering in Bioreactor Systems. J. Tissue Eng. 10, 2041731419827922. doi:10.1177/2041731419827922
Cameron, B., Rock, G., Olberg, B., and Neurath, D. (2007). Evaluation of Platelet Transfusion Triggers in a Tertiary-Care Hospital. Transfusion 47, 206–211. doi:10.1111/j.1537-2995.2007.01090.x
Carrier, R. L., Rupnick, M., Langer, R., Schoen, F. J., Freed, L. E., and Vunjak-Novakovic, G. (2002). Perfusion Improves Tissue Architecture of Engineered Cardiac Muscle. Tissue Eng. 8, 175–188. doi:10.1089/107632702753724950
Charlton, A., Wallis, J., Robertson, J., Watson, D., Iqbal, A., and Tinegate, H. (2014). Where Did Platelets Go in 2012? a Survey of Platelet Transfusion Practice in the north of england. Transfus. Med 24, 213–218. doi:10.1111/tme.12126
[Dataset] Us, T. F. S. (2020). Rpmi 1640 Medium, No Glutamine, No Phenol Red. Available at: https://www.thermofisher.com/uk/en/home/technical-resources/media-formulation.114.html (Accessed 11 05, 2020).
Di Buduo, C. A., Wray, L. S., Tozzi, L., Malara, A., Chen, Y., Ghezzi, C. E., et al. (2015). Programmable 3d Silk Bone Marrow Niche for Platelet Generation Ex Vivo and Modeling of Megakaryopoiesis Pathologies. Blood 125, 2254–2264. doi:10.1182/blood-2014-08-595561
Dunois-Lardé, C., Capron, C., Fichelson, S., Bauer, T., Cramer-Bordé, E., and Baruch, D. (2009). Exposure of Human Megakaryocytes to High Shear Rates Accelerates Platelet Production. Blood 114, 1875–1883. doi:10.1182/blood-2009-03-209205
Freed, L. E., and Vunjak-Novakovic, G. (1995). Cultivation of Cell-Polymer Tissue Constructs in Simulated Microgravity. Biotechnol. Bioeng. 46, 306–313. doi:10.1002/bit.260460403
Fung, Y. C., and Yih, C. S. (1968). Peristaltic Transport. J. Appl. Mech. 35, 669–675. doi:10.1115/1.3601290
Galban, C. J., and Locke, B. R. (1999). Effects of Spatial Variation of Cells and Nutrient and Product Concentrations Coupled with Product Inhibition on Cell Growth in a Polymer Scaffold. Biotechnol. Bioeng. 64, 633–643. doi:10.1002/(sici)1097-0290(19990920)64:6<633::aid-bit1>3.0.co;2-6
Heil, M., and Waters, S. L. (2006). Transverse Flows in Rapidly Oscillating Elastic Cylindrical Shells. J. Fluid Mech. 547, 185–214. doi:10.1017/s0022112005007214
Hess, J. R. (2010). Conventional Blood Banking and Blood Component Storage Regulation: Opportunities for Improvement. Blood Transfus. 8 (Suppl. 3), s9–15. doi:10.2450/2010.003S
Jaasma, M. J., Plunkett, N. A., and O’Brien, F. J. (2008). Design and Validation of a Dynamic Flow Perfusion Bioreactor for Use with Compliant Tissue Engineering Scaffolds. J. Biotechnol. 133, 490–496. doi:10.1016/j.jbiotec.2007.11.010
Junt, T., Schulze, H., Chen, Z., Massberg, S., Goerge, T., Krueger, A., et al. (2007). Dynamic Visualization of Thrombopoiesis within Bone Marrow. Science 317, 1767–1770. doi:10.1126/science.1146304
Kaufman, R. M., Airo, R., Pollack, S., and Crosby, W. H. (1965). Circulating Megakaryocytes and Platelet Release in the Lung. Blood 26, 720–731. doi:10.1182/blood.v26.6.720.720
Korson, L., Drost-Hansen, W., and Millero, F. J. (1969). Viscosity of Water at Various Temperatures. J. Phys. Chem. 73, 34–39. doi:10.1021/j100721a006
Lefrançais, E., Ortiz-Muñoz, G., Caudrillier, A., Mallavia, B., Liu, F., Sayah, D. M., et al. (2017). The Lung Is a Site of Platelet Biogenesis and a Reservoir for Haematopoietic Progenitors. Nature 544, 105–109.
Machlus, K. R., and Italiano, J. E. (2013). The Incredible Journey: From Megakaryocyte Development to Platelet Formation. J. Cel Biol. 201, 785–796. doi:10.1083/jcb.201304054
Machlus, K. R., Thon, J. N., and Italiano, J. E. (2014). Interpreting the Developmental Dance of the Megakaryocyte: a Review of the Cellular and Molecular Processes Mediating Platelet Formation. Br. J. Haematol. 165, 227–236. doi:10.1111/bjh.12758
Manton, M. J. (1975). Long-wavelength Peristaltic Pumping at Low reynolds Number. J. Fluid Mech. 68, 467–476. doi:10.1017/s0022112075001760
Mazo, I. B., and von Andrian, U. H. (1999). Adhesion and Homing of Blood-Borne Cells in Bone Marrow Microvessels. J. Leukoc. Biol. 66, 25–32. doi:10.1002/jlb.66.1.25
McCulloch, A. D., Harris, A. B., Sarraf, C. E., and Eastwood, M. (2004). New Multi-Cue Bioreactor for Tissue Engineering of Tubular Cardiovascular Samples under Physiological Conditions. Tissue Eng. 10, 565–573. doi:10.1089/107632704323061924
Mohee, L., Offeddu, G. S., Husmann, A., Oyen, M. L., and Cameron, R. E. (2019). Investigation of the Intrinsic Permeability of Ice-Templated Collagen Scaffolds as a Function of Their Structural and Mechanical Properties. Acta Biomater. 83, 189–198. doi:10.1016/j.actbio.2018.10.034
Ng, J., Spiller, K., Bernhard, J., and Vunjak-Novakovic, G. (2017). Biomimetic Approaches for Bone Tissue Engineering. Tissue Eng. B: Rev. 23, 480–493. doi:10.1089/ten.teb.2016.0289
Nishimura, S., Nagasaki, M., Kunishima, S., Sawaguchi, A., Sakata, A., Sakaguchi, H., et al. (2015). IL-1α Induces Thrombopoiesis through Megakaryocyte Rupture in Response to Acute Platelet Needs. J. Cel Biol. 209, 453–466. doi:10.1083/jcb.201410052
Noris, P., Biino, G., Pecci, A., Civaschi, E., Savoia, A., Seri, M., et al. (2014). Platelet Diameters in Inherited Thrombocytopenias: Analysis of 376 Patients with All Known Disorders. Blood J. Am. Soc. Hematol. 124, e4–e10. doi:10.1182/blood-2014-03-564328
O’Dea, R. D., Byrne, H. M., and Waters, S. L. (2012). “Continuum Modelling of In Vitro Tissue Engineering: a Review,” in Computational Modeling in Tissue Engineering (Berlin, Germany: Springer), 229–266.
O’Dea, R. D., and Waters, S. L. (2006). Flow and Solute Uptake in a Twisting Tube. J. Fluid Mech. 562, 173–182.
Pallotta, I., Lovett, M., Kaplan, D. L., and Balduini, A. (2011). Three-dimensional System for the In Vitro Study of Megakaryocytes and Functional Platelet Production Using Silk-Based Vascular Tubes. Tissue Eng. C: Methods 17, 1223–1232. doi:10.1089/ten.tec.2011.0134
Patel, S. R., Richardson, J. L., Schulze, H., Kahle, E., Galjart, N., Drabek, K., et al. (2005). Differential Roles of Microtubule Assembly and Sliding in Proplatelet Formation by Megakaryocytes. Blood 106, 4076–4085. doi:10.1182/blood-2005-06-2204
Pollack, S. R., Meaney, D. F., Levine, E. M., Litt, M., and Johnston, E. D. (2000). Numerical Model and Experimental Validation of Microcarrier Motion in a Rotating Bioreactor. Tissue Eng. 6, 519–530. doi:10.1089/107632700750022161
Pries, A. R., Neuhaus, D., and Gaehtgens, P. (1992). Blood Viscosity in Tube Flow: Dependence on Diameter and Hematocrit. Am. J. Physiology-Heart Circulatory Physiol. 263, H1770–H1778. doi:10.1152/ajpheart.1992.263.6.h1770
Saffman, P. G. (1971). On the Boundary Condition at the Surface of a Porous Medium. Stud. Appl. Maths. 50, 93–101. doi:10.1002/sapm197150293
Secomb, T. W. (1978). Flow in a Channel with Pulsating walls. J. Fluid Mech. 88, 273–288. doi:10.1017/s0022112078002104
Selden, C., and Fuller, B. (2018). Role of Bioreactor Technology in Tissue Engineering for Clinical Use and Therapeutic Target Design. Bioengineering 5, 32. doi:10.3390/bioengineering5020032
Shepherd, J. H., Howard, D., Waller, A. K., Foster, H. R., Mueller, A., Moreau, T., et al. (2018). Structurally Graduated Collagen Scaffolds Applied to the Ex Vivo Generation of Platelets from Human Pluripotent Stem Cell-Derived Megakaryocytes: Enhancing Production and Purity. Biomaterials 182, 135–144. doi:10.1016/j.biomaterials.2018.08.019
Shipley, R. J., Waters, S. L., and Ellis, M. J. (2010). Definition and Validation of Operating Equations for Poly(vinyl Alcohol)-Poly(lactide-Co-Glycolide) Microfiltration Membrane-Scaffold Bioreactors. Biotechnol. Bioeng. 107, 382–392. doi:10.1002/bit.22815
Sladkova, M., and De Peppo, G. (2014). Bioreactor Systems for Human Bone Tissue Engineering. Processes 2, 494–525. doi:10.3390/pr2020494
Sola-Visner, M. C., Christensen, R. D., Hutson, A. D., and Rimsza, L. M. (2007). Megakaryocyte Size and Concentration in the Bone Marrow of Thrombocytopenic and Nonthrombocytopenic Neonates. Pediatr. Res. 61, 479–484. doi:10.1203/pdr.0b013e3180332c18
Sucosky, P., Osorio, D. F., Brown, J. B., and Neitzel, G. P. (2004). Fluid Mechanics of a Spinner-Flask Bioreactor. Biotechnol. Bioeng. 85, 34–46. doi:10.1002/bit.10788
Suzuki, D., Flahou, C., Yoshikawa, N., Stirblyte, I., Hayashi, Y., Sawaguchi, A., et al. (2020). Ipsc-Derived Platelets Depleted of Hla Class I Are Inert to Anti-hla Class I and Natural Killer Cell Immunity. Stem Cel Rep. 14, 49–59. doi:10.1016/j.stemcr.2019.11.011
Taylor, G. I. (1971). A Model for the Boundary Condition of a Porous Material. Part 1. J. Fluid Mech. 49, 319–326. doi:10.1017/s0022112071002088
Thon, J. N., Mazutis, L., Wu, S., Sylman, J. L., Ehrlicher, A., Machlus, K. R., et al. (2014). Platelet Bioreactor-On-A-Chip. Blood 124, 1857–1867. doi:10.1182/blood-2014-05-574913
Vossenberg, P., Higuera, G. A., Van Straten, G., Van Blitterswijk, C. A., and Van Boxtel, A. J. B. (2009). Darcian Permeability Constant as Indicator for Shear Stresses in Regular Scaffold Systems for Tissue Engineering. Biomech. Model. Mechanobiol 8, 499–507. doi:10.1007/s10237-009-0153-6
Waters, S. L., and Guiot, C. (2001). Flow in an Elastic Tube Subject to Prescribed Forcing: a Model of Umbilical Venous Flow. J. Theor. Med. 3, 287–298. doi:10.1080/10273660108833081
Whittaker, R. J., Booth, R., Dyson, R., Bailey, C., Parsons Chini, L., Naire, S., et al. (2009). Mathematical Modelling of Fibre-Enhanced Perfusion inside a Tissue-Engineering Bioreactor. J. Theor. Biol. 256, 533–546. doi:10.1016/j.jtbi.2008.10.013
Keywords: bioreactor, platelets, reduced model, shear stress, valves, mathematical model
Citation: Saville HM, Howard D, Ghevaert C, Best SM, Cameron RE, Oliver JM and Waters SL (2022) A Mathematical Model of a Valve-Controlled Bioreactor for Platelet Production. Front. Mech. Eng 8:858931. doi: 10.3389/fmech.2022.858931
Received: 20 January 2022; Accepted: 29 March 2022;
Published: 27 April 2022.
Edited by:
Feihu Zhao, Swansea University, United KingdomReviewed by:
Reuben O’Dea, University of Nottingham, United KingdomTed Joseph Vaughan, National University of Ireland Galway, Ireland
Copyright © 2022 Saville, Howard, Ghevaert, Best, Cameron, Oliver and Waters. This is an open-access article distributed under the terms of the Creative Commons Attribution License (CC BY). The use, distribution or reproduction in other forums is permitted, provided the original author(s) and the copyright owner(s) are credited and that the original publication in this journal is cited, in accordance with accepted academic practice. No use, distribution or reproduction is permitted which does not comply with these terms.
*Correspondence: Sarah L. Waters, d2F0ZXJzQG1hdGhzLm94LmFjLnVr