 Anurag Zope
 Sheng-Shian Li
- 1Institute of NanoEngineering and MicroSystems, National Tsing Hua University, Hsinchu, Taiwan
- 2Department of Power Mechanical Engineering, National Tsing Hua University, Hsinchu, Taiwan
Microelectromechanical systems (MEMS) are in widespread commercial use due to their compact size, high performance, and low cost. MEMS resonators have emerged as front runners for sensing (accelerometers, gyroscopes, and particulate matter) and frequency (RF front-end, filters, timing, and frequency source) applications. The excellent stability, resolution, and accuracy of resonators lead them an ideal candidate for sensor implementation. The CMOS-MEMS technology allows for rapid, large-scale, and low-cost manufacturing. Thermal–piezoresistive resonators (TPRs) are promising candidates due to their favorable potential with scaling and robust performance in the ambient environment. A detailed finite element method (FEM) simulation flow is presented along with a mathematical model for device optimization. The devices were fabricated with the commercial CMOS technology utilizing the front-end-of-line (FEOL) polysilicon and back-end-of-line (BEOL) materials like silicon dioxide and interconnect metal. The flexibility of selective material placement in layout and complex routing using multi-metal interconnect is employed to develop a balanced TPR design at 2 MHz. A 5-MHz bulk mode TPR was designed for mass sensing application. The fabricated devices were characterized, and their performance is compared with other state-of-the-art works. Finally, the developed devices were used in real-world applications for mass sensing and pressure sensing. The device achieved 20 kHz/ng. The TPR devices combine principles of Pirani gauge and resonant sensors for improving the sensing range from 2 to 760 Torr (1 atm).
1 Introduction
Internet of Things (IoT) is bringing about a significant transformation resulting in seamless interaction between machines and humans, leading to smart homes, industries, and cities (Rong et al., 2016). One of the key technologies in achieving this is the hardware layer consisting of sensors and actuators. The advances in computing and wireless communication allow for smart portable devices capable of predicting our needs based on the environment and past data (Jie et al., 2013). Complementary metal-oxide semiconductor (CMOS) technology is widely researched for the fabrication of MEMS like accelerometers (Tsai et al., 2012), resonators (Chen et al., 2018), mass sensors (Vidal- Álvarez et al., 2016), thermal sensors (Göktaş, 2019), pressure sensors (Liao et al., 2021), ultrasonic transducers (Hsu et al., 2020), microfluidic devices (Huang and Mason, 2013), and biosensors (Lu and Bhushan, 2016). Compact size, long battery life, high performance, and ease of bulk manufacturing for low ownership cost and rapid deployment are prerequisites for smart sensors. In addition to satisfying the key aspects of smart sensors, CMOS-MEMS enables single-chip integration of various sensors, energy harvesters, signal processing, and wireless communication, as shown in Figure 1. Application-specific integrated circuits (ASICs) enabled the rapid growth of semiconductors. CMOS-MEMS assists in providing targeted sensing, actuation, networking, and AI capabilities for any application.
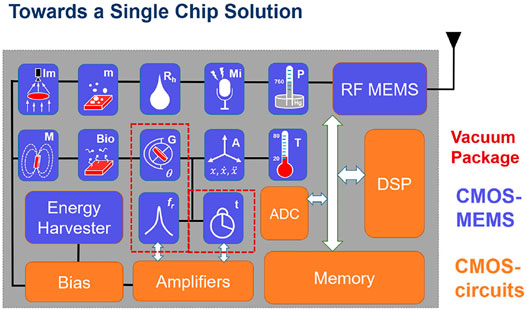
FIGURE 1. Monolithic integration of a smart sensor system using a CMOS processor.
MEMS resonators are widely explored for sensing due to their excellent frequency stability, sensitivity, and accuracy (Parsons, 1993). Piezoelectric transduction is preferred due to its high electromechanical coupling coefficient but is not suitable for monolithic integration and needs complex and expensive multi-die bonding for integration (Tsai et al., 2015). Capacitive transduction is extensively used in MEMS because of its zero-power operation and high sensitivity. High transduction requires a tiny gap and operation in a vacuum. Thus, capacitive ambient sensors suffer from increased damping and performance degradation (Nguyen and Howe, 1999). Thermal-piezoresistive transduction can operate in ambient conditions without significant performance degradation at the cost of power consumption. It is possible to reduce the power consumption with device optimization while maintaining high sensitivity. Thus, they are attractive candidates for future smart sensors.
The study covers the mechanism of thermal-piezoresistive resonator operation, implementation in a standard CMOS foundry process, and procedure for FEM simulation. The post-fabrication release steps are then summarized along with a typical electrical characterization of resonators and oscillators. Finally, real-world performance for pressure and mass sensing is demonstrated and compared with other works.
2 Materials and Methods
Before we can design MEMS resonators, we need to understand the physics behind thermal-piezoresistive devices. The typical design flow consists of the trade-off between crucial parameters, which can be easily accomplished with a mathematical model. FEM simulations are then used to evaluate the performance of design in the real world (i.e., non-ideal geometries, anchor conditions, and non-linear properties). CMOS-MEMS introduce additional constraints like the fixed material stack and design rule checks (DRC) tailored for circuits. For MEMS resonators, the resonant frequency (fr), quality factor (Q), motional resistance (Rm), and power consumption (Pbias) (especially for TPRs) are key parameters. For most CMOS-MEMS devices, the BEOL dielectric [silicon dioxide (SiO2)] is preferred as a structural element due to its low material loss, electrical insulation, and excellent selectivity against metal etchants (Williams et al., 2003). The metal interconnects are used for routing or electrodes. The low resistivity polysilicon (Poly-1) is used for a thermal drive, while the high resistivity polysilicon (Poly-2) is for piezoresistive sensing. The vibration frequency of a MEMS resonator is determined by its dimensions and material property. CMOS allows for precise control of the geometry and well-defined material properties, especially polysilicon. In addition to selecting an appropriate resonance frequency (fr), it is imperative to choose a suitable mode shape for a target application. The vibration mode shape not only determines the critical resonator parameters like quality factor (Q) and motional resistance (Rm) but also the performance (sensitivity and resolution) of a resonant sensor.
2.1 Working Principle
TPR relies on the interaction between thermal, mechanical, and electrical domains. The vibration is caused due to thermal expansion/contraction, and the electrical output is obtained due to the piezoresistive effect (Rahafrooz and Pourkamali, 2010). The detailed multi-domain interaction for typical length extension TPR is explained in Zope et al. (2020). The interaction for a flexural clamped-clamped beam (CCB) is depicted in Figure 2. An AC signal (iac) is superimposed on the DC bias current (IDC) through the drive resistor, which results in a change in temperature due to Joule heating. The rise in temperature due to IDC does not affect the dynamic performance of a TPR. Thus, the small-signal temperature fluctuation is proportional to the magnitude of IDC and the magnitude and phase of iac. This alternating temperature generates expansion (e.g., IDC and iac are in-phase in Rh-2 and Rh-4) and contraction (e.g., IDC and iac are out-of-phase in Rh-1 and Rh-3) of the heater resistors (Rh-n). The alternate expansion and contraction exert a force (FD) along the center of the drive/heater resistors. The combined effect results in a moment (MD) at the anchors, driving the beam into an in-plane flexural mode. Also, the DC heating (IDC only) causes the entire composite beam to reach a steady-state temperature (TDC). This temperature increase causes the beam to undergo thermal expansion, which results in the development of thermal compressive stress and is shown as a force FDC pushing against the anchors. The thermal stress reduces beam stiffness, hence lowering the resonant frequency (fr). An equivalent force (Feff) can be defined as a point force acting on the beam to mimic the effect of the differential thermal drive resulting in the lateral displacement y0.
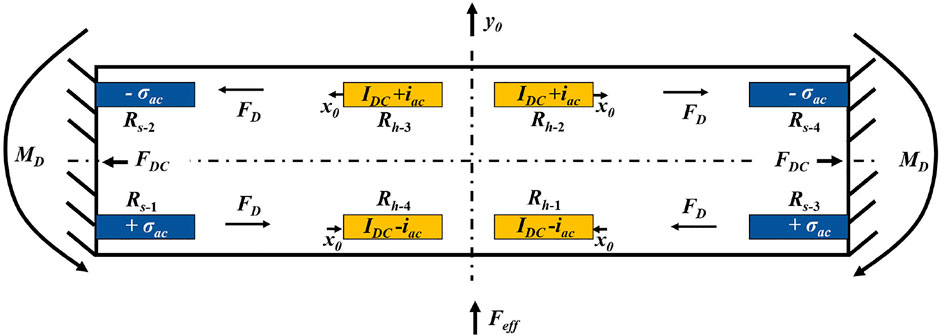
FIGURE 2. Bias (drive and sense), generated force, displacement, and stress for drive and sense half cycle for a clamped-clamped beam (CCB).
The motion of the beam creates alternate compressive (−σ) and tensile (+σ) stresses in the beam. The magnitude of this stress is highest near the anchor region. This results in a change of resistivity in polysilicon sense resistors (Poly-2) due to the piezoresistive effect. The fluctuating resistance causes an alternating voltage to develop across the sense resistors (Rs-n) for a constant DC (IS) flowing through the sense resistor. An external amplifier can be used to feed the output signal back to the drive resistors to create a closed-loop system. To enable sustained oscillation, the loss due to TPR needs to be compensated by the external amplifier and ensure positive feedback, that is, satisfying the Barkhausen criteria (Nguyen and Howe, 1993). The use of an n-type piezoresistor ensures a positive feedback loop (Rahafrooz and Pourkamali, 2010). The low piezoresistive coefficient (πl) (Wang et al., 2013) of polysilicon prevents self-oscillation in CMOS-MEMS TPRs, which is commonly observed in single crystal silicon (SCS) devices (Rahafrooz and Pourkamali, 2010; Steeneken et al., 2011; Miller et al., 2018; Li et al., 2014).
2.2 Structure
Low-loss materials are preferred for use in MEMS to ensure high Q. TPRs require current flow to drive and sense, which makes lossy metal interconnections unavoidable. The schematic representation for the length extension mode II-bar TPR is depicted in Figure 3A. Poly-1 (drive) and Poly-2 (sense) resistors form the central core of the thermal beam. SiO2 encloses the resistors to protect it during release. CMOS foundry dictates the layer stack. Poly-1 and Poly-2 are separated by a thin oxide layer of 37 nm. These layers are used in integrated circuits to create the poly-insulator-poly (PiP) capacitor. The beams are connected to a proof mass at the ends. The polysilicon in the proof mass serves as an interconnection for the two thermal beams. A low resistance routing is achieved by employing wider polysilicon layers in the proof mass. The thickness of the structure is determined by the layer stack used (metal 1 to metal 4 for 0.35 µm CMOS). The thermal beam dimensions are 60 µm × 3 µm x 6 µm (LxWxH) and those for proof mass are 50 µm × 100 µm x 6 µm. The drive and sense resistors are 1 µm wide, and their resistances are 360 and 2,700 Ω, respectively.
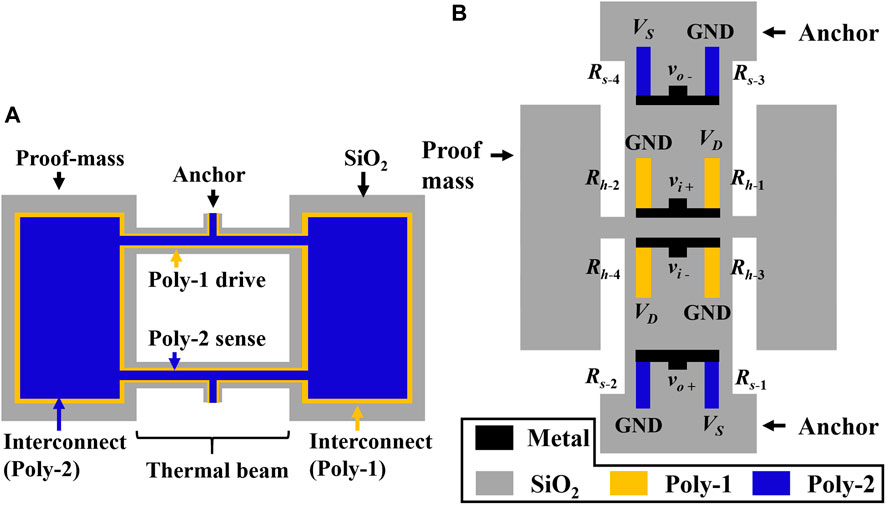
FIGURE 3. Simplified schematic representation of (A) II-bar and (B) clamped-clamped beam (CCB).
The schematic representation for CCB is depicted in Figure 3B. The thermal drive resistors are placed in the middle of the beam, and piezoresistive sensing resistors are located near the anchors. This ensures maximum efficiency for both drive (low-stiffness region) and sense (high-stress region). The sense resistors protrude inside the anchor region to ensure maximum stress distribution across Poly-2. The heater elements (Rh-n) are 6 μm × 1 μm × 0.275 μm, and the sense elements (Rs-n) are 8 μm × 1 μm × 0.18 μm. The CCB is 80 μm × 6 μm × 6 μm. The oxide proof mass (50 μm × 10 μm) is attached at the center to the beam and is formed entirely of SiO2. Both the drive and sense resistors are arranged to form a Wheatstone bridge. This isolates the DC and AC terminals, eliminating the need for bias-TS or complex biasing circuits (Zope and Li, 2021). The physical separation of drive and sense resistors also reduces the feedthrough. The effective drive and sense resistances are 48 and 400 Ω, respectively. The multilayer interconnections in CMOS are exploited to create a differential drive and sense configuration.
2.3 Modeling
An equivalent model allows for co-simulation with the circuit and helps identify performance-critical parameters. A detailed derivation for a CMOS TPR is provided in Zope et al. (2020) for the bulk mode. The overall transconductance (gm) is derived to be
where αeq is the equivalent coefficient of thermal expansion, πl-2 is the piezoresistive coefficient of Poly-2, EPoly-2 is Young’s modulus of Poly-2, Cth is the beam thermal capacitance, ω0 is the angular resonant frequency, and IS and ID are bias currents. The F factor is a ratio of thermal beam resistance to total drive resistance. Thus, a designer needs to ensure smaller Cth and lower fr to achieve high gm at low power. There is a trade-off between Cth (smaller dimension) vs. fr (lower stiffness, i.e., larger beam). MEMS resonators are modeled as RLC tanks. Figure 4A shows the equivalent electrical model for CMOS-MEMS II-bar TPR. Rm-1, Lm-1, and Cm-1 represent the electrical equivalent of mechanical motion (Poly-1 drive). The sensing is expressed as a current-dependent current source (G21). The expression for each parameter is given as follows:
where πl-1 is the piezoresistive coefficient of Poly-1. For maximum gain, a bias condition of IS > ID should be utilized. In practice, this is difficult because of the higher resistivity of Poly-2 and lower current density limit. In addition to the driving (RH) and sensing (RS) resistors, electrical feedthrough is accounted for by the introduction of a feedthrough capacitance (Cf) in the electrical model. As Poly-1 and Poly-2 are separated by ≈ 37-nm oxide gap, the parasitic capacitance cannot be ignored. Table 1 lists the dimensions of the II-bar and calculated critical parameters.
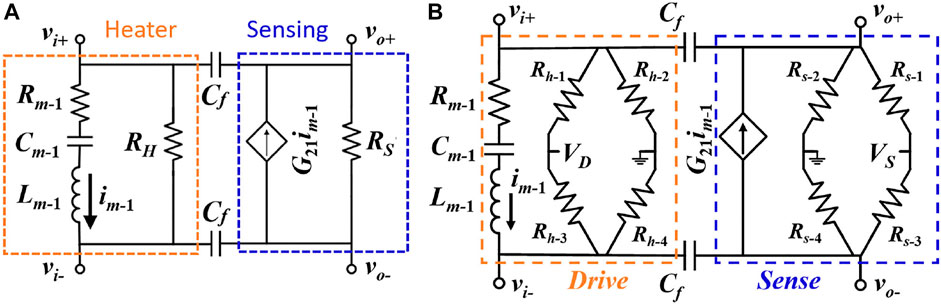
FIGURE 4. Electrical equivalent circuit model for (A) II-bar and (B) balanced drive and sense CCB.
TABLE 1. Critical dimensions of II-bar and calculated values for crucial thermal and mechanical system parameters.
An exact analytical model is complicated for a CCB with pseudo bimorph actuation and is severely limited due to significant stiffness variation from residual stress and built-up thermal stress during operation. Thus, a hybrid approach utilizing standard analytical equations and lumped parameters from the finite element method (FEM) and measurements are used. Following the steps in Zope et al. (2020), a more generalized equation is derived to be
where n is the number of actuators (4 for CCB), A is the cross section area of the differential temperature region of the thermal beam, Lb is the length of sensing Poly-2, Eeq is Young’s modulus of the composite beam, and keff is the equivalent stiffness. To simplify the design process, the stiffness equation for an ideal CCB is used to decide the beam dimensions. FEM simulation is then used to model thermal stress and match the fr to the desired target of 2 MHz in this study. The electrical equivalent model is shown in Figure 4B.
2.4 FEM Simulation
The dynamic response of a TPR requires analysis of electrical, thermal, and mechanical domains. The frequency response of a resonator provides all the crucial performance parameters like motional resistance (Rm or 1/gm), Q, and driven fr. First, the resonant frequency is evaluated with eigenanalysis and was found to be 2.03 MHz, as depicted in Figure 5A. The resonant behavior is characterized by a combination of both AC and DC signals. These are not supported in all domains in most FEM software. To overcome this limit, a separate electrical conduction domain was set up for AC drive, DC drive, and DC sense. Heat transfer physics was then set up for dynamic temperature only, that is, the boundary condition was set to 0 K. The heat equation is given as (Maugin, 1999) follows:
where ρ is density, Cp is heat capacity, T is temperature, kh is thermal conductivity, and Qh is a heat source. To include the effect of time-varying excitation in thermal analysis, the heat source was modified to include Joule heating and drive frequency, shown as follows.
where Jh is current density, Eh is the electric field, and i is the imaginary number (√-1). Thus, the stationary analysis now considers the effect of Cp on the temperature. The thermal time constant of the device is much larger than the resonance period, so the device cannot reach a steady state when driven. Figure 5B shows the differential AC temperature distribution in the heater resistors. The average temperature change is 1.6 K.
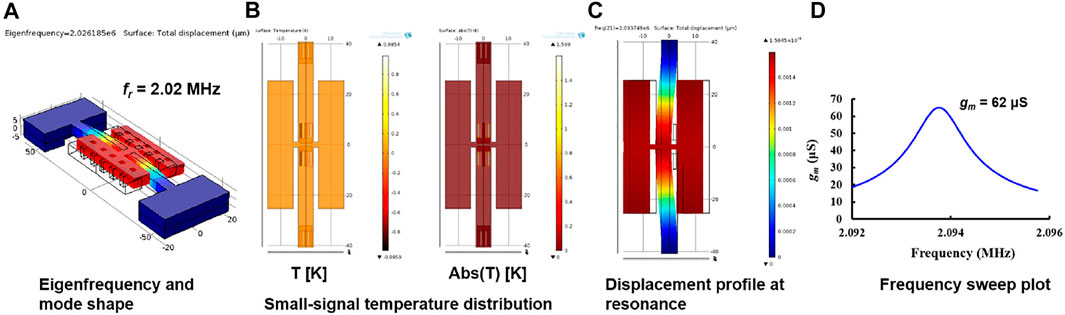
FIGURE 5. FEM simulation of CCB showing (A) eigenfrequency of 2.02 MHz for the in-plane mode. (B) Small-signal temperature distribution for the differential drive and the average temperature change of 1.6 K, (C) a uniform displacement of 1.6 nm at resonance, and (D) transconductance (gm) of 62 µS at resonance for a frequency sweep study.
The piezoresistive domain is applied to enable stress-dependent resistivity of materials. It combines mechanical and electrical domains. The small-signal temperature from the previous step is coupled to induce periodic vibration. The resultant displacement of 1.6 nm is shown in Figure 5C. A frequency sweep study was performed using the heat transfer and current results from the stationary analysis. The simulated gm of 62 µS for an assumed Q of 2,500 is plotted in Figure 5D. These values can be used to design a specification for sustaining circuits to enable oscillators. The material parameter values are listed in Table 2.
TABLE 2. Material parameter values for CMOS.
2.5 Fabrication
The metal release process creates MEMS with oxide-rich structures, thus enabling high-Q devices. The post-process needs three steps and starts with proper design in the CMOS tape-out (Ming-Han Tsai et al., 2008). Figure 6A shows the optical image of the die received from the CMOS foundry and cross section across the thermal beam near drive resistors. The thermal beam is surrounded by a sacrificial metal via stack. The sacrificial metal and via are etched using Piranha solution at 100°C. This is used to etch the release holes and get access to the silicon substrate, as depicted in Figure 6B. This process has a very high selectivity (Williams et al., 2003) and is robust. Reactive ion etching (RIE) is used to remove the protective SiO2 layer on the probe pads which is essential to protect against the etchant in the previous step. The device is then released by isotropic dry etch of the silicon substrate using XeF2. The undercut of the silicon substrate can be seen in Figure 6C for the released device. It is imperative that polysilicon is not exposed to XeF2 due to cracks in the interlayer dielectric (ILD) as it is a low-quality oxide (wet oxidation). The polysilicon layer is enclosed by SiO2 and constraints the minimum width of the thermal beam. The measured width of the released beam was found to be 3.148 µm compared to the drawn width of 3 µm (Zope et al., 2020). The tapered profile at the top of the beam and the thickness are dependent on the SiO2 dry etch time. The measured thickness was 5.9 µm compared to the expected thickness of 6 µm based on foundry data. Frequency variation mainly comes from the deviation in beam shaping and thickness.
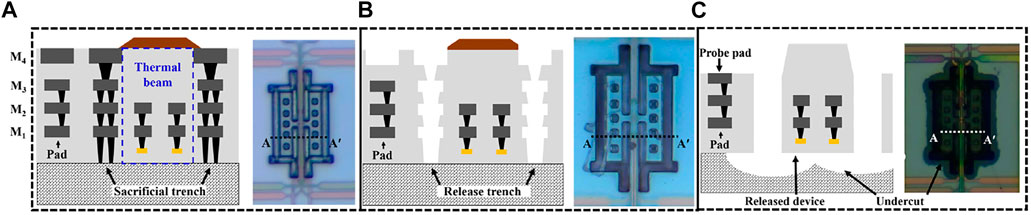
FIGURE 6. Steps for post-fabrication release of the MEMS. (A) Optical microscope image (OM) of the die received from the foundry and its cross section along AAʹ. (B) OM after metal wet etching and its AAʹ cross section showing a trench. (C) OM after dry SiO2 etch (RIE) and isotropic dry etch of Si for release. The substrate undercut can be seen in the image.
2.6 Applications
Resonant sensors have higher sensitivity and excellent frequency stability (Bedair and Fedder, 2004). Frequency response measurement requires complex circuitry increasing the cost and power consumption of a potential sensor. The same results can be achieved by implementing an oscillator and measuring the resonant frequency with digital counters for fraction of the cost in power and money. A lock-in amplifier (Zurich Instruments HF2LI) with the phase-locked loop (PLL) is used to study the closed-loop performance of TPRs, as illustrated in Figure 7. Bias is provided by Keithley 2400 source measure unit (SMU). The resolution of a resonant sensor is determined by the stability of the oscillator (Leeson, 1966). The stability of an oscillator is measured using the Allan deviation1. The best resolution for a resonant sensor requires large output power (i.e., linear range) and high Q (Chen et al., 2019). A resonant sensor frequently has to operate in ambient pressure, thus limiting the Q for capacitive transduction in CMOS-MEMS compared to that for a thermal piezoresistive oscillator (TPO).
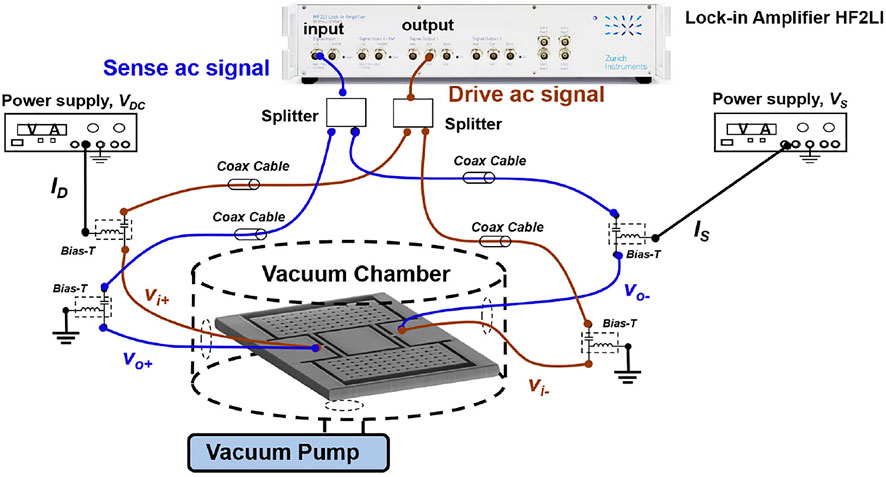
FIGURE 7. Setup for characterization of a thermal piezoresistive oscillator (TPO) with a HF2LI lock-in amplifier with PLL.
2.6.1 Mass Sensor
A particle landing on a resonator changes its mass resulting in a shift in the resonant frequency. The change in frequency is given by (Xiaoyuan Xia et al., 2008)
where Meff is the effective mass and depends on the mode shape, and ∆m is the added mass. The trade-off in larger sensitivity is the reduction in the sensing range. The resonant frequency can be increased by making the structure more rigid and reducing its mass. The sensitivity is degraded when the added mass is comparable to Meff. The sensitivity of the II-bar was simulated to be 20.48 Hz/pg using FEM by added mass and extraction of Meff and keff from eigenfrequency using total energy (Hauer, 2013). The experimental setup used to evaluate the mass sensing performance of the TPO is shown in (Chang et al., 2016). A 1 pL silver droplet (DGP 14LT-15C, Advanced Nano Products Co., Ltd.) is deposited by a nano-printer (DMP-2800 Dimatix FUJIFILM) on the proof mass, and the resultant change in frequency is measured by using a frequency counter (Keysight 5230).
2.6.2 Pressure Sensor
Pirani gauge is one of the widely used pressure sensors and relies on the different heat loss mechanisms in various pressure regions. At high pressure, the heat loss due to conduction in gas is high, and the resistance of the heater is not changed. At moderate pressure, the heat loss depends on the number of gas molecules in contact with the heater. The heater resistance increases with a decrease in pressure and is the working range for Pirani gauges. For low pressure, there are fewer gas molecules, and heat loss is mostly from support structures. The heater resistance as a function of pressure is given by Mastrangelo and Muller (1991).
where R0 is the electrical resistance; δ is ohmic heating power; Ib is the heater current; w, l, and t are the width, length, and thickness of the heater; kb and kgas(P) are the thermal conductivity of the beam and gas, respectively; η is the coefficient of fringing heat flux; d is the gap between the heater and heat sink; α is the temperature coefficient of resistance; and
3 Experimental Results
The resonator characterization is performed using a four-port Keysight vector network analyzer (VNA). Then, an oscillator performance is evaluated, and finally, mass and pressure sensing results are discussed.
3.1 Thermal–Piezoresistive Resonator Characterization
The open-loop frequency response for II-bar TPR is plotted in Figure 8A for operation in vacuum and air. The bulk TPR achieves a Q of 10,687 at 5.13 MHz for a bias power of 1 mW in a vacuum (1 mTorr). In the ambient pressure, the TPR has a Q of 3,233 at 5.1 MHz for a bias power of 2.6 mW. The differential configuration ensures feedthrough reduction enabling a stopband rejection (SBR) of 20 dB. As expected, squeeze film damping has significantly reduced the Q in air. The transconductance (gm) is extracted by converting the S-parameters to Y-parameters. The bulk TPR has a gm of 5.7 µS and 5.3 µS in vacuum and air, respectively, as shown in Figure 8B. Figure 8C summarizes the bias and measurement conditions. Thus, to get a gm similar to that in vacuum requires 2.5X the bias power when operating at the ambient pressure level.
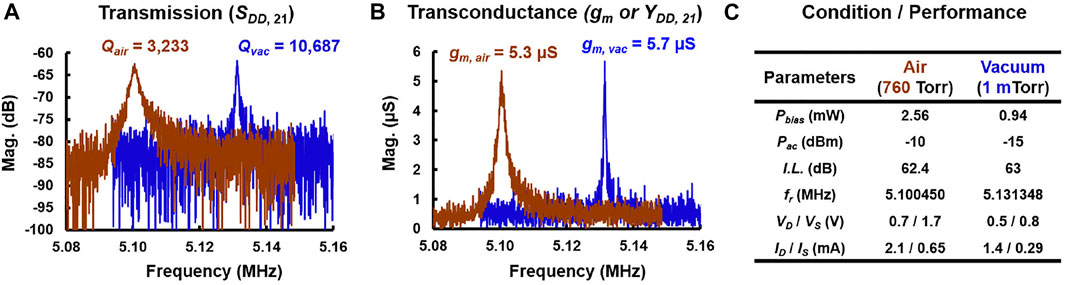
FIGURE 8. Measured frequency response of II-bar in vacuum (blue) and air (brown). (A) S-parameter transmission magnitude plot with Q of 10,687 and 3,233 in vacuum and air, respectively. (B) Converted Y-parameter magnitude, that is, transconductance (gm) of about 5 µS in vacuum and air. (C) Bias conditions and measured parameters are summarized in the table.
The flexural TPR demonstrates a Q of 3,691 in vacuum at 2 MHz for a bias of 1.67 mW. For operation in air, the Q degrades to 996 at 2 MHz for the same bias, as depicted in Figure 9A. The SBR is almost doubled to 40 dB because of the separation of drive and sense resistors, that is, reduced feedthrough capacitance. Figure 9B shows the extracted gm of 102 µS and 27 µS in vacuum and air, respectively. Figure 9C summarizes the bias and measurement conditions. The flexural TPRs achieve 20X gm compared to the bulk mode because of smaller Cth despite significantly lower Q.
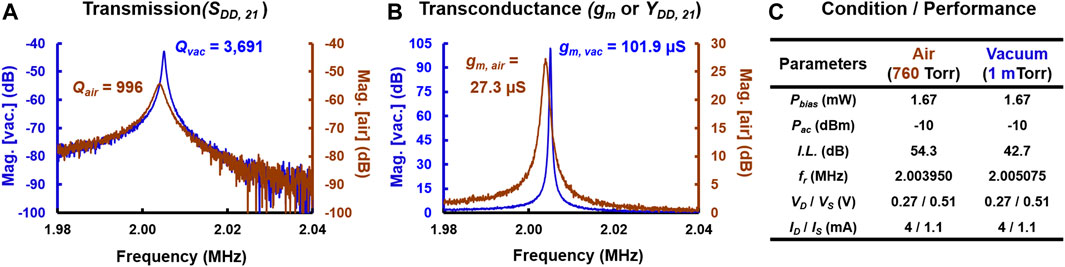
FIGURE 9. Measured frequency response of CCB in vacuum (blue) and air (brown). (A) S-parameter transmission magnitude plot with Q of 3,691 and 996 in vacuum and air, respectively. (B) Converted Y-parameter magnitude, that is, transconductance (gm) of about 102 µS in vacuum and 27 µS in air. (C) Bias conditions and measured parameters are summarized in the table.
3.2 Thermal-Piezoresistive Oscillator Measurement
The closed-loop performance of the device is evaluated using a lock-in amplifier with PLL. The phase noise (PN) plots for II-bar and CCB TPO in air are depicted in Figure 10A. The bulk mode TPO achieves a phase noise of −72 dBc/Hz at a 1 kHz offset, and an expected far-from carrier (10 kHz) PN of −76 dBc/Hz. The flexural mode on the other hand achieves a PN of −98 dBc/Hz and −100 dBc/Hz at 1 and 10 kHz offsets, respectively. The II-bar’s low gm severely hampers its phase noise. The frequency stability is extracted from Allan deviation (ADev) plots, as shown in Figure 10B. A gate time of 1 and 10 ms was used to collect the oscillation frequency of II-bar and CCB, respectively. The best-case ADev of 85 ppb is reached for an integration time of 0.8 s for II-bar. The CCB requires an integration time of 70 ms for an ADev of 72 ppb. This corresponds to a frequency resolution of 0.43 and 0.144 Hz for II-bar and CCB, respectively. This results in a mass resolution of 19.5 fg. This is more than sufficient for a PM2.5 sensor (Chang et al., 2016).
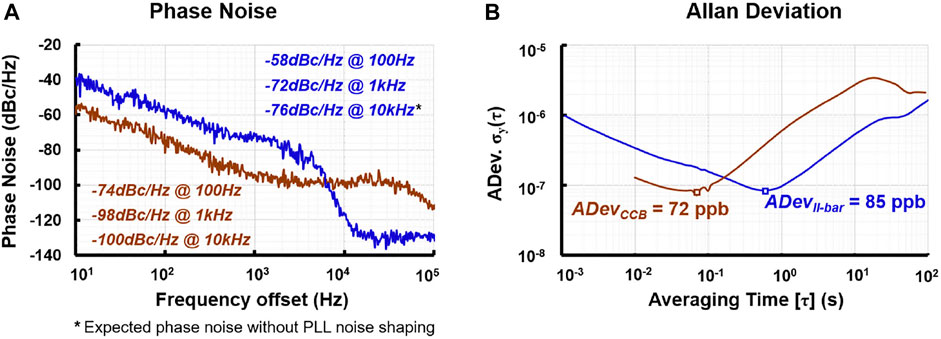
FIGURE 10. Oscillator performance evaluation of II-bar (blue) and CCB (brown). (A) Phase noise response showing far-from-carrier noise of −100 dBc/Hz for CCB and −76 dBc/Hz for II-bar. (B) Frequency stability evaluation, showing Allan deviation of 72 and 85 ppb for CCB and II-bar, respectively, in air.
3.3 Mass Sensing
The II-bar is set up as an oscillator with the use of a lock-in amplifier + PLL. The nano-printer head is aligned with the proof mass. Once a droplet lands on the device, the solvent is allowed to evaporate and leave Ag particles only. This ensures uniform mass deposition. Figure 11A shows the real-time nano-printing experiment. The frequency shift is 25 kHz per droplet. The impact force of the droplet causes a frequency shift greater than the PLL bandwidth (50 kHz). This results in discontinuity after each droplet impact due to loss of tracking in PLL. As the proof mass of the II-bar has constant velocity, the frequency shift is independent of droplet position. A total of seven droplets were printed. The corresponding frequency vs. added mass is depicted in Figure 11B and showed excellent linearity with R2 of 0.999. Based on the datasheet, 1 pL droplet should correspond to 0.5 ng of Ag after solvent evaporation. A frequency shift of 25 kHz corresponds to a mass of 1.22 ng using the FEM sensitivity of 20.49 kHz/ng. Based on Figure 11B, we can observe the sensitivity is 20 kHz/ng. Figure 11C shows the optical image of the Ag droplets deposited on the TPO.
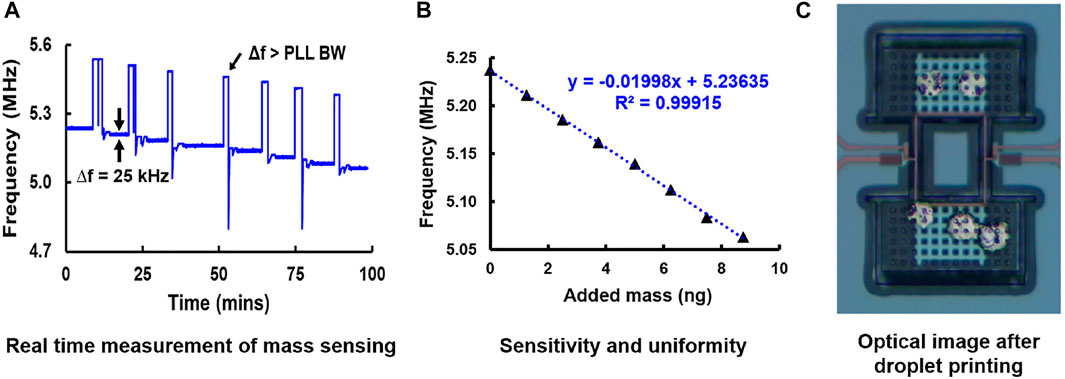
FIGURE 11. II-bar TPO performance evaluation for mass sensing. (A) Real-time frequency measurements for the printing of seven Ag 1 pL droplets. The impact force causes the frequency shift to exceed the PLL bandwidth. (B) Frequency vs. added mass shows excellent linearity with R2 of 0.999 and mass sensitivity of 20 kHz/ng. (C) OM image of the Ag particles deposited on the proof mass.
3.4 Resonant Pirani Gauge
A resistance or frequency output is preferred for a pressure sensor because of its ease of measurement using low-power and low-cost digital circuits. Ring down can be employed to obtain oscillator amplitude (i.e., gm) and Q using the simple digital circuit (Polunin et al., 2015). The CCB is placed in an air-tight chamber, and the pressure varied in steps to evaluate its performance in open-loop (resonator) and closed-loop (oscillator). Figure 12 shows the typical Pirani gauge operation of CCB. The temperature vs. bias power for constant pressure is plotted in Figure 12A while the resistance vs. pressure graph is presented in Figure 12B. Poly-1 acts as a temperature sensor because of its TCR of 867 ppm/°C. For a bias power of 1.1 mW, the temperature change was extracted to be 54°C, that is, Joule heating results in an average temperature of 79°C for Poly-1 heater under 1.1 mW bias power. The thermal resistance is extracted to be 43 k [K/W] and 49 k [K/W] in air and vacuum, respectively. Ideally, we expect the difference to be much larger for a greater detection range. In the current design, the TPR was not optimized as a Pirani gauge and thus has a very small active area. The linear sensing range for Poly-1 resistor is 2–100 Torr while that of Poly-2 resistor is 4–760 Torr. The sensing range can be extended in the low-pressure regime by modification of the TPR structure. A TPR with lower fr, that is, a longer beam along with thinner oxide over the active area will extend the Pirani gauge linear pressure range in mTorr.
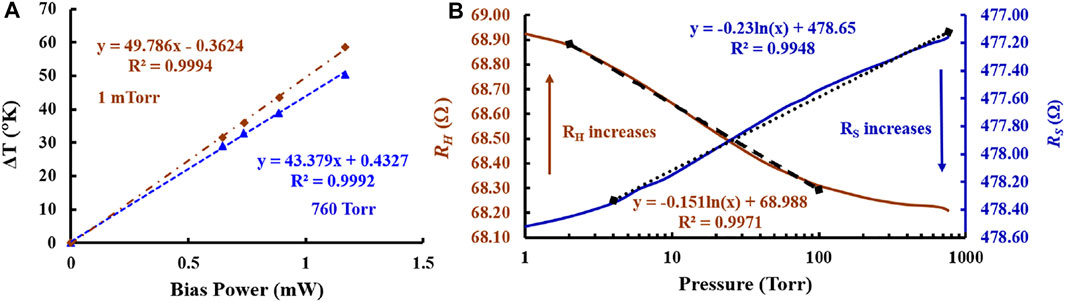
FIGURE 12. Pirani gauge operation showing (A) temperature-bias power characteristics of Poly-1 for 1 mTorr (brown) and 760 Torr (blue) and (B) resistance vs. pressure graph for the heater (RH) [brown] and sensing (RS) [blue] resistances.
Next, the resonant mode is explored. Figure 13A depicts the frequency vs. pressure graph showing a linear in log relationship with a turnover point at 300 Torr. The devices will experience squeeze film damping at higher pressure. Thus, the fr is expected to increase with decreasing pressure. At certain low pressure, the squeeze film stiffness becomes dominant and causes a change in fr for decreasing pressure with reduced sensitivity (Li et al., 2019), (Blech, 1983). This turnover point occurs in the 200–300 Torr region for four different dies. The frequency sensitivity is −1.08 kHz/decade up to 300 Torr and +707 Hz/decade below 300 Torr. The Q vs. pressure is plotted in Figure 13B. The Q plot also shows the turnover at 300 Torr with a slope of −229/decade above 300 Torr and −72/decade below 300 Torr.

FIGURE 13. Resonant sensor mode. (A) Measured frequency vs. pressure showing a linear in log relationship with a turnover point at 300 Torr. (B) Measured Q vs. pressure plot depicting the linear in log relationship with a turnover at 300 Torr. A bias of 1.1 mW and 0 dBm drive was used in these measurements.
Finally, we combined all of these effects into a single parameter “gm” to implement the resonant Pirani gauge (RPG). Figure 14 shows a linear relationship for gm in 2–760 Torr, thus extending the pressure sensing range using a single parameter.
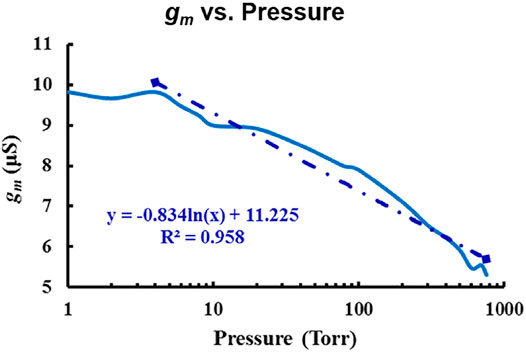
FIGURE 14. Resonant Pirani gauge (RPG) operation. Measured gm vs. pressure showing a linear trend in 2–760 Torr.
4 Discussion
The resonator response closely agrees with the FEM simulation. Substituting the measurement Q in FEM provides a simulated gm of 94 µS for the bias conditions of Figure 10. The importance of Cth for TPR performance is seen from the extracted gm for II-bar and CCB resonators. The designer can optimize the TPR using the presented model. In addition, the electrical equivalent circuit facilitates co-simulation with a sustaining amplifier to obtain oscillator performance, that is, specification for a potential resonant sensor.
The mass sensing performance of the CMOS-MEMS II-bar is compared with prior works in Table 3. The presented II-bar achieves mass sensitivity (MS) of 20.4 kHz/ng. In Kim et al. (2006), the authors used a silicon on insulator (SOI) wafer to fabricate an SCS cantilever with fr of 80 kHz. The mass sensing limit of 10 fg was observed for the flow of N2 gas. The thin-film piezoelectric-on-substrate (TPoS) is widely used for resonant sensors due to its higher Q over traditional piezoelectric devices. A 27-MHz length extension mode using AlN TPoS achieved a mass sensitivity of 4.2 kHz/ng (Harrington et al., 2010). A ZnO film bulk acoustic resonator (FBAR) demonstrated a sensitivity of 3.3 MHz/ng for a device operating at 870 MHz (Johnston et al., 2009), which is three orders higher than that achieved in this work. An SOI II-bar self-oscillating (Hajjam et al., 2011) at 4.6 MHz demonstrated a sensitivity of 31 kHz/ng and is comparable to that realized by the CMOS-MEMS II-bar. A flexural CMOS-MEMS flapping mode TPR has a sensitivity of 1.9 kHz/ng. Thus, the presented CMOS-MEMS device has performance comparable to SOI implementation and is only inferior to FBAR mass sensors.
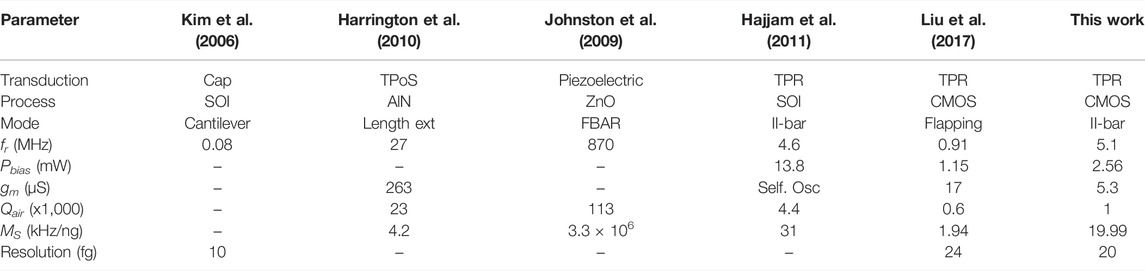
TABLE 3. Performance comparison with prior works for mass sensing.
The performance of the prototype RPG using CCB TPO is compared against other reported MEMS pressure sensors in Table 4. A CMOS-MEMS based capacitance change (∆C) achieves a sensing range of 375–2,200 Torr (Liao et al., 2021). Low pressure ranges typically employ a Pirani gauge. An SOI implementation in (Lecler et al., 2019) achieves a sensing range of 0.03–3 Torr by measuring the resistance change (∆R). A piezoresistive pressure sensor can detect pressure differential in 0–1,000 Torr (Lee et al., 2014). The SOI TPR is employed as a resonant pressure sensor in Guo et al. (2013). A linear frequency change (∆f) was demonstrated over 300–600 Torr. A conceptual resonant Pirani gauge (RPG) of Li et al. (2019) achieved a linear range of 0.02–760 Torr by combining ∆f, Q, and ∆R. This would require a complex digital signal processor for an experimental realization. A similar extension in the sensing range can be achieved by employing a TPO. The thermal-drive and piezoresistive sensing include the effect of traditional Pirani gauge sensors in resonant behavior. By measuring the gm, the presented CCB TPO achieved a sensing range of 2–760 Torr despite the significantly smaller sensing area (1/250) in Li et al. (2019). The sensing range can be further increased by using a larger drive and sensing area, that is, larger polysilicon resistors.
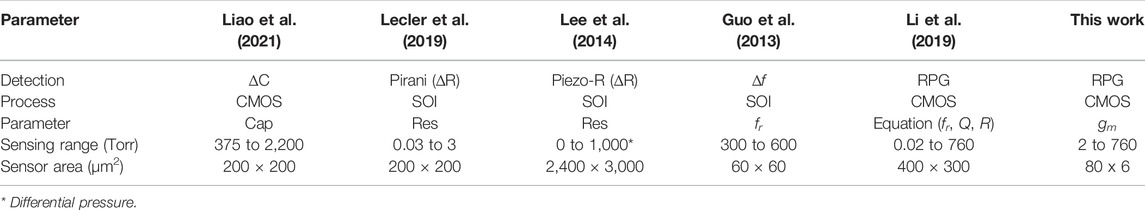
TABLE 4. Performance comparison with prior works for pressure sensing.
5 Conclusion
This article covered the multi-domain interaction in the working of a thermal–piezoresistive resonator. The design flow was explained with a mathematical model and an equivalent electrical circuit for performance estimation. Steps to overcome the limitation of FEM software in the simulation of the frequency response were described. The open-loop response of a bulk (5 MHz) and flexural mode (2 MHz) TPR was characterized, and performance-critical parameters were identified and verified for optimal design. Evaluation of the thermal-piezoresistive oscillator was carried out using a lock-in amplifier + PLL. Frequency stability measurements were performed to estimate the limits for resonant sensing.
Mass sensing experiments were carried out on II-bar using a nano-ink jet printer. A frequency shift of 25 kHz was observed for a 1.22 ng Ag droplet corresponding to a mass sensitivity of 20 kHz/ng. The device has a mass resolution of 20 fg and can be used as a high-sensitivity PM2.5 sensor.
Next, the pressure sensing capability of the flexural mode was explored. The CCB combined the Pirani and resonant type with quality factor change to achieve an extended sensing range. Instead of requiring the measurement of fr, Q, R, and additional computation, the proposed device achieved the same result by monitoring a single easy-to-measure parameter like gm. The device achieved a sensing range of 2–760 Torr for an area of just 80 µm × 6 µm. The sensing range can be further extended in the low-pressure regime by employing a larger drive and sense area.
Data Availability Statement
The raw data supporting the conclusion of this article will be made available by the authors, without undue reservation.
Author Contributions
All authors listed have made a substantial, direct, and intellectual contribution to the work and approved it for publication.
Funding
This work was supported in part by the Ministry of Science and Technology (MOST) of Taiwan under grant 108-2218-E-007-011 and in part by the Toward World-Class University Project.
Conflict of Interest
The authors declare that the research was conducted in the absence of any commercial or financial relationships that could be construed as a potential conflict of interest.
Publisher’s Note
All claims expressed in this article are solely those of the authors and do not necessarily represent those of their affiliated organizations or those of the publisher, the editors, and the reviewers. Any product that may be evaluated in this article, or claim that may be made by its manufacturer, is not guaranteed or endorsed by the publisher.
Acknowledgments
The authors appreciate the help of the Taiwan Semiconductor Research Institute (TSRI), Taiwan, and TSMC, for providing CAD tools and device manufacturing. They also appreciate the Center for Nanotechnology, Materials Science and Microsystems (CNMM), National Tsing Hua University, for their support in the device post-process.
Footnotes
1Autonomous, Author. (1999). “IEEE Standard Definitions of Physical Quantities for Fundamental Frequency and Time Metrology-Random Instabilities,” in IEEE Std 1139-1999, 1–40. doi:10.1109/IEEESTD.1999.90575
References
Bedair, S. S., and Fedder, G. K. (2004). “CMOS MEMS Oscillator for Gas Chemical Detection,” in IEEE SENSORS, Vienna, Austria, 955–958. doi:10.1109/ICSENS.2004.1426330
Blech, J. J. (1983). On Isothermal Squeeze Films. J. Lubr. Technol. 105 (4), 615–620. doi:10.1115/1.3254692
Chang, E.-C., Chen, C.-C., and Li, S.-S. (2016). “Real-time Mass Sensing and Dynamic Impact Monitoring of Printed Pico-Liter Droplets Realized by a Thermal-Piezoresistive Self-Sustained Oscillator,” in IEEE International Conference on Micro Electro Mechanical System (MEMS), Shanghai, China, 1078–1081. doi:10.1109/MEMSYS.2016.7421821
Chen, C.-Y., Zope, A. A., Li, M.-H., and Li, S.-S. (2019). “A Generic TiN-C Process for CMOS FEOL/BEOL-embedded Vertically-Coupled Capacitive and Piezoresistive Resonators,” in International Conference on Solid-State Sensors, Actuators and Microsystems (TRANSDUCERS), Berlin, Germany, 531–534. doi:10.1109/TRANSDUCERS.2019.8808683
Chen, C. Y., Li, M. H., and Li, S. S. (2018). CMOS-MEMS Resonators and Oscillators : a Review. Sensors Mater. 30 (4), 733–756. doi:10.18494/SAM.2018.1857
Göktaş, H. (2019). Towards an Ultra-sensitive Temperature Sensor for Uncooled Infrared Sensing in CMOS-MEMS Technology. Micromachines 10 (2), 108. doi:10.3390/mi10020108
Guo, X., Yi, Y.-b., and Pourkamali, S. (2013). Thermal-piezoresistive Resonators and Self-Sustained Oscillators for Gas Recognition and Pressure Sensing. IEEE Sensors J. 13 (8), 2863–2872. doi:10.1109/JSEN.2013.2258667
Hajjam, A., Wilson, J. C., Rahafrooz, A., and Pourkamali, S. (2011). “Self-sustained Micromechanical Resonant Particulate Microbalance/counters,” in IEEE International Conference on Micro Electro Mechanical System (MEMS), Cancun, Mexico, 629–632. doi:10.1109/MEMSYS.2011.5734503
Harrington, B. P., Abdolvand, R., Hajjam, A., Wilson, J. C., and Pourkamali, S. (2010). “Thin-film Piezoelectric-On-Silicon Particle Mass Sensors,” in IEEE International Frequency Control Symposium (IFCS), Newport Beach, CA, USA, 238–241. doi:10.1109/FREQ.2010.5556336
Hauer, B. D. (2013). “Effective Mass Calculations Using COMSOL Multiphysics ® for Thermomechanical Calibration,” in COMSOL conference, Boston, MA. Available at https://www.comsol.com/paper/download/187999/hauer_presentation.pdf.
Hsu, T.-H., Zope, A. A., Li, M.-H., and Li, S.-S. (2020). “A Compact Monolithic CMUT Receiver Front-End in a TiN-C CMOS-MEMS Platform,” in IEEE International Ultrasonics Symposium (IUS), NV, USA: Las Vegas, 1–4. doi:10.1109/IUS46767.2020.9251733
Huang, Y., and Mason, A. J. (2013). Lab-on-CMOS Integration of Microfluidics and Electrochemical Sensors. Lab. Chip 13 (19), 3929–3934. doi:10.1039/c3lc50437a
Jie, Y., Pei, J. Y., Jun, L., Yun, G., and Wei, X. (2013). “Smart Home System Based on IOT Technologies,” in International Conference on Computational and Information Sciences, Shiyang, China, 1789–1791. doi:10.1109/ICCIS.2013.468
Johnston, M. L., Kymissis, I., and Shepard, K. L. (2009). “An Array of Monolithic FBAR-CMOS Oscillators for Mass-Sensing Applictions,” in International Conference on Solid-State Sensors, Actuators and Microsystems (TRANSDUCERS), Denver, CO, USA, 1626–1629. doi:10.1109/SENSOR.2009.5285771
Kim, S., Ono, T., and Esashi, M. (2006). “Mass Detection Using Capacitive Resonant Silicon Sensor,” in IEEE SENSORS, Daegu, Korea (South), 1285–1288. doi:10.1109/ICSENS.2007.355864
Lecler, S., Marconot, O., and Frechette, L. G. (2019). “SiO2/SiN Membranes as MEMS Pirani Gauges for Wide Pressure Measurement Range,” in IEEE SENSORS, Montreal, QC, Canada, 1–4. doi:10.1109/SENSORS43011.2019.8956864
Lee, J.-S., Yoo, E.-S., Park, C.-H., An, J.-E., Park, C. G., and Song, J. W. (2014). “Development of a Piezoresistive MEMS Pressure Sensor for a Precision Air Data Module,” in International Conference on Control, Automation and Systems (ICCAS), Gyeonggi-do, Korea (South), 874–878. doi:10.1109/ICCAS.2014.6987904
Leeson, D. B. (1966). A Simple Model of Feedback Oscillator Noise Spectrum. Proc. IEEE 54 (2), 329–330. doi:10.1109/PROC.1966.4682
Li, K.-H., Chen, C.-C., Li, M.-H., and Li, S.-S. (2014). “A Self-Sustained Nanomechanical Thermal-Piezoresistive Oscillator with Ultra-low Power Consumption,” in IEEE International Electron Devices Meeting (IEDM), San Francisco, CA, USA, 554–557. doi:10.1109/IEDM.2014.7047099
Li, M.-H., Chiu, W.-C., Chou, C.-Y., Pillai, G., and Li, S.-S. (2019). Conceptual Design of a Resonant Pirani Gauge toward Wide-Range Pressure Sensing. IEEE Sens. Lett. 3, 1–4. doi:10.1109/LSENS.2019.2949047
Liao, P.-W., Hong, H.-C., and Chiu, Y. (2021). “A CMOS-MEMS Capacitive Pressure Sensor with Differential Sensing Electrodes and On-Chip Frequency Output Circuits,” in International Conference on Solid-State Sensors, Actuators and Microsystems (TRANSDUCERS), Kaohsiung, Taiwan, 90–93. doi:10.1109/Transducers50396.2021.9495427
Liu, T.-Y., Chu, C.-C., Li, M.-H., Liu, C.-Y., Lo, C.-Y., and Li, S.-S. (2017). “CMOS-MEMS Thermal-Piezoresistive Oscillators with High Transduction Efficiency for Mass Sensing Applications,” in International Conference on Solid-State Sensors, Actuators and Microsystems (TRANSDUCERS), Kaohsiung, Taiwan, 452–455. doi:10.1109/TRANSDUCERS.2017.7994084
Lu, M. S.-C. (2016). “CMOS MEMS Biosensors,” in Encyclopedia of Nanotechnology. Editor B. Bhushan (Dordrecht: Springer), 532–540. doi:10.1007/978-94-017-9780-1_198
Mastrangelo, C. H., and Muller, R. S. (1991). Microfabricated Thermal Absolute-Pressure Sensor with On-Chip Digital Front-End Processor. IEEE J. Solid-State Circuits 26 (12), 1998–2007. doi:10.1109/4.104194
Maugin, G. A. (1999). “The Thermomechanics of Nonlinear Irreversible Behaviors : an Introduction,” in World Scientific Series on Nonlinear Science (River Edge, NJ: World Scientific), 46.
Miller, J. M. L., Zhu, H., Heinz, D. B., Chen, Y., Flader, I. B., Shin, D. D., et al. (2018). Thermal-piezoresistive Tuning of the Effective Quality Factor of a Micromechanical Resonator. Phys. Rev. Appl. 10, 044–055. doi:10.1103/physrevapplied.10.044055
Ming-Han Tsai, M. H., Chih-Ming Sun, C. M., Chuanwei Wang, C. W., Jrhoung Lu, J., and Weileun Fang, W. (2008). “A Monolithic 3D Fully-Differential CMOS Accelerometer,” in IEEE International Conference on Nano/Micro Engineered and Molecular Systems, Sanya, China, 1067–1070. doi:10.1109/NEMS.2008.4484503
Nguyen, C. T.-C., and Howe, R. T. (1999). An Integrated CMOS Micromechanical Resonator High-Q Oscillator. IEEE J. Solid-State Circuits 34 (4), 440–455. doi:10.1109/4.753677
Nguyen, C. T.-C., and Howe, R. T. (1993). “CMOS Micromechanical Resonator Oscillator,” in IEEE International Electron Devices Meeting (IEDM), Washington, DC, USA, 199–202. doi:10.1109/IEDM.1993.347242
Parsons, P. (1993). Resonant Sensors. IEEE Colloquium Meas. Using Reson. Sens. 2/1–2/2. Available at https://ieeexplore.ieee.org/document/289062.
Polunin, P., Yang, Y., Atalaya, J., Ng, E., Strachan, S., Shoshani, O., et al. (2015). “Characterizing MEMS Nonlinearities Directly: The Ring-Down Measurements,” in International Conference on Solid-State Sensors, Actuators and Microsystems (TRANSDUCERS), Anchorage, AK, USA, 2176–2179. doi:10.1109/TRANSDUCERS.2015.7181391
Rahafrooz, A., and Pourkamali, S. (2010). “Fully Micromechanical Piezo-Thermal Oscillators,” in IEEE International Electronic Devices Meeting (IEDM), San Francisco, CA, USA, Dec. 2010
Rong, W., Vanan, G. T., and Phillips, M. (2016). “The Internet of Things (IoT) and Transformation of the Smart Factory,” in International Electronics Symposium (IES), Denpasar, Indonesia, 399–402. doi:10.1109/ELECSYM.2016.7861039
Steeneken, P. G., Le Phan, K., Goossens, M. J., Koops, G. E. J., Brom, G. J. A. M., Van der Avoort, C., et al. (2011). Piezoresistive Heat Engine and Refrigerator. Nat. Phys. 7 (4), 354–359. doi:10.1038/nphys1871
Tsai, J. M., Daneman, M., Boser, B., Horsley, D., Rais-Zadeh, M., Tang, H. Y., et al. (2015). “Versatile CMOS-MEMS Integrated Piezoelectric Platform,” in International Conference on Solid-State Sensors, Actuators and Microsystems (TRANSDUCERS), Anchorage, AK, USA, 2248–2251. doi:10.1109/TRANSDUCERS.2015.7181409
Tsai, M.-H., Liu, Y.-C., and Fang, W. (2012). A Three-Axis CMOS-MEMS Accelerometer Structure with Vertically Integrated Fully Differential Sensing Electrodes. J. Microelectromech. Syst. 21 (6), 1329–1337. doi:10.1109/JMEMS.2012.2205904
Vidal-Álvarez, G., Marigó, E., Torres, F., and Barniol, N. (2016). Fabrication and Measurement of a Suspended Nanochannel Microbridge Resonator Monolithically Integrated with CMOS Readout Circuitry. Micromachines 7, 40. doi:10.3390/mi7030040
Wang, C.-C., Tsai, C.-Y., Chen, T.-L., and Liao, S.-H. (2013). An Optimal Design of Thermal-Actuated and Piezoresistive-Sensed CMOS-MEMS Resonant Sensor. J. Micromech. Microeng. 23 (11), 115015. doi:10.1088/0960-1317/23/11/115015
Williams, K. R., Gupta, K., and Wasilik, M. (2003). Etch Rates for Micromachining Processing-Part II. J. Microelectromech. Syst. 12 (6), 761–778. doi:10.1109/JMEMS.2003.820936
Xiaoyuan Xia, X., Ping Zhou, Z., and Xinxin Li, L. (2008). “Effect of Resonance-Mode Order on Mass-Sensing Resolution of Microcantilever Sensors,” in IEEE SENSORS, Lecce, Italy., 577–580. doi:10.1109/ICSENS.2008.4716505
Zope, A. A., Chang, J.-H., Liu, T.-Y., and Li, S.-S. (2020). A CMOS-MEMS Thermal-Piezoresistive Oscillator for Mass Sensing Applications. IEEE Trans. Electron Devices 67 (3), 1183–1191. doi:10.1109/TED.2020.2969967
Keywords: CMOS-MEMS, thermal-piezoresistive resonator (TPR), thermal-piezoresistive oscillator (TPO), resonant sensor, mass sensor, pressure sensor
Citation: Zope A and Li S-S (2022) CMOS-MEMS Thermal-Piezoresistive Resonators and Oscillators for Sensors. Front. Mech. Eng 8:898668. doi: 10.3389/fmech.2022.898668
Received: 17 March 2022; Accepted: 19 April 2022;
Published: 09 June 2022.
Edited by:
Massimo Mastrangeli, Delft University of Technology, NetherlandsCopyright © 2022 Zope and Li. This is an open-access article distributed under the terms of the Creative Commons Attribution License (CC BY). The use, distribution or reproduction in other forums is permitted, provided the original author(s) and the copyright owner(s) are credited and that the original publication in this journal is cited, in accordance with accepted academic practice. No use, distribution or reproduction is permitted which does not comply with these terms.
*Correspondence: Sheng-Shian Li, c3NsaUBteC5udGh1LmVkdS50dw==