Abstract
Since most of the UHV/EHV transmission lines pass through mountainous areas, the impact of rocks caused by landslides or collapses may cause partial deformation of the iron tower, or even collapse, seriously threatening the safety operation of transmission lines. To analyze the dynamic response characteristics and influencing factors of the rolling rock impacting the transmission line tower, a simulation model for the 500-kV steel suspension tower impacted by the falling rock was established by finite element analysis software LS-DYNA in this study, and dynamic response characteristics of the rolling rock impacting the steel tower were analyzed under different conditions. Results show that the stress on the tower foundation is closely related to the mass, volume, and initial velocity of the rolling stone. Under the same rolling stone speed, the stress on the tower foundation increases as the mass of the rolling stone increases. The maximum increase in peak stress generated between the two can reach 110%; when rolling stones of the same size collide with different initial velocities, the location and magnitude of the peak stress of the tower foundation are different. When the initial speed of the rolling stones is more remarkable than 15 m/s, the tower foundation of the hit area increased significantly, causing the tower base to be directly destroyed.
1 Introduction
Rolling stones are often accompanied by instability of landslides. The so-called rolling stones refer to one of the movement methods such as falling, rebounding, jumping, rolling, or sliding after the rock of an individual geological mass is unstable for some reason. Alternatively, a dynamic evolutionary process that moves quickly down the slope and finally stops near a relatively gentle zone or obstacle (Zhang et al., 2004; Huang and Liu, 2009; Tang et al., 2019). Rolling stone incidents are generally sudden and random, so it is difficult to predict and control rolling stone disasters. At present, research practices on rolling stones impacting critical infrastructure have focused on following issues: influencing factors of the rolling stone motion characteristics, the impact response of rolling stones on the pier, the impact force of rolling stones on reinforced concrete slabs, and the impact characteristics of rolling stones on various cushioning materials. Through many experiments and simulation analyses, movement characteristics, impact force calculation theory, and the impact response of rolling stones on various cushioning materials were summarized (Garin, 1958; Yang and Guan, 1996; Pichler et al., 2005; Kawahara and Muro, 2006a; Yuan et al., 2014). However, due to the particularity of structures of the iron towers for power transmission lines and the complexity of the rolling stone movement path, the impact of the rolling stone on different types of parts of the tower will produce different dynamic responses. The trajectory of the rolling rock module along a sloped surface due to a landslide by rockfall, and jumping heights and kinetic energy of rolling rocks were calculated (Labiouse, 1996; Kawahara and Muro, 2006b; Pichler et al., 2006; Wang, 2016; Xiao, 2017; Li et al., 2021). Based on moving characteristics of rolling stones, the dynamic simulation model for the 500-kV suspension steel tower impacted by rockfall was established by LS-DYNA. The dynamic response of the tower foundation under different impacting conditions was calculated, and the tower deformation, the magnitude of the peak stress and the location of the peak occurrence, and the speed of the rolling stone were studied. Results provide a reference for the safety assessment of transmission towers and the design of protective structures.
2 Materials and methods
2.1 Problem description
This study used LS-DYNA software to study the impact response characteristics and process of a rolling stone impacting an iron tower. Generally, the impact position of a rolling stone mainly occurs at the tower’s base, and the relative stiffness of the tower base was relatively small. The speed changes, so this simulation assumed that the rolling stone was a rigid body, and the tower truss and the tower base adopted elastoplastic bodies. To reduce the calculation time, the actual rolling process of the rolling stone was simplified in the model, and the rolling stone was directly set at the contact point with the tower base.
2.2 Material model and parameter determination
The concrete material models commonly used for nonlinear dynamic analysis by LS-DYNA software include the HJC material model, concrete damage model, pseudo-tensor material model, the isotropic elastoplastic model with failure, and brittle damage model. Chen Cheng and Ou Bifeng et al. (Gu, 2015; Xingmin et al,; Zou et al., 2015) analyzed and compared these material models through numerical tests and concluded that the HJC model was the most suitable for low-speed collision. The strain rate effect was more comprehensive in consideration. The prediction of uniaxial dynamic compression power was closer to the actual strength. Therefore, the HJC model is used to simulate the structure of reinforced concrete tower foundation in dynamic analysis of the transmission tower impacted by a rolling stone.
The HJC material model is developed from the JC model and mainly includes three aspects: the equation of state, the yield surface, and the damage evolution equation (Jingcai et al., 2008).
① State equation
The HJC material model uses a piecewise equation of state to describe the relationship between the concrete hydrostatic pressure and volumetric strain. As shown in Figure 1, the first linear elasticity stage (OA) satisfies the linear relationship: k = p/μ; the next stage (AB) is the transition stage, and the elastic bulk modulus at any point in this stage can be calculated by the following interpolation; the final third stage (BC) is the complete compaction stage, in which the hydrostatic pressure and volumetric strain are expressed by a cubic polynomial.
FIGURE 1
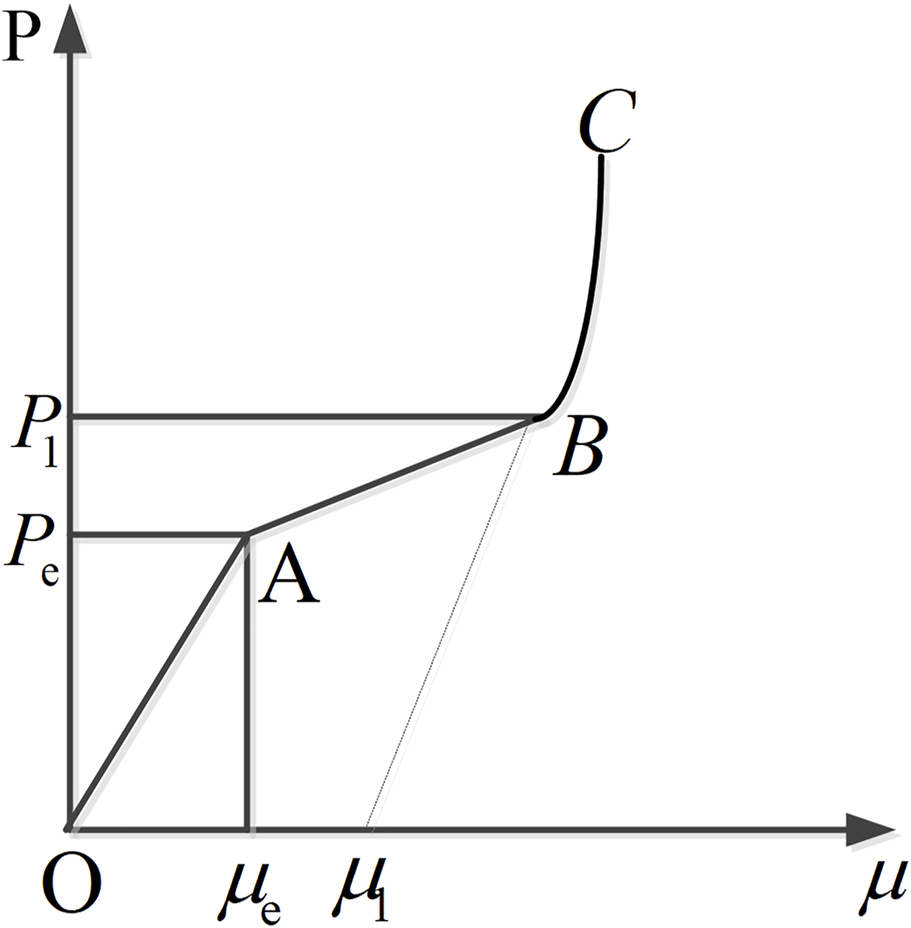
Concrete pure water stress and volume strain curve.
② Yield surface equation
The HJC material model is described by equivalent stress; then, the yield surface equation can be expressed as follows:wherewhere is the real equivalent stress, is the actual pressure, is the reference strain rate, is the strength parameter of the material, is the material damage factor, and is the static compressive strength of the concrete.
③ Damage evolution process
The damage factor of the material in the HJC model is obtained by the continuous accumulation of the equivalent plastic strain and plastic volume strain. The equation is as follows:where is the equivalent plastic strain increment, is the plastic volume strain increment, and is the fracture plastic strain under pressure, which can be obtained from the following formula:where and are the damage constants; is the maximum tensile strength.
The HJC concrete material model contains 22 parameters in LS-DYNA. In this article, the reinforced concrete tower foundation adopts the Holmquist–Johnson–Cook concrete material model (Wu et al., 2010) parameters.
2.3 Calculation model
In this study, a 500-kV Zigzag angle tension tower is taken as the research object. The nominal height of the tower is 20 m, the total height is 33.8 m, the tower material is Q235 angle steel, the specification is L36 × 4, the tower foundation is made of concrete, and the size parameter is 60 × 60 × 160mm; the calculation model diagram is shown in Figure 2. The tower body is made of the beam element beam161, and the rolling stone and tower foundation are made of solid164. The specific parameters of each material model are shown in Table 1.
FIGURE 2
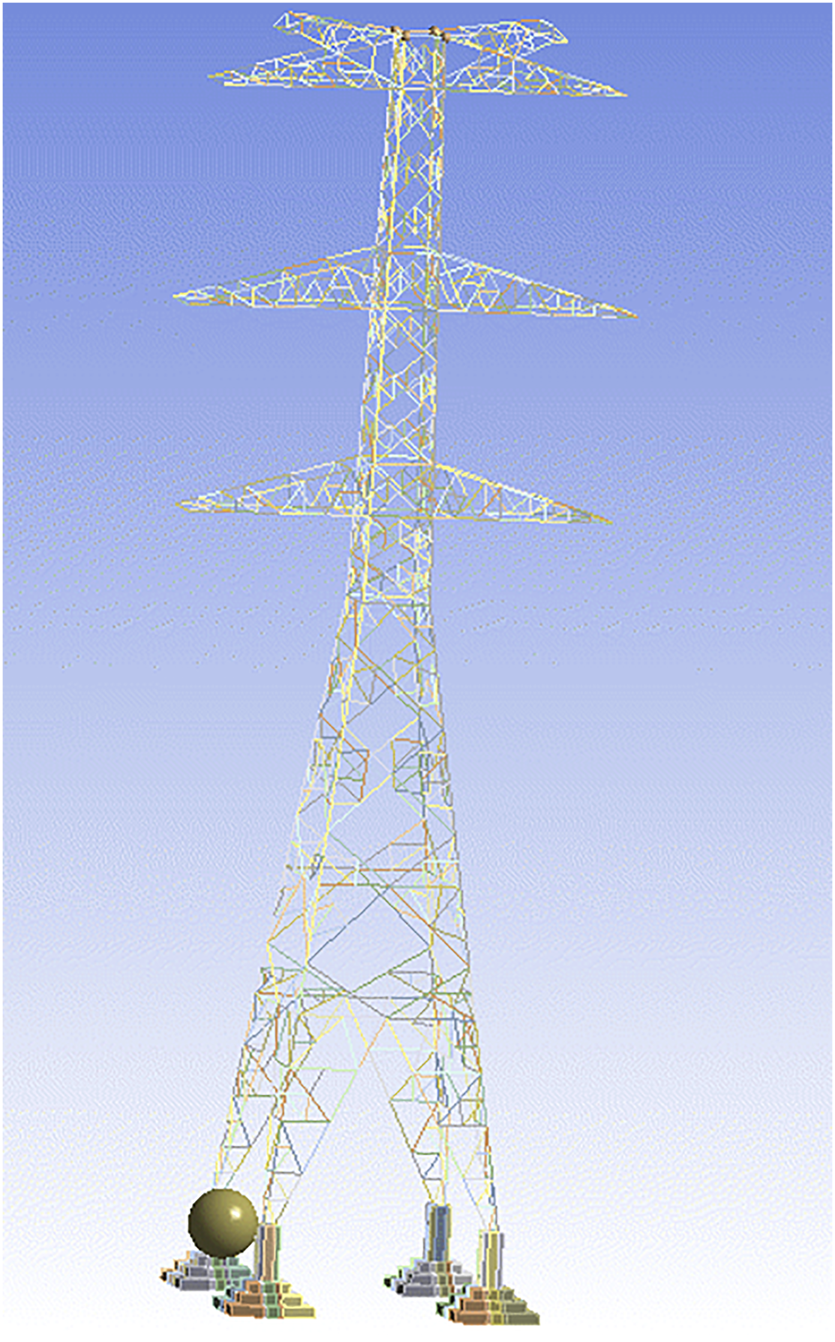
Calculation model of the stone impact tower.
TABLE 1
| Material | Density (kg/m3) | Elastic modulus (MPa) | Yield limit (MPa) | Poisson’s ratio | Compressive strength/MPa | Tensile strength/MPa |
|---|---|---|---|---|---|---|
| Rolling stone | 3300 | 2.15 | - | 0.3 | - | - |
| Angle steel | 7850 | 2.05 | 235 | 0.28 | - | 410 |
| Concrete | 2400 | 2.84 | 38.3 | 0.2 | 30 | 3.33 |
Material parameters of the rolling stone impact tower.
Regardless of rain and snow weather, the main load the tower bears is the tower itself and the dead load and wind load of the wire. In the process of a rolling stone impacting the tower foundation, the deadweight load and wind load of the wire are mainly considered, and other limitations have little influence on them, so they are ignored. To simplify the calculation, the deadweight load and wind load of the line are directly applied to the relevant nodes of the simulation model in the way of the concentrated load (Holmquist et al., 2011).
Rolling stone settings: add the density, Poisson’s ratio, elastic modulus, and other parameters of the rolling stone in engineering data, create a rolling stone model in geometry, and set the rolling stone as a rigid body in the model.
Contact setting: LS-DYNA’s automatic contact is used between the rolling stone and the tower base.
Constraint settings: the overall model is set with gravity constraints, and the bottom of the hit tower base and the other three tower bases are restricted by three degrees of freedom, as shown in Figure 3.
FIGURE 3
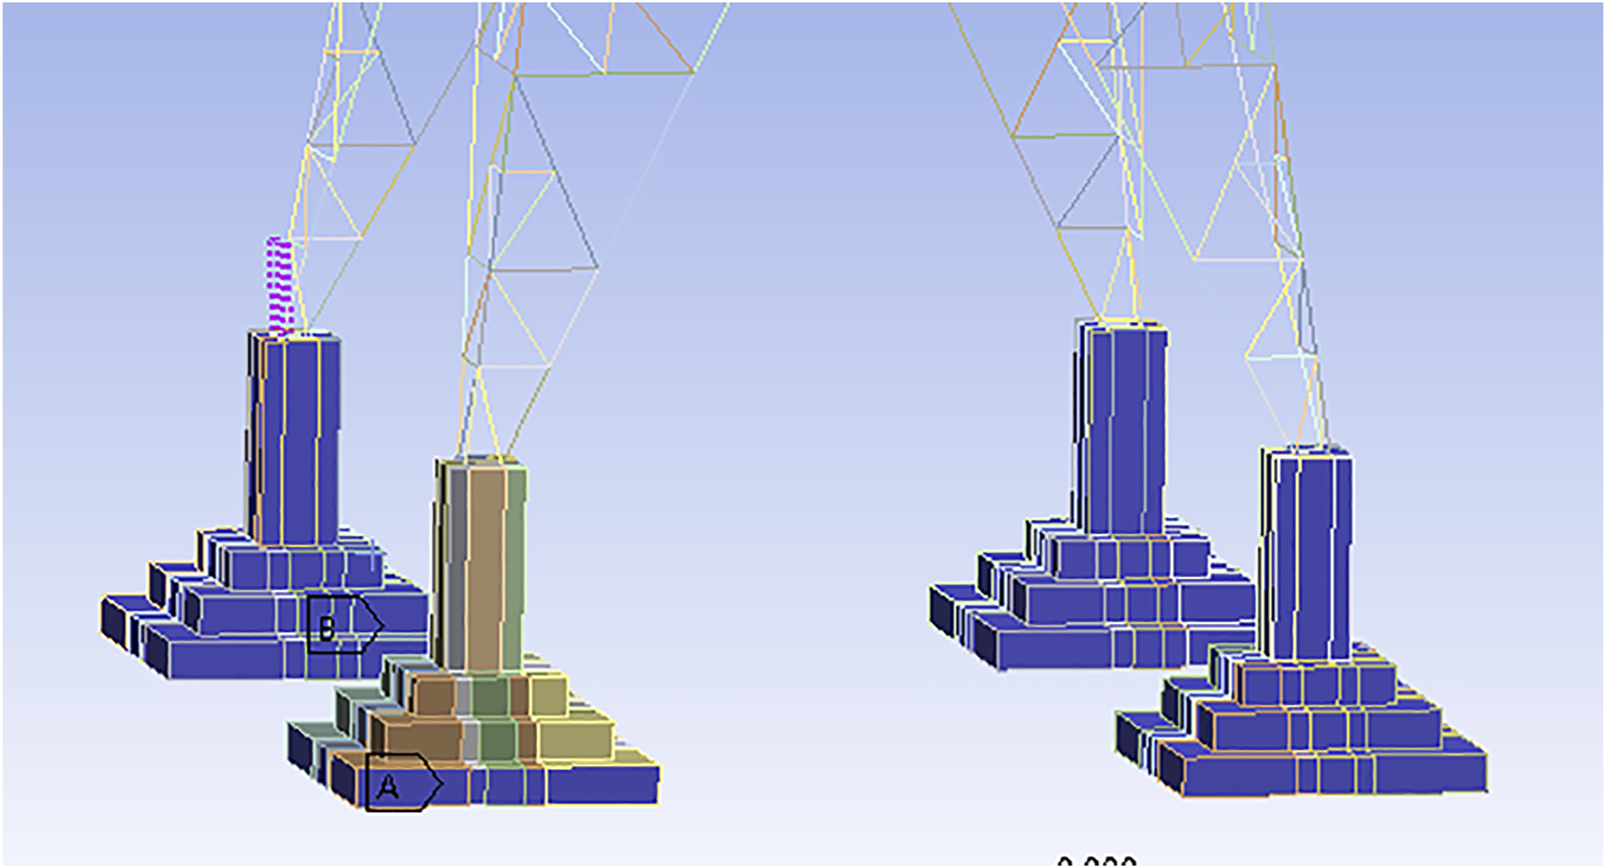
Constraint settings.
Analysis step setting: in the dynamic detailed analysis step setting (dynamic explicit), the analysis step time is set to 0.4 s, the time increment type is adaptive, and the maximum limit is 6 × 10⁻⁶s.
Output setting: in the time history output, in addition to the default output, contact stress, contact deformation, and speed change need to be added, that is, select deformation, stress, and velocity in probe, and the interval time of the field output and time history output is set to 0.02 s.
Load setting: in the initial analysis step, set the initial velocity to the reference point of the rolling stone. See the following text for the initial rate.
In the mesh division, the sphere of the tower base is divided by the multi-zone division mode, and the tower body is divided by the automatic division mode. The grid size of the sphere is 0.03 m, and the grid size of other parts is 0.04 m. After the grid is divided, the total number of nodes is 254929, and the number of grids is 201007.
2.4 Model validation
In order to verify the accuracy and rationality of the numerical model and its parameters in this study, the impact test, as shown in Figure 4, is carried out in this study, and then, the working conditions of the test are simulated by the simulation model introduced in 2.3, the maximum impact force at the impact point is extracted, and the simulation results are compared with the experimental data.
FIGURE 4
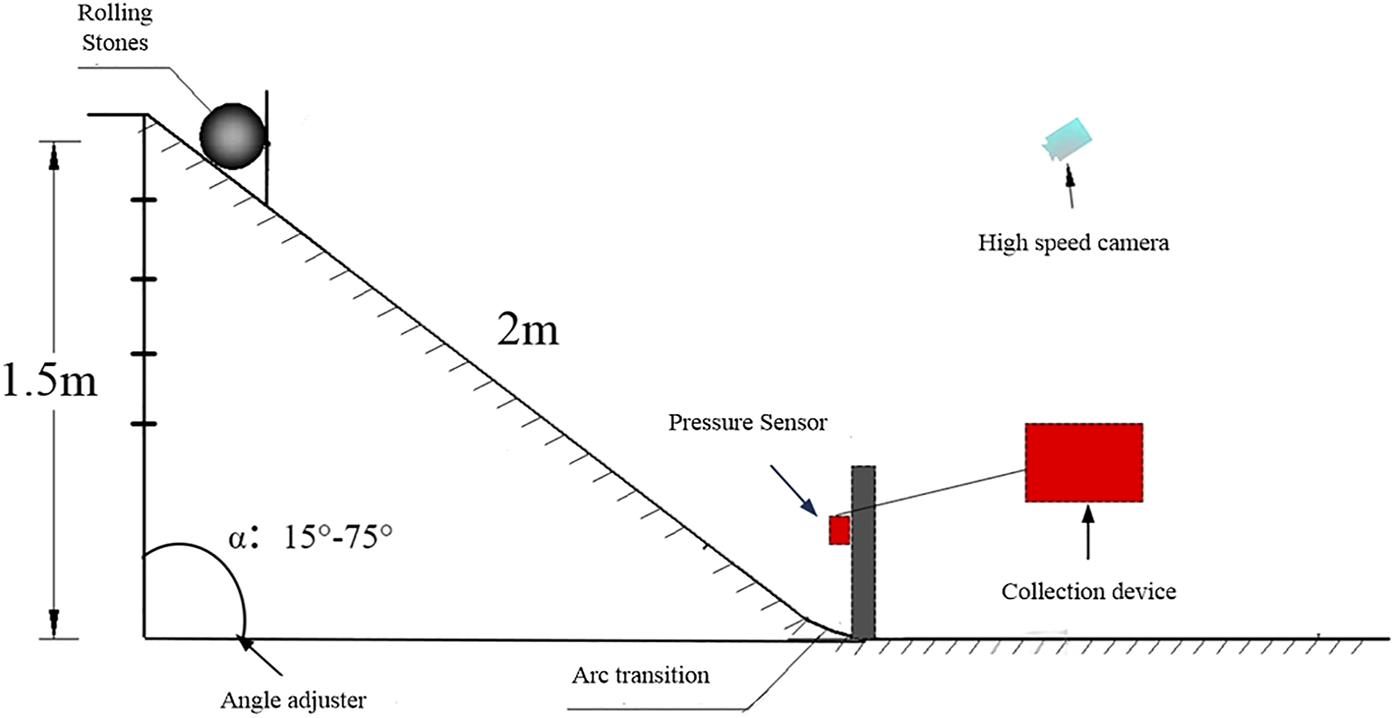
Experimental setup diagram.
The test device includes an artificially constructed slideway, an impact force test device, and a high-speed camera. The slideway can be adjusted to different slopes through an angle adjuster to obtain different impact speeds; the impact force test device includes a rolling stone baffle, a force sensor, and a collection device. The device is used to collect the test data on the impact force of the rolling stone; the high-speed camera is used to record the test process, and the image analysis is used to obtain the speed of the rolling stone movement after the test.
The test site diagram is shown in Figure 5. The specific test steps are as follows: the rolling stones are spheres made of steel-mixed materials, with weights of 2, 4, and 6 kg, respectively. The 60° slope is released naturally. The high-speed camera is used to record the sliding process of the rolling stone in real time. The peak impact force data when the rolling stone hits the sensor are manually collected, and then, the speed of the rolling stone when it hits the sensor is analyzed through image recognition.
FIGURE 5
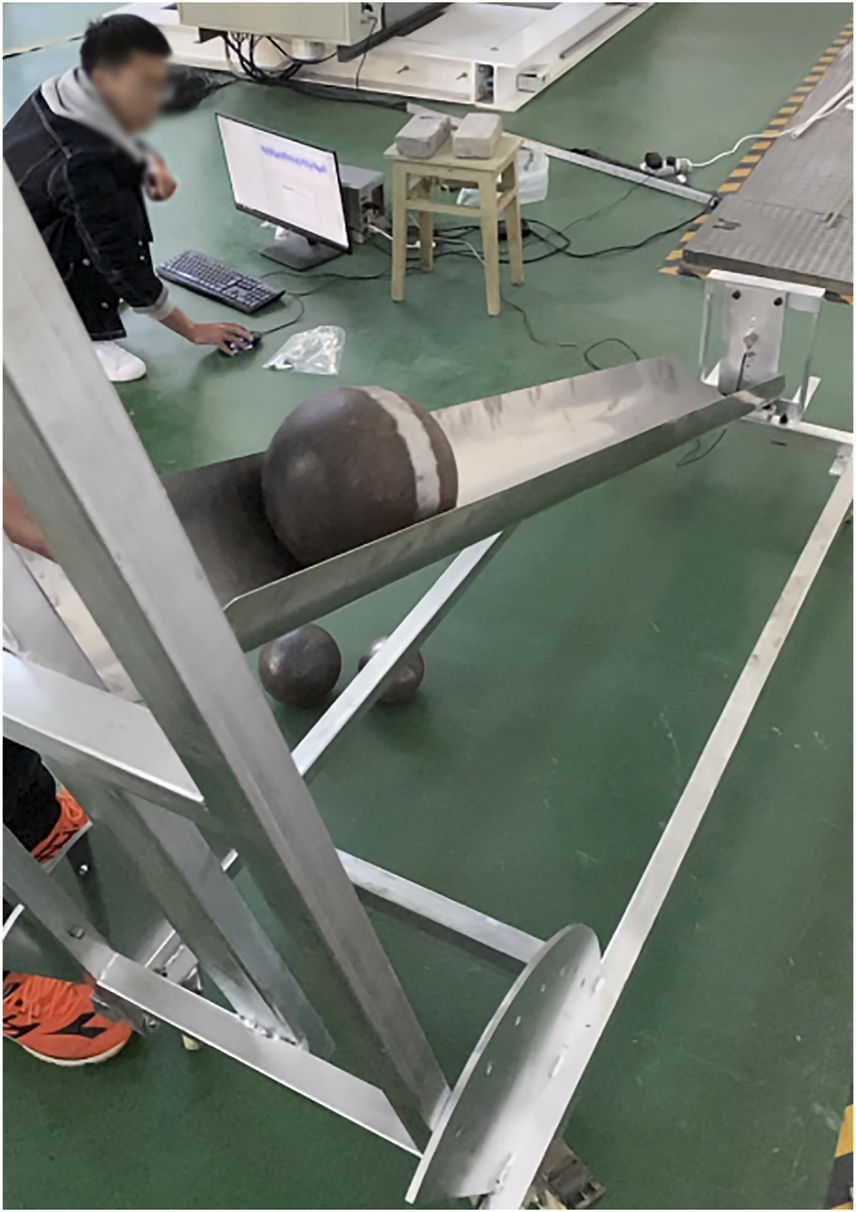
Field experiment map.
According to the data in Table 2, it can be seen that the peak value of the impact force of the rolling stone has a positive correlation with the impact speed and mass of the rolling stone. The variation law of the simulated data results is basically the same as that of the test results, and the peak impact force of the rolling stone is basically positively linear with the relationship between the speed and mass of the rolling stone. Relationship, but the whole is larger than the test data; this is because the air resistance is ignored in the simulation, and the rolling stone is set as a rigid body, which will increase its impact force. Through calculation and analysis, the maximum error after comparing all data is 11.69%. It is proved that the simulation results of the numerical model are reasonable to a certain extent within the allowable error range of the simulation in the “DYNA Nonlinear Dynamic Analysis Method and Engineering Application.”
TABLE 2
| Mass (kg) | angle (°) | velocity (m/s) | Impact force peak (kN) | Data source |
|---|---|---|---|---|
| 4 | 30 | 4.13 | 15.8 | Simulation data |
| 4.13 | 14.5 | Experimental data | ||
| 6 | 4.36 | 30.8 | Simulation data | |
| 4.36 | 27.8 | Experimental data | ||
| 4 | 60 | 5.47 | 34.2 | Simulation data |
| 5.47 | 30.9 | Experimental data | ||
| 6 | 5.62 | 46.8 | Simulation data | |
| 5.62 | 41.9 | Experimental data |
Comparison of rolling stone impact force results.
3 Results
In order to make the simulation results more valuable, this study takes the statistical data on the rolling rock conditions near the iron tower after the collapse and the rolling rock disaster simulated in the literature (Li et al., 2021) as the reference value for simulation analysis, and through simulation verification, it is found that when the horizontal impact occurs, the stress peak value is the largest, so the control variable method is adopted, the speed is kept at 7 m/s, the horizontal impact is set, the rolling stones of different masses are set, the diameter of the rolling stone is kept at 1.0 m, the horizontal impact is set, and the rolling stones with different speeds are set, as shown in Table 3.
TABLE 3
| Mass/velocity | Working condition | Parameters | Working condition | Parameters |
|---|---|---|---|---|
| Size (m) | I1 | 0.6 | I4 | 1.2 |
| I2 | 0.8 | I5 | 1.4 | |
| I3 | 1.0 | I6 | 1.6 | |
| Initial velocity(m·s−1) | II1 | 3 | II4 | 9 |
| II2 | 5 | II5 | 12 | |
| II3 | 7 | II6 | 15 |
Distribution of rolling stone conditions with different masses and speeds.
3.1 Analysis of the dynamic response process of a rolling stone impacting a tower with different masses
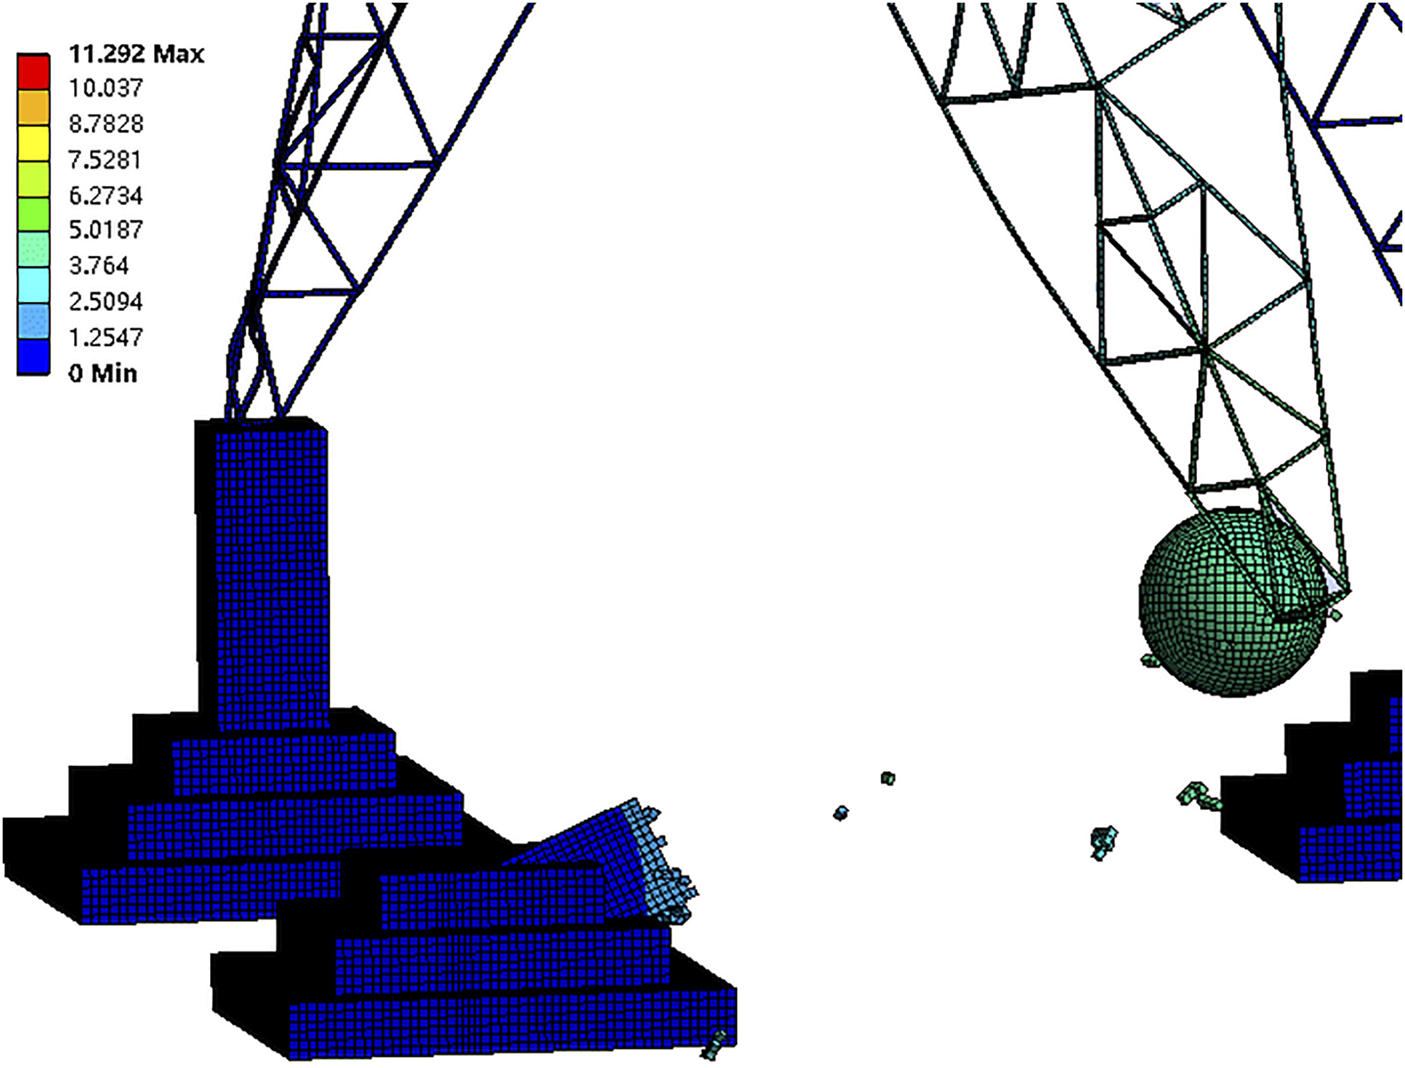
With the increase of the mass of the rolling stone, the maximum deformation position of the tower body is transferred from the lower cross arm to the tower legs, and the deformation of the tower foundation is changed from tilt to collapse, and in the process of collapse, there will be some broken stones flying out of the tower foundation. The position of the maximum stress of the tower mainly concentrates on the contact with the rolling stone and the connection with the tower legs and the right lower part of the tower foundation.
When the diameter of the rolling stone is less than 0.8 m, the maximum deformation of the tower body is concentrated at the cross arm, which is mainly due to the deformation of the tower body in the process of gravity overwhelming the tower foundation after the tower foundation is tilted. When the diameter of the rolling stone is more than 1.4 m, the maximum deformation occurs at the tower legs. There is considerable angle steel bending, particularly because the sliding of the tower leg of the impacted tower foundation leads to the deviation of the whole tower to the impacted side, and the diagonal tower legs suffered severe instability. The deformation cloud chart (t = 0.4 s) of working condition I2 is shown in Figure 6, and the stress cloud chart (t = 0.02 s) is shown in Figure 7.
FIGURE 6
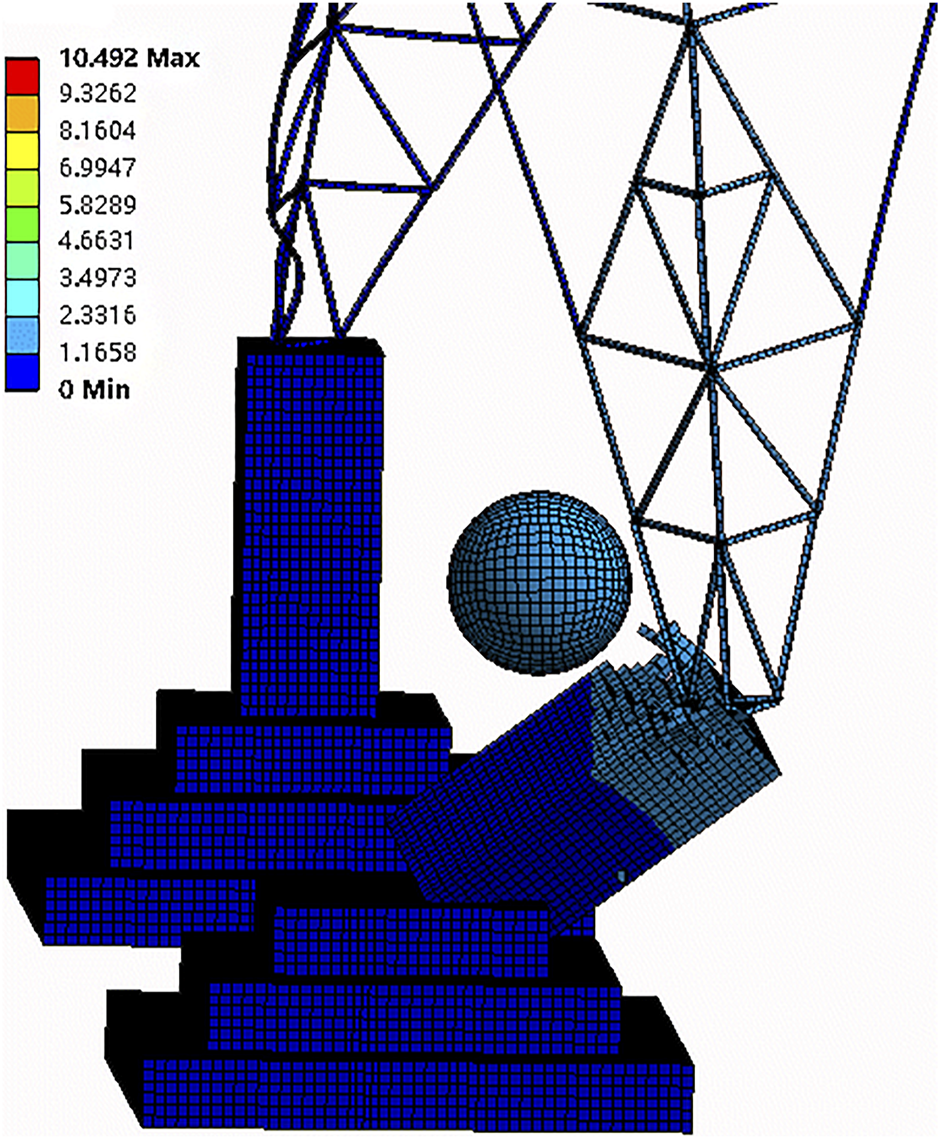
Deformation cloud chart under working condition I2.
FIGURE 7
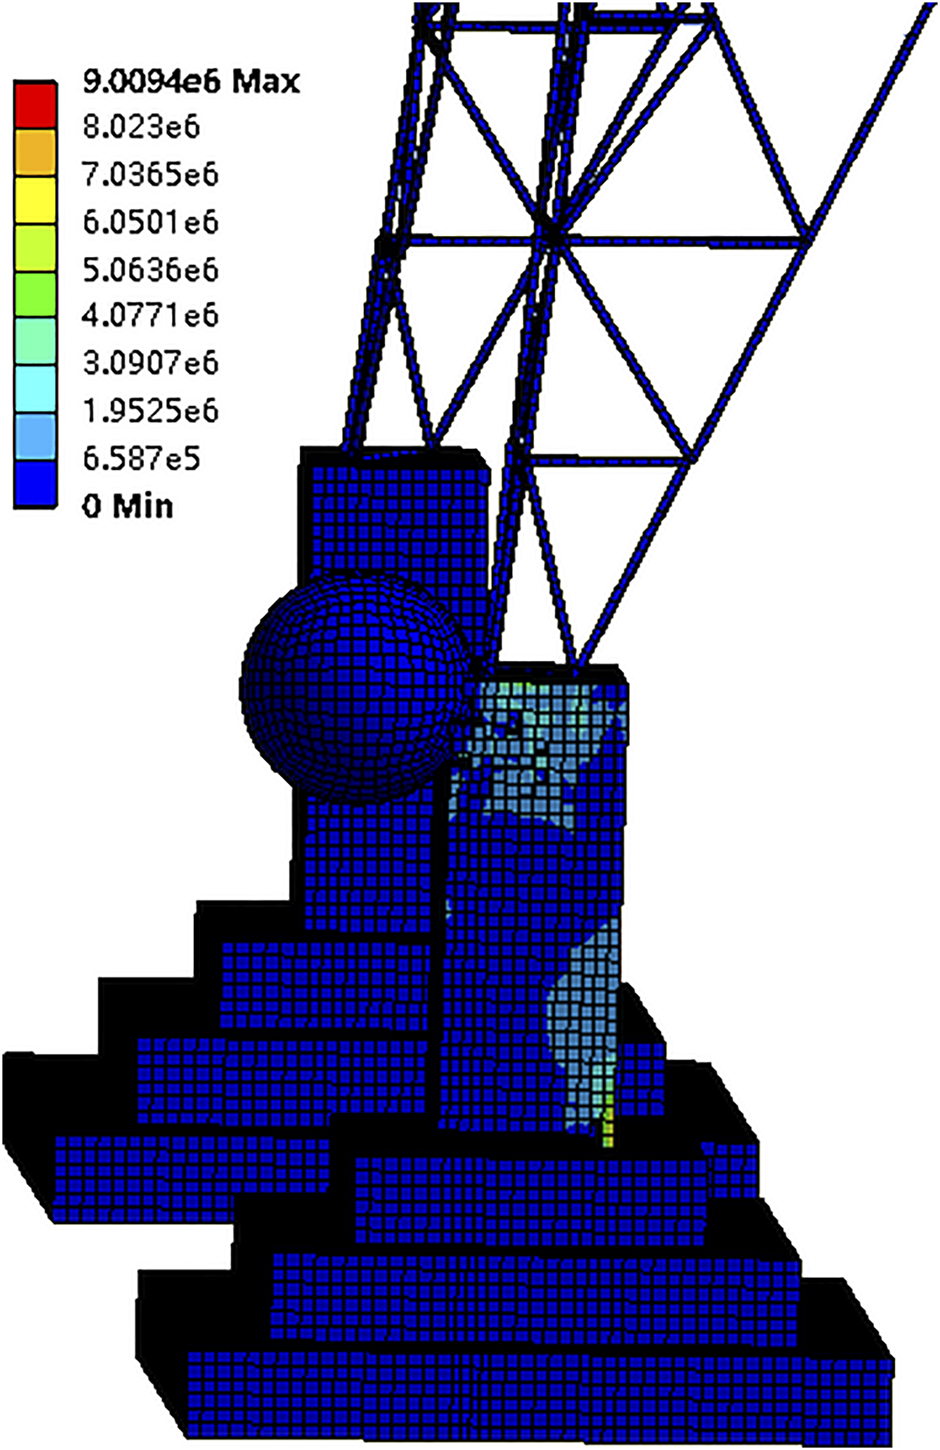
Stress cloud chart under working condition I2.
The stress-time history curves of the tower foundation under different operating conditions are shown in Figure 8, which can be obtained by combining with Figure 5. The changing trend of the stress curve under each working condition is the same, but the amplitude and time of the peak value are different. After the impact, the first stress peak of each working condition all appears within 0.02 s. Then, it falls back within 0.06 s. The impact process is very short.
FIGURE 8
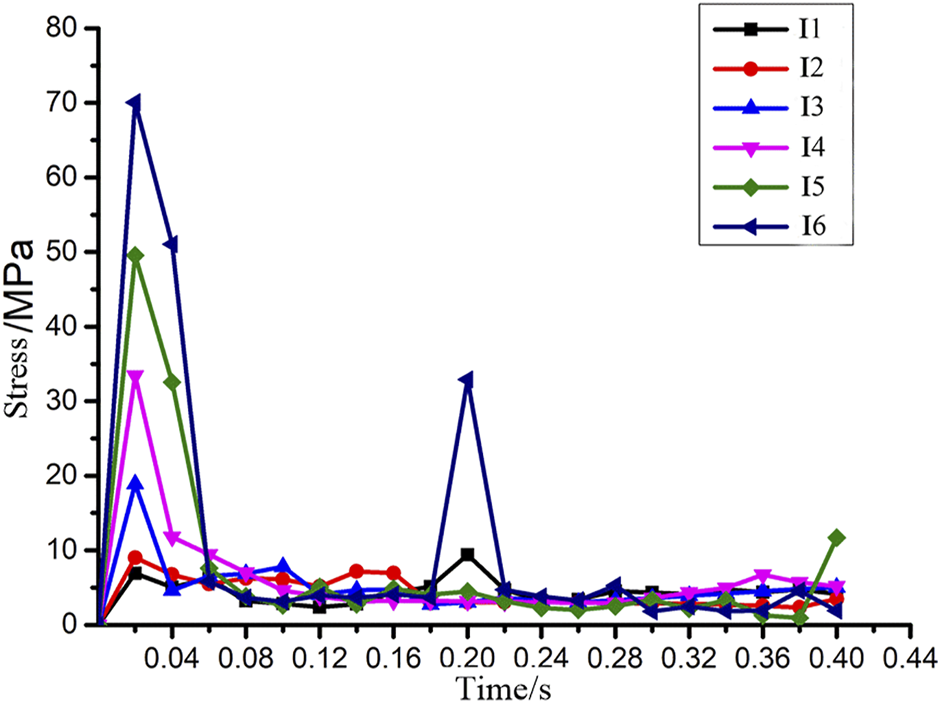
Stress−time history curve of the tower foundation under working condition I.
1) The peak value of the stress borne by the tower foundation increases with the increase in the mass of the rolling stone, but I2 and I3 have the largest increase between different working conditions. The peak value of I2 is 9.01 MPa, and the peak value of I3 is 18.91 MPa, with an increase of 110%.
2) The second peak value of I1∼I3 occurs because when the diameter of the rolling stone is small, the tower foundation is slightly tilted by the rolling stone at first, and then, the tower foundation is crushed by the weight of the tower body due to the instability of the tower legs, so there are two peak values of stress. However, the stress of the tower foundation is mainly concentrated on the connection between the tower foundation and the tower legs. This shows that the impact force of the small rolling stones is not as big as the pressure when the tower legs overpower the tower foundation.
3) As the diameter of the rolling stone increases to more than 1.0 m, the peak stress of the tower foundation appears at the contact point with the rolling stone and the fracture at the lower right of the tower foundation. At this time, the tower foundation shows the trend of fracture or tipping, indicating that the rolling stone with a diameter greater than 1.0 m poses a great risk to the tower.
3.2 Analysis of the dynamic response process of a rolling stone with different initial velocities impacting a tower
When the rolling stones exhibit different speed impact ranges, the deformation position of the tower is similar to that of the rolling stones with different masses. The maximum deformation position of the tower body is still transferred from the lower cross arm to the leg of the tower. In contrast, the deformation of the tower foundation is slightly different. When the speed of the rolling stones is greater than 15 m/s, the tower foundation will be smashed directly.
When the initial speed of the rolling stone is less than 5 m/s, it just hits the tower foundation at a slight tilt, and then, the tower body is slowly crushed by gravity. When the initial speed of the rolling stone is 7–12 m/s, the rolling stone can knock down the tower foundation, and the rubble blocks of the tower foundation increase with the increasing speed of the rolling stone. The maximum deformation occurs at the tower legs. When the initial speed of the rolling stone reached 15 m/s, the tower foundation was completely damaged, and the tower was unstable as a whole, with a large tendency to collapse. The deformation cloud chart (t = 0.4 s) and stress cloud chart (t = 0.02 s) of II6 are taken as examples, as shown in Figure 9 and Figure 10.
FIGURE 9
Deformation cloud chart under working condition II6.
FIGURE 10
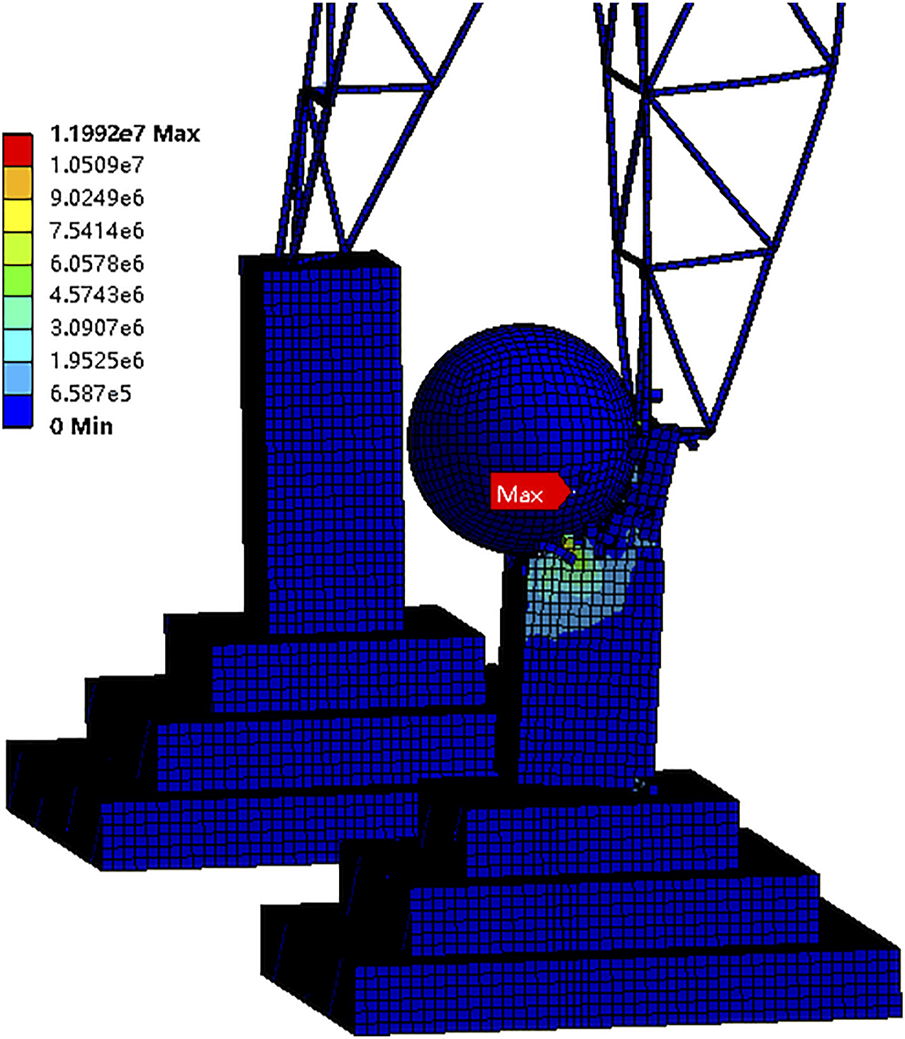
Stress cloud chart under working condition II6.
The stress–time history curves of the tower foundation under different working conditions are shown in
Figure 11, from which it can be obtained:
1) The occurrence time of the first stress peak in each working condition is the same, which is about 0.02 s. However, the stress peak falling back is different under different working conditions, and only the stress curve variation trend of II2∼II5 remains consistent.
2) On the whole, with the increase of the speed of the rolling stone, the peak stress of the tower foundation is also increasing. However, the stress curve of II1 falls back after some time after the peak. It was obvious that the 3 m/s rolling stone takes longer to knock down the tower foundation due to its lower speed. Due to the high speed of the rolling stone of II6, it directly crashed through the whole tower, so the stress remained basically the same in the process of impact, and the stress curve only began to fall back after impact.
3) The maximum impact peak value between the rolling stones with different velocities is only 38.18 M Pa, indicating that the change of velocity has less impact on the stress peak than the change of mass.
4) On the whole, the rolling stone with small initial velocity has little influence on the tower foundation, and the stress on the tower foundation mainly comes from the self-weight of the tower body. However, damaging force of the rolling stone with large initial velocity on the tower foundation is very significant. When the rolling stone speed reaches 15 m/s, the peak stress is only 11.99 M Pa, but the damaged area is large, and the tower foundation in contact with the rolling stone is all broken.
FIGURE 11
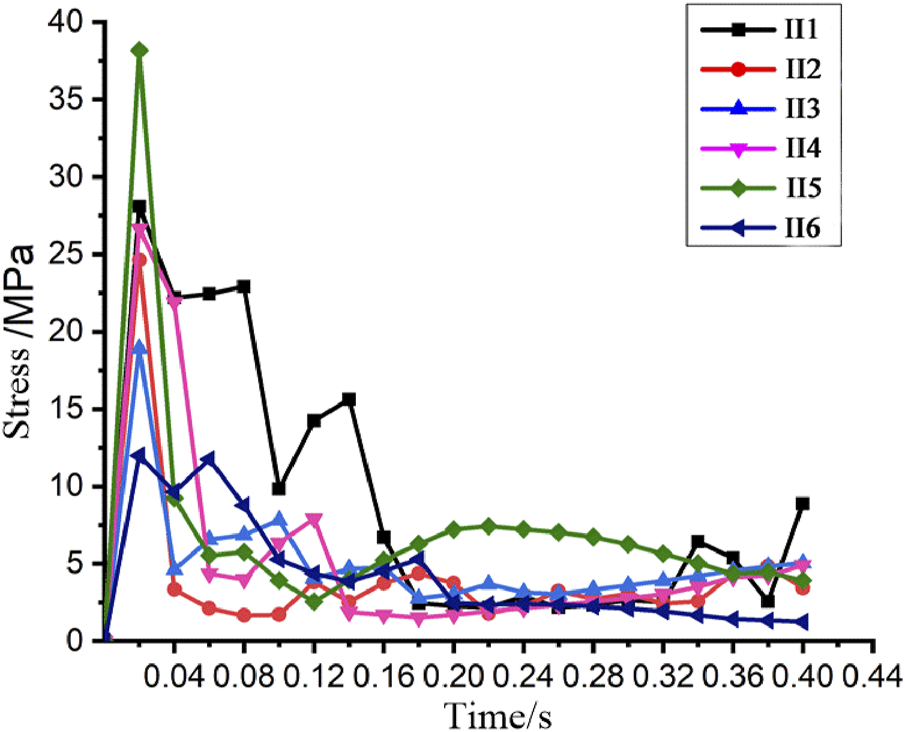
Stress−time history curve of the tower foundation under different working conditions.
3.3 Relationship between the impact speed of the rolling stone and time
The analysis of the speed change during the impact of the rolling stone on the iron tower is of great significance for the study of the anti-collision measures of the rolling stone. Figure 12 shows the speed change curve of the rolling stone under the impact of different masses of the rolling stone and the curve of the falling speed of the rolling stone between various working conditions. It can be seen from the figure that the velocity curves of rolling stones of different masses basically follow the same trend. First, they decelerate due to the collision with the tower base. After the collision is over, the total velocity begins to increase slowly, while the horizontal velocity basically remains unchanged. After decelerating, the rock speed of I1 is only 2.05 m/s, and the speed drop is 70.17%; however, the rock speed of I6 is still 6.04 m/s after being decelerated, and the speed drop is only 13.89%. Therefore, the higher the mass of the rock, the lower the deceleration effect is and the greater the degree of danger is, which is basically consistent with the results of the on-site rock impact structure and iron tower investigation.
FIGURE 12
Rolling stones speed variation curve under impacting stones with different weights.
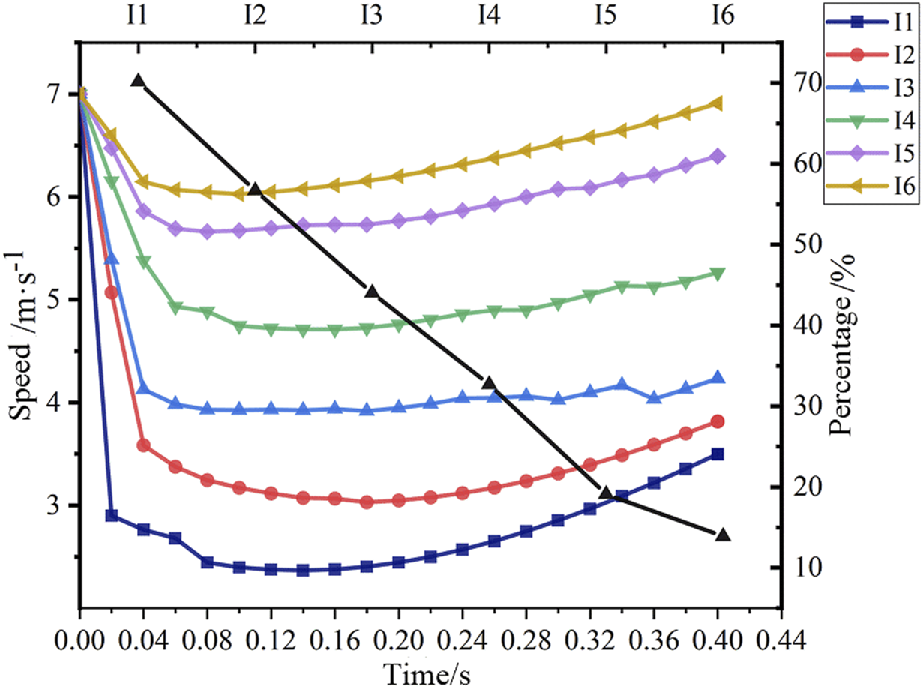
Figure 11 shows the speed change curve of the rolling stone under different speeds and the curve of the decrease of the rolling stone speed between various working conditions. It can be seen from the figure that the rock impact conditions under II1∼II2 are slightly different from those of II3∼II6. The speed is greatly reduced after hitting the tower base, but it does not knock down the tower base. The speed of the rolling stone is 3 m/s; after hitting the tower base, the speed drops by 54.07%, and the speed drops 35.62% after the tower base is installed with a rolling stone with a speed of 5 m/s. Therefore, a rolling stone with a speed below 5 m/s poses little threat to the tower; For II3∼II6, under working conditions, the changing trend of the rolling stone velocity is basically the same. After hitting the tower base, it decelerates and then gradually accelerates under the action of gravitational acceleration. The smaller the deceleration effect is, combined with the deformation diagram, it can be seen that the rolling stone with a speed of 15 m/s is likely to hit another tower foundation, which is a great threat to the tower to fall.
FIGURE 13
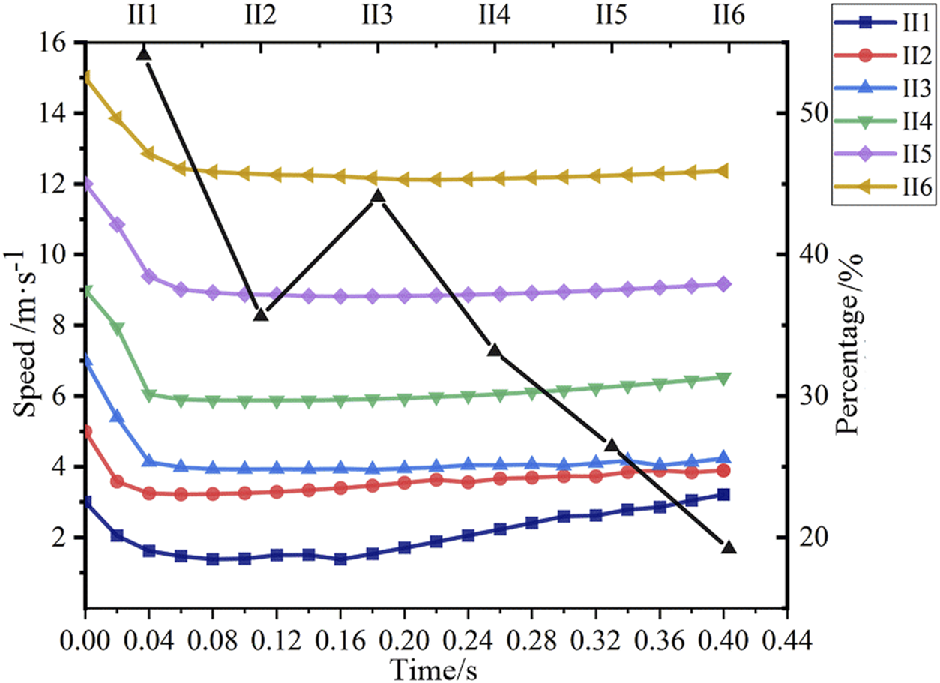
Rolling stones speed variation curve under impacting stones with different initial speeds.
4 Conclusion
1) As the mass or initial velocity of the rolling rock increases, that is, the momentum of the rolling rock increases, the maximum deformation position of the tower body gradually shifts from the lower cross arm to the tower leg, while the deformation of the tower base changes from tilting to collapse, and flying. The tower base crushed stones released have also increased; when the diameter of the rolling stone is greater than 1 m and the initial velocity is greater than 15 m/s, the tower base is directly hit by the rolling stone, causing a tower collapse accident.
2) During the impact of the rolling stone, the rolling stone with the greater mass or initial velocity will receive a lower deceleration effect. The horizontal velocity after impact deceleration is greater, and the rolling stone with larger mass and initial velocity will crash into the tower foundation. It may continue to hit the tower and threaten the stability of the tower.
3) The law of the stress–time history curve of the rolling stone hitting the iron tower is basically the same. The greater the mass or speed of the rolling stone, the greater the peak stress is. The peak stress increase in impact of different mass rolling stones is much greater than that of different speed rolling stones. Therefore, the prevention and control of large mass rolling stones is more important than the prevention and control of high-speed rolling stones.
4) The protection design of the iron tower should focus on the contact between the tower foundation and the rolling stone and the connection with the tower leg and the bottom right fracture of the tower foundation.
Statements
Data availability statement
The original contributions presented in the study are included in the article/Supplementary Material; further inquiries can be directed to the corresponding author.
Author contributions
YL and WZ provided study ideas and simulation modeling, ZZ analyzed simulation graphics and data, and JH and WT summarized all the data and wrote the manuscript. All authors read and approved the final manuscript.
Conflict of interest
JF, JW, and XJ were employed by the State Grid Huzhou Electric Power Design Institute Co., Ltd. The remaining authors declare that the research was conducted in the absence of any commercial or financial relationships that could be construed as a potential conflict of interest.
Publisher’s note
All claims expressed in this article are solely those of the authors and do not necessarily represent those of their affiliated organizations, or those of the publisher, the editors, and the reviewers. Any product that may be evaluated in this article, or claim that may be made by its manufacturer, is not guaranteed or endorsed by the publisher.
References
1
Garin (1958). The contact problem of elastic theory [M]. Wang Junjian. Beijing: Science Press, 140–151.
2
Gu Zhimin (2015). Analysis and experimental research on dynamic response of bridge piers under impact of rolling rocks [D]. Jiaotong: Chongqing Jiaotong University.
3
Holmquist T. J. Johnson G. Cook W. H. (2011). A computational constitutive model for concrete subjected to large strains, hish strain rates, and high pressures[C]. J. Appl. Mech.78 (5), 1120–1123. 10.1115/1.4004326
4
Huang Runqiu Liu Weihua (2009). Experimental study on the effect of the platform on the stopping accumulation of rolling stones[J]. Chin. J. Rock Mech. Eng.28 (3), 516–524. 10.1155/2021/9594496
5
Jingcai J. Yokino K. Yamagami T. (2008). Identification of DEM parameter for rockfall simulation analysis[J]. Chin. J. Rock Mech. Eng.27 (12), 2418. 10.2208/jscej.2002.701_409
6
Kawahara S. Muro T. (2006). Effects of dry density and thickness of sandy soil on impact response due to rockfall. J. Terramech.43 (3), 329–340. 10.1016/j.jterra.2005.05.009
7
Kawahara S. Muro T. (2006). Effects of dry density and thickness of sandy soil on impact response due to rockfall. J. Terramechanics43 (3), 329–340. 10.1016/j.jterra.2005.05.009
8
Labiouse V. (1996). Experimenta1 study of rock shed simpacted by rock blocks[J]. Struct. Eng. Int. J.3 (1), 171. 10.2749/101686696780495536
9
Li H. Yue L. Jiang H. et al (2021). Risk assessment of collapsing rolling stones on high-voltage transmission line towers[J. ]. Zibo J. Shandong Univ. Technol. Nat. Sci. Ed.35 (05), 82–86. 10.3969/j.issn.1672-6197.2021.05.013
10
Pichler B. Hellmich C. H. Mang H. A. Eberhardsteiner J. (2006). Loading of a gravel-buried steel pipe subjected to rockfall. J. Geotech. Geoenviron. Eng.132 (11), 1465–1473. 10.1061/(asce)1090-0241(2006)132:11(1465)
11
Pichler B. Hellmich C. H. Mang H. A. (2005). Impact of rocks onto gravel Design and evaluation of experiments. Int. J. Impact Eng.31 (4), 559–578. 10.1016/j.ijimpeng.2004.01.007
12
Tang Hongmei Yang Li Wang Linfeng (2019). Numerical simulation analysis of rockfall movement characteristics of steep high slope in the three gorges reservoir area[J]. J. Chongqing Normal Univ.36 (4), 166. 10.1007/s11629-011-2100-0
13
Wang C. (2016). Application of finite element analysis method in safety evaluation of steel tower[J]. Ningxia Hui Aut. Reg. Electr. Power Des. Inst.42 (15), 41–46. 10.1016/j.ijimpeng.2016.01.003
14
Wu Xutao Yao Li Li Heping . Study on the parameters of concrete HJC constitutive model[J], Acta Appl. Mech. 2010.11 (02): 340–344.
15
Xiao Lizhi (2017). Li Yadong Research on the impact of rolling stones on bridge piers in mountainous areas and the protection and reinforcement [D]. Jiaotong: Southwest Jiaotong University.
16
Xingmin L. Jianming H. Dongsheng Z. (201l). Numerical simulation analysis of roiling stone and bridge pier[J], journal of chongqing Jiaotong University: Natural science. 305, 934. 10.3969/j.issn.1674-0696.2011.05.011
17
Yang Qixin Guan Baoshu (1996). Experimental study on the calculation method of falling rock impact force[J]. J. China Railw. Soc.18 (1), 101. 10.1007/s10346-017-0876-x
18
Yuan J. Huang R. Pei X. (2014). Research on impact force test of rolling stones[J]. Rock Soil Mech.35 (1), 48–54. 10.16285/j.rsm.2014.01.011
19
Zhang L. Yang Z. Xu B. Rock and rock hazards[J]. key laboratory of engineering geomechanics, institute of geology and geophysics, Chinese academy of sciences journal of engineering geology, 20042, 4. 10.3969/j.issn.1004-9665.2004.03.001
20
Zou Y. Gu Z. Wang Y. Zhang K. (2015). Simulation of damage to concrete bridge piers under impact of rolling rocks[J]. J. Chongqing Jiaot. Univ. Nat. Sci. Ed.34 (06), 27–31. 10.3969/j.issn.1674-0696.2015.06.05
Summary
Keywords
transmission tower1, rolling rocks2, dynamic response3, stress4, deformation analysis5
Citation
Linping Y, Feng J, Hong J, Wei J, Zhiyong W, Zheng Z, Jianping X and Tian W (2022) Dynamic responses of 500-kV transmission line towers under impact force of rockfall in a mountainous area. Front. Mech. Eng 8:927263. doi: 10.3389/fmech.2022.927263
Received
29 April 2022
Accepted
06 July 2022
Published
23 September 2022
Volume
8 - 2022
Edited by
Raj Das, RMIT University, Australia
Reviewed by
Ting Li, Southwest Jiaotong University, China
Vijayanandh Raja, Kumaraguru College of Technology, India
Updates
Copyright
© 2022 Linping, Feng, Hong, Wei, Zhiyong, Zheng, Jianping and Tian.
This is an open-access article distributed under the terms of the Creative Commons Attribution License (CC BY). The use, distribution or reproduction in other forums is permitted, provided the original author(s) and the copyright owner(s) are credited and that the original publication in this journal is cited, in accordance with accepted academic practice. No use, distribution or reproduction is permitted which does not comply with these terms.
*Correspondence: Jiang Hong, 254411288@qq.com
This article was submitted to Solid and Structural Mechanics, a section of the journal Frontiers in Mechanical Engineering
Disclaimer
All claims expressed in this article are solely those of the authors and do not necessarily represent those of their affiliated organizations, or those of the publisher, the editors and the reviewers. Any product that may be evaluated in this article or claim that may be made by its manufacturer is not guaranteed or endorsed by the publisher.