 Anle Wang 1
 Martin H. Müser1,2*
- 1Department of Material Science and Engineering, Saarland University, Saarbrücken, Germany
- 2INM–Leibniz Institute for New Materials, Saarbrücken, Germany
Thin, elastic sheets are well known to adapt to rough counterfaces, whereby adhesive interactions and pull-off stresses σp can be significant, yet no generally applicable, quantitative guideline has been suggested hitherto as to when a sheet should be considered thin enough to be sticky. Using computer simulations, we find that the dependence of σp on surface energy γ has a high and a low-pull-off-stress regime. For randomly rough surfaces, we locate the dividing line at the point, where γ is approximately half the elastic energy per unit area needed to make conformal contact, which is the same ratio as for semi-infinite elastic solids. This rule of thumb also applies to a certain degree for single-wavelength roughness, in which case the transition from low to high stickiness occurs when at the moment of maximum tension contact is not only broken at the height maxima but also at the saddle points.
1 Introduction
Thin-film adhesion has gained much attention in the scientific community in recent years, in particular, in the context of biomimetic systems (Autumn et al., 2000, Autumn et al., 2002; Reddy et al., 2007; Boesel et al., 2010). Understanding what parameters control adhesion and thus traction can certainly aid the control of adhesive systems. Although Persson’s contact mechanics theory (Persson, 2001; Persson, 2002; Persson, 2003; Persson and Gorb, 2003) allows predictions on properties of adhesive systems to be made (Carbone et al., 2009; Wang and Müser, 2017; Joe et al., 2017; Joe et al., 2018; Joe et al., 2020), it does not provide any easy-to-evaluate guidelines. Nonetheless, achieving controllable adhesion in real systems can certainly be aided by an understanding of the basic detachment mechanism and the parameters controlling pull-off stresses or pull-off forces (Arzt et al., 2003; Persson, 2003; Kamperman et al., 2010).
Thin elastic layers generally stick better to nominally flat but microscopically rough surfaces compared to bulk solids. This is because thin sheets can accommodate the long-wavelength undulations of their counterfaces much more easily than thick solids do (Carbone et al., 2004). When thick elastomers comply with randomly rough surfaces, the required elastic energy resides predominantly in deformation modes near the roll-off wave vector qr, at which the height spectrum C(q) transitions from being approximately constant to the self-affine scaling regime. In the latter domain, C(q) ∝ q−2(1+H), where H is called the Hurst exponent, which typically takes values 0.8 ≲ H ≲ 1 (Majumdar and Tien, 1990; Palasantzas, 1993; Persson, 2014; Jacobs et al., 2017). In the rare cases, when H ≤ 0.5, the full-contact elastic energy,
Classical approaches to adhesion, most notably the one by Dahlquist (1966), assume that adhesion becomes macroscopically noticeable when the surface energy γ is greater than or similar to the elastic energy needed to fully conform two surfaces to each other. This explains why the more quantitative Persson theory also finds the effective surface energy to vanish when the surface spectrum of the rough surface has sufficient intensity at small wave vectors (Persson, 2002). Recent simulations by Wang and Müser (2022) identified a rather abrupt transition between high and low maximum tension at a reduced surface energy, or generalized Johnson parameter (Ciavarella and Papangelo, 2018), of
In this study, we systematically study the effect of sheet thickness on the pull-off stress and other quantities defining the adhesive contact between elastic solids of varying thicknesses and a stiff counterface. The model and method used for our study are sketched in Sec 2, results are presented in Sec 3, and conclusions are drawn in Sec 4.
2 Model and method
2.1 Model
The definition of the model has three main aspects: the geometry of the rough substrate, which is fixed in space, the elastic properties of the flat elastic layer including the boundary conditions acting on it, and the interaction between substrate and layer.
2.1.1 Substrate geometry
In this study, the counterface topography is modeled in terms of either single- or multiscale-wavelength roughness. The profile of single-wavelength roughness is defined as a square-lattice pattern according to
where hrms is the root-mean-square deviation of the height from its mean, while the wavelength λ is set equal to the linear dimension of the simulation L, which is periodically repeated, parallel to the interfacial directions x and y.
Randomly rough surfaces are modeled with a typical height spectrum of the form (Majumdar and Tien, 1990; Palasantzas, 1993; Persson, 2014; Jacobs et al., 2017)
Here,
For the sake of simplicity, we assume C(q) to depend only on q, which makes the surfaces statistically isotropic, and neglect any potential correlation between the phases of the complex
Our random topography is characterized by the ratios λr/λs = 64 and L/λr = 4, which results in a mean local radius of curvature of Rc ≈ 0.0057λr and
2.1.2 Properties of the elastic layer
The elastic layer is treated to have a finite thickness t. On the side opposite to the substrate, the stress is assumed to be constant and normal to the original, undeformed surface. The elastic energy as a function of the displacement field u(r), whose Fourier transform is
in mechanical equilibrium. Here, E* is the contact modulus defined as E/(1 − ν2) with E being the Young’s modulus and ν the Poisson’s ratio. The thickness-dependent factor c (qt) is given by Carbone et al. (2009).
E* is used as unit for pressure, which corresponds to the usual choice of
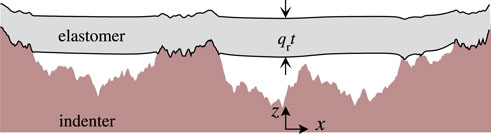
FIGURE 1. Cross-section of an adhesive, elastic layer of the finite thickness (qrt = 0.5) in contact with a rigid, randomly rough substrate. The shown cross-section, which contains the highest point of our default topography, is not to scale.
2.1.3 Interactions between substrate and elastic layer
The local surface energy between elastic sheet and rigid substrate takes the recently suggested form of (Wang et al., 2021):
where γ is the surface energy that is gained per unit area when two parallel surfaces make contact, while gc is the range of the interaction. This “cohesive-zone model” (CZM) is designed such that the interaction between elastomer and counterface is twice differentiable, which eases an efficient energy minimization. Typical values for γ with relevance to tribology range from O (10 mJ/m2) for chemically passivated solids, for example, those formed by many common polymers, to O (1 J/m2) for non-passivated metals or ceramics.
The specific choice for gc depends on the investigated system, as explained next in Sec 2.1.4. However, we always ensured to increase the discretization with reference to the default to ensure smooth displacements near the contact lines. This was achieved by choosing the local elastic stiffness, defined as πE*/Δa to be at least 2.5 times the maximum curvature of the CZM, which is
2.1.4 Dimensionless parameters
Several dimensionless quantities characterizing the interface can be defined. One way of undimensionalizing the surface energy is to use
Individual contact patches are found to be locally sticky if γ′ ≳ 1. An advantage of this measure is that it does not depend on the sheet thickness. However, little is learned about the number of contact patches from γ′. The reduced surface energy,
introduced already in Sect. 1 holds promise to provide a more meaningful measure for the interfacial surface energy.
Another important quantity is the (local) Tabor parameter, defined as
which characterizes the range of the interaction. Large and small μT reflect short- and long-range adhesion, respectively. Throughout this article, μT = 4 is assumed. In single-asperity contact, this choice is sufficient to make the retraction curve be close to the continuum limit (Müser, 2014), while larger numbers are required in order to properly reflect the approach curve for short-range adhesion (Ciavarella et al., (2017); Wang et al., (2021)). However, the Tabor parameter is a scale-dependent quantity (Persson and Scaraggi, 2014) so that the Tabor parameter at coarse scales used here is clearly greater than its local default value. The only exceptions to this claim pertain to the hysteresis of the load-displacement curve in situations, where only the final maximum of the counterfaces touches the elastomer. Fortunately, this limit is well understood from the Johnson–Kendall–Roberts (JKR) theory (Johnson et al., 1971).
Finally, while the stress is usually defined in units of
with σmax = πγ/(2gc).
2.2 Mass-weighted GFMD
Green’s function molecular dynamics (GFMD) (Campaná and Müser, 2006) is used, which has been discussed several times in the past. See in particular Appendix 2 in Prodanov et al. (2013). This is why we only provide a brief summary of the method. The main idea is to solve the equations of motion resulting from the total energy and, if present, constraints using the usual molecular-dynamics toolbox. Dynamics are formulated in terms of the Fourier representation of the displacements, which makes it possible to implement efficient methods for energy minimization, such as the mass-weighting (MW) algorithm (Zhou et al., 2019). MW-GFMD assigns less inertia to soft modes, which is utterly beneficial for the simulation of thin sheets, where long-wavelength modes are particularly soft compared to those at small scales.
In this work, we study quasi-static dynamics and thus disregard viscoelastic forces. To this end, we use a ramp as in Ref. (Wang et al., 2021). Specifically, we change the thin-sheet’s center of mass over Δτ = 50 time steps according to
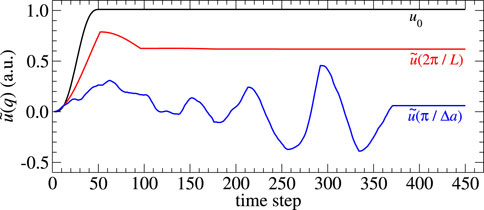
FIGURE 2. Displacement of selected modes,
3 Results and discussion
3.1 Single-wavelength roughness
We first studied the load-displacement, or rather stress-displacement, dependence in the limiting case of single-wavelength roughness. In contrast to previous numerical studies by, for example, Zilberman and Persson (2002) or Menga et al. (2016), we investigate a two-dimensional (2D) rather than a one-dimensional (1D) interface so that our topography contains saddle points in addition to maxima and minima. Figure 3 shows the equilibrium relation between the mean interfacial stress σ0 and the displacement d for a reduced surface energy

FIGURE 3. Dimensionless interfacial stress σ0/σmax as a function of the dimensionless displacement d/dp during approach and retraction for elastomers of different thicknesses t, that is, qt = ∞, 2, and 1, where q = 2π/λ. Here, dp is the displacement required to break the contact in the JKR limit. The surface energy γ is kept constant at
The typical loading-unloading process of a semi-infinite body with short-ranged adhesion for single-sinusoidal, 2D roughness (Wang et al., 2021) is clearly revealed in Figure 3: a hysteresis related to the primary contact formation of the height maxima at negative stress (highlighted in the inset) and the later hysteresis at positive stresses associated with the coalescence of previously disconnected (but periodically repeated) contact patches, bringing the saddle points of the height profile in contact with the elastomer. Due to the small value of
The just-discussed simulations were repeated for a larger reduced surface energy, that is, for
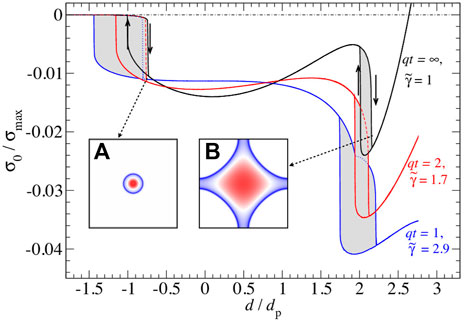
FIGURE 4. Stress-displacement dependence as in Figure 3, however, this time for
The results presented so far were obtained under displacement control of the layer facing the rigid counterface. Such boundary conditions would be difficult to establish experimentally. Instead, real systems can be assumed to be closer to a load-driven situation. For example, the back layer of an elastomer could be charged uniformly and exposed to an electric field, which would play the role of the external driving force. Under such load driving, it might be impossible to measure experimentally those portions of the σ0(d) relation with a negative slope because the system would be mechanically unstable on those branches, yet not all of those branches are necessarily accessible. For example, the part of the σ0(d) branch of the qt = ∞,
Despite the difficulty to access experimentally all branches of the σ0(d) curve, small parameter windows exist, in which the sheets can act like a pressure-sensitive adhesive. For example, for qt = 1 and
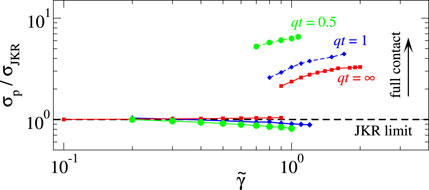
FIGURE 5. Pull-off stress normalized to that obtained in the JKR limit, σp/σJKR, as a function of the reduced surface energy
In the case of single-wavelength roughness, reaching a saddle-point contact for a thin sheet using constant-load driving will be generally difficult. For example, for qt = 1 and
3.2 Randomly rough surface with H = 0.8
Before presenting numerical results on a randomly rough surface, we find it instructive to study which wave numbers matter the most for the total elastic energy per unit area,
required to bring the elastomer into conformal surface. When transitioning to a continuum description, the sum over wave vectors must be replaced with an appropriate integral. Individual summands or integrands are shown in Figure 6A for a ratio λr/λs = 1, 000. They reveal a maximum near a “representative” wave vector of
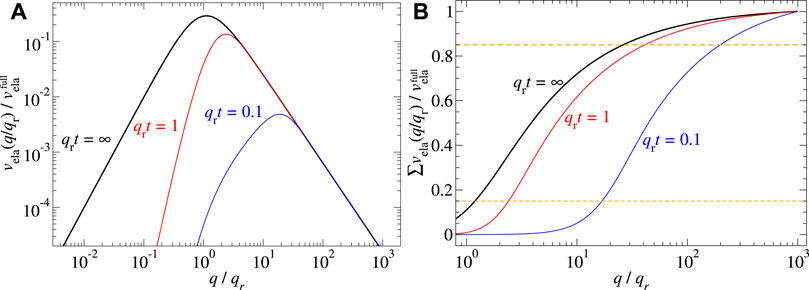
FIGURE 6. (A) Full-contact elastic energy per mode as a function of q/qr. (B) Relative, cumulative full-contact elastic energy for thicknesses satisfying qrt = ∞, 1, and 0.1.
Another way of rationalizing the enhanced adhesion of thin sheets to substrates is given by the concept of contact splitting (Kamperman et al., 2010). To this end, it is instructive to visualize the interfacial stress of different models at identical relative contact areas, as is done in Figure 7. Panel (a) shows the contact topography for a purely, repulsive, semi-infinite solid at a relative contact area of ar ≈ 0.1, and panel (d) a zoom into a selected domain within that structure. If a similar contact area is induced by adhesion

FIGURE 7. Stress distribution of an elastic sheet squeezed a rigid, randomly rough substrate: (A) thick slab without adhesion, (B) thick slab with adhesion, and (C) thin sheet with adhesion. All three configurations are simulated to obtain 10% relative contact area. Red and yellow mark compressive stress, while blue indicates attraction. Substrate specification:
When changing
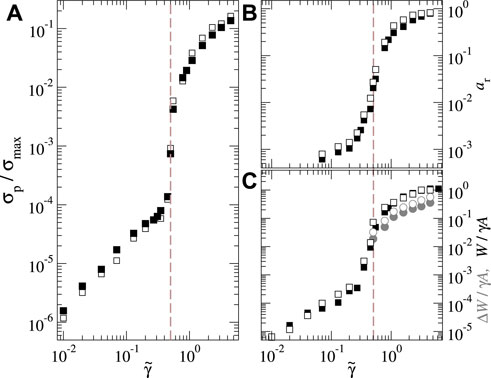
FIGURE 8. (A) Pull-off stress σp/σmax, (B) relative contact area ar, (C) work of adhesion W (black squares), and energy hysteresis ΔW (grey circles) for one realization of the default surface. Herein, solid symbols indicate the semi-infinite solid while open symbols refer to a thin sheet with a thickness of t = 1/(2qr).
The just reported trends remain robust upon further lowering of the sheet thickness, as conveyed in Figure 9. For the smallest investigated thicknesses, the cross-over region moves to a slightly smaller
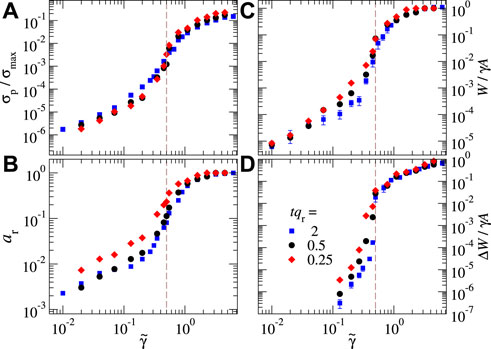
FIGURE 9. Normalied pull‐off force (A) relative contact area at zero load (B) work of separation (C) and energy loss (D) in a function of reduced surface energy for a broader range of sheet thicknesses from qr = 2, 0.5 and 0.25.
3.3 Randomly rough surfaces with H = 0.3
The analysis shown in Figure 6 revealed that the main contributions to the full-contact elastic energy move to smaller wavelengths as the thickness is reduced. A similar effect occurs when using smaller H exponents. In fact, when using H < 0.5, the main contributions to vela come from the wavevectors near qs. This is why thickness effects at qrt = 0.1 are quite marginal in our random system for H = 0.3 but already substantial for H = 0.8 despite λr/λs being merely 128. Thus, for the study of adhesion with a H = 0.3 substrate, thickness effects are marginal, unless the thickness clearly falls below the inverse roll-off wavevector. Such thin layers, however, may rarely exist in applications.
For the just-mentioned reasons, we also investigated the dependence of the pull-off stress on the reduced surface energy for a semi-infinite solid in contact with an adhering H = 0.3 counterface. The results presented in Figure 10 reveal once more a transition near
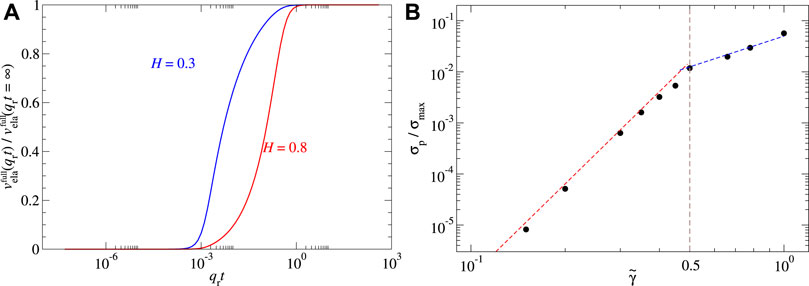
FIGURE 10. (A) Normalized full-contact elastic energy in a function of thickness with H = 0.3 and 0.8. (B) Normalized pull-off force in a function of normalized surface energy with H = 0.3. Here, qrt = ∞ and same parameter setting as Figure 8.
4 Discussion and conclusions
In this work, we investigated the question to what extent thin elastic sheets—with a constant pressure condition on the back layer—adhere more strongly to rough counter faces than bulk elastomers. On one hand, thin sheets are readily separated from a substrate due to their large compliance, resulting in a process reminiscent of peeling. This explains why Menga et al. (2016) found smaller pull-off stresses for them than for semi-infinite solids. On the other hand, they accommodate long-wavelength undulations of their counterfaces quite easily, facilitating contact formation, which correlates with our experience that thin food wrap clings better to surfaces than thick sheets of the same material. Unsurprisingly, we find that the “peeling argument” keeps the upper hand at a small relative contact area, which, in the case of single-wavelength roughness, coincides with the situation that only the height maxima but not the saddle points are in contact. Once saddle points are in contact, peeling-like separation is strongly suppressed and the pull-off stress, the work of adhesion, and the adhesion hysteresis grow with decreasing thickness. For 2D, single-wavelength roughness, a narrow window of surface energies exists at which a pull-off instability can be associated with a saddle-point instability, irrespective of the sheet’s thickness. Trends for randomly rough surfaces were similar to those with single-wavelength roughness, which we rationalize with the observation that the elastic energy for conformal contact is located in a relatively narrow wave-number window. The pertinent wavelengths are located near the roll-off wavelength of the randomly rough surface for semi-infinite solid and move to smaller wavelengths having the order of magnitude of the sheet thickness t otherwise. Nonetheless, it seems somewhat easier to reach a state of saddle-point contact for randomly rough than for single-wavelength indenters, since the latter have an extreme propensity to form full contact, once the saddle points touch the elastomer.
This work, like our previous one (Wang and Müser, 2022), supports the idea of the possibility of energy loss due to contact hysteresis even without viscoelasticity (Dalvi et al., 2019; Li et al., 2019; Sanner and Pastewka, 2022). While these works were concerned with a semi-infinite elastomer interacting with a nominally flat Hertzian indenter, Li et al. (2019) found, as we did, a relative sharp transition between sticky and unsticky when a “Johnson adhesion parameter” α* took a value near 0.25. Their parameter correlates with but is not identical to our reduced surface energy
Interestingly, we found
Data availability statement
The raw data supporting the conclusions of this article will be made available by the authors, without undue reservation.
Author contributions
MM designed the study, wrote the manuscript, and analyzed the results. AW ran the simulations, analyzed the results, and prepared the figures.
Funding
MM acknowledges receiving support from the Leibniz Foundation as an INM fellow.
Acknowledgments
Both authors thank Nicola Menga and Christian Müller for their helpful discussions.
Conflict of Interest
The authors declare that the research was conducted in the absence of any commercial or financial relationships that could be construed as a potential conflict of interest.
Publisher’s note
All claims expressed in this article are solely those of the authors and do not necessarily represent those of their affiliated organizations, or those of the publisher, the editors, and the reviewers. Any product that may be evaluated in this article, or claim that may be made by its manufacturer, is not guaranteed or endorsed by the publisher.
References
Arzt, E., Gorb, S., and Spolenak, R. (2003). From micro to nano contacts in biological attachment devices. Proc. Natl. Acad. Sci. U.S.A. 100, 10603–10606. doi:10.1073/pnas.1534701100
Autumn, K., Liang, Y. A., Hsieh, S. T., Zesch, W., Chan, W. P., Kenny, T. W., et al. (2000). Adhesive force of a single gecko foot-hair. Nature 405, 681–685. doi:10.1038/35015073
Autumn, K., Sitti, M., Liang, Y. A., Peattie, A. M., Hansen, W. R., Sponberg, S., et al. (2002). Evidence for van der waals adhesion in gecko setae. Proc. Natl. Acad. Sci. U.S.A. 99, 12252–12256. doi:10.1073/pnas.192252799
Boesel, L. F., Greiner, C., Arzt, E., and del Campo, A. (2010). Gecko-inspired surfaces: A path to strong and reversible dry adhesives. Adv. Mat. 22, 2125–2137. doi:10.1002/adma.200903200
Campañá, C., and Müser, M. H. (2006). Practical Green’s function approach to the simulation of elastic semi-infinite solids. Phys. Rev. B 74, 075420. doi:10.1103/physrevb.74.075420
Carbone, G., Lorenz, B., Persson, B. N., and Wohlers, A. (2009). Contact mechanics and rubber friction for randomly rough surfaces with anisotropic statistical properties. Eur. Phys. J. E 29, 275–284. doi:10.1140/epje/i2009-10484-8
Carbone, G., Mangialardi, L., and Persson, B. (2004). Adhesion between a thin elastic plate and a hard randomly rough substrate. Phys. Rev. B 70, 125407. doi:10.1103/physrevb.70.125407
Ciavarella, M., Greenwood, J., and Barber, J. (2017). Effect of tabor parameter on hysteresis losses during adhesive contact. J. Mech. Phys. Solids 98, 236–244. doi:10.1016/j.jmps.2016.10.005
Ciavarella, M., and Papangelo, A. (2018). A generalized johnson parameter for pull-off decay in the adhesion of rough surfaces. Phys. Mesomech. 21, 67–75. doi:10.1134/s1029959918010095
Dalvi, S., Gujrati, A., Khanal, S. R., Pastewka, L., Dhinojwala, A., Jacobs, T. D., et al. (2019). Linking energy loss in soft adhesion to surface roughness. Proc. Natl. Acad. Sci. U.S.A. 116, 25484–25490. doi:10.1073/pnas.1913126116
Jacobs, T. D. B., Junge, T., and Pastewka, L. (2017). Quantitative characterization of surface topography using spectral analysis. Surf. Topogr. Metrol. Prop. 5, 013001. doi:10.1088/2051-672x/aa51f8
Joe, J., Scaraggi, M., and Barber, J. (2017). Effect of fine-scale roughness on the tractions between contacting bodies. Tribol. Int. 111, 52–56. doi:10.1016/j.triboint.2017.03.001
Joe, J., Thouless, M., and Barber, J. (2018). Effect of roughness on the adhesive tractions between contacting bodies. J. Mech. Phys. Solids 118, 365–373. doi:10.1016/j.jmps.2018.06.005
Joe, J., Thouless, M. D., and Barber, J. R. (2020). Effect of surface roughness on adhesive instabilities for the elastic layer. Front. Mech. Eng. 6. doi:10.3389/fmech.2020.00031
Johnson, K. L., Kendall, K., and Roberts, A. (1971). Surface energy and the contact of elastic solids. Proc. R. Soc. Lond. A. Math. Phys. Sci. 324, 301–313. doi:10.1098/rspa.1971.0141
Kamperman, M., Kroner, E., del Campo, A., McMeeking, R. M., and Arzt, E. (2010). Functional adhesive surfaces with “gecko” effect: The concept of contact splitting. Adv. Eng. Mat. 12, 335–348. doi:10.1002/adem.201000104
Li, Q., Pohrt, R., and Popov, V. L. (2019). Adhesive strength of contacts of rough spheres. Front. Mech. Eng. 5, 7. doi:10.3389/fmech.2019.00007
Majumdar, A., and Tien, C. (1990). Fractal characterization and simulation of rough surfaces. Wear 136, 313–327. doi:10.1016/0043-1648(90)90154-3
Menga, N., Afferrante, L., and Carbone, G. (2016). Adhesive and adhesiveless contact mechanics of elastic layers on slightly wavy rigid substrates. Int. J. Solids Struct. 88-89, 101–109. doi:10.1016/j.ijsolstr.2016.03.016
Müser, M. H. (2014). Single-asperity contact mechanics with positive and negative work of adhesion: Influence of finite-range interactions and a continuum description for the squeeze-out of wetting fluids. Beilstein J. Nanotechnol. 5, 419–437. doi:10.3762/bjnano.5.50
Müser, M. H. (2016). A dimensionless measure for adhesion and effects of the range of adhesion in contacts of nominally flat surfaces. Tribol. Int. 100, 41–47. doi:10.1016/j.triboint.2015.11.010
Müser, M. H. (2018). Response to “A comment on meeting the contact-(mechanics) challenge”. Tribol. Lett. 66, 38. doi:10.1007/s11249-018-0986-1
Palasantzas, G. (1993). Roughness spectrum and surface width of self-affine fractal surfaces via the k-correlation model. Phys. Rev. B 48, 14472–14478. doi:10.1103/physrevb.48.14472
Pastewka, L., and Robbins, M. O. (2014). Contact between rough surfaces and a criterion for macroscopic adhesion. Proc. Natl. Acad. Sci. U.S.A. 111, 3298–3303. doi:10.1073/pnas.1320846111
Persson, B. N. J., and Gorb, S. (2003). The effect of surface roughness on the adhesion of elastic plates with application to biological systems. J. Chem. Phys. 119, 11437–11444. doi:10.1063/1.1621854
Persson, B. N. J., and Scaraggi, M. (2014). Theory of adhesion: Role of surface roughness. J. Chem. Phys. 141, 124701. doi:10.1063/1.4895789
Persson, B. N. J. (2001). Theory of rubber friction and contact mechanics. J. Chem. Phys. 115, 3840–3861. doi:10.1063/1.1388626
Persson, B. (2002). Adhesion between an elastic body and a randomly rough hard surface. Eur. Phys. J. E 8, 385–401. doi:10.1140/epje/i2002-10025-1
Persson, B. (2003). On the mechanism of adhesion in biological systems. J. Chem. Phys. 118, 7614. doi:10.1063/1.1562192
Persson, B. (2014). On the fractal dimension of rough surfaces. Tribol. Lett. 54, 99–106. doi:10.1007/s11249-014-0313-4
Prodanov, N., Dapp, W. B., and Müser, M. H. (2013). On the contact area and mean gap of rough, elastic contacts: Dimensional analysis, numerical corrections, and reference data. Tribol. Lett. 53, 433–448. doi:10.1007/s11249-013-0282-z
Reddy, S., Arzt, E., and del Campo, A. (2007). Bioinspired surfaces with switchable adhesion. Adv. Mat. 19, 3833–3837. doi:10.1002/adma.200700733
Sanner, A., and Pastewka, L. (2022). Crack-front model for adhesion of soft elastic spheres with chemical heterogeneity. J. Mech. Phys. Solids 160, 104781. doi:10.1016/j.jmps.2022.104781
Tiwari, A., Wang, J., and Persson, B. (2020). Adhesion paradox: Why adhesion is usually not observed for macroscopic solids. Phys. Rev. E 102, 042803. doi:10.1103/physreve.102.042803
Violano, G., Papangelo, A., and Ciavarella, M. (2021). Stickiness of randomly rough surfaces with high fractal dimension: Is there a fractal limit? Tribol. Int. 159, 106971. doi:10.1016/j.triboint.2021.106971
Wang, A., and Müser, M. H. (2017). Gauging erson theory on adhesion. Tribol. Lett. 65, 103. doi:10.1007/s11249-017-0886-9
Wang, A., and Müser, M. H. (2022). Is there more than one stickiness criterion? Friction. doi:10.1007/s40544-022-0644-3
Wang, A., Zhou, Y., and Müser, M. H. (2021). Modeling adhesive hysteresis. Lubricants 9, 17. doi:10.3390/lubricants9020017
Zhou, Y., Moseler, M., and Müser, M. H. (2019). Solution of boundary-element problems using the fast-inertial-relaxation-engine method. Phys. Rev. B 99, 144103. doi:10.1103/physrevb.99.144103
Keywords: contact mechanics, adhesion, thin sheet, traction, boundary element method
Citation: Wang A and Müser MH (2022) On the adhesion between thin sheets and randomly rough surfaces. Front. Mech. Eng 8:965584. doi: 10.3389/fmech.2022.965584
Received: 09 June 2022; Accepted: 04 July 2022;
Published: 26 July 2022.
Edited by:
Alessandro Ruggiero, University of Salerno, ItalyReviewed by:
Antonio Papangelo, Politecnico di Bari, ItalyQiang Li, Technical University of Berlin, Germany
Copyright © 2022 Wang and Müser. This is an open-access article distributed under the terms of the Creative Commons Attribution License (CC BY). The use, distribution or reproduction in other forums is permitted, provided the original author(s) and the copyright owner(s) are credited and that the original publication in this journal is cited, in accordance with accepted academic practice. No use, distribution or reproduction is permitted which does not comply with these terms.
*Correspondence: Martin H. Müser, bWFydGluLm11ZXNlckBteC51bmktc2FhcmxhbmQuZGU=