 Manish Kumar
 Raghvendra Gautam
 Naushad Ahmad Ansari
- Department of Mechanical Engineering, Delhi Technological University, Delhi, India
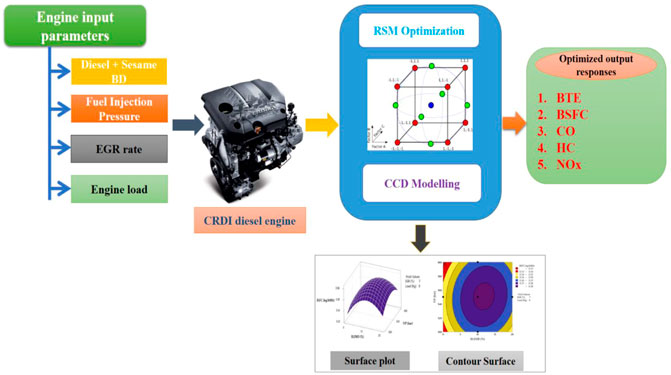
The primary aim of this experiment was to use response surface methodology (RSM) to optimize engine operating parameters for optimal performance and emission characteristics of a common rail direct injection (CRDI) diesel engine fuelled with sesame oil methyl ester (SOME)/diesel blends. The experiments were carried out on a water-cooled common rail direct injection engine with a 4-stroke, single-cylinder connected to an eddy current dynamometer. As input variables, the SOME% (0%–20%), fuel injection pressure (FIP) (500–600 bar), EGR rates (0%–14%), and engine load (0–12 kg) were used. The optimization method is utilized to maximize brake thermal efficiency (BTE) while minimizing BSFC, CO, HC, and NOx emissions. Experimental research data were used to create the RSM model through DoE (Design of experiments). The most relevant factors impacting the responses were identified using an ANOVA analysis. According to the optimization findings, the engine’s optimum working parameters were found to be a 20% SOME ratio, 577.5 bar FIP, 5.26% EGR rates, and 5.12 kg engine load. Under these operating circumstances, the optimal responses were determined to be 18.92% BTE, 0.3705 kg/kWh BSFC, 0.03190% vol. CO, 13 ppm HC, and 447.5 ppm NOx emission. At the same time, R2 values were 96.35%, 87.54%, 91.57%, 95.87%, and 93.73% for BTE, BSFC, CO, HC, and NOx respectively.
Highlights
• CRDI engine characteristics study on sesame oil biodiesel blend with diesel.
• Development of RSM regression and optimization model.
• The engine’s optimum working parameters were found to be a 20% SOME ratio, 577.5 bar FIP, 5.26% EGR rates, and 5.12 kg engine load.
• The optimal responses were determined to be 18.92% BTE, 0.3705 kg/kWh BSFC, 0.03190% vol. CO, 13 ppm HC, and 447.5 ppm NOx emission.
• The R2 values were 96.35%, 87.54%, 91.57%, 95.87%, and 93.73% for BTE, BSFC, CO, HC, and NOx respectively.
1 Introduction
The whole world’s worries about energy insecurity along with the constant demands of meeting ever-stricter emission regulations have shifted the focus of the fuel business away from fossil-based fuels and toward innovative and renewable fuel sources for IC engine applications (Pali et al., 2021). Biodiesel impresses the attention of scientists and researchers in this area. These fuels are becoming increasingly appealing in the present global energy situation since they are renewable and biodegradable, as well as offering energy security and foreign exchange savings while also addressing environmental issues (Oni and Oluwatosin, 2020; Devaraj et al., 2021; Yadav and Gautam, 2022).
Biodiesel refers to a class of compounds known as alkyl esters of fatty acids, which are produced from vegetable oils or animal fats when treated with alcohol (Ganesan et al., 2021). The thermos-physical properties of biodiesel are similar to conventional diesel fuel. As a result, it may be utilised as a fuel for diesel engines without requiring any design or equipment adjustments (Bhan et al., 2022). In comparison to fossil diesel, biodiesel has a higher cetane number (CN), oxygenated, sulphur-free and lower aromatic content, which varies depending on the processing procedure and feedstock (Yesilyurt, 2020; Aljaafari et al., 2022). Several studies have found that using biodiesel as a fuel in diesel engines reduces hazardous exhaust emissions while maintaining engine performance that is comparable to diesel fuel (Rathore et al., 2019; Sayyed et al., 2022; Seeniappan et al., 2022). Hydrocarbon (HC), carbon monoxide (CO), and smoke opacity emissions were reduced in some tests, while NOx emissions rose with biodiesel fuels (Nanthagopal et al., 2020). Despite its many benefits over diesel fuel, it has several drawbacks such as low calorific value, poor cold flow characteristics, higher viscosity, oxidative stability, and maybe increased nitrogen oxides (NOx) emissions (Govindasamy et al., 2019). P Shrivastava et al. (2019) carried out experimental studies on a diesel engine powered by various biodiesel blends of Karanja and Roselle with diesel fuel and found reductions in BTE, EGT, indicated thermal efficiency, maximum rate of pressure rise rate, ID, NOx emission, and smoke levels of 4.3%, 1.2%, 0.71%, 4.93%, 2.47%, 6.01%, and 12.59% for LA20 (20% Roselle + 80% diesel) compared to diesel, and an improvement in BSFC 6.84% and CO2 emission by 3.74%. BTE, EGT, NOx, and smoke emissions were lowered by 1.82, 1.64, 3.83, and 13.63%, respectively, with the KB20 (20% Karanja + 80% diesel) while BSFC increased by 8.5%. Singh and Verma (2019) studied the impact of Momordica charantia (L.) seeds on a diesel engine mixed with conventional diesel as an alternative to biodiesel (20%). The experiment was carried out at varied engine loads and speeds. The results indicated that a 20% biodiesel mix significantly reduced NOx emissions (51.68%, 55.88%, and 55.68% at 1,200, 1,400, and 1,800 rpm), but other emission components such as CO, CO2, PM, and SO2 were comparable to diesel. The performance and combustion parameters were found to be inferior to those of diesel.
Sesame oil is used to make biodiesel in the current study. The sesame plant is grown in tropical to temperate climates. Sesame oil is produced in large quantities in India (25% of world production). Seeds of sesame include about 50% oil contents, as opposed to 20% oil found in soybeans Sesame oil, contains 47% oleic acid, 39% linoleic acid, 4% stearic acid, and 10% palmitic acid. Sesame seeds are planted in May and June and grow for about a year. The growing season is from July through August, with harvesting taking place in September-November (Mehra and Pant, 2021; Mujtaba et al., 2021). These biofuels demand a greater fuel injection pressure (FIP) due to their higher viscosity, however, the injection pressure is limited in diesel engines. These issues can be resolved by introducing a CRDI system, which can inject fuel at any crank angle or injection pressure. With enhanced FIP, the process of mixing fuel droplets with air enhances due to the higher charge temperature accessible under high load circumstances (Pavan et al., 2021). To overcome the NOx emission, exhaust gas recirculation (EGR) is used which is a dependable and cost-effective technique for decreasing NOx emissions in diesel engines (Ramachander and Gugulothu, 2022). Since the 1990s, it has been widely used in automobile and heavy-duty diesel engines. EGR is an exhaust control technology that uses a control valve and input manifold to allow a part of the exhaust flow inside the cylinder. By recirculating exhaust gases into the engine’s cylinder, a portion of fresh air is replaced by exhaust gas. This technique decreases the combustion temperature, which lowers the quantity of NOx produced, also lowers the gas pressure inside the cylinder and increases the ID (ignition delay) due to the reduced amount of oxygen (Jayabal et al., 2020). Venkatesan et al. (2021) investigated the properties of a 2-cylinder off-road vehicle CI engine (Simpson S217-tractor) by using two types of fuel were used: P75SNB25 (Pine + soapnut biodiesel) and SNB20 (diesel + soapnut biodiesel) with a fixed rate of 10% EGR under varied loads. When comparing P75SNB25 blend fuel to diesel fuel without EGR, it was discovered that at full load, there is a reduction in surface (3.44%), EGT (3.90%), and HC (20%) emission for P75SNB25 blend fuel at 10% EGR. There is also an increase in BTE (4.44%) and CO (8%) emissions. When compared to diesel operation without EGR, the blend SNB20 with 10% EGR reduces EGT, HC, and NOx emissions by 3.12%, 20%, and 10.55%, respectively. Shrivastava and Verma (2020) tested Roselle biodiesel combined with diesel in a CI engine, varying the FIP and load, and comparing the results to neat diesel. Boosting the FIP decreased the ID period, smoke emission, and thermal, and indicated efficiency while increasing the BSFC, EGT, cylinder pressure, and maximum rate of pressure increase, as well as CO2 and NOx emissions. At 220 bar FIP, CO2 emissions increased by 1.6%, but NOx and smoke emissions dropped by 3.18% and 2.20%, respectively, for RB20 blends compared to diesel fuel.
Previous research assessments found that biodiesel blend ratio, fuel injection pressure, and EGR all had a substantial influence on the diesel engine’s characteristics. As is well known, these factors influence engine reactions in CI engines. These parameters must be considered to produce sensitive results in alternative fuel experiments. However, if any or all of the factors are taken into account, the number of tests required might be in the thousands. This is inefficient in terms of both cost and time. As a result, computer modelling applications have grown in popularity in recent years. The ability to model experiments with high accuracy while undertaking fewer experiments has proven valuable (Samet and Yeşilyurt, 2020). The goal of this study, among the multiple input factors, is to limit the number of experiments and construct a mathematical model to produce optimal results. To decrease the number of trials, computer applications that can mimic many more experiments with a limited quantity of experimental data have been created. Among these programmes, RSM stands out owing to its capacity to optimise in less time since, unlike other apps, it develops the most appropriate matrix for testing. RSM is a statistical approach that produces and forms a model based on the correlation between output and certain under-control elements, capable of multivariate estimation and optimization (Srinidhi et al., 2021). Some research has been done on engine studies utilizing RSM-based models. Khanjani and Sobati (2021) utilized the RSM technique to investigate the influence of waste cooking oil biodiesel on the performance and combustion of a diesel engine. When compared to diesel fuel, engine torque decreased by 6.33%, but BP increased by 7.86%, and BSFC increased by 9.52%. CO, UHC, and NOx emissions are also reduced by 42.86%, 34.02%, and 25.33%, respectively. Singh and Tirkey (2022) utilized RSM and ANOVA sensitivity testing to find the best engine operating conditions for dual-fueled engines driven by low-grade coal-based producer gas (PG) and diesel. According to RSM findings, the best values of the independent variables are equivalence ratio (0.12), CR (17.01), and engine load (12 kg). The measured optimal response values for BP (3.54 kW), BTE (28.23%), BSFC (0.38 kg/kWh), CO (0.38 kg/kWh), UHC (28.23%), CO2 (0.0231% vol), and NO (4.2559 ppm). S Simsek et al. (2022) conducted an experiment to examine the effects of varying concentrations of graphene oxide (GO) on CI engine characteristics while using a 30% sesame oil (SO) + 70% diesel fuel combination with RSM to establish optimum operating parameters at various engine loads. Under optimal circumstances, the responses were 1,746.77 W, 968.73 g/kWh, 259.8°C, 0.0603%, 23.13 ppm, and 185.61 ppm for power, BSFC, EGT, CO, HC, and NOx, respectively. According to the validation research, the maximum error between the optimal and experimental findings is 4.69%. According to the study’s findings, it can be inferred that the RSM model can successfully represent a single-cylinder diesel engine, saving time and resources. RSM evaluated by Sharma et al. (2022) experimented with several fuels for the CI engine, including soya and soya ethanol mixes. According to RSM’s studies, employing dual-fuel in a non-modified diesel engine improves engine performance and emissions. According to the conclusions of the investigation, an 8% soya biodiesel combination in dual fuel mode at 1486 RPM, 49.5 mm manometer airflow, and 6.27 kg engine load provides overall good engine performance. The emission parameters for BTE, VE, CO, HC, and NOx are 24.29, 68.53%, 0.0715 vol. %, 51.6 ppmv, and 1,080 ppmv, respectively.
Following a study of the literature, it is concluded that there is a need for more research into the combined influence of blending ratio, FIP, EGR rate, and load on CRDI engine performance and emissions. Furthermore, the quantification of input parameters (% of SOME FIP, EGR rate, and load) for the desired outputs in terms of mathematical relations was not addressed for the selected combinations. Thus, the primary goal of this research article is to use modelling to optimise and explore the combined effect of different blending ratios, FIP, EGR rate, and load on engine performance and emissions, and to build an empirical link between output and input parameters. The novelty of this work is that it employs response surface methodology (RSM) to generate mathematical correlations between the independent variables and the responses, which were BSFC, BTE, CO, HC, and NOx emissions levels. Thus, multifunctional research was carried out to decrease the greenhouse gas effect and improve performance by utilising an ecologically friendly fuel, to acquire the best results with the least number of tests by optimising the working circumstances with RSM.
2 Materials and methodology
2.1 Biodiesel production
Sesame oil was purchased from a local vendor in New Delhi to extract sesame biodiesel. Biodiesel can be produced from raw sesame oil through the transesterification process. In the transesterification process, the triglycerides of the oil or fats are converted into ester on reaction with a small chain of alcohol in the presence of a catalyst, producing glycerol as a by-product. In this work, 200 mL of raw sesame oil was taken into a beaker. The temperature of raw sesame oil was increased to 120°C and maintained there for around 30 min while continually stirring to reduce the water contents in the oil. After that, the oil was put through a filter to separate solid particles and dirt. Potassium-methoxide was created by dissolving potassium hydroxide (KOH) in methanol at a 20:1 ratio. When the temperature of the oil was approximately 60°C, it was blended with a potassium-methoxide solution using a magnetic stirrer. The mixture was rapidly agitated and kept at 60°C for 90 min before being transferred to the settling container to begin the separation of glycerol from sesame biodiesel. Because glycerol is denser than biodiesel, it settles towards the bottom of the container. After the separation procedure had been completed for 24 h, the container’s tap was opened, allowing the glycerol to drain (Bhatia et al., 2021).
To eliminate residues of methanol and KOH from biodiesel, it was washed three times with warm water. The oil was placed in a settling container for 4 h after each wash to separate the washing residue from the biodiesel as shown in Figure 1. The amount of water utilized in each wash was about 10%–20% of the total amount of oil. After separation, the water evidence was removed by opening the tap. Finally, the produced biodiesel was heated to 110°C for around 30 min while stirring frequently to evaporate any remaining water content. It was observed that biodiesel yield was 88.4% achieved. The ASTM standard technique was used to determine the characteristics of fuels, which are described in Table 1. Details of the equipment’s specifications used for fuel sample property measurement are shown in Table 2.
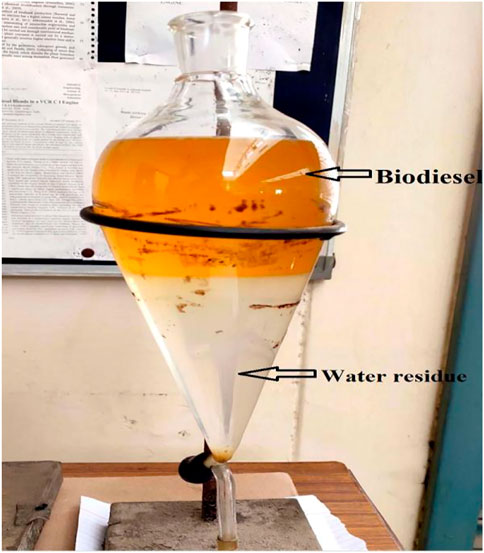
FIGURE 1. Water washing in separating funnel.
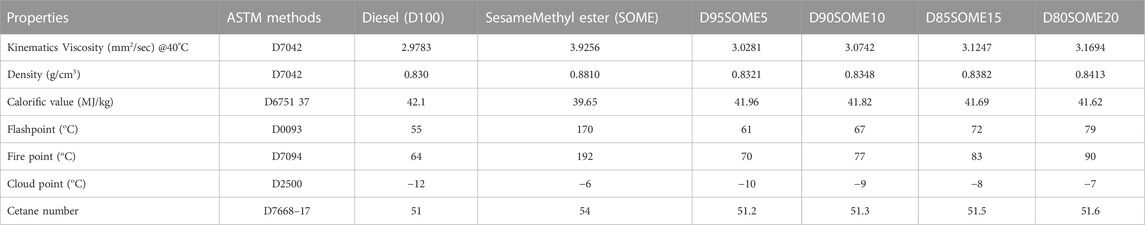
TABLE 1. Physico-chemical Properties of different blends of Sesame biodiesel.
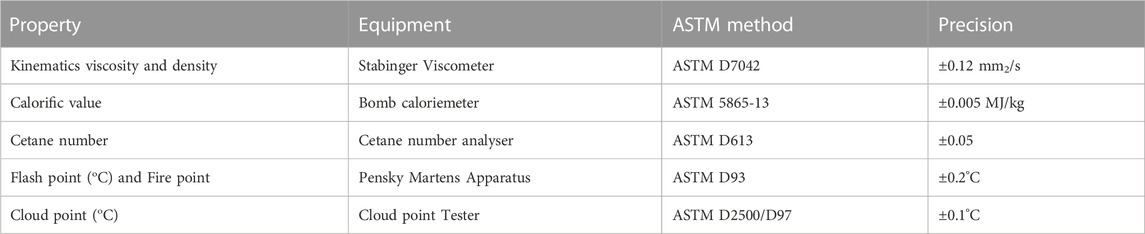
TABLE 2. The Details of the equipment’s specifications used for fuel sample property measurement.
2.2 Experimental test rig
The experimental test setup is depicted in Figure 2. Experiments are conducted on CRDI diesel engine testing equipment at a constant speed of 1,500 rpm with a varying load to investigate the influence of fuel injection pressure, exhaust gas recirculation rate, and blend ratios on the emission and performance characteristics of the engine. The engine characteristics are shown in Table 3. To monitor RPM and load, the CRDI engine is utilised in conjunction with an Eddy current dynamometer. The cylinder pressure and temperature were measured using a pressure sensor and thermocouples, respectively. An exhaust gas analyzer was used to test exhaust gas emissions. Water was pumped through the engine block and cylinder head jackets to cool the engine. The “Engine Soft” lab view in a computer is used as an interface for all the equipment connected to it to capture output parameters. A low-pressure pump transports test fuel from the tank to a high-pressure CRDI pump, where it is filtered before entering the high-pressure pump. The injection time was set at 23 bTDC, and the compression ratio to 18. An externally cooled EGR system was employed in this investigation. Cooled EGR minimises peak in-cylinder temperatures and hence avoids NOx production by lowering the intake charge temperature.
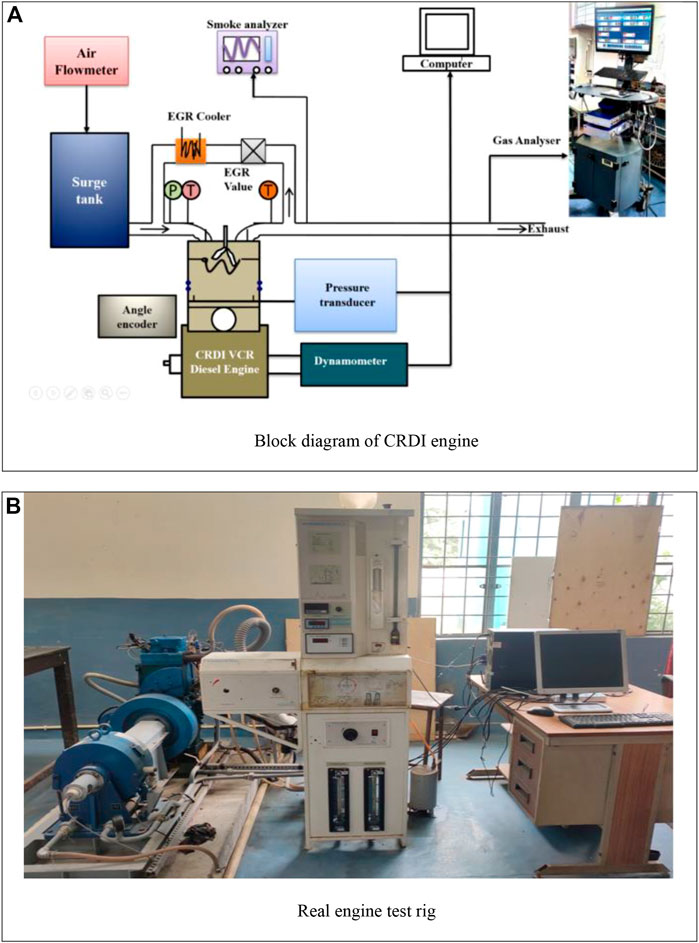
FIGURE 2. The CRDI diesel engine setup. (A) Block diagram of CRDI engine. (B) Real engine test rig.
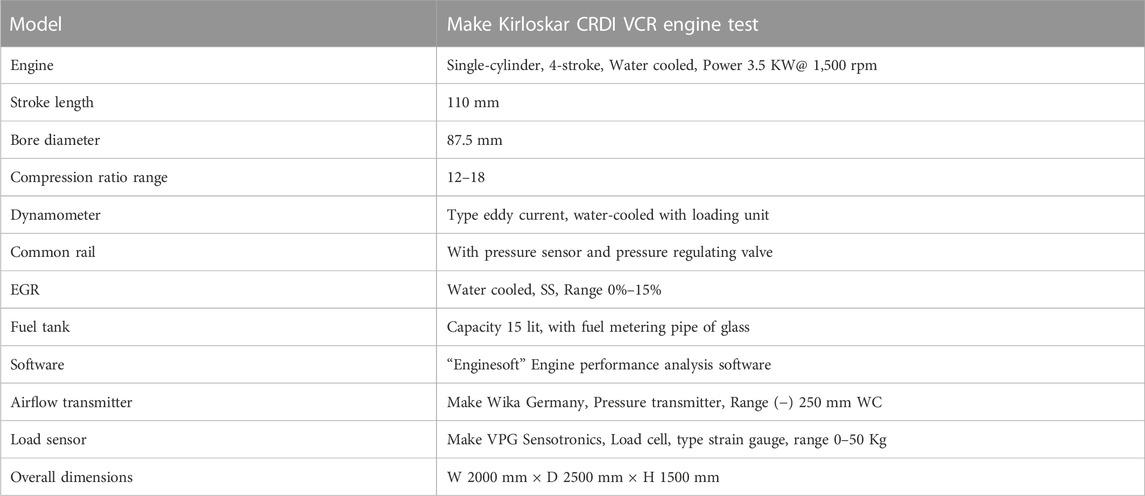
TABLE 3. The technical specification of the CRDI diesel engine.
2.3 Uncertainty analysis
Estimating the percentage of mistakes can be used to estimate the accuracy of experimental results. Experiments are prone to errors owing to instrument calibration, environment, and observations. The experimental data’s error evaluations are computed using systematic equations. To estimate the real value, the uncertainty analysis uses the average of repeat measurements. For the error analysis, the mean of six observations of a given parameter was used. All of the engine parameters include error bars to show the degree of uncertainty in the stated measurement. Table 4 compares the accuracy of several measuring devices.
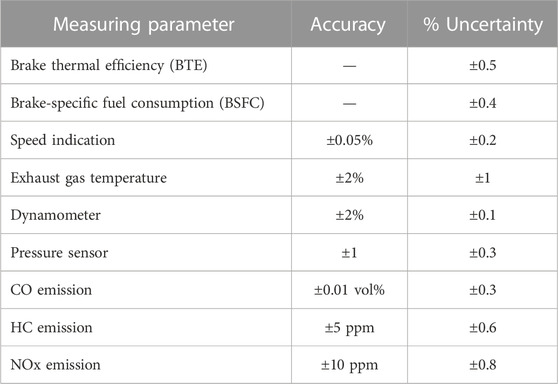
TABLE 4. Accuracy of different measurement instruments.
A popular mathematical equation is used to determine many unidentified uncertainties from well-established quantities (Chaitanya and Mohanty, 2022). The square root technique is used to assess the correctness of these results as shown in Eq. 1.
In the following formula, the symbol “Uy” denotes the deviation or uncertainty in the word “y,” which is reliant on the other component (xi). Five observations are reported in this experimental study under varied engine running settings. Repeated experiments are used to calculate the uncertainty for variables such as BTE, BSFC, HC, CO, and NOx. The following table summarises the experiment’s uncertainty when all variables’ errors are taken into account:
The uncertainty of the test
The uncertainty levels of each component of equipment were calculated. The total uncertainty of the present experiment was determined to be 1.22%, which is significantly lower than the 5%. It is generally understood that the allowable range for uncertainty is less than the stated amount. As a result, the total uncertainty of the system was within reasonable parameters.
3 Response surface methodology
3.1 RSM model and experimentation
A response surface approach is a strong tool for optimizing process parameters in different research areas such as manufacturing, I C engine, microbial product, the medical sector, and so on. This method combines statistical and mathematical techniques for model creation, analyzing the influence of several independent variables, and determining optimal variable values. The RSM model was developed using data from the experimental investigation. The primary goal is to investigate the relationship between the responses and the input factors to reduce or optimise the response attributes. It can both develop and show a simple equation for the parameters to be optimised using a small amount of experimental data. Furthermore, it is an application that may use analysis of variance to determine the influence of working parameters on outputs (ANOVA) (S Uslu et al., 2022, S Sathyanarayanan et al., 2022). The RSM with DoE has been demonstrated to be an effective modelling technique. As a result, in the current study, RSM with “Minitab 20” was proposed for establishing the connection between the identified variables and the responses (Chelladurai et al., 2021). This technique not only saves money and time but also provides the necessary knowledge on interaction effects with a lesser number of tests.
For each of the four input variables, five levels were chosen in this experiment. The discovered variables and their levels are shown in Table 5. Table 6 summarises the data obtained for performance metrics such as BTE and BSFC, as well as emission characteristics such as HC, CO, and NOx, during the current study.
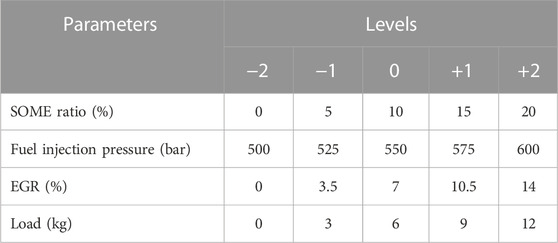
TABLE 5. The input variables with their levels.
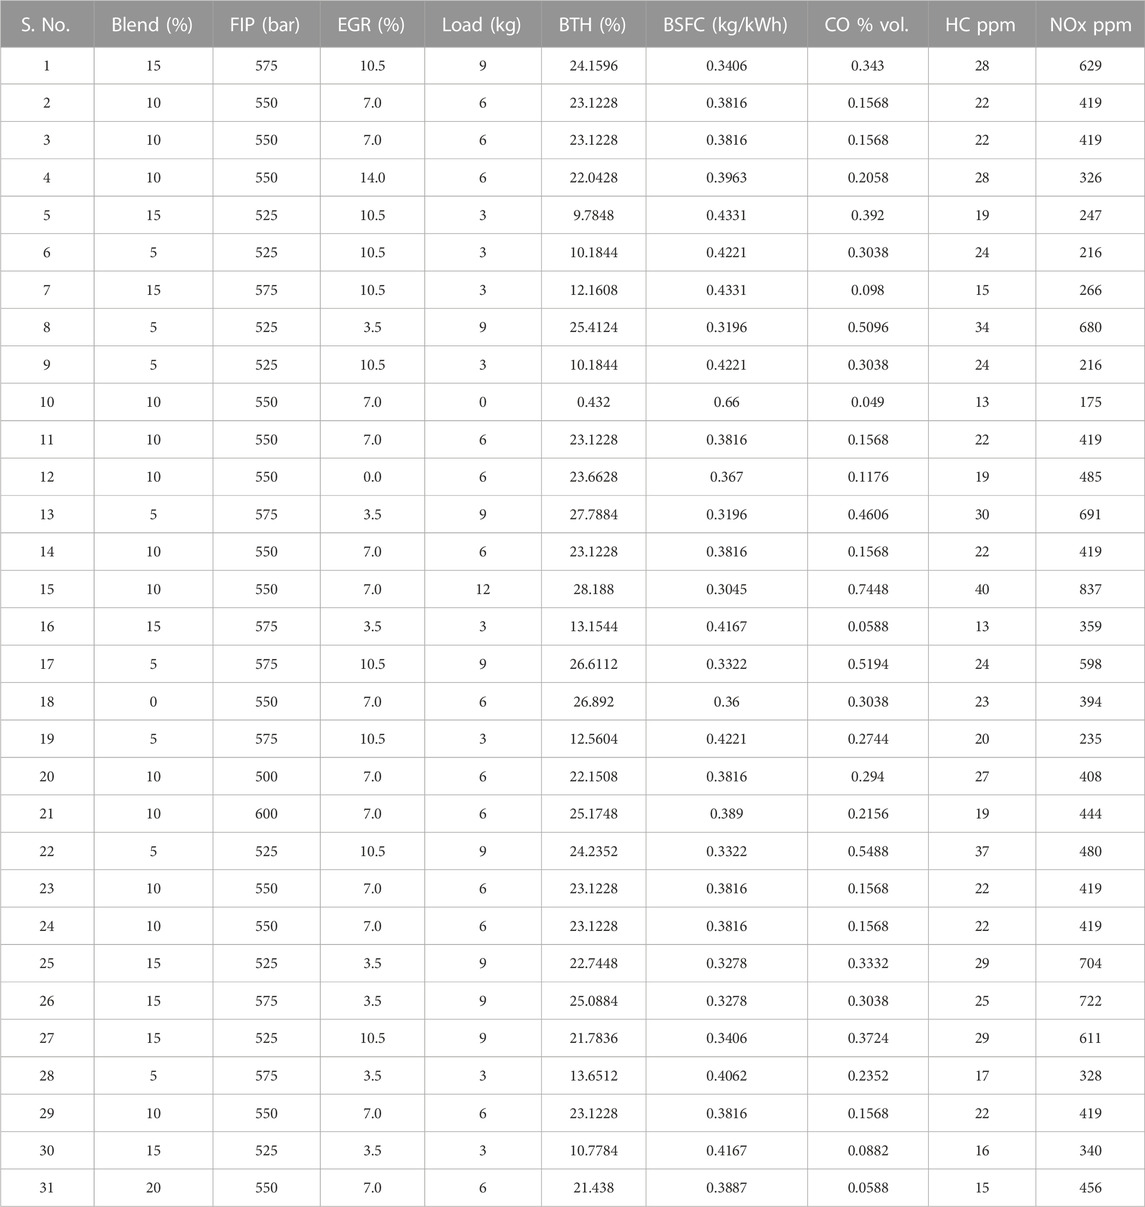
TABLE 6. The actual values of independent variables along with their output responses.
The RSM technique of optimization entails three key steps: statistically constructing the experiments, predicting the coefficients in a mathematical model, forecasting the response, and verifying the model’s appropriateness (Eq. 2) inside the experimental setup (Figure 3).
where S denotes the system response and Xn denotes the component of action. One useful aspect of RSM is the ability to use the analysis of variance (ANOVA) approach to create an appropriate model between the response and independent variables. The 2nd order mathematical model presented in Eq. 3 may be used to calculate S and it is stated as follows (Pereira et al., 2021, MK Yesilyurt et al., 2022):
where S is the response, ao is the average of the responses, and ai, aii, and aij are the response coefficients. The 2nd, 3rd, and 4th terms, respectively, indicate linear, higher-order, and interaction effects and
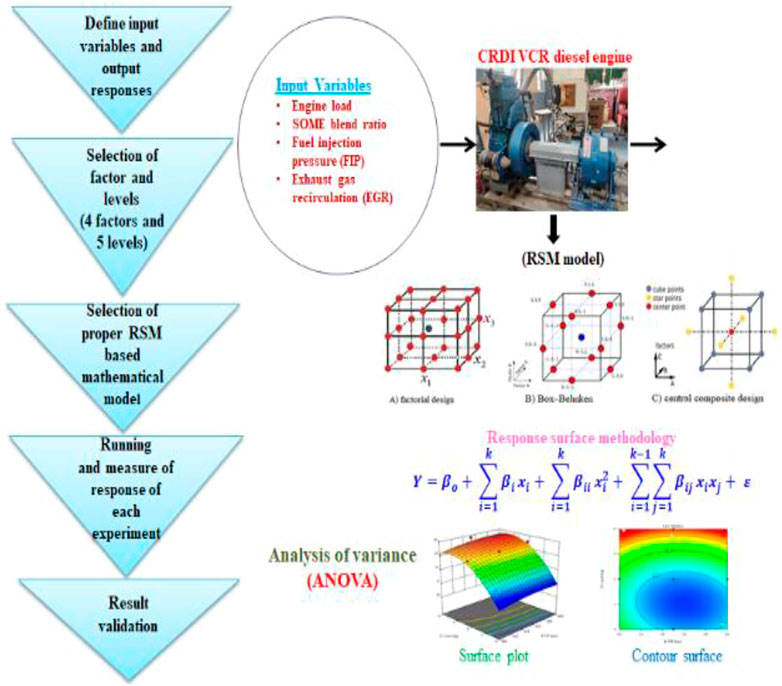
FIGURE 3. Description of optimization stages for the variables.
In this research, the influence of four factors on the efficiency and exhaust of a CRDI engine is evaluated in order of importance: SOME%, FIP, EGR, and engine load. A central composite design (CCD) with the face in the centre is chosen. Because it allows for the construction of a 2nd order model for the response, the CCD is most commonly used to obtain the response surface. This sort of design occurs when the distances from both axial points, which serve as the CCD’s factorial points, to the centre are the same central distance, resulting in the same chances in the available response at all places of a centred sphere at the origin. The following correlation (Eq. 4) is used to calculate the number of points necessary for the four parameters under consideration (Rejeb et al., 2021):
where N signifies the number of runs, k is the number of variables, and ao is the number of repetitions at the central design point.
3.2 ANOVA results
When determining the relevance of a mathematical model, the most commonly used statistical procedures are analysis of variance (ANOVA) as shown in Tables 7, 8. When there are more than two treatments, ANOVA is used. The p-value is defined as the choice of elimination points for the null hypothesis to be rejected at the lowest degree of significance. For analysis, the level of significance must be specified; for example, 5% (p < 0.05) to show that the treatments vary statistically. From Table 6, it was found that the p-value of blend%, FIP, and load is less than 0.05 for BTE and only load for BSFC. It means that blend%, FIP, and load have a great impact on the response BTE and for BSFC, engine load plays a significant role. Similarly in Table 7, it was observed from the p-value that blend%, EGR, and load have a great effect on CO emission. The blend %, FIP, and load have more impact on HC emission. The load and EGR have more impact on NOx emission. As a consequence, when “p” determined by ANOVA is less than the level of significance, the results can be regarded significant; but, when “p” is larger than the level of significance, the null hypothesis is true and the results are not substantially different, so there are no reasons to reject it (Kumar et al., 2021a).
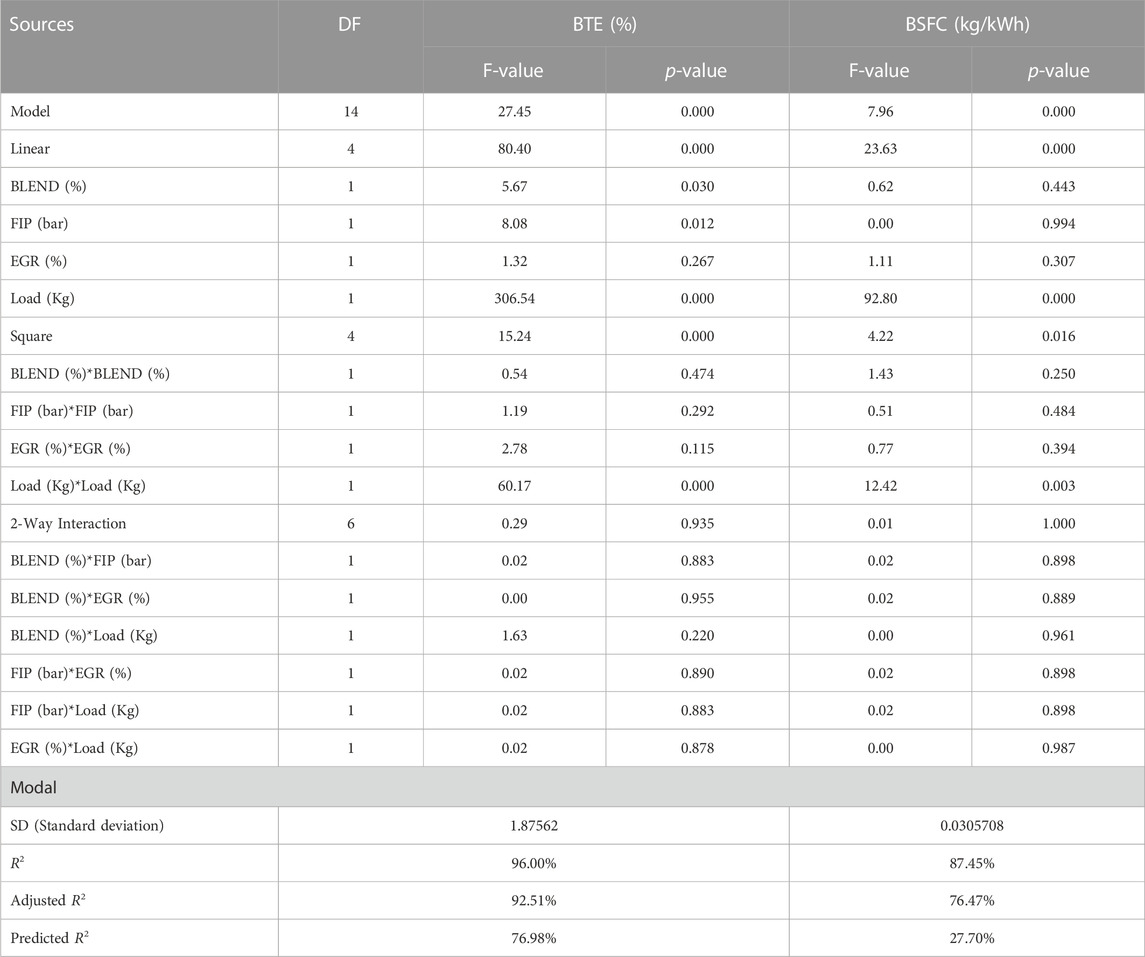
TABLE 7. ANOVA of the developed models for BTE and BSFC.
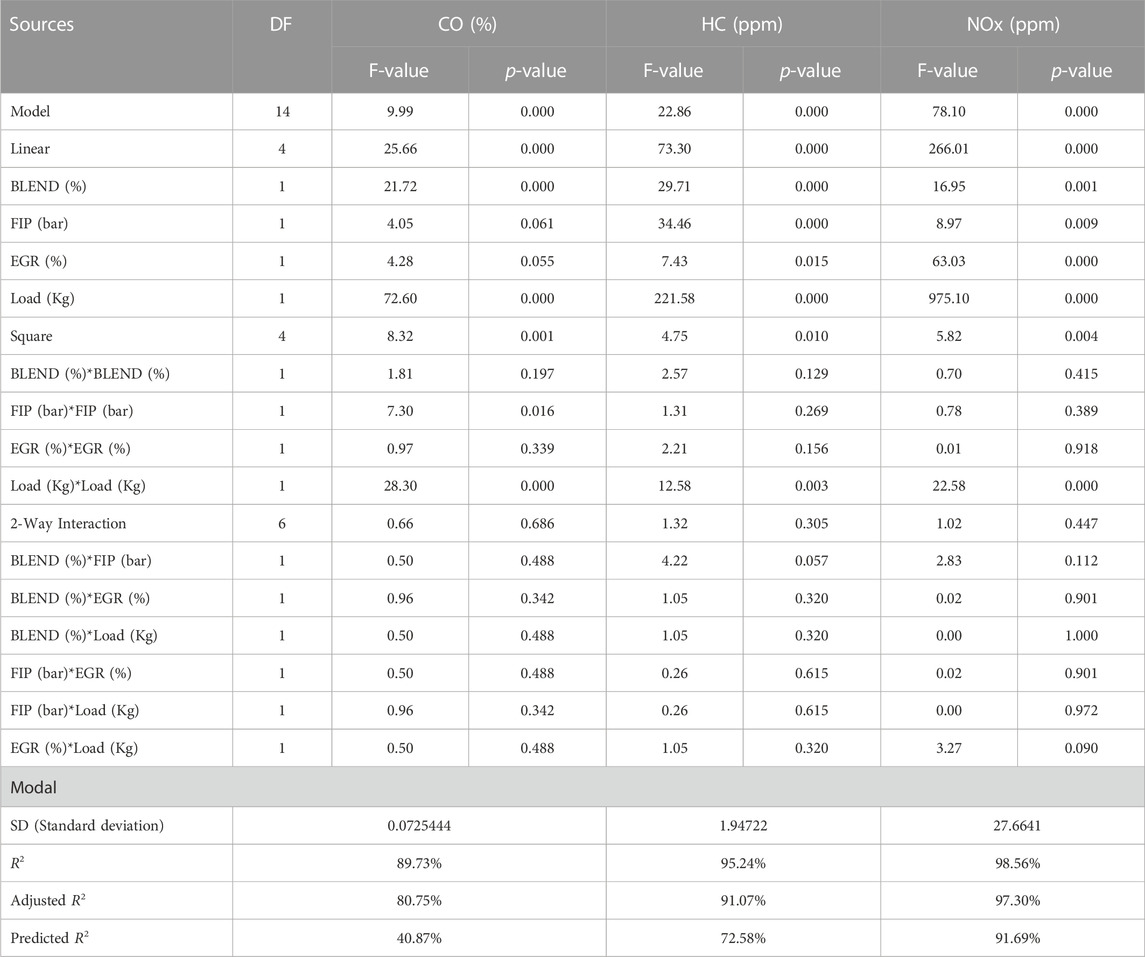
TABLE 8. ANOVA of the developed models for CO, HC, and NOx emission.
Tables 7, 8 also show the coefficient of determination (R2) for created models, demonstrating an excellent connection between the experimental and projected values of the feature. The correlation between experimental and predicted values for BTE (R2 = 0.96), BSFC (R2 = 0.8745), CO (R2 = 0.8973), HC (R2 = 0.9524), and NOx (R2 = 0.9856) was found to be excellent. The adjusted R2 is a variant of R2 that has been updated to account for the number of predictors in the model. BTE (adj. R2 = 0.9251), BSFC (adj. R2 = 0.7647), CO (adj. R2 = 0.8075), HC (adj. R2 = 0.9107), and NOx (adj. R2 = 0.9730) have high adjusted R2 values, indicating that these models are very accurate (Mutuk and Mesci, 2014; Pamnani et al., 2017).
3.3 Optimization and desirability approach
The optimization of real-world issues necessitates the use of numerous answers of interest. Techniques utilized include overlaying the contour plots for each answer, restricted optimization problems, and the desirability technique. The desirability technique is shown to offer advantages such as simplicity, software availability, and flexibility in weighing and assigning priority to individual responses. In this study, a desirability approach based on the response surface technique is utilized to optimize experiment parameters (SOME%. FIP, EGR, and load) for the measured characteristics of responses (maximize BTE, and minimize BSFC, CO, HC, and NOx). The optimization research is finished. The optimization research was carried out using MINITAB 20, in which each response is converted to a dimensionless desirability value (d) ranging between d = 0, indicating that the response is completely undesirable, and d = 1, indicating that the response is more desirable (Sharma et al., 2022). It was discovered that the desirability approach for this investigation achieved 0.7954.
Figure 4 depicts the outcomes of the RSM optimization method. When the test engine fuel input variables were set to 20% sesame biodiesel blend ratio, FIP 577.5 bar, EGR 5.26%, and load 5.13 kg, the best value of output variables was BTE (18.92%), BSFC (0.3705 kg/kWh), CO (0.03% vol.), HC (13 ppm), and NOx (447.5 ppm).
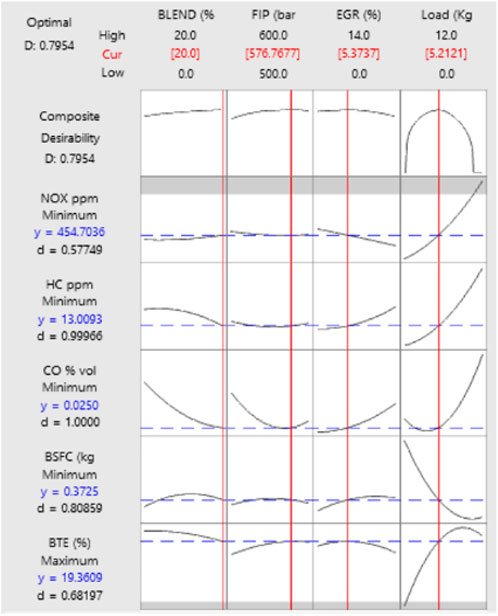
FIGURE 4. Numerical optimization ramp view for input factors and output responses.
4 Result and discussion
In the current investigation, the impacts of experiment factors such as SOME%. FIP, EGR, and load on BTE, BSFC, CO, HC, and NOx were investigated. Table 5 displays the experimental responses of 31 runs in the design matrix, as well as the points on RSM-fitted models that correspond to them. 3-D surface view plots and accompanying contour plots were created using the four independent components. Two items were considered at a time in these plots, with the other two factors staying in the middle level and serving as hold parameters.
4.1 Interactive effect of various input factors on brake thermal efficiency (BTE)
BTE refers to the combustion system’s ability to take the test fuel and gives a comparable method for determining how efficiently the fuel’s energy was transferred to mechanical work. Eq. 5 are provided in the independent factors’ 2nd-order equations to recognise the BTE created by MINITAB 20.
Figure 5 shows the cumulative impact of various input variables on the BTE. Figure 5 (i) a and (i) b represent the surface plot and contour surface for the change in BTE due to variation in biodiesel ratio (sesame oil methyl ester) and EGR. The BTE of the engine was shown to decrease as the percentage of biodiesel in the blends increased. This might be due to biodiesel’s higher oxygen content, which may have resulted in improved combustion as compared to pure diesel. Furthermore, all biodiesel blends exhibited lower BTE, which might be attributed to biodiesel’s much worse efficiency, particularly at lower CR, due to a loss in calorific value and increased fuel consumption. When the EGR was increased during the SOME/diesel mix-driven CRDI operation, the BTE fell somewhat, which is almost definitely owing to the charge dilution influence decreasing combustion quality. Kumar et al. (2021b) found a similar trend when testing linseed biodiesel blends in CRDI engines.
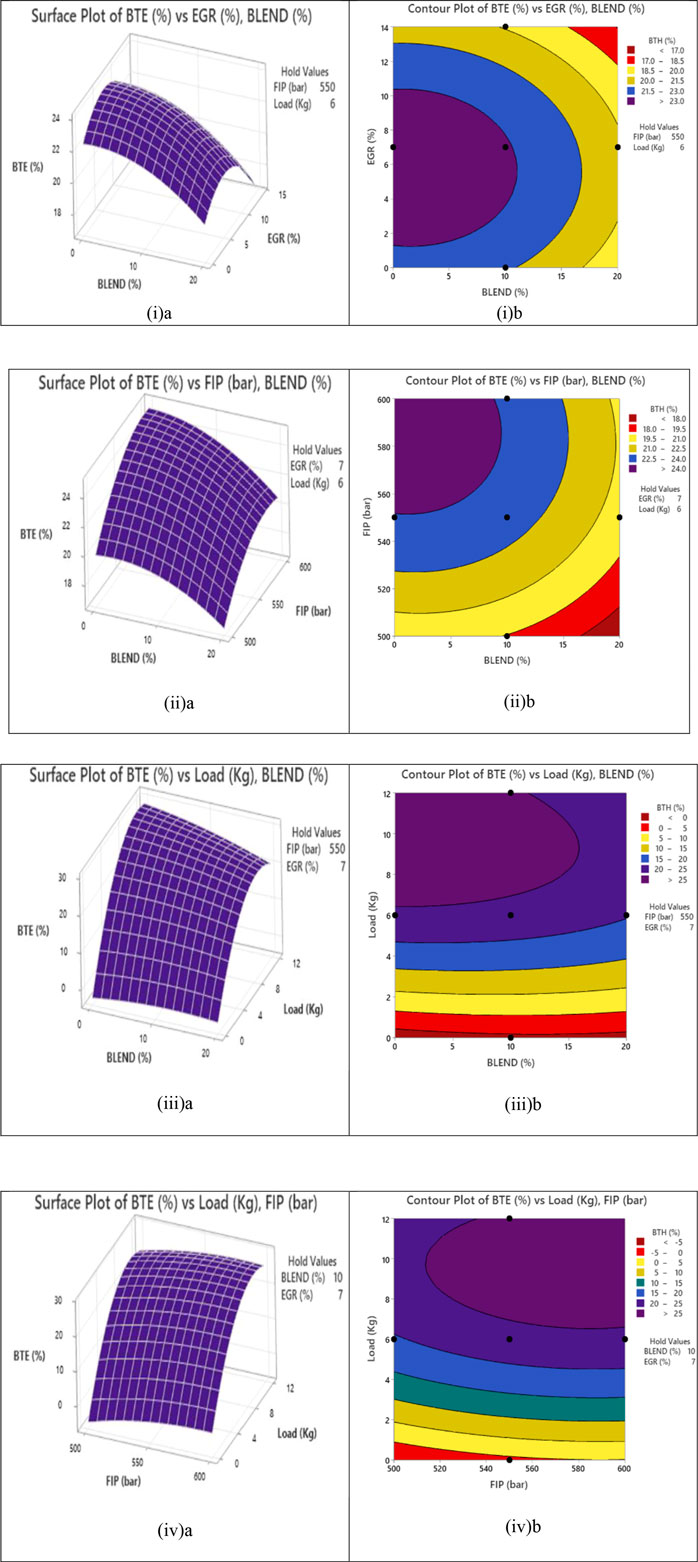
FIGURE 5. Effect of input factors on BTE.
Figure 5 (ii) a and (ii) b illustrate the surface plot and contour surface for the effect of blend% and FIP on the BTE. The BTE improves as injection pressure rises at full load, as seen in the graph. By raising the fuel injection pressure, the degree of atomization is enhanced. This is because finer atomization reduces ignition delay by increasing the surface volume ratio. The 3-D response curves for the impact of SOME% and engine load are shown in Figure 5 (iii) a and (iii) b. Due to an increase in brake power, the BTE for diesel and biodiesel blends increases as the load increases. The highest efficiency for D90SOME10 test fuel operating at 550 bar FIP and 7% EGR rates were observed to be at a 12 kg load. Figure 5 (iv) a and (iv) b show the response surface graph for the effect of load and FIP on BTE.
4.2 Interactive effect of various input factors on brake-specific fuel consumption (BSFC)
The quantity of fuel required by the engine to create a unit power output is specified as BSFC. It is a measure of the combustion efficiency of the fuel. Eq. 6 are shown in the 2nd order equations obtained in the independent factors to recognise the BSFC created by MINITAB 20.
Figure 6 depicts the 3D response curves displayed with the interaction impacts of the process variable on the BSFC utilizing the design of expert (DOE) software against any two independent variables while maintaining other variables at their zero level. Figure 6 (i) a and (i) b demonstrate the impact of sesame biodiesel% and EGR rates on BSFC through response surface curves. It was discovered that when the proportion of SOME biodiesel in the test fuel increases, the BSFC value first gets increases. The main reason for this is that the calorific value of biodiesel declines as the proportion of biodiesel in blends increases, necessitating an increase in blend flow rate to maintain the same operating conditions in terms of power output for all test fuels. After 10% SOME, BSFC values gets decreased as shown in graph. Because oxygen enhances combustion efficiency, it takes up space in the mix and so slightly raises the apparent fuel consumption rate noticed when running a biodiesel engine. These findings are consistent with comparable observations recorded by Sharif et al. (2020) after testing Nodularia Spumigena microalgae in a diesel engine versus diferent vegetable oil derived biodiesel. The combined effect of blend ratio and EGR on BSFC are described in Figure 6 (i) a and (i) b through response surface and contour plot. The value of the BSFC rises as the EGR levels increase. This is because when the EGR rate increases, the combustion temperature, and oxygen concentration fall, leading combustion to degrade. Additionally, when the EGR rate increases, so do the combustion time, but volumetric combustion decreases, resulting in increased fuel consumption.
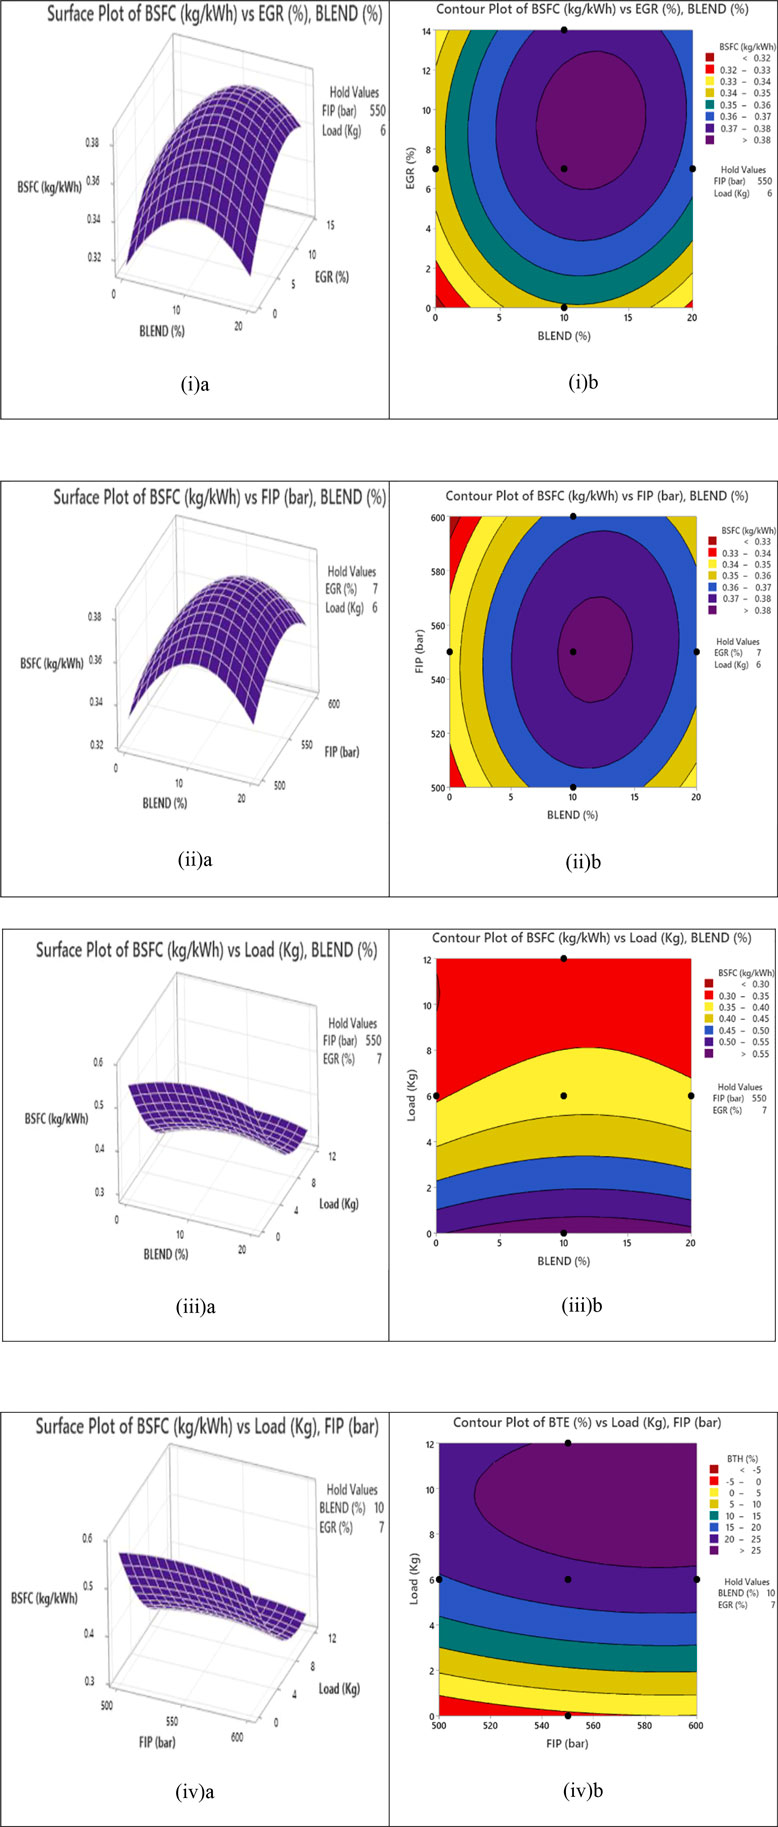
FIGURE 6. Effect of input factors on BSFC.
The combined effect of blend ratio and FIP on BSFC is depicted in Figure 6 (ii) a and (ii) b through response surface and contour plot. With an increase in FIP, the BSFC values decreased. This might be due to finer atomization and better mixing at greater FIP. Figure 6 (iii) a and (iii) b depict the change in BSFC at various blend% and engine loads. According to the result obtained, raising the engine load from zero to full load results in a declining trend in the BSFC. This might be owing to better atomization at greater pressures, which allows for a rapid rate of heat release. The impact of load and FIP on the variation of BSFC illustrates in Figure 6 (iv) a and (iv) b.
4.3 Interactive effect of various input factors on carbon dioxide (CO) emission
Carbon monoxide is produced when there is insufficient oxygen for the combustion cycle yet the fuel-air mixture is high enough for combustion to proceed in the engine. Because there is not sufficient oxygen for carbon to be converted to CO2, some of the fuel is not burned and some carbon is turned into CO. Poor mixing, concentrated rich patches, inefficient burning, and an inadequate supply of oxygen all contribute to carbon monoxide emissions. Eq. 7 are shown in the independent factors’ 2nd-order equations to recognise the reactions to CO emission created by MINITAB 20.
The interaction impact of all control settings on carbon monoxide emissions is depicted in Figure 7. Figure 7 (i) a and (i) b show the combined effect of mix ratio and EGR. Because of their increased oxygen content, biodiesel blends were shown to have reduced CO emissions when utilized as a test fuel. The presence of more oxygen in the fuel promotes complete combustion, resulting in decreased CO emissions. It was also demonstrated that raising EGR rates on a CRDI engine decreases CO oxidation owing to decreased oxygen concentrations, resulting in a modest increase in CO emissions.
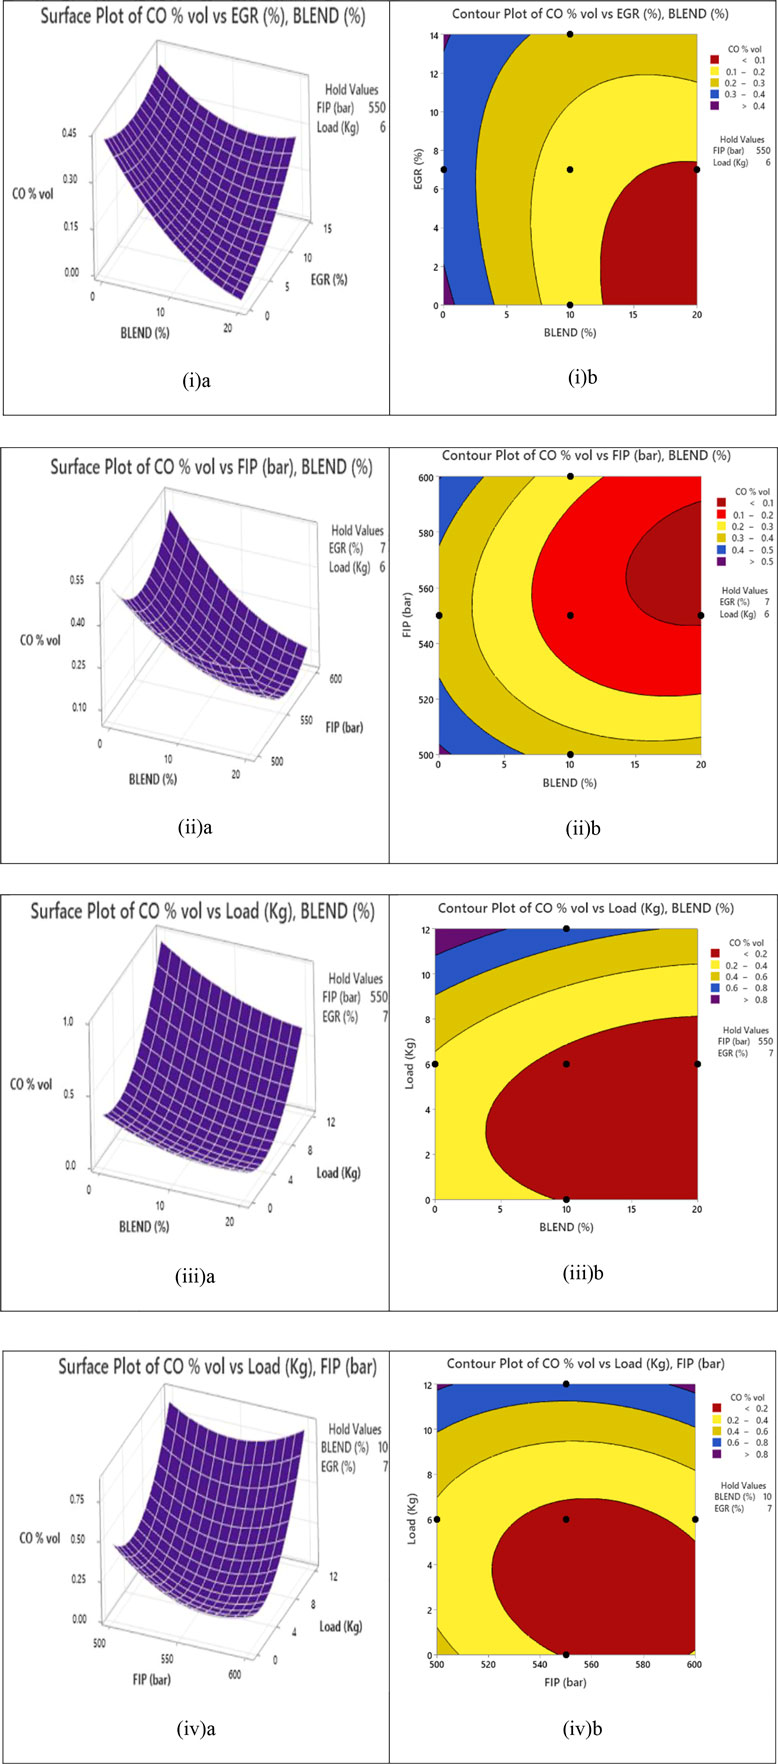
FIGURE 7. Effect of input factors on carbon dioxide (CO) emission.
Figure 7 (ii) a and (ii) b depicts the variation in CO emission at various blend% and FIP. Based on this graph, it was determined that increasing injection pressure reduced CO emissions in the CRDI diesel engine. The greater the FIP, the better the fuel-air mixing and the easier and more thorough combustion of the tiny droplets. CO emissions are reduced as a result of these effects. These findings are congruous with Kim et al. (2019), who got a similar outcome by using a diesel/biodiesel blend with FIP. Figure 7 (iii) a and (iii) b show the combined effect of blend percentage and load on CO emission via a response surface and contour plot. CO emissions are higher at low engine load than at high engine load, as can be observed. The higher the engine load, the lower the CO emissions for all fuels. This is due to increased evaporation and mixing of air and fuels, resulting in greater in-cylinder temperatures. Figure 7 (iv) a and (iv) b show the influence of FIP and load on CO emission variation using 3-D response curves.
4.4 Interactive effect of various input factors on hydrocarbon (HC) emission
Increased HC emissions occur from improper combustion of fuel particles. Eq. 8 are shown in the independent factors’ 2nd-order equations in order to recognise the responses HC provided by MINITAB 20.
Figure 8 shows the 3D response curves with the interaction impacts of the process variable on the HC emission using the design of the expert (DOE) programme against any two independent variables while keeping the other variables at their zero levels. Figure 8 (i) a and (i) b demonstrate the fluctuation in HC emission owing to blend% and EGR using the contour surface and surface plot. The quantity of HC emissions decreases as the fraction of SOME biodiesel blends increases at all engine loads due to the increased oxygen content and higher CN. Because of the efficient atomization of the fuel, the decreased HC emission ensures that the combustion is great. In CRDI diesel engines, raising the EGR percentage increased HC emissions. This tendency might be attributed to the charge’s diluting influence on EGR use, which causes incomplete combustion and lowers BTE. Increased EGR rates can cause lower flame temperatures, leading to bigger flame-quenching zones where combustion is difficult. Appavu et al. (2021) found a similar trend when studying the effect of EGR on the emission of diesel engines.
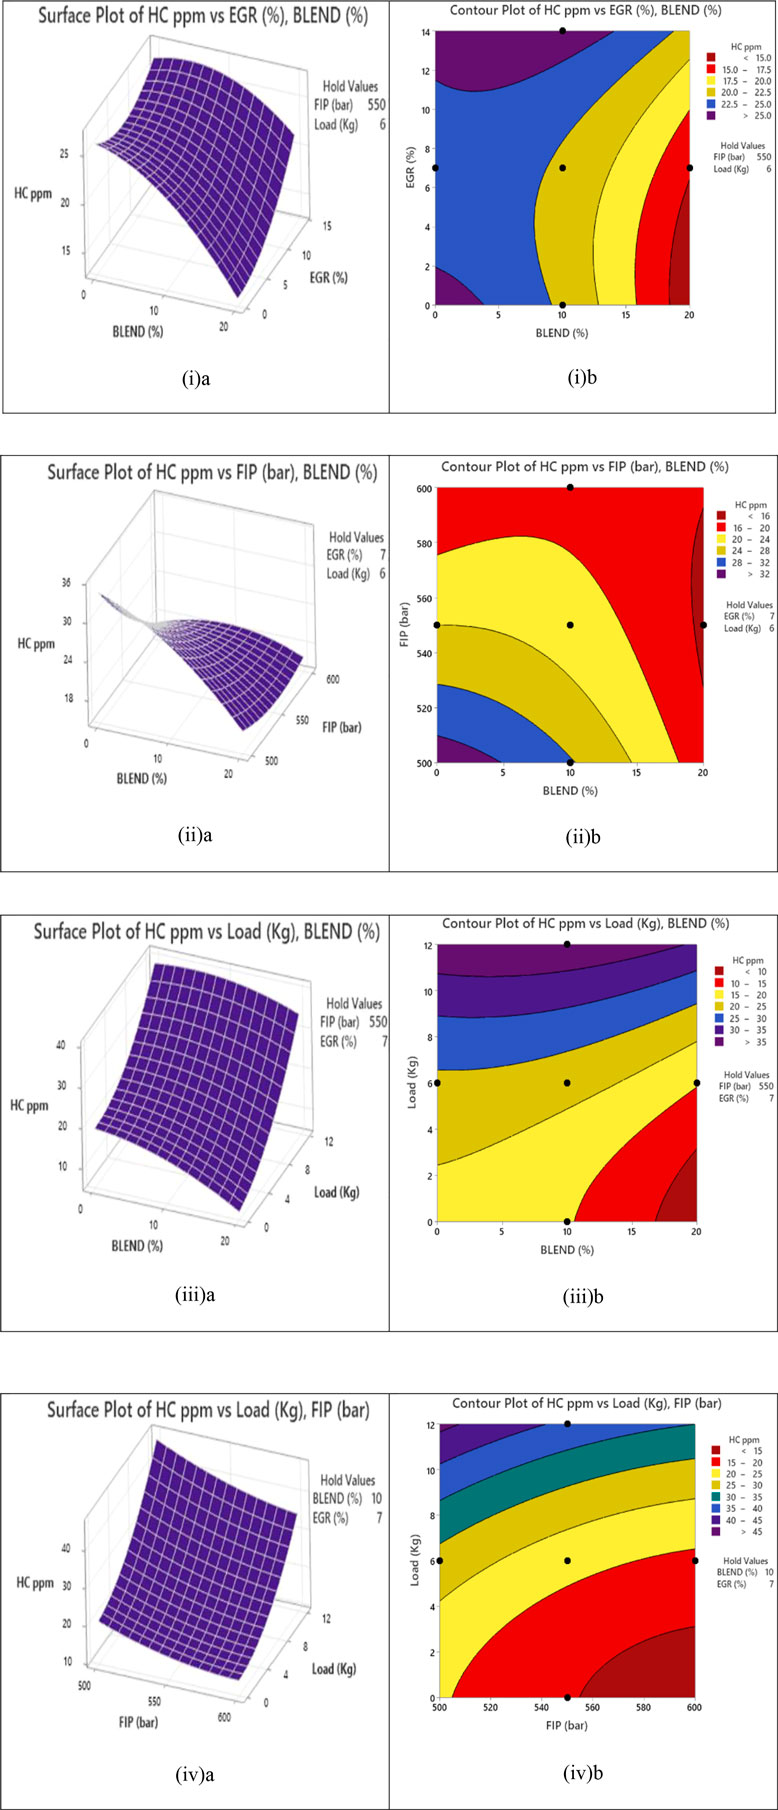
FIGURE 8. Effect of input factors on HC emissions.
Figure 8 (ii) a and (ii) b show the change in HC emission as a function of blend percentage and FIP value. As demonstrated in the graph, increasing injection pressure lowered HC emissions. When the injection pressure was increased, the fuel-air mixing in the combustion chamber improved, resulting in reduced UHC emissions than when the injection pressure was low. Figure 8 (iii) a and (iii) b show the surface plot and contour surface of HC emission as a function of blend ratio and load. When it comes to engine load, HC grows as the load rises since there is a greater replacement of biodiesel, resulting in maximum combustion of the biodiesel/diesel mix fuel. High HC levels were also caused by flame quenching and incomplete combustion. Figure 8 (iv) a and (iv) b show the effect of FIP and load on the variation of HC emission through response surface graphs.
4.5 Interactive effect of various input factors on the oxide of nitrogen (NOx) emission
This is the most significant property of biodiesel and its blend in terms of emissions. Because NOx is the most hazardous gaseous emission from engines, engine researchers are always working to reduce it. The term “thermal NOx” refers to NOx produced in a combustion chamber by the high-temperature oxidation of nitrogen (N2). The production of NOx is strongly dependent on the temperature, oxygen content, and reaction time in the cylinder. Eq. 9 are depicted in the 2nd order equations acquired in the independent factors to recognize the responses NOx produced using MINITAB 20.
The interaction impact of all control factors on NOx emission variation is depicted in Figure 9. Using 3-D response curves, Figure 9 (i) a and (i) b show the cumulative effect of blend ratio and EGR on NOx emission. As the quantity of biodiesel in the fuel mix grew, so did NOx emissions. In the presence of the chemically bound oxygen content in biodiesel (SOME), NOx generation rose and became significant, leading to higher levels of NOx emissions than diesel fuel. The most important concern is the amount of NOx emissions created by biodiesel combustion in engines. The primary purpose of the EGR technology in this study was to reduce NOx emissions. When EGR is employed in CRDI engines, NOx emissions are reduced. This was most likely due to the low temperature of the exhaust since the oxygen content in the cylinder’s fresh air was decreasing. Because oxygen availability is lower at lower loads than at higher loads, NOx generation at higher loads may be greater than at partial loads. Inefficient fuel combustion happens due to a shortage of oxygen in the combustion chamber, resulting in a low flame temperature, which inhibits the formation of NOx. While higher EGR rates result in lower NOx emissions, they also result in increased BSFC and lower BTE. Bragadeshwaran et al. (2019) also observed a reduction in NOx emission with the employment of EGR on diesel engines fulled with lemon peel oil and diesel blend.
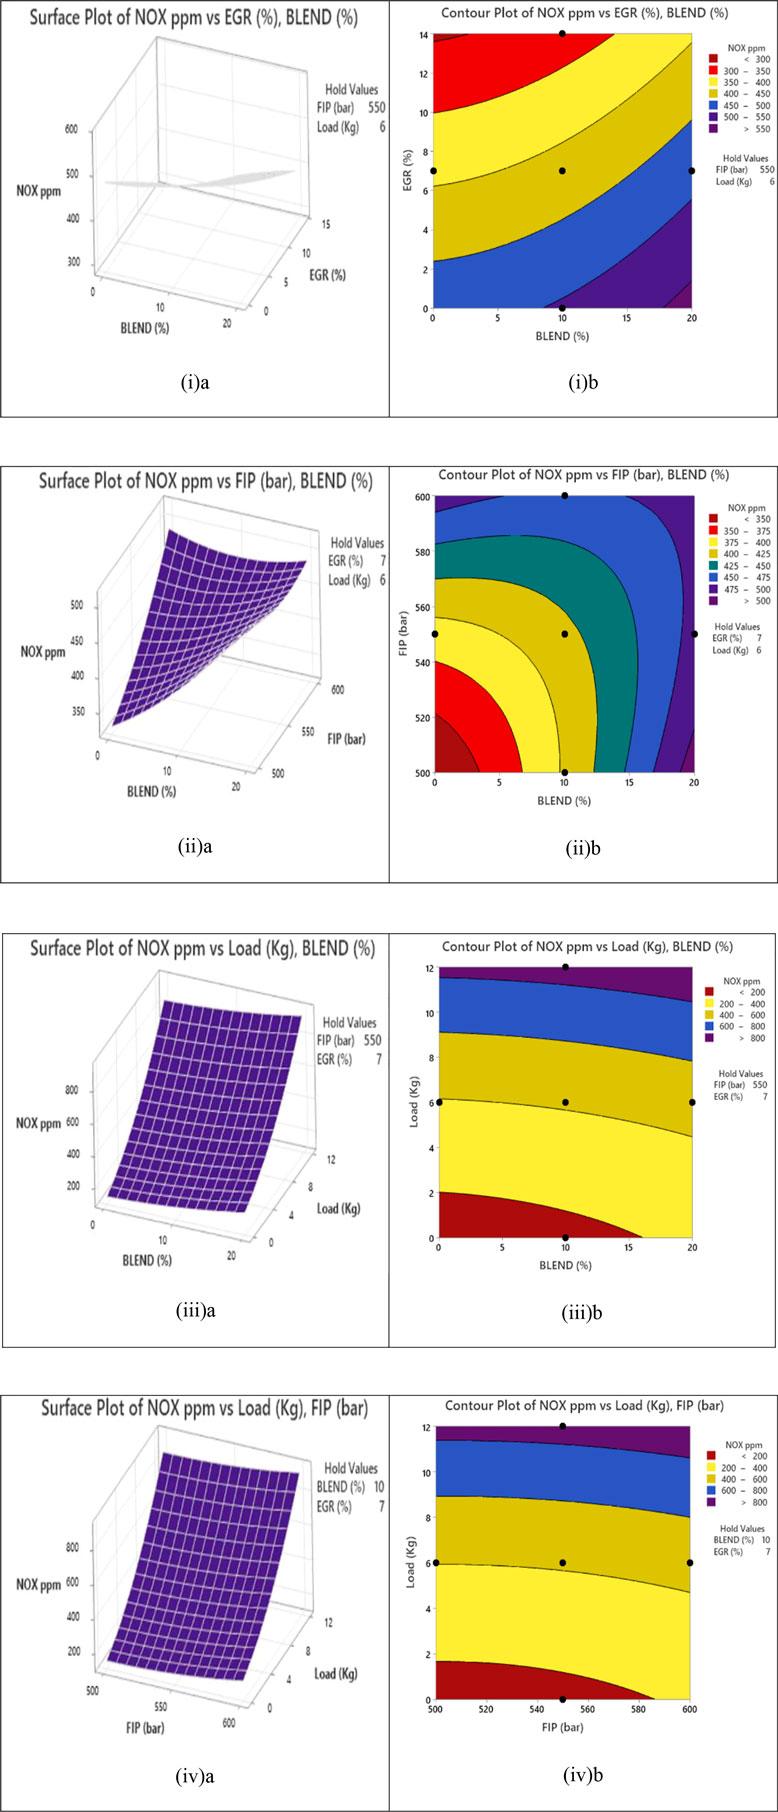
FIGURE 9. Effect of input factors on NOx emission.
The surface plot and contour surface in Figure 9 (ii) a and (ii) b show the impact of blend% and FIP on NOx emission. Increasing injection pressure, as shown in this graph, enhanced NOx emissions. The particle diameter reduced when the injection pressure was raised, and the biodiesel–diesel fuel spray vaporized quickly. Liquid fuel, on the other hand, cannot penetrate very far into the combustion chamber. As a result, increased injection pressure initially results in quicker combustion rates and higher temperatures. As a result, NOx concentrations begin to rise. Mirhashemi and Sadrnia (2020) found a similar trend with various biodiesel blends. The effects of blend % and load on NOx emission fluctuation are depicted in Figure 9 (iii) a and (iii) b. The NOx emission is determined by the combustion chamber temperature, which is regulated by the applied load. As a result, increasing the load will always result in increased NOx emissions. According to the study, NOx emissions increased with increasing engine load for all of the fuels examined. Through a surface plot and contour surface, Figure 9 (iv) a and (iv) b demonstrates the influence of FIP and engine load on NOx fluctuation.
5 Confirmation of the optimized results
The trials were repeated three times at the optimal parameters to confirm the optimized findings. The average of three measured outcomes was used to compute the actual responses. Figure 10 presents the average of the experimental values, and projected values, and Figure 11 shows the percentage errors of the corresponding output responses. Confirmation experiments were carried out on a diesel engine running on sesame biodiesel, with input parameters (20% SOME ratio, 577.5 bar FIP, 5.26% EGR rates, and 5.12 kg engine load) and performance and emission parameters (BTE, BSFC, CO, HC, and NOx) monitored. The RSM predictions were found to be within the allowed range with experimental findings when mean percentage errors were kept to a bare minimum. The verification findings showed that the models created were relatively accurate, with the percentages of prediction error in good agreement.
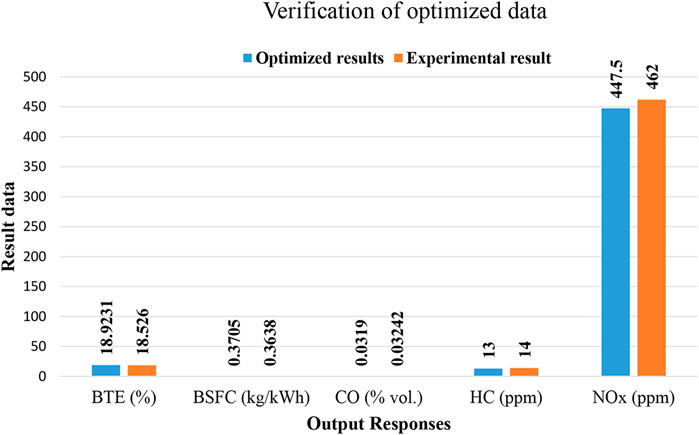
FIGURE 10. The validation of optimized results experimentally. 20% SOME ratio, 577.5 bar FIP, 5.26% EGR rates, and 5.12 kg engine load.

FIGURE 11. The percentages errors between optimized results and experimental results.
6 Conclusion
In this study, the effects of main operational factors including FIP, EGR, and load on the performance and emissions of a CRDI diesel engine were explored using biodiesel synthesized from sesame oil blended with pure diesel to determine the best sesame biodiesel/diesel blends for CRDI engine performance and exhaust emissions to reduce BSFC, CO, HC, NOx and maximize the BTE. The Design of Experiments (DoE) based on response surface methodology (RSM) was extremely useful in designing the experiment, and the statistical analysis assisted in identifying the significant parameters that have the greatest influence on engine efficiency and emissions. To describe the correlations between performance and emission parameters, including input components SOME mix concentration, FIP, EGR, and engine load, a 2nd model was effectively created. The following conclusions can be made from this work.
• BTE was found to be maximum (28.188%) at process parameters i.e. blending of SOME 20%, 550 bar FIP, EGR 7%, and 12 kg engine load. At this configuration, the BSFC was also found to be minimum. The value of CO was obtained to be minimum (0.049%) at the no-load condition. The EGR has a great impact on NOx emissions. At 14% EGR rates, the emission of NOx reduces by 11%.
• The optimized NOx emission was obtained at 447.5 ppm at 20% SOME ratio, 577.5 bar FIP, 5.26% EGR rates, and 5.12 kg engine load.
• At 20% SOME ratio, 577.5 bar FIP, 5.26% EGR rates, and 5.12 kg engine load, high desirability of 79.6% was reached.
• This situation was deemed to have the best characteristics for the test engine, with 18.92% BTE, 0.3705 kg/kWh BSFC, and 0.03190% vol. CO, 13 ppm HC, and 447.5 ppm NOx emission.
• The ANOVA study revealed that the equivalent values of R2 (96.35%, 87.54%, 91.57%, 95.87%, ad 93.73% for BTE, BSFC, CO, HC, and NOx respectively) and adjusted R2 in the current model suggest that the present proposed model could be effectively matched with the experimental outcomes.
• Under the 95% confidence level, all of the generated regression models for BTE, BSFC, CO, HC, and NOx were determined to be statistically significant.
Thus, by using the RSM technique, the number of experiments may be decreased, resulting in lower expenses and less time spent on future research. Furthermore, it is concluded that RSM is an effective optimization approach for CRDI engines operating under multi-objective optimization parameters. There is a future scope in the utilization of non-edible oil such as waste cooking oil. Other advantages of using waste cooking oil to generate biodiesel include waste product management and resource efficiency.
Data availability statement
The original contributions presented in the study are included in the article/Supplementary Material, further inquiries can be directed to the corresponding author.
Author contributions
MK: Methodology, conceptualization, validation, writing—original draft. RG: Writing—review and editing. NA: Investigation, writing—review and editing.
Acknowledgments
The author(s) would like to express gratitude to the academic members of the Mechanical Engineering Department at Delhi Technological University in Delhi, India, for making this experiment possible by providing the necessary equipments and machines.
Conflict of interest
The authors declare that the research was conducted in the absence of any commercial or financial relationships that could be construed as a potential conflict of interest.
Publisher’s note
All claims expressed in this article are solely those of the authors and do not necessarily represent those of their affiliated organizations, or those of the publisher, the editors and the reviewers. Any product that may be evaluated in this article, or claim that may be made by its manufacturer, is not guaranteed or endorsed by the publisher.
References
Aljaafari, A., Fattah, I. M. R., Jahirul, M. I., Gu, Y., Mahlia, T. M. I., Islam, M. A., et al. (2022). Biodiesel emissions: A state-of-the-art review on health and environmental impacts. Energies 15 (18), 6854. doi:10.3390/en15186854
Appavu, P., Madhavan, V. R., Venu, H., and Mariadoss, A. (2021). Effect of fuel additives and exhaust gas recirculation in biodiesel fuelled CI engine: A review. Int. J. Ambient Energy 42 (15), 1803–1809. doi:10.1080/01430750.2019.1614995
Bhan, S., Gautam, R., and Singh, P. (2022). An experimental assessment of combustion, emissions, and performance behavior of diesel engine fuelled with New developed biofuel blend of two distinct waste cooking oils and metallic nano-particle (Al2O3). Sci. Iran. 0, 0. doi:10.24200/sci.2022.58882.5947
Bhatia, S. K., Bhatia, R. K., Jeon, J. M., Pugazhendhi, A., Awasthi, M. K., Kumar, D., et al. (2021). An overview on advancements in biobased transesterification methods for biodiesel production: Oil resources, extraction, biocatalysts, and process intensification technologies. Fuel 285, 119117. doi:10.1016/j.fuel.2020.119117
Bragadeshwaran, A., Kasianantham, N., Kaisan, M. U., Reddy, D. M. S., Aravind, K. M., Paul, N., et al. (2019). Influence of injection timing and exhaust gas recirculation (EGR) rate on lemon peel oil–fuelled CI engine. Environ. Sci. Pollut. Res. 26 (21), 21890–21904. doi:10.1007/s11356-019-05369-7
Chaitanya, A. K., and Mohanty, D. K. (2022). Experimental investigation on the combustion, performance and emission characteristics of 1-pentanol blended waste plastic oil in a CRDI engine with EGR. Energy 256, 124574. doi:10.1016/j.energy.2022.124574
Chelladurai, S. J. S., Murugan, K., Ray, A. P., Upadhyaya, M., Narasimharaj, V., and Gnanasekaran, S. (2021). Optimization of process parameters using response surface methodology: A review. Mater. Today Proc. 37, 1301–1304. doi:10.1016/j.matpr.2020.06.466
Devaraj, A., Devarajan, Y., and Vinoth, K. I. (2021). Effect of di-ethyl-ether on biodiesel fuelled diesel engine. Int. J. Ambient Energy 42 (5), 495–499. doi:10.1080/01430750.2018.1557546
Ganesan, S., Reddy, O. Y., Reddy, K. J., and Rahul, P. (2021). WITHDRAWN: Exploration of performance and emissions characteristics of Gossypium arboreum biodiesel on diesel engine. Mater. Today Proc. doi:10.1016/j.matpr.2021.02.720
Govindasamy, P., Antony, A. G., Rajaguru, K., and Saravanan, K. (2019). Experimental investigation of the effect of compression ratio in a direct injection diesel engine fueled with spirulina algae biodiesel. J. Appl. Fluid Mech. 11, 107–114. doi:10.36884/jafm.11.SI.29426
Jayabal, R., Thangavelu, L., and Subramani, S. (2020). Combined effect of oxygenated additives, injection timing and EGR on combustion, performance and emission characteristics of a CRDi diesel engine powered by sapota biodiesel/diesel blends. Fuel 276, 118020. doi:10.1016/j.fuel.2020.118020
Khanjani, A., and Sobati, M. A. (2021). Performance and emission of a diesel engine using different water/waste fish oil (WFO) biodiesel/diesel emulsion fuels: Optimization of fuel formulation via response surface methodology (RSM). Fuel (Lond). 288, 119662. doi:10.1016/j.fuel.2020.119662
Kim, H. Y., Ge, J. C., and Choi, N. J. (2019). Effects of fuel injection pressure on combustion and emission characteristics under low speed conditions in a diesel engine fueled with palm oil biodiesel. Energies 12 (17), 3264. doi:10.3390/en12173264
Kumar, M., Ansari, N. A., Sharma, A., Singh, V. K., Gautam, R., and Singh, Y. (2021b). Prediction of an optimum engine response based on different input parameters on common rail direct injection diesel engine: A response surface methodology approach. Sci. Iran 28 (6), 3181–3200. doi:10.24200/SCI.2021.56745.4885
Kumar, M., Singh, V. K., Sharma, A., Ansari, N. A., Gautam, R., and Singh, Y. (2021a). Effect of fuel injection pressure and EGR techniques on various engine performance and emission characteristics on a CRDI diesel engine when run with linseed oil methyl ester. Energy and Environ. 33, 41–63. doi:10.1177/0958305X20983477
Mehra, K. S., and Pant, G. (2021). Production of biofuel from sesame oil and its characterization as an alternative fuel for diesel engine IOP conference series: Materials science and engineering. IOP Publ. 1116 (1), 012076. doi:10.1088/1757-899x/1116/1/012076
Mirhashemi, F. S., and Sadrnia, H. (2020). NOx emissions of compression ignition engines fueled with various biodiesel blends: A review. J. Energy Inst. 93 (1), 129–151. doi:10.1016/j.joei.2019.04.003
Mujtaba, M. A., Cho, H. M., Masjuki, H. H., Kalam, M. A., Farooq, M., Soudagar, M. E. M., et al. (2021). Effect of alcoholic and nano-particles additives on tribological properties of diesel–palm–sesame–biodiesel blends. Energy Rep. 7, 1162–1171. doi:10.1016/j.egyr.2020.12.009
Mutuk, T., and Mesci, B. (2014). Analysis of mechanical properties of cement containing boron waste and rice husk ash using full factorial design. J. Clean. Prod. 69, 128–132. doi:10.1016/j.jclepro.2014.01.051
Nanthagopal, K., Ashok, B., Kishna, R. S., Srinath, R., Kumar, M. P., and Karthickeyan, V. (2020). Experimental investigation on engine parameters variation in common rail direct injection engine fueled with biodiesel. Clean Technol. Environ. Policy 22 (2), 459–479. doi:10.1007/s10098-019-01796-9
Oni, B. A., and Oluwatosin, D. (2020). Emission characteristics and performance of neem seed (Azadirachta indica) and Camelina (Camelina sativa) based biodiesel in diesel engine. Renew. Energy 149, 725–734. doi:10.1016/j.renene.2019.12.012
Pali, H. S., Sharma, A., Kumar, N., and Singh, Y. (2021). Biodiesel yield and properties optimization from Kusum oil by RSM. Fuel 291, 120218. doi:10.1016/j.fuel.2021.120218
Pamnani, R., Vasudevan, M., Vasantharaja, P., and Jayakumar, T. (2017). Optimization of A-GTAW welding parameters for naval steel (DMR 249 A) by design of experiments approach. Proc. Institution Mech. Eng. Part L J. Mater. Des. Appl. 231 (3), 320–331. doi:10.1177/1464420715596455
Pavan, P., Bhaskar, K., and Sekar, S. (2021). Effect of split injection and injection pressure on CRDI engine fuelled with POME-diesel blend. Fuel 292, 120242. doi:10.1016/j.fuel.2021.120242
Pereira, L. M. S., Milan, T. M., and Tapia-Blácido, D. R. (2021). Using response surface methodology (RSM) to optimize 2G bioethanol production: A review. Biomass Bioenergy 151, 106166. doi:10.1016/j.biombioe.2021.106166
Ramachander, J., and Gugulothu, S. K. (2022). Performance, combustion, and emission characteristics of a common rail direct injection diesel engine fueled by diesel/n-amyl alcohol blends with exhaust gas recirculation technique. J. Energy Resour. Technol. 144 (3). doi:10.1115/1.4052977
Rathore, Y., Ramchandani, D., and Pandey, R. K. (2019). Experimental investigation of performance characteristics of compression-ignition engine with biodiesel blends of Jatropha oil and coconut oil at fixed compression ratio. Heliyon 5 (11), e02717. doi:10.1016/j.heliyon.2019.e02717
Rejeb, O., Yousef, M. S., Ghenai, C., Hassan, H., and Bettayeb, M. (2021). Investigation of a solar still behaviour using response surface methodology. Case Stud. Therm. Eng. 24, 100816. doi:10.1016/j.csite.2020.100816
Samet, U. S. L. U., and Yeşilyurt, M. K. (2020). Improving the running conditions of diesel engine with grape seed oil additives by response surface design. Int. J. Automot. Sci. Technol. 4 (3), 185–192. doi:10.30939/ijastech.770058
Sathyanarayanan, S., Suresh, S., Uslu, S., Shivaranjani, R. S., Chandramohan, V. P., and Simsek, S. (2022). Optimization of gasoline engine emission parameters employing commercial and sucrolite-catalyst coated converter using response surface methodology. Int. J. Environ. Sci. Technol., 1–14. doi:10.1007/s13762-022-03968-5
Sayyed, S., Das, R. K., and Kulkarni, K. (2022). Experimental investigation for evaluating the performance and emission characteristics of DICI engine fueled with dual biodiesel-diesel blends of Jatropha, Karanja, Mahua, and Neem. Energy 238, 121787. doi:10.1016/j.energy.2021.121787
Seeniappan, K., Venkatesan, B., Krishnan, N. N., Kandhasamy, T., Arunachalam, S., Seeta, R. K., et al. (2022). A comparative assessment of performance and emission characteristics of a DI diesel engine fuelled with ternary blends of two higher alcohols with lemongrass oil biodiesel and diesel fuel. Energy and Environ. 33 (6), 1134–1159. doi:10.1177/0958305X211051323
Sharif, S. K., Nageswara Rao, B., and Jagadish, D. (2020). Comparative performance and emission studies of the CI engine with Nodularia Spumigena microalgae biodiesel versus different vegetable oil derived biodiesel. SN Appl. Sci. 2 (5), 858–859. doi:10.1007/s42452-020-2697-0
Sharma, A., Pali, H. S., Kumar, M., Singh, N. K., Rahim, E. A., Singh, Y., et al. (2022). Effect of α-aluminium oxide nano additives with Sal biodiesel blend as a potential alternative fuel for existing DI diesel engine. Energy and Environ., 0958305X2211332. doi:10.1177/0958305X221133257
Shrivastava, P., and Verma, T. N. (2020). Effect of fuel injection pressure on the characteristics of CI engine fuelled with biodiesel from Roselle oil. Fuel 265, 117005. doi:10.1016/j.fuel.2019.117005
Shrivastava, P., Verma, T. N., and Pugazhendhi, A. (2019). An experimental evaluation of engine performance and emisssion characteristics of CI engine operated with Roselle and Karanja biodiesel. Fuel 254, 115652. doi:10.1016/j.fuel.2019.115652
Simsek, S., Uslu, S., and Simsek, H. (2022). Response surface methodology-based parameter optimization of single-cylinder diesel engine fueled with graphene oxide dosed sesame oil/diesel fuel blend. Energy AI 10, 100200. doi:10.1016/j.egyai.2022.100200
Singh, D. K., and Tirkey, J. V. (2022). Performance optimization through response surface methodology of an integrated coal gasification and CI Engine fuelled with diesel and low-grade coal-based producer gas. Energy 238, 121982. doi:10.1016/j.energy.2021.121982
Singh, T. S., and Verma, T. N. (2019). Biodiesel production from Momordica charantia (L.): Extraction and engine characteristics. Energy 189, 116198. doi:10.1016/j.energy.2019.116198
Srinidhi, C., Madhusudhan, A., Channapattana, S. V., Gawali, S. V., and Aithal, K. (2021). RSM based parameter optimization of CI engine fuelled with nickel oxide dosed Azadirachta indica methyl ester. Energy 234, 121282. doi:10.1016/j.energy.2021.121282
Uslu, S., Yeşi̇lyurt, M., and Yaman, H. (2022). Impact prediction model of acetone at various ignition advance by artificial neural network and response surface methodology techniques for spark ignition engine. Sci. Technol. Energy Transition (STET) 77, 7. doi:10.2516/stet/2022010
Venkatesan, V., Nallusamy, N., and Nagapandiselvi, P. (2021). Performance and emission analysis on the effect of exhaust gas recirculation in a tractor diesel engine using pine oil and soapnut oil methyl ester. Fuel 290, 120077. doi:10.1016/j.fuel.2020.120077
Yadav, P. S., and Gautam, R. (2022). Numerical and experimental analysis on spray characteristics of biodiesel (waste cooking oil) using pressure swirl atomizer. Environ. Prog. Sustain. Energy 41 (3), e13761. doi:10.1002/ep.13761
Yesilyurt, M. K. (2020). The examination of a compression-ignition engine powered by peanut oil biodiesel and diesel fuel in terms of energetic and exergetic performance parameters. Fuel 278, 118319. doi:10.1016/j.fuel.2020.118319
Yesilyurt, M. K., Uslu, S., and Yaman, H. (2022). Modeling of a port fuel injection spark-ignition engine with different compression ratios using methanol blends with the response surface methodology. Proc. Institution Mech. Eng. Part E J. Process Mech. Eng., 095440892211123. doi:10.1177/09544089221112373
Nomenclature
ASTM American society for testing and materials
ANOVA Analysis of variance
BTE Brake thermal efficiency
BSFC Brake specific fuel consumption
CCD Central composite design
CRDI Common rail direct injection
CO Carbon monoxide
CN Cetane number
CR Compression ratio
CV Calorific value
DoE Design of expert
EGR Exhauts gas recirculation
EGT Exhaust gas temperature
FIP Fuel injection pressure
HC Hydrocarbon
IT Injection timing
ID Ignition delay
KOH Potassium hydroxide
NOx Nitrogen oxide
RSM Response surface methodology
SOME Sesame oil methyl ester
VCR Variable compression ratio.
Keywords: sesame oil methyl ester, common rail direct injection (CRDI, ), response surface methodology—RSM, emissions, performance
Citation: Kumar M, Gautam R and Ansari NA (2023) Performance characteristics optimization of CRDI engine fuelled with a blend of sesame oil methyl ester and diesel fuel using response surface methodology approach. Front. Mech. Eng 9:1049571. doi: 10.3389/fmech.2023.1049571
Received: 20 September 2022; Accepted: 16 January 2023;
Published: 30 January 2023.
Edited by:
Ayman Elbaz, King Abdullah University of Science and Technology, Saudi ArabiaReviewed by:
Obed Majeed Ali, Northern Technical University (NTU), IraqSamet Uslu, Karabük University, Türkiye
Copyright © 2023 Kumar, Gautam and Ansari. This is an open-access article distributed under the terms of the Creative Commons Attribution License (CC BY). The use, distribution or reproduction in other forums is permitted, provided the original author(s) and the copyright owner(s) are credited and that the original publication in this journal is cited, in accordance with accepted academic practice. No use, distribution or reproduction is permitted which does not comply with these terms.
*Correspondence: Naushad Ahmad Ansari, bmF1c2hhZC5uc3JAZ21haWwuY29t