 Aruntapan Dash
 Lile Squires
 Amit Bandyopadhyay
- W. M. Keck Biomedical Materials Research Laboratory, School of Mechanical and Materials Engineering, Washington State University, Pullman, WA, United States
Additive manufacturing (AM) of metals attracts attention because it can produce complex structures in a single step without part-specific tooling. Wire arc additive manufacturing (WAAM), a welding-based method that deposits metal layer by layer, is gaining popularity due to its low cost of operation, feasibility for large-scale part fabrication, and ease of operation. This article presents the fabrication of cylindricalshaped mild steel (ER70S-6) samples with a gas metal arc (MIG)—based hybrid WAAM system. A mechanism for actively cooling the substrate is implemented. Deposition parameters are held constant to evaluate the impact of active cooling on deposition quality, inter-pass cooling time, and internal defects. Surface and volume defects can be seen on the cylindrical sample fabricated without an active cooling setup. Defect quantification and phase analysis are performed. The primary phase formed was α-iron in all samples. Actively cooled deposition cross section showed a 99% decrease of incomplete fusion or porosity, with temperature measured 60 s after deposition averaging 235°C less than non-cooled. Microstructural analysis revealed uniformity along the build direction for actively cooled deposition but non-uniform microstructures without cooling. Hardness decreased by approximately 22HV from the first layer to the final layer in all cases. Property variation can be attributed to the respective processing strategies. The current study has demonstrated that active cooling can reduce production time and porosity while maintaining uniform microstructure along the build direction. Such an approach is expected to enhance the reliability of WAAM-processed parts in the coming days.
1 Introduction
Additive manufacturing (AM) or 3D printing has found widespread enthusiasm in various industrial sectors because of its low cost of operation, minimal part-specific tooling requirements, and the ability to produce near-net shape parts in a single step. With the advancement of technology in the field of AM, application-specific structures have gained popularity in industries ranging from aerospace to defense (Bandyopadhyay and Heer, 2018). Directed energy deposition (DED) is one of the seven AM processes specified by the ASTM that use wire or powder as feedstock (Svetlizky et al., 2021; Bandyopadhyay et al., 2022a; Bandyopadhyay et al., 2022b). The energy source for any DED process can be a laser, electric arc, or electron beam to melt the feedstock (Bandyopadhyay, Bose). The wire arc additive manufacturing (WAAM) process is a type of DED process that uses wire as feedstock and an electric arc as the energy source to melt the feedstock. WAAM is a low-cost method for manufacturing metal 3D structures one layer at a time using welding technology. The origin of wire arc-based welding dates back to 1920 (Baker, 1920), but the application of this process to additive manufacturing is recent. Researchers are now exploring this approach for manufacturing near-net shape metallic parts in aerospace, automotive industry, the energy sector, the defense industry, and even marine applications, as demonstrated by a ship propeller manufactured via WAAM, known as the “WAAMpeller” (DAMEN, 2017; RAMLAB and Autodesk Reveal, 2022; Rouf et al., 2022). Due to wire feed mechanisms, WAAM is a more cost-effective and clean AM metal technology than powder-based DED processes (Derekar, 2018). WAAM is also versatile for manufacturing large parts–unlike metal powder bed fusion and powder-based laser DED processes, WAAM can provide a higher deposition rate without a build chamber size constraint. It has been reported that WAAM-based processes can reduce printing time by 40%–60% and post-processing time by 15%–20% (Wu et al., 2018). There are additional reports in the literature of recent research on the WAAM technique for several metals, focusing on titanium, aluminum, and both mild and stainless steels (Caccese et al., 2006; Cao et al., 2011; Wang et al., 2018).
Several welding techniques are employed in the development of WAAM systems, including gas metal arc welding (MIG), gas tungsten arc welding (TIG), and plasma arc welding (PAW). These systems have been investigated and paired with various motion kinematics units, such as computer numerical control systems (CNC) or industrial robotic arms. Most recently, the MIG-based WAAM system has seen the most advancement, with a high degree of freedom making this approach easier to manipulate (Kozamernik et al., 2020), (Warsi et al., 2022). MIG-based WAAM has also gained significant interest over TIG and PAW-based systems due to increased bonding strength, higher energy efficiency, and a faster metal deposition rate that results in a reduced printing time (Pattanayak and Sahoo, 2021). The feasibility of printing steel parts using a MIG-based dual electrode WAAM system (Yang et al., 2016), as well as the impact of the critical deposition process parameters on the surface roughness of low-carbon steel parts manufactured using a MIG-based WAAM, have been investigated (Xiong et al., 2018). Chen et al. (2017) investigated the microstructure and tensile properties of 316 L austenitic stainless steel manufactured by MIG-based WAAM. Conventional MIG welding and MIG-based WAAM share several similarities from the manufacturing perspective. For both, structure quality is dependent on heat input and control. For typical MIG-based WAAM systems, however, thermal energy is particularly critical, as adverse effects of repeated thermal loads on the strength-ductility combinations in steels are due to the formation of localized brittle zones (Li et al., 2014) along the inter pass regions and softening of the heat-affected zones (Zhang et al., 2012). As a result, adopting an arc welding method with a low-heat input is advantageous for WAAM.
ER70S-6 wire, a commercially available feedstock widely used for welding mild steel, is commonly selected in many industrial welding applications (Warsi et al., 2022). Structural MIG welds in general fabrication, automotive, oil and gas applications, shipbuilding, and marine applications using this wire are widespread. The behavior of ER70S-6 wire applied to a butt joint made of panel edges in Australian navy shipyards was evaluated in one such application. Weld quality was a concern, with weld-end solidification cracking a challenge (Sterjovski et al., 2014). Alloying elements, cooling rates, and compositional variations such as carbon concentration for ER70S-6 weld depositions can develop several microstructures that influence weld quality, such as polygonal ferrite, Widmanstätten ferrite (αw), bainite (B), martensite (α΄), or acicular ferrite (αa). Beyond traditional MIG welding, this adds another layer of complexity to the WAAM of ferrous alloys (Sridharan et al., 2018). Naturally, the optimization of the process parameters (Singh et al., 2020) must be performed to achieve the preferred microstructure with desirable mechanical properties in a MIG-based WAAM process (Ou et al., 2018).
In MIG-based WAAM, this ER70S-6 feedstock was used to produce a wall-shaped sample fabricated by successive deposition of weld beads and characterized by Liberini et al. (2017). Results showed a non-uniform microstructure along the build direction. The wall had a series of bainitic lamellar structures in the upper zone, equiaxed ferrite grains in the center, and a ferritic structure with pearlite strips in the lower zone. The variation in microstructure is attributed to the complex thermal cycles associated with each deposition layer. Rapid cooling and large temperature gradients during the additive manufacturing process control the orientation and morphology of the grains, producing heterogeneous microstructures and anisotropic mechanical properties (Farshidianfar et al., 2015; Wilson-Heid et al., 2017; Yang et al., 2017). Despite this pattern, WAAM processes with low heat input, such as cold metal transfer (CMT) can produce a more homogenous microstructure and reduce anisotropy in mechanical properties (Prado-Cerqueira et al., 2018). Additionally, DED-based AM of stainless steel 304-L by Wang et al. (2016) demonstrated that reducing heat input led to a finer microstructure and, thus, superior yield and tensile properties over methods with a high thermal input. This high thermal input is known to cause coarsening of ferrite grains in steels due to recrystallization or aberrant phase transformation from austenite during welding (Gook et al., 2014). In WAAM-based processes with multi-pass processing, this is a critical problem. A fast-cooling variant of the MIG WAAM technology, therefore, has the potential to enhance the HAZ toughness of steels produced via WAAM.
This study intends to provide a clear and deeper understanding of actively cooled wire arc additive manufacturing of mild steel using ER70S-6 in a MIG-based hybrid WAAM system. To that end, solid cylindrical structures were produced, with and without active cooling. Deposition welding parameters such as wire speed, power input, shielding gas, and torch travel speed are held constant to isolate and evaluate the influence of active cooling. Key parameters of interest are deposition quality measured by internal defects, deposited surface uniformity, and inter-pass cooling time. The impact of active cooling on surface defects was quantified. Various sections of the cylindrical components were also analyzed to understand the influence of active cooling on microstructure and phase formation. In addition, the hardness profile of the solid cylindrical ER70S-6 samples manufactured with and without the active cooling setup was also investigated.
2 Materials and methods
2.1 WAAM of mild steel samples
The schematic and the experimental setup established for the gas metal arc welding-based hybrid-WAAM (H-WAAM) are shown in Figure 1. The H-WAAM system primarily consists of a 3-axis CNC milling machine and a direct current (DC) welding power source, Figure 1. The welding torch of the MIG equipment was mounted on the Z-axis spindle of the CNC machine for the printing process, as shown in Figure 1C. An in-house active cooling heat exchanger is designed, manufactured, and fixed on the CNC table, Figure 1D. This heat exchanger consists of a series of passageways that route a constant flow of coolant back and forth under a thin plate, before being conducted into a storage tank below. The dimensions of the exchanger matched the substrate used in the study, but the design is parametric. Larger iterations are envisioned with greater cooling capacity available through higher flow rates, additional passages, or reduced coolant temperature. The coolant temperature for this study was 20.5°C. A commercial mild steel substrate with dimensions 150 × 150 × 12.5 mm3 (length × breadth × height) was clamped on top of the heat exchanger. The CNC table moves in X and Y directions, while the welding torch can move in Z to build near-net-shape 3D parts. Table 1 shows the chemical composition of mild steel wire (ER70S-6) with a diameter of 0.90 mm used as the filler material. The ER70S-6 wire was used because of its extensive applications, including welding structural steel components, automobiles, and pipelines.
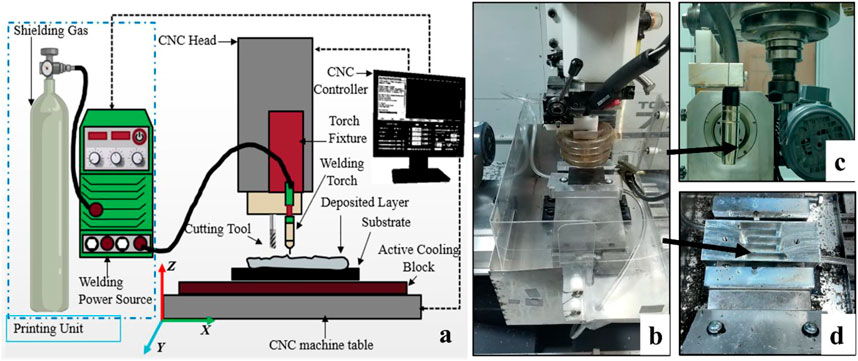
FIGURE 1. (A) Schematic representation, (B) the H-WAAM setup illustrating the coupling of a DC welder and CNC machine tool, (C) welding torch and milling cutter assembly, and (D) active cooling heat exchanger.

TABLE 1. Chemical composition of the ER70S-6 mild steel wire (Warsi et al., 2022).
2.2 Bead geometry optimization
The fabrication of parts using WAAM is referred to as a near-net-shape method since the as-deposited manufactured parts are almost in their final shapes, although minimal post-processing, such as machining, may be needed to achieve desired dimensional tolerances. The WAAM process parameters are broadly categorized into two types: fixed parameters and variable parameters. Table 2 shows the fixed parameters used for the single bead prints for process optimization.
Where η is the welding efficiency in percentage (for GMAW, η = 0.8), V is the arc voltage in volts, I is the average current in amperes, and S is the torch speed in millimeters per minute. The optimal print parameter is decided based on a stable penetration depth, consistent bead height, and the weld bead width. Figure 2 shows the single-bead experiments performed as part of the weld bead optimization. The final deposition parameters used for printing the 3D structures are given in Table 3.
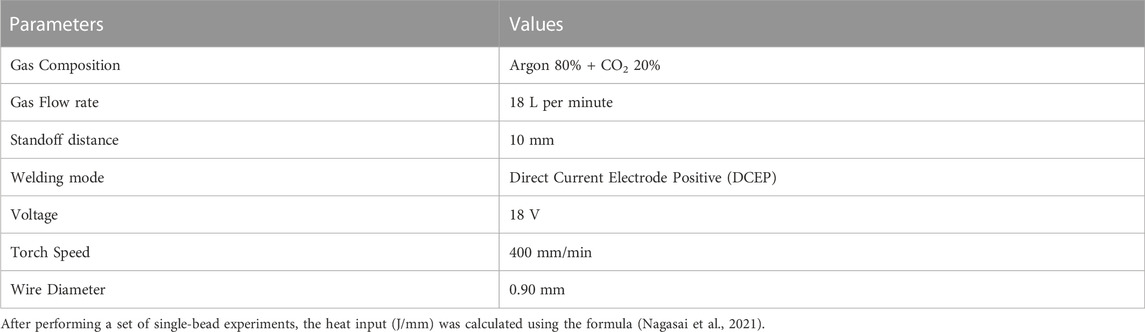
TABLE 2. Fixed process parameters for single bead prints.
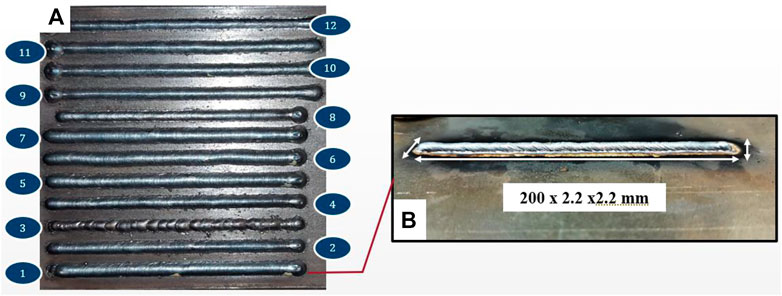
FIGURE 2. (A) Single bead parametric printing for optimization of process parameters with bead #1 exhibiting the most desirable characteristics, and (B) an enlarged view of an isolated bead produced using the optimized settings.

TABLE 3. Optimized print parameters used for solid structure printing via WAAM.
Solid cylindrical structures with a height of 65 mm and a nominal diameter of 30 mm were deposited on a mild steel (MS) substrate with and without an active cooling heat exchanger. The printing process was performed using the following process parameters, optimized experimentally to provide minimum heat input, consistent penetration, and an even ratio between bead height and bead width: an arc voltage of 18 V, an average arc current of 87A, a wire feed rate of 180 inch/min, an impedance of 5Ω, and all the fixed parameters given in Table 2. The heat input for this optimal set of parameters was calculated to be 188 J/mm. Before deposition, the substrate was cleaned and fixed to the CNC table, while the MIG welding gun was fixed perpendicularly to the substrate. The CNC table moved in the X- and Y-axis during deposition. The H-WAAM processing of the solid cylinders is shown in Figure 3.
FIGURE 3. H-WAAM processing of solid cylinder—(A) Schematic of the toolpath strategy used for printing; (B) first layer deposition displaying desirable bead overlap, (C) printed solid cylinder, (D) printed cylinder mounted for a turning operation, (E) and (F) machined solid cylinder.
After each X-Y layer was finished, an interlayer dwell time was added to minimize the effect of successive thermal cycles on the microstructure of the previously deposited layers. At the completion of each of these additional layers, the temperature of the structure was monitored using an infrared thermometer, with readings recorded at 0 s, 30 s, and 60 s. These periodic time intervals allowed each layer to cool to a temperature below 165°C (American Welding Society, 2005) before depositing a new layer. The ambient air temperature was 20.5°C, with no cooling methods utilized other than the chill plate in the case of the actively cooled specimen.
2.3 Defect quantification, phase analysis, microstructural characterization, and hardness measurement
The printed cylindrical samples were cut using a JET horizontal bandsaw lubricated and cooled by mineral oil along the longitudinal cross-section after the outer surface had been turned in a Tormach lathe chucker machine tool. Images were taken using a digital camera, and then the visible defects on the exposed inner surface of the solid cylindrical structures were quantified using open-source image processing software (GIMP 2.10.32). Surface imagery was converted to a binary image, with defects assigned black pixels. The software used pixel density within the region of interest to calculate the area. The longitudinally cut samples were then ground through 80–2000 grit size SiC sandpapers followed by polishing with one to 0.05 μm Al2O3/DI water suspension for 15 min each. Further, these polished samples were cleaned ultrasonically with ethanol for 30 min. Samples were scanned using Cu k-alpha radiation (1.54 Å at 40 kV and 20 mA) on a Rigaku mini flex 600 X-ray Diffractometer equipped with a 2-D General Area Diffraction Detector (GADDS) mounted on a theta-theta goniometer. The scanning speed per sample was kept at 5° per min between the 0–100° range of 2θ. The raw data were processed with Rigaku PDXL software.
The microstructural analysis was performed on the mirror-polished surface of the cylindrical samples. The macrostructure of the surface was assessed using a stereo microscope (Carl-Zeiss Stemi 305). Prior to the microstructure analysis, the samples were etched by submerging them in 2% Nital reagent for 30 s. Further, the etched metallographic samples were analyzed under an optical microscope (Carl-Zeiss Axiocam ERc 5s). Vickers cross-sectional hardness measurements were performed along the build direction (Z-axis) using a Phase II Plus Micro Vickers hardness tester (Upper Saddle River, NJ, United States) with a load of 1.961 N (HV0.2) and a dwell time of 15 s. Between 50 and 60 indents were taken per sample.
3 Results and discussion
3.1 Defect quantification
Figure 4 shows the solid cylindrical sample produced by H-WAAM without active cooling. A visible defect can be noticed on the top surface of the deposited sample in Figures 4A, B. However, no visible defects were observed on the cylinder’s outer surface after machining. In order to further analyze the presence of any visible defects on the inside of the cylinder, they were cut longitudinally. Figure 4C displays the visible defect on the longitudinal section of the cylindrical build. The net visible defect area was 10.5% of the total surface area when the digital surface image was processed using GIMP software. The visible defects may be categorized into incomplete fusion, porosity, or both (Guide for the Visual Examination of Welds, 2015). Weld porosity is caused primarily due to entrapped gases during solidification. Uneven weld areas, contamination, and insufficient shielding can also cause porosity. As the deposition progressed one layer at a time, the unevenness of the upper deposition surface was noted to increase. Due to this unevenness in the top surface, the distance between the torch tip and the structure surface varied, thereby changing arc length during deposition and diluting the shielding gas with atmospheric gases. With this reduction in shield gas volume, porosity in the weld became increasingly observed as the number of deposition layers grew. The variation in arc length, coupled with a constant wire feed speed, may have caused unstable melting and incomplete fusion as weld puddle characteristics fluctuated.
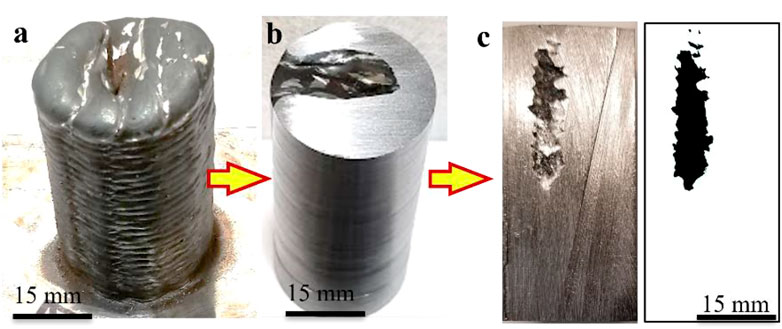
FIGURE 4. (A) WAAM printed cylinder without active cooling; (B) cylinder after the turning operation and (C) after longitudinal sectioning. A binary image was used for defect surface area analysis.
Figure 5 shows the solid cylindrical sample produced by H-WAAM with active cooling. No visible defect can be seen on the top surface of the deposited sample in Figures 5A, B. Also, no visible defects were observed on the cylinder’s outer surface after machining. In order to further analyze the presence of any visible defects on the inside of the cylinder, they were cut longitudinally. Figure 5C displays almost no visible defect on the longitudinal section of the cylindrical build. The net visible defect was calculated to be 0.1% of the surface area. This is attributed to the fact that active cooling helped reduce the overall temperature, reducing the surface’s unevenness. Further, each layer was cleaned with a wire brush to minimize the contaminant’s presence on the surface.

FIGURE 5. (A) WAAM printed cylinder with active cooling; (B) cylinder after the turning operation; (C) after longitudinal sectioning. Binary image displays reduced pore defects.
When these two methodologies are compared overall, it is noted that the quality of deposition in the actively cooled cylinder is clearly higher. A difference in defect area from 10.5% to 0.1% represents a 99% decrease, which suggests that the root cause of the defect was essentially removed by application of active cooling. A consistent deposition height during actively cooled deposition may have been the controlling variable that reduced instances of incomplete fusion, which was not observed during experiments with that methodology. This consistent deposition height is a direct outgrowth of accumulated thermal buildup in the structure, which was seen to reach much greater levels with non-actively cooled depositions.
The temperatures measured at 30 s and 60 s intervals are plotted for the cylinders printed with and without the active cooling heat exchanger, as shown in Figure 6. T at 0 s W/O AC is the temperature just after the deposition of the weld bead without active cooling, and T at 0 s W AC is the temperature just after the weld bead with active cooling, measured with an infrared thermometer. As shown in Figure 6, the temperature reduction over 60 s is higher in the case of using the active cooling setup. Also, the maximum temperature after the bead deposition without active cooling is much higher than after the deposition with active cooling. The use of active cooling helped to reach a temperature below 165°C faster than without using active cooling. This helps reduce the total deposition time and increase the production output, but more importantly, it stabilizes the deposition weld pool. A geometrically stabilized weld pool contributes to consistent deposition bead height, allowing welding arc length to remain constant throughout the deposition path and preventing incomplete fusion and related internal porosity defects.
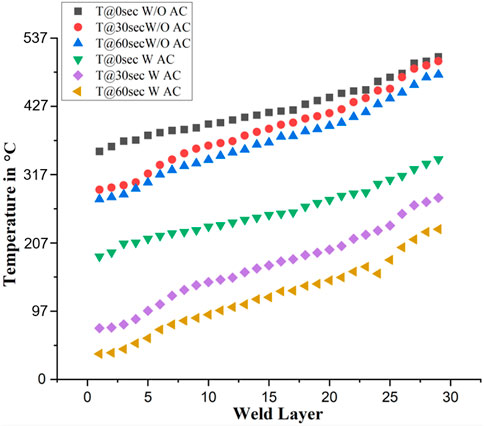
FIGURE 6. Temperature readings at 0, 30, and 60s of each deposited layer for the cylinder with and without active cooling.
3.2 Phase analysis
The X-Ray diffraction was done on both H-WAAM samples for phase identification from the bottom, middle, and top regions along the deposition direction, Figure 7. Both samples primarily showed α-iron (BCC, Ferrite). According to the JCPDS pattern 96-901-3474, the α-iron in the H-WAAM specimen without active cooling is located at 2θ of 44.65°, 64.91°, 82.23°, and 98.83°; and the α-iron with the active cooling is located at 2θ of 44.67°, 64.92°, 82.2°, and 98.77°. Both showed a strong preferred orientation along the (011) plane at 2θ values of 44.65° and 44.67°, respectively. Other diffraction peaks (020), (121), and (022) with less intensity were also observed. However, the relative intensity of the α-iron (011) increased from the bottom to the top in both samples. Rapid cooling at the bottom zone is found to be less favorable for the (110) orientation, while the equilibrium cooling at the top region promotes the (110) orientation. Again, the relative intensity of the α-iron (020) peak varies from bottom to top in both samples depending on the heat input. The sample fabricated without active cooling shows a gradual increase in the peak intensity (020) from bottom to top with an increase in heat input. However, the sample fabricated using active cooling shows a gradual decrease in the peak intensity (020) from the bottom to the top with an increase in heat input. A possible result is increased retained thermal energy and a return to near-equilibrium cooling and comparable peak intensity to the XRD reference card. No peaks of the austenite (FCC-Iron) phase can be seen, suggesting the absence of the retained austenite. Also, the volume fraction of the precipitated cementite phase in the form of lamellar pearlites is not detectable. Other researchers have reported a similar trend (Rafieazad et al., 2019), (Waqas et al., 2019).
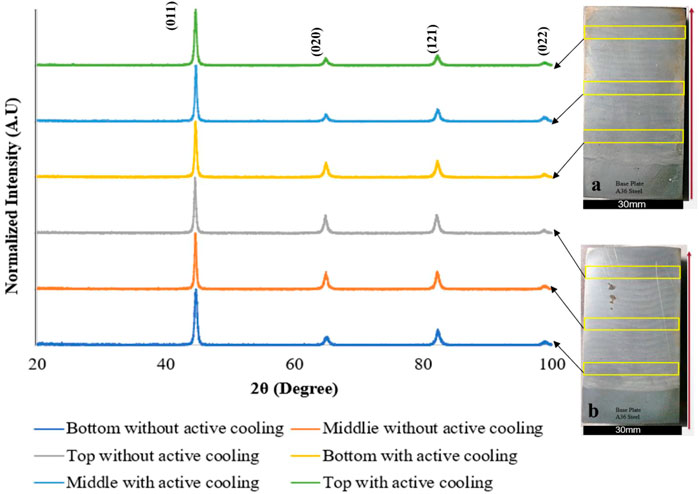
FIGURE 7. X-ray diffraction spectrums of the cylindrical samples at three regions of interest for fabrication—(A) with active cooling and (B) without active cooling.
3.3 Microstructural characterization
Figure 8A demonstrates the stereoscope image of the etched solid cylindrical sample fabricated by H-WAAM without using the active cooling setup. The weld layers can be seen distinctly, and the weld beads are fused completely. However, a visible defect can be noticed in the left upper area of the deposited sample. Factors leading to this defect are discussed in Section 3.1 and include uneven weld areas, contamination, insufficient shielding, and variation in arc length.
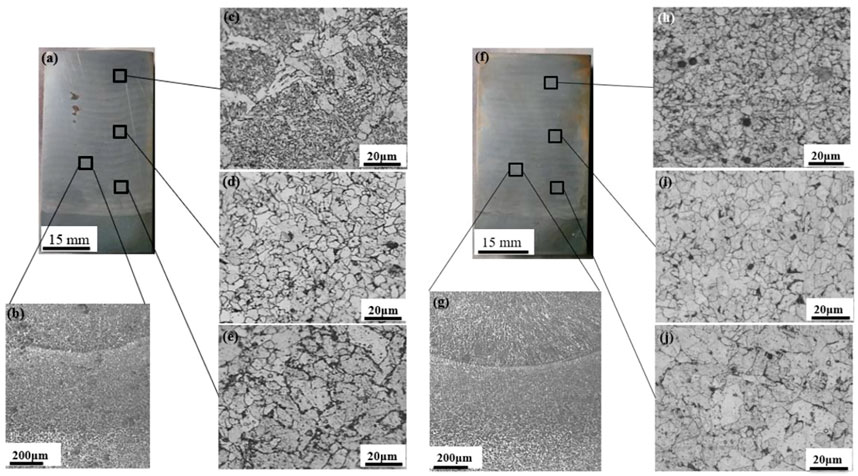
FIGURE 8. (A) Etched sample produced without cooling; (B) microstructure of cylinder without cooling; (C) acicular ferrite (αa) along with bainite regions adjacent to the melt-pool boundary; (D) Typical polygonal ferrite; (E) Low-volume fraction of the lamellar pearlite phase, which has primarily formed along the ferrite grain boundaries. (F) Etched sample produced with cooling, (G) Microstructure of ER70S-6 cylinder with cooling, (H) fine polygonal ferrite (F) and a low-volume fraction of the lamellar pearlite (P) along the newly deposited layer (Layer N) and HAZ, (I) medium polygonal ferrite (F) and a low-volume fraction of the lamellar pearlite (P) in the HAZ, (J) Coarse polygonal ferrite along the old, deposited layer (Layer N-1) and HAZ.
Figure 8B shows the microstructure of two consecutive weld beads without active cooling. The melt pool center, melt pool boundary and the heat-affected zone (HAZ) in the previously deposited layer are distinctly visible, Figure 8B. The high magnification image along the melt pool boundaries in Figure 8C confirmed the formation of acicular ferrite (αa) along with bainite (B). This microstructure transition is attributed to the overlapping of the weld beads and the solidification of the individual melt pools, resulting in distinct thermal profiles from the core to the periphery of its adjacent melt pools (Colegrove et al., 2013).
During the solidification process, the fusion zones experience a much higher cooling rate than the core region of the melt pool. Hence, non-equilibrium phases such as acicular ferrite (αa) and bainite (B) are formed adjacent to the fusion zones. Similar results were reported by Haselhuhn et al. (Haselhuhn et al., 2015) for the transition of polygonal ferrite (F) to acicular ferrite (αa) in a WAAM-ER70S-6 wall from the core to the boundary of the melt-pool due to faster cooling rates that the material experienced during solidification along the fusion zone. Figure 8D shows the formation of typical polygonal ferrite (F) structure at the core of the melt pool. Figure 8E depicts the formation of polygonal ferrite as the primary phase and a low volume fraction of the pearlite (P) along the ferrite grain boundaries. Similar microstructural characteristics for a WAAM-fabricated ER70S-6 wall were reported in an earlier work by Haden et al. (2017).
Figure 8F shows the stereoscope image of the etched sample with the active cooling setup. The weld layers can be seen distinctly, and the weld beads are fused properly. The macrostructure demonstrates that the weld is free from visible defects or imperfections. Figure 8G shows the microstructure of two consecutive weld beads. The melt pool center, melt pool boundary and the HAZ in the previously deposited layer are distinctly visible in Figure 8G. The high magnification image along the melt pool boundaries in Figure 8H shows the formation of typical fine polygonal ferrite as the primary phase and low volume of lamellar P and acicular ferrite along the fusion line. Figures 8I, J depict the formation of a typical F structure at the core of the melt pool. It has been observed that the size of the polygonal ferrite increases from the fusion line toward the center of the melt pool (Figures 8H–J). This can be attributed to the faster solidification rate along the fusion line than the core of the melt pool.
The sample fabricated by H-WAAM without active cooling has a banded microstructure comprised of polygonal ferrite and a mixture of acicular ferrite and bainite between two consecutive layers, Figure 8. Additionally, the cylindrical sample had an average dwell interval of 15 min between two successive layers of depositions along the Z-direction, which caused non-homogeneous energy input and, as a result, the development of the periodic microstructure, Figure 8B. Similar findings were reported for a WAAM-2Cr13 thin wall with a high dwelling period (210 s), which was characterized by a periodic microstructure made up of lathy martensite in a ferritic matrix (Ge et al., 2018). Sridharan et al. (2018) reported that the prime reason for the non-uniformity of microstructure along the build direction is the presence of various complex thermal cycles. However, the H-WAAM samples with active cooling have a more uniform microstructure comprised of polygonal ferrite and a low volume of lamellar pearlite between two consecutive layers, Figure 8. This homogeneity in microstructure can be attributed to the low average dwell time between two successive layers which were less than 4 min. Ge et al. (2018) analogously reported that using a short dwelling period (30 s) during manufacture will result in a homogenous ferritic microstructure.
The volume fraction of the pearlite phase developed along the ferrite grain boundaries is quantified using detailed image analysis of the microstructure taken from different locations of the samples. The inserted binary images in Figures 9A, B were used to quantify the pearlite phase present in the samples with and without active cooling.
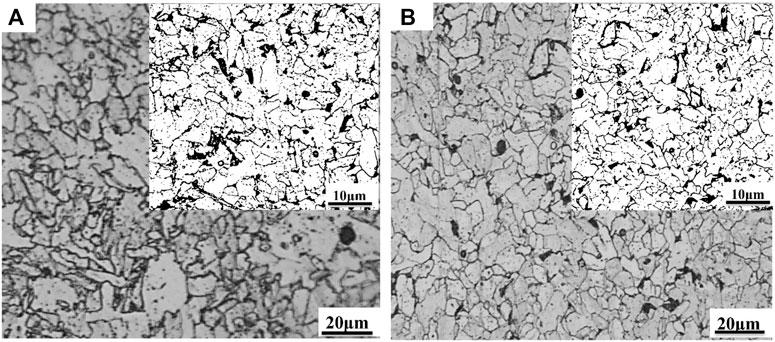
FIGURE 9. (A) Microstructural analysis shows the volume fraction of pearlite in print to be 12.2 ± 3% without active cooling (B) and 10.6 ± 2% with active cooling.
The pearlite phases are represented in black color in the inserted binary image shown in Figures 9A, B. The total volume fraction of the pearlite phase in the sample fabricated without active cooling is approximately 12.2% ± 3%, and the same for the sample with active cooling is 10.6% ± 2% of the total microstructure, both calculated using GIMP image processing software (Section 2.3). The low carbon content (0.15%) of the feedstock wire is the cause of such a low volume fraction of the pearlitic phase in both samples (Rafieazad et al., 2019).
3.4 Hardness
Vickers hardness profiles of H-WAAM samples without and with active cooling are shown in Figures 10A, B, respectively. The indents were taken along the build direction, i.e., from the first to the final deposited layer. The average microhardness of the sample fabricated without active cooling is 168 ± 8 HV0.2, and the same for the sample with active cooling is 172 ± 9 HV0.2. This hardness value in both samples showed a decreasing trend from the first layer to the final layer. The initial layers exhibit a rapid solidification rate, leading to the formation of finer grains. The finer grain size and the residual stress are the preliminary cause of this elevated hardness in the initially deposited layers (Afrouzian et al., 2022), (Li et al., 2018). Again, the effect of grain size on the mechanical properties is usually represented in the form of the Hall-Petch equation shown below:
Where
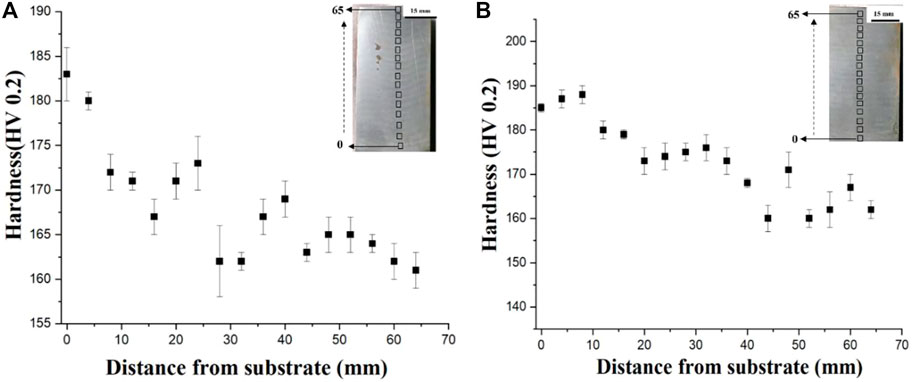
FIGURE 10. (A) Micro Vickers hardness of the sample without active cooling, (B) Micro Vickers hardness of the sample with active cooling.
4 Conclusion
In this research, cylindrical samples of mild steel were fabricated by MIG-based H-WAAM with and without active cooling. Process optimization, defect quantification, phase analysis, microstructural characterization, and microhardness measurements were performed.
• The use of active cooling helped reduce the volumetric/surface defects by 99%.
• The primary phase formed in both samples was α-iron.
• The samples without active cooling showed a more diverse microstructure, with distinct regions of polygonal ferrite grains formed in the core of the melt pools and a combination of acicular ferrite (αa) and bainite (B) adjacent to the fusion zones.
• Samples fabricated using active cooling demonstrated a homogenous microstructure containing primarily polygonal ferrite grains and a small volume fraction of pearlites along the grain boundaries.
• Both the samples showed a decreasing trend in hardness from the first layer to the final layer, but the microhardness of the samples fabricated using active cooling was higher than those fabricated without.
These results indicate that directional heat transfer during fabrication can influence the physical and mechanical properties of the final part. With deposition parameters held constant, property variation can be attributed to the experimental process cooling strategy tested. The positive impacts of active substrate cooling on increased deposition quality, reduced inter-pass cooling requirements, and minimized internal defects hold promising ramifications as H-WAAM is pursued by researchers and further adopted by industry. These advantages are highlighted in the potential to accelerate deposition time in parallel with a reduction in rework. The evidence presented in this research for establishing active cooling as a critical factor during H-WAAM applies directly to further study in WAAM materials and structural complexity.
Data availability statement
The raw data supporting the conclusion of this article will be made available by the authors, without undue reservation.
Author contributions
AB—Funding acquisition, Conceptualization, Manuscript revising, and editing SB—Funding acquisition, Manuscript revising, and editing AD—Data collection and analysis, Manuscript first draft development LS—Data collection, Manuscript revising, and editing JA—Data collection, Manuscript revising, and editing.
Funding
The authors would like to acknowledge financial support from the National Science Foundation under the grant CMMI 1934230 (PI—AB). The authors would also like to acknowledge partial financial support from the Army Research Laboratory under grant number W911NF2020206. The views and conclusions contained in this document are those of the authors and should not be interpreted as representing the official policies, either expressed or implied, of the Army Research Laboratory or the US Government. The US Government is authorized to reproduce and distribute reprints for Government purposes, notwithstanding any copyright notation herein.
Conflict of interest
The authors declare that the research was conducted in the absence of any commercial or financial relationships that could be construed as a potential conflict of interest.
Publisher’s note
All claims expressed in this article are solely those of the authors and do not necessarily represent those of their affiliated organizations, or those of the publisher, the editors and the reviewers. Any product that may be evaluated in this article, or claim that may be made by its manufacturer, is not guaranteed or endorsed by the publisher.
References
Afrouzian, A., Groden, C. J., Field, D. P., Bose, S., and Bandyopadhyay, A. (2022). Additive manufacturing of Ti-Ni bimetallic structures. Mater. Des. 215, 110461. doi:10.1016/J.MATDES.2022.110461
American Welding Society (2005). “Committee on filler metals and allied materials., American welding society., American welding society. Technical activities committee., and American national standards institute,” in Specification for low-alloy steel electrodes and rods for gas shielded arc welding (American Welding Society), 38.
Bandyopadhyay, A., and Heer, B. (2018). Additive manufacturing of multi-material structures. Mater. Sci. Eng. R. Rep. 129, 1–16. doi:10.1016/J.MSER.2018.04.001
Bandyopadhyay, A., Traxel, K. D., Lang, M., Juhasz, M., Eliaz, N., and Bose, S. (2022). Alloy design via additive manufacturing: Advantages, challenges, applications and perspectives. Mater. Today 52, 207–224. doi:10.1016/j.mattod.2021.11.026
Bandyopadhyay, A., Zhang, Y., and Onuike, B. (2022). Additive manufacturing of bimetallic structures. Virtual Phys. Prototyp. 17 (2), 256–294. doi:10.1080/17452759.2022.2040738
Bazarnik, P., Huang, Y., Lewandowska, M., and Langdon, T. G. (2015). Structural impact on the Hall–Petch relationship in an Al–5Mg alloy processed by high-pressure torsion. Mater. Sci. Eng. A 626, 9–15. doi:10.1016/J.MSEA.2014.12.027
Caccese, V., Blomquist, P. A., Berube, K. A., Webber, S. R., and Orozco, N. J. (2006). Effect of weld geometric profile on fatigue life of cruciform welds made by laser/GMAW processes. Mar. Struct. 19 (1), 1–22. doi:10.1016/J.MARSTRUC.2006.07.002
Cao, X., Wanjara, P., Huang, J., Munro, C., and Nolting, A. (2011). Hybrid fiber laser – arc welding of thick section high strength low alloy steel. Mater. Des. 32 (6), 3399–3413. doi:10.1016/J.MATDES.2011.02.002
Chen, X., Li, J., Cheng, X., He, B., Wang, H., and Huang, Z. (2017). Microstructure and mechanical properties of the austenitic stainless steel 316L fabricated by gas metal arc additive manufacturing. Mater. Sci. Eng. A 703, 567–577. doi:10.1016/J.MSEA.2017.05.024
Colegrove, P. A., Coules, H. E., Fairman, J., Martina, F., Kashoob, T., Mamash, H., et al. (2013). Microstructure and residual stress improvement in wire and arc additively manufactured parts through high-pressure rolling. J. Mater. Process. Technol. 213 (10), 1782–1791. doi:10.1016/J.JMATPROTEC.2013.04.012
DAMEN (2017). World's first class approved 3D printed ship's propeller unveiled. [Online]. Available: https://archive.damen.com/en/news/2017/11/worlds_first_class_approved_3d_printed_ships_propeller_unveiled.
Derekar, K. S. (2018). A review of wire arc additive manufacturing and advances in wire arc additive manufacturing of aluminium. Mater. Sci. Technol. U. K. 34 (8), 895–916. doi:10.1080/02670836.2018.1455012
Farshidianfar, M. H., Khajepour, A., and Gerlich, A. (2015). Real-time control of microstructure in laser additive manufacturing. Int. J. Adv. Manuf. Technol. 82582 (5), 1173–1186. doi:10.1007/S00170-015-7423-5
Ge, J., Lin, J., Fu, H., Lei, Y., and Xiao, R. (2018). Tailoring microstructural features of wire arc additive manufacturing 2Cr13 part via varying inter-layer dwelling time. Mater. Lett. 232, 11–13. doi:10.1016/J.MATLET.2018.08.037
Gook, S., Gumenyuk, A., and Rethmeier, M. (2014). Hybrid laser arc welding of X80 and X120 steel grade. 19, 15–24. doi:10.1179/1362171813Y.0000000154
Guide for the Visual Examination of Welds (2015). Guide for the visual examination of welds, pub. L. No. AWS B1.11M/B1.11:2015. American National Standards Institute.
Haden, C. V., Zeng, G., Carter, F. M., Ruhl, C., Krick, B. A., and Harlow, D. G. (2017). Wire and arc additive manufactured steel: Tensile and wear properties. Addit. Manuf. 16, 115–123. doi:10.1016/J.ADDMA.2017.05.010
Haselhuhn, A. S., Wijnen, B., Anzalone, G. C., Sanders, P. G., and Pearce, J. M. (2015). In situ formation of substrate release mechanisms for gas metal arc weld metal 3-D printing. J. Mater. Process. Technol. 226, 50–59. doi:10.1016/J.JMATPROTEC.2015.06.038
Kozamernik, N., Bračun, D., and Klobčar, D. (2020). WAAM system with interpass temperature control and forced cooling for near-net-shape printing of small metal components. Int. J. Adv. Manuf. Technol. 110 (7–8), 1955–1968. doi:10.1007/s00170-020-05958-8
Li, C. L., Mei, Q. S., Li, J. Y., Chen, F., Ma, Y., and Mei, X. M. (2018). Hall-Petch relations and strengthening of Al-ZnO composites in view of grain size relative to interparticle spacing. Scripta Materialia 153, 27–30. doi:10.1016/J.SCRIPTAMAT.2018.04.042
Li, X., Ma, X., Subramanian, S. V., Shang, C., and Misra, R. D. K. (2014). Influence of prior austenite grain size on martensite–austenite constituent and toughness in the heat affected zone of 700 MPa high strength linepipe steel. Mater. Sci. Eng. A 616, 141–147. doi:10.1016/J.MSEA.2014.07.100
Liberini, M., Astarita, A., Campatelli, G., Scippa, A., Montevecchi, F., Venturini, G., et al. (2017). Selection of optimal process parameters for Wire Arc additive manufacturing. Procedia CIRP 62, 470–474. doi:10.1016/J.PROCIR.2016.06.124
Nagasai, B. P., Malarvizhi, S., and Balasubramanian, V. (2021). Effect of welding processes on mechanical and metallurgical characteristics of carbon steel cylindrical components made by wire arc additive manufacturing (WAAM) technique. CIRP J. Manuf. Sci. Technol. 36, 100–116. doi:10.1016/J.CIRPJ.2021.11.005
Ou, W., Mukherjee, T., Knapp, G. L., Wei, Y., and DebRoy, T. (2018). Fusion zone geometries, cooling rates and solidification parameters during wire arc additive manufacturing. Int. J. Heat. Mass Transf. 127, 1084–1094. doi:10.1016/J.IJHEATMASSTRANSFER.2018.08.111
Pattanayak, S., and Sahoo, S. K. (2021). Gas metal arc welding based additive manufacturing—A review. CIRP J. Manuf. Sci. Technol. 33, 398–442. doi:10.1016/J.CIRPJ.2021.04.010
Prado-Cerqueira, J. L., Camacho, A., Dieguez, J., Rodriguez-Prieto, A., Aragon, A., Lorenzo-Martin, C., et al. (2018). Analysis of favorable process conditions for the manufacturing of thin-wall pieces of mild steel obtained by wire and arc additive manufacturing (WAAM). Materials 11, 1449. doi:10.3390/MA11081449
Rafieazad, M., Ghaffari, M., Vahedi Nemani, A., and Nasiri, A. (2019). Microstructural evolution and mechanical properties of a low-carbon low-alloy steel produced by wire arc additive manufacturing. Int. J. Adv. Manuf. Technol. 105 (5–6), 2121–2134. doi:10.1007/s00170-019-04393-8
RAMLAB and Autodesk Reveal (2022). RAMLAB and Autodesk reveal 3D printed propeller created through hybrid manufacturing process - 3DPrint.com | the voice of 3D printing/additive manufacturing. Available at: https://3dprint.com/172387/ramlab-autodesk-propeller/ (Accessed Dec 18, 2022).
Rouf, S., Malik, A., Singh, N., Raina, A., Naveed, N., Siddiqui, M. I. H., et al. (2022). Additive manufacturing technologies: Industrial and medical applications. Sustain. Operations Comput. 3, 258–274. doi:10.1016/j.susoc.2022.05.001
Singh, R., Hussain, S. A. I., Dash, A., and Rai, R. N. (2020). Modelling and optimizing performance parameters in the wire-electro discharge machining of Al5083/B4C composite by multi-objective response surface methodology. J. Braz. Soc. Mech. Sci. Eng. 42642 (6), 344–376. doi:10.1007/S40430-020-02418-Y
Sridharan, N., Noakes, M. W., Nycz, A., Love, L. J., Dehoff, R. R., and Babu, S. S. (2018). On the toughness scatter in low alloy C-Mn steel samples fabricated using wire arc additive manufacturing. Mater. Sci. Eng. A 713, 18–27. doi:10.1016/J.MSEA.2017.11.101
Sterjovski, Z., Bayley, C., Donato, J., Lane, N., and Lang, D. (2014). Weld-end solidification cracking in pulsed-tandem gas metal arc welding of naval steels. Weld. J. 93 (5), 145S–152S.
Svetlizky, D., Das, M., Zheng, B., Vyatskikh, A. L., Bose, S., Bandyopadhyay, A., et al. (2021). Directed energy deposition (DED) additive manufacturing: Physical characteristics, defects, challenges and applications. Mater. Today 49, 271–295. doi:10.1016/j.mattod.2021.03.020
Wang, T., Zhang, Y., Wu, Z., and Shi, C. (2018). Microstructure and properties of die steel fabricated by WAAM using H13 wire. Vacuum 149, 185–189. doi:10.1016/J.VACUUM.2017.12.034
Wang, Z., Palmer, T. A., and Beese, A. M. (2016). Effect of processing parameters on microstructure and tensile properties of austenitic stainless steel 304L made by directed energy deposition additive manufacturing. Acta Mater 110, 226–235. doi:10.1016/J.ACTAMAT.2016.03.019
Waqas, A., Qin, X., Xiong, J., Zheng, C., and Wang, H. (2019). Analysis of ductile fracture obtained by charpy impact test of a steel structure created by robot-assisted GMAW-based additive manufacturing. Metals 9 (11), 1208. doi:10.3390/met9111208
Warsi, R., Kazmi, K. H., and Chandra, M. (2022). Mechanical properties of wire and arc additive manufactured component deposited by a CNC controlled GMAW. Mater. Today Proc. 56, 28182022–28182825. doi:10.1016/J.MATPR.2021.10.114
Wilson-Heid, A. E., Wang, Z., McCornac, B., and Beese, A. M. (2017). Quantitative relationship between anisotropic strain to failure and grain morphology in additively manufactured Ti-6Al-4V. Mater. Sci. Eng. A 706, 287–294. doi:10.1016/J.MSEA.2017.09.017
Wu, B., Pan, Z., Ding, D., Cuiuri, D., Li, H., Xu, J., et al. (2018). A review of the wire arc additive manufacturing of metals: Properties, defects and quality improvement. J. Manuf. Process. 35, 127–139. doi:10.1016/j.jmapro.2018.08.001
Xiong, J., Li, Y., Li, R., and Yin, Z. (2018). Influences of process parameters on surface roughness of multi-layer single-pass thin-walled parts in GMAW-based additive manufacturing. J. Mater. Process. Technol. 252, 128–136. doi:10.1016/J.JMATPROTEC.2017.09.020
Yang, D., He, C., and Zhang, G. (2016). Forming characteristics of thin-wall steel parts by double electrode GMAW based additive manufacturing. J. Mater. Process. Technol. 227, 153–160. doi:10.1016/J.JMATPROTEC.2015.08.021
Yang, D., Wang, G., and Zhang, G. (2017). Thermal analysis for single-pass multi-layer GMAW based additive manufacturing using infrared thermography. J. Mater. Process. Technol. 244, 215–224. doi:10.1016/J.JMATPROTEC.2017.01.024
Keywords: additive manufacturing (3D printing), wire arc additive manufacturing (WAAM), directed energy deposition (DED), metal inert gas (MIG), mild steel
Citation: Dash A, Squires L, Avila JD, Bose S and Bandyopadhyay A (2023) Influence of active cooling on microstructure and mechanical properties of wire arc additively manufactured mild steel. Front. Mech. Eng 9:1130407. doi: 10.3389/fmech.2023.1130407
Received: 23 December 2022; Accepted: 17 January 2023;
Published: 01 February 2023.
Edited by:
Ying Han, Changchun University of Technology, ChinaReviewed by:
Shucai Zhang, Northeastern University, ChinaMd Irfanul Haque Siddiqui, King Saud University, Saudi Arabia
Jiapeng Sun, Hohai University, China
Copyright © 2023 Dash, Squires, Avila, Bose and Bandyopadhyay. This is an open-access article distributed under the terms of the Creative Commons Attribution License (CC BY). The use, distribution or reproduction in other forums is permitted, provided the original author(s) and the copyright owner(s) are credited and that the original publication in this journal is cited, in accordance with accepted academic practice. No use, distribution or reproduction is permitted which does not comply with these terms.
*Correspondence: Amit Bandyopadhyay, YW1pdGJhbmRAd3N1LmVkdQ==