 Lars La Heij
 Savvas Gkantonas
 Epaminondas Mastorakos
- Hopkinson Lab, Department of Engineering, University of Cambridge, Cambridge, United Kingdom
There is evidence to suggest that airborne droplets play an important role in the transmission of respiratory diseases. The highest risk of exposure to these pathogens is in indoor environments, where airflow control has been recognized as one of the most effective engineering means to combat its spread. However, this can contribute to a significant increase in energy costs, as conventional ventilation is often not designed to remove contaminants efficiently. In this study, Computational Fluid Dynamics simulations were used to analyze how a novel ventilation approach, called Personalized Displacement Ventilation (PerDiVent), can simultaneously reduce both pathogenic airborne transmission and reduce energy costs in an open office. In addition, thermal comfort and noise were investigated to assess the practicality of the concept. PerDiVent was found to reduce the risk of cross infection by a factor of 1.08–2.0 compared to mixing ventilation in the worst and best case scenarios analyzed, and lead to savings in mechanical power of at least 30%. Furthermore, there is great potential to further improve the system and to increase the stated numbers substantially with relatively simple alterations to the design. Tools that can be used to great advantage for such optimization are also proposed in this work. These include a simple integral model and analytical metrics to estimate the reduction in cross-infection risk and energy savings as a function of PerDiVent’s effectiveness in removing contaminants. Finally, the system has a modular and highly flexible arrangement, which makes it suitable for retrofitting purposes in various indoor environments and integration with current ventilation systems. The concept shows great promise for the future, where ventilation is required to create healthier and more sustainable environments.
1 Introduction
Recent developments have emphasized the importance of increasing air quality in indoor environments and highlighted the role engineering solutions play in this. In particular, effective protection against highly pathogenic respiratory viruses can prevent the partial or complete shutdown of many economic drivers and alleviate the burden on national healthcare systems. This challenge has led to a wide range of research on disease transmission control.
Epidemic viruses have been notoriously difficult to study due to their complex, transient, and essentially stochastic nature (Bourouiba, 2021). The transmission of respiratory pathogens through exhalations, including breathing out, talking, laughing, coughing, sneezing, and singing, is still poorly understood. The general consensus is that the emission consists of a gas phase laden with droplets of various sizes (Duguid, 1945; Bourouiba et al., 2014; Hamner et al., 2020; Bourouiba, 2021). Wells observed that droplets of diameter d > 100 μm settle in liquid form on the ground in less than a second, while droplets below this size typically evaporate and become suspended in air (Wells, 1934). This suggests that larger droplets settle within the vicinity of the exhalation, with their exact location depending on the initial momentum, while smaller droplets become prone to airborne transmission.
Although there is some debate on the exact transmission routes among the various pathogens (Liu L. et al., 2016; Godri Pollitt et al., 2020; Leung et al., 2020), there is strong evidence to suggest that airborne disease transmission through aerosols (fine droplets with diameter smaller than a characteristic cutoff, that is, d < dcf, where dcf is typically in the range of 5–100 μm) can be significant, as aerosols can narrowly follow air currents and travel for tens of minutes before settling (Burridge et al., 2021; de Oliveira et al., 2021). This long-range transmission route can sometimes be dominant, as opposed to short-range transmission through spray droplets (diameter d > dcf) that settle faster and through direct contact (Asadi et al., 2020; Morawska and Cao, 2020; Vuorinen et al., 2020; Burridge et al., 2021; Trivedi et al., 2021).
The highest risk of exposure to airborne transmission is in indoor environments (Bourouiba, 2021). Controlling air flow through ventilation has been recognized as one of the most effective engineering means to reduce viral dispersion (Nielsen, 2009; Morawska and Cao, 2020; Morawska et al., 2020; Morawska and Milton, 2020), but this usually leads to high energy costs. Many ventilation systems are designed primarily to supply fresh air, but not to remove contaminants efficiently. de Oliveira et al. (2021), for example, emphasized how quickly homogeneous mixing of air and thus viral particles occur in a room where conventional ventilation strategies are applied (timescale of the order of 1–50 s). Both gravitational settling and viral inactivation rates were found to be insufficient to significantly reduce the concentration of virus-laden aerosol particles with diameters below 5 μm. Effectively, all the air inside the indoor environment must be removed to achieve this. They estimated in their work that the ventilation rate had to be on the order of 100 air changes per hour (ACH) to keep the infection risk, due to an infected individual speaking continuously for 1 h, well below 0.5%. This setting is an order of magnitude stronger than even those found in hospitals (de Oliveira et al., 2021). Focusing only on infection control could significantly increase energy consumption in buildings. Therefore, it is imperative to re-evaluate today’s ventilation strategies to effectively integrate infection control into the development of more energy-efficient buildings.
The most common modes of ventilation are mixing ventilation (MV) and displacement ventilation (DV). Both of these ventilation strategies focus on large-scale ventilation, mixing air within the entire room. A less common form, called personalized ventilation (PV), has shown more promise in preventing disease transmission (Melikov, 2004; Bolashikov and Melikov, 2009; Pantelic et al., 2009; Xu and Liu, 2018). This type of ventilation is concentrated on the smaller scales (micro-scale) and provides more isolation from the air within the room.
The principle of MV is to dilute contaminants in a room by supplying fresh air (Cao et al., 2014). Fresh air is typically diffused from the ceiling or high up from the walls, with velocities above 1.5 m/s. The combination of supplied airflow and internal heat sources leads to efficient mixing. Temperature and contaminant concentrations are usually very uniform (Cao et al., 2014).
DV works by displacing contaminants out of a room with cool and fresh air (Cao et al., 2014). Inlets are located in the lower parts of the room, diffusing air typically at velocities below 0.5 m/s and temperatures around 18°C. An upward air movement is created through thermal plumes, due to the internal heat sources. This type of ventilation creates vertical gradients in air velocity, temperature, and contaminant concentration, resulting in lower mixing efficiencies compared to MV.
PV works by supplying fresh air directly to the breathing zone of an occupant. Devices are usually installed around the workstation and supply air with a certain minimum velocity to penetrate through the thermal plume driven by the body (Melikov, 2004). In practice, up to 80% of inhaled air is shown to originate from PV using supply rates of less than 3.0 l/s (Cao et al., 2014). However, while PV has been shown to reduce the risk of infection when the occupants are at their workstation (Melikov, 2004; Bolashikov and Melikov, 2009; Pantelic et al., 2009; Xu and Liu, 2018; Gkantonas et al., 2020), protection is not guaranteed when the occupants are away. In this case, it may even facilitate disease transmission (Bolashikov and Melikov, 2009).
There are two other forms of airflow control that are closely related to PV: These are air curtains and local exhaust ventilation. Air curtains differ from traditional PV in the sense that their function is not to deliver fresh air directly to an occupant, but to provide a protective screen that prevents the penetration of heat, moisture, or contaminants through its passage. The curtain usually consists of one or multiple jets blowing air horizontally or vertically across an opening, reducing free-air movement and thus the transport of heat and mass through the opening. Air curtains are typically used for doorways, where they have been shown to lead to higher energy savings and improved thermal comfort (Sirén, 2003a; Sirén, 2003b).
Local exhaust ventilation is based on the principle of capturing the contaminant at the source, with a capture device or extract hood, before it spreads to the room (Awbi, 2003). It greatly increases ventilation effectiveness and reduces the need to supply fresh air to dilute the contaminant. Local exhaust ventilation is widely used in industrial settings, chemical laboratories and kitchens, but rarely in commercial or public buildings (Cao et al., 2014).
In previous work, a promising and novel type of ventilation system was investigated, called Personalized Displacement Ventilation (PerDiVent) (Gkantonas et al., 2020). The principle behind this concept is to combine the techniques of air curtains and local exhaust strategies using suction in the vicinity of the occupants (Awbi, 2003). Through unsteady-RANS Computational Fluid Dynamics applied to a meeting room with three closely seated occupants, it was estimated that PerDiVent can reduce the cross-infection risk by up to five times compared to DV. The modular and highly flexible arrangement of PerDiVent makes it very suitable for retrofitting in various indoor environments as well (La Heij, 2021; Yu, 2021). The energy saving potential of PerDiVent was not investigated in these works, nor any preliminary analyses on thermal comfort or noise to assess the practicality of the concept. These are also important aspects, which PV is often meant to improve.
To date, there has been little research on novel ventilation concepts that combine high energy efficiency with infection control. Most studies have focused on improving the operating conditions of existing systems according to the regulations recommended by the World Health Organization (Lipinski et al., 2020; Schibuola and Tambani, 2021). This knowledge gap created several questions the current work wished to answer. First, PerDiVent showed great promise in reducing cross-infection risk as a novel ventilation concept. The main objective became to build further upon that work. The focus was put on analyzing the risk of infection due to exhalations through the mouth using steady-RANS computational fluid dynamics. The quantitative estimations were based on models for Sars-Cov-2, but can be generalized to other viruses as well. Secondly, it was studied how the system can be optimized for both high energy efficiency and minimal infection risk.
Computational fluid dynamics (CFD) and experiments are used regularly to study the transmission of airborne diseases and specific ventilation approaches. As discussed by Ai and Melikov (2018), most studies use a tracer gas to simulate expiratory flows, which is equivalent to considering only fine aerosol droplets with d < dcf that follow the airflow and are relevant to long-range transmission routes. In the context of CFD, Lagrangian particle tracking techniques could be applied to also consider larger droplets through ensembles of independent evaporating pathogen-carrying particles, e.g., see (Yan et al., 2017; Trivedi et al., 2021), but they can be computationally expensive when considering larger-scale ventilation problems with long residence times. A more suitable alternative is the use of passive scalar models, where pathogen-carrying aerosols are treated as a concentration that is directly transported with air and the passive scalar (Hathway et al., 2011; Gkantonas et al., 2020; Mittal et al., 2020; Cheong et al., 2021; La Heij, 2021; Mathai et al., 2021; Yu, 2021). For these reasons, the passive scalar model was applied in this study to analyze the effect of PerDiVent on airborne disease transmission, and effects of viral load in the sputum, ambient conditions, flow conditions, droplet composition, person activity, and exhaled droplet particle size distribution are incorporated into the approach following previous work (Gkantonas et al., 2021).
Simpler computational approaches can also be used to great advantage to dissect the fluid dynamics of exhalation. Such findings can significantly speed up engineering design processes and allow for generalizations to other scenarios. Attempts have been made in the past to simplify and describe (qualitatively and quantitatively) the behavior of turbulent buoyant jets, as well as its interaction in cross-, counter-, co- and impinged flow (Jirka, 2004; Xiao et al., 2009; Liu et al., 2016b; de Oliveira et al., 2021; Lau et al., 2022). Integral models have received the most attention in this work because of their relatively low complexity, yet sufficient detail in replicating the mean properties of turbulent flows. These integral models reduce continuity and the Navier-Stokes equations to ordinary differential equations and combine it with empirical approximations and/or constants derived from experiments. In this work, an integral model from Jirka (2004) was used and modified to handle the interactions between the macroscale flow and the PerDiVent components. This model was created to predict the exhalation trajectory under various conditions.
The paper is organized as follows: First, the PerDiVent concept and its characteristics are further explained in Section 2. Secondly, Section 3 discusses the methodology used to analyze PerDiVent and its effects on airborne disease transmission. Both the methodology and results are divided into two parts. The first part includes the CFD modeling in Section 3.1.1, the quantification of infection risk in Section 3.1.3, and the details of the integral model in Section 3.1.4. The second part includes the assessment of energy costs, thermal comfort and noise in Sections 3.2.1 and 3.2.2 respectively. The results, presented and discussed in Section 4, are ordered in the same manner. Finally, concluding remarks are given in Section 5.
2 The perdivent paradigm
The primary principle behind PerDiVent is to reduce cross-infection by isolating the respiratory emission of an infected individual and removing it from the room before pollutants can be transported to other occupants or mixed with the surrounding air. In addition, the system tries to protect the occupants by separating the flow locally (microscale) from the larger background ventilation (macroscale) in order to prevent the penetration of viral particles into the breathing zone. The design applied to an open office is shown in Figure 1. On both sides of the desk, a planar jet is positioned. These jets are oriented at such an angle that the flow discharged aligns with the edges of the suction hood (local exhaust), placed right above the desk. The planar jets hereafter referred to as PerDiVent jets, have a dual functionality: They act as an air curtain (containing fresh air), isolating the occupants from each other, and blocking the transport of pollutants in the lateral direction. Their second function is to entrain the respiratory emission of the occupant and other possible contaminated air present in the room. The entrained flow is then advected toward the suction hood, which captures and removes the “contaminated” air from the room. The system combines the techniques of air-curtain separation (Li et al., 2012) and local exhaust approaches (Awbi, 2003). Figure 1B further depicts an overview of the competing mechanisms considered in this work, which drive the airflow and transport of pollutants. This figure is adapted from Gkantonas et al. (2020).
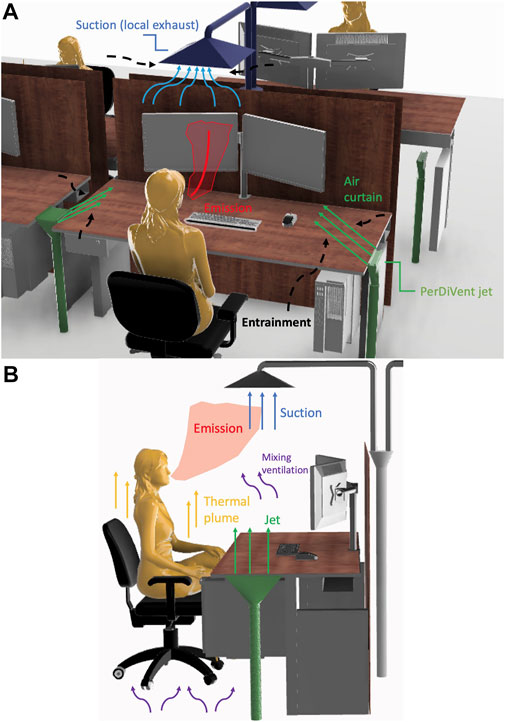
FIGURE 1. (A) The PerDiVent system as applied to an office desk. The emission of an infected occupant is intercepted by an air curtain, discharged by planar jets, and removed via a local suction. The entrainment created by the suction and curtain transports the flow close to the occupant away, protecting the occupant from contaminated air while also providing fresh air. (B) Competing mechanisms, studied in this work, for the transport and removal of the respiratory emission using PerDiVent.
3 Materials and methods
3.1 Infection risk assessment
Computational fluid dynamics (CFD) simulations were performed for an open office subjected only to MV and for an open office subjected to both MV and PerDiVent. The risk of cross-infection over time was estimated and compared for both scenarios. A three-dimensional open-office CAD model is shown in Figure 2, with relevant dimensions indicated. The shape of the furniture and the occupants is based on 3D models available in the Grabcad online library1. The domain contains six occupants symmetrically placed in the middle of a room with dimensions 14 × 10 × 3 m. The room also contains two two-way diffusers and an exhaust on the ceiling. The two diffusers are placed in between the occupants (in the z-direction) and just beside the desks (in the x-direction) to avoid a negative effect on thermal comfort. The exhaust of the room is placed exactly in the center of the room. The geometric dimensions and discharge flow directions of the various PerDiVent components are denoted in Table 1. The dimensions of the diffusers were determined on the basis of typical velocity requirements for MV, associated with the ventilation rates imposed in the simulations. The suction hood is relatively large to ensure a high capture rate of viral particles. A further discussion of its size and position is provided in Sections 4.1.2 and 4.3. The size of the suction inlet is based on local regulations on exhaust ventilation, which require a minimum velocity of 5 m/s (Health and Executive, 2008). Lastly, the dimensions of the PerDiVent jets were set to produce a discharge velocity, which is able to penetrate the thermal plume originating from the convective heat losses around the human body, while also ensuring thermal comfort and low noise for ventilation rates around 3 l/s.
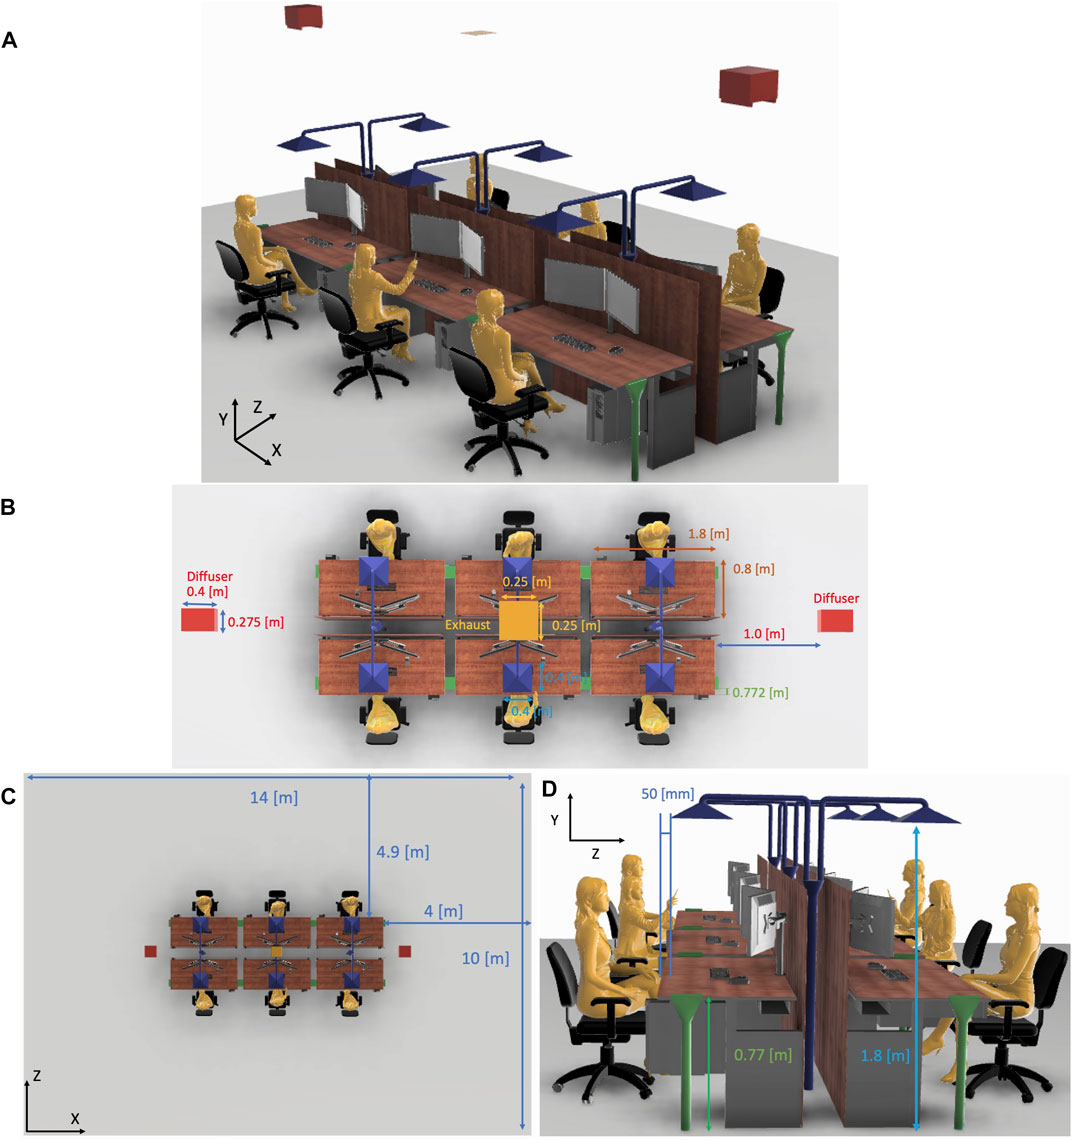
FIGURE 2. (A) Isometric view of the studied open office. (B) Zoomed in top-view of the open office. Locations of the underlying room ventilation diffusers and exhaust are indicated. (C) Complete top-view of the open office. (D) Side-view of the open office.
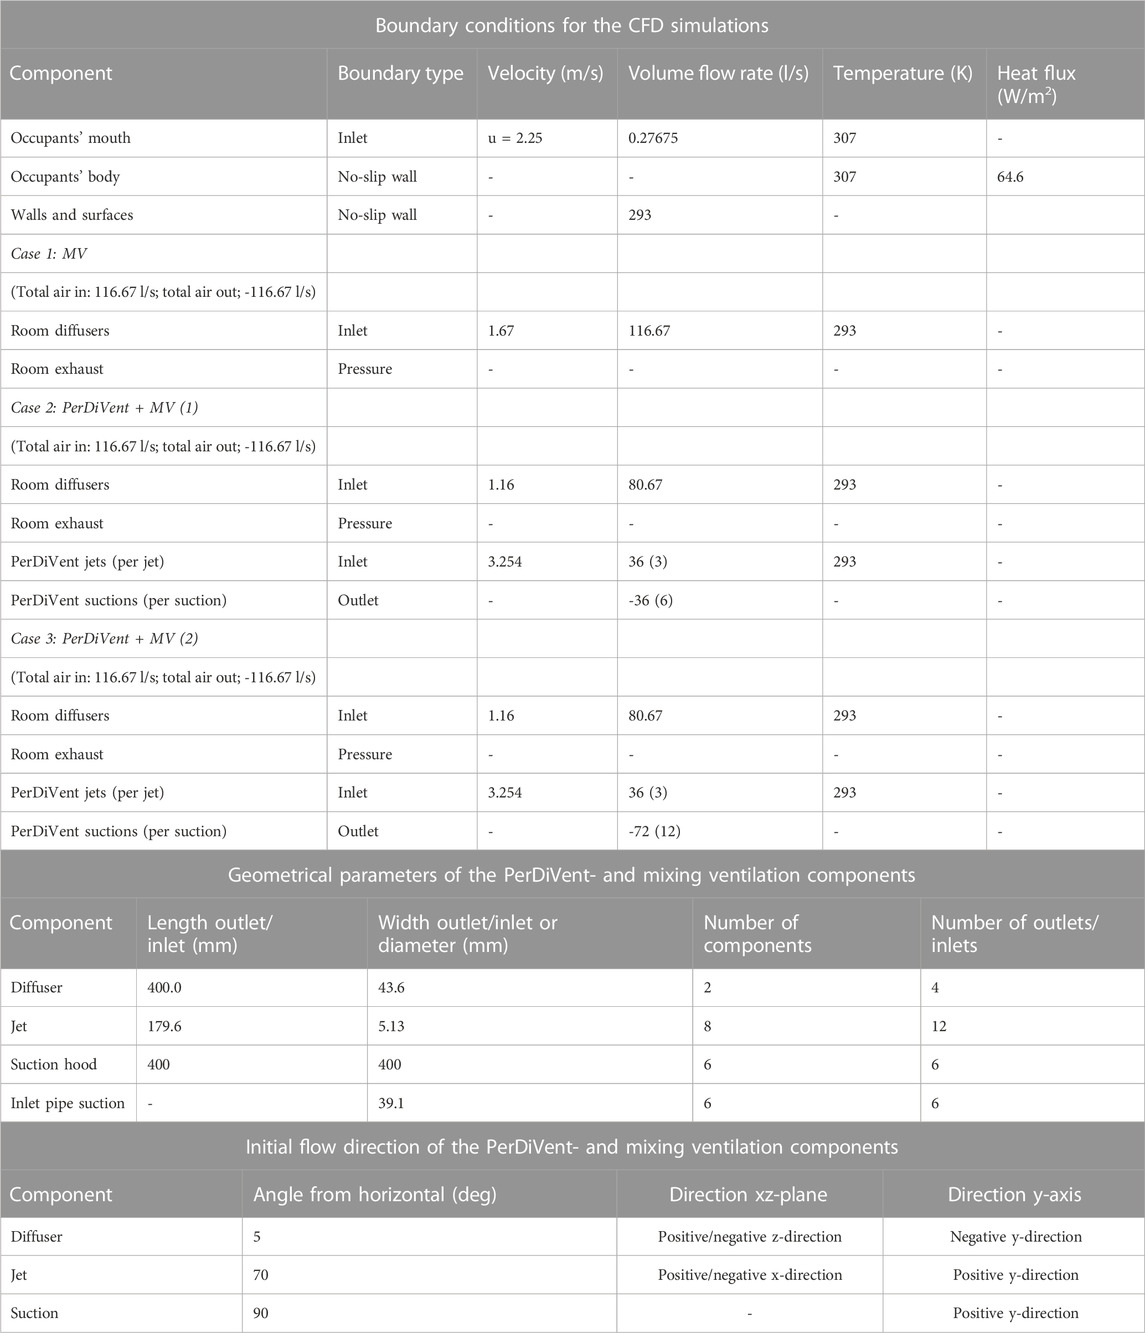
TABLE 1. Simulation parameters in the open office.
3.1.1 Equations and modeling
Three-dimensional, steady, and non-isothermal calculations were used to simulate airflow in the domain of Figure 2. These simulations were performed with the help of the commercial finite-volume CONVERGE code (Richards et al., 2022). This software has previously been used for ventilation applications (Gkantonas et al., 2020; Narayanan and Yang, 2021; Yu, 2021). The Favre-averaged equations for continuity, momentum, energy and turbulence were computed using the compressible, steady Reynolds-Averaged Navier-Stokes formulation. Turbulence was modeled using the RNG k-ɛ model, which is widely employed in ventilation applications due to its relatively good performance in replicating indoor airflows (Villafruela et al., 2013; Yan et al., 2017; Villafruela et al., 2019; Narayanan and Yang, 2021).
The equations were discretized using finite volumes and resolved on an orthogonal, Cartesian, structured grid using polyhedra, which respect the boundaries (represented with triangulated surfaces). Pressure-velocity coupling was achieved using the modified Pressure Implicit with Splitting of Operator (PISO) method (Richards et al., 2022). Additionally, an adaptive mesh refinement (AMR) algorithm was used in the simulations to optimize for low computational cost combined with high accuracy. The algorithm can refine the mesh with a certain embedding where the sub-grid scale criterion is exceeded. For example, if the embedding level is three, the cell size can be reduced by a factor of 23. The sub-grid field is defined as the difference between the actual field and the resolved field or
ϕ′ is approximated by the second-order term of an infinite series derived by Bedford and Yeo, and Pomraning (Richards et al., 2022). The goal of the adaptive mesh refinement was to create a very fine mesh in the important regions of the domain, where gradients of the temperature, velocity, and passive field are relatively steep, and to keep unimportant regions, where the fields are relatively uniform, coarse. The base grid was set to 0.15 m, while a maximum embedding level of 3, 4, and three were used when, respectively, the subgrid-scale criteria of 0.01 m/s, 0.15 K, and 3.5 ⋅ 10–6 were exceeded for the velocity, temperature, and passive scalar field. This resulted in about 50,000,000 cells in the whole domain.
The spatial discretization of the convective terms was resolved with a Total Variation Diminishing scheme for the momentum, energy, passive and turbulence equations using the Superbee flux (Richards et al., 2022) limiter. Lastly, standard thermodynamic- and transport properties were used for air. Both the molecular and turbulent Schmidt (Sc and Sct) numbers were set to 0.78.
3.1.2 Boundary conditions
A summary of the boundary conditions used in the simulations is shown in Table 1. The ventilation rate of 116.67 l/s can be translated to an ACH = 1.0 h−1 (ACH stands for the “air changes per hour” in the room). The mouth of each occupant is modeled as an ellipsoid with an area of approximately 1.23 cm2, according to previous work (Gupta et al., 2010). Transient (sinusoidal) models have been derived for the respiratory emission of a person (Villafruela et al., 2013), which are in close agreement with experimental data (Gupta et al., 2010). The emission has a temperature of 307 K and an exhalation peak velocity of 4.5 m/s, after about every 3.5 s. Here, an average value of approximately 2.25 m/s was used, which was assumed to emulate the average momentum during exhalation. Exhalations through the nose and inhalations were neglected in the simulations. Thermal plumes, driven by the convective heat loss around a person, were taken into account. Villafruela et al. estimated that the average heat flux of a person is 64.6 W/m2 (Villafruela et al., 2013). This heat flux was assumed to be uniform throughout the body surface area, resulting in a total power of 81 W for the two occupants sitting at the center desks and a power of 91 W for the other occupants. Lastly, mass flow boundary conditions were imposed on the local suctions instead of pressure conditions, as this allowed for better control over the airflow in the room.
Regarding the surfaces in the domain, an enhanced wall treatment method was applied near the walls with a law of the wall model on the boundaries. The enhanced wall treatment is a two-layer approach that blends a modified law of the wall for the logarithmic layer with an expression for the viscous sublayer. The function is insensitive to the near-wall grid spacing, which means that the first cell from the wall can be in the viscous sublayer, in the log-law region, or in the buffer region between them without introducing excessive errors. This treatment also accounts for pressure gradient, heat transfer, and compressibility effects in the momentum equation (Richards et al., 2022).
3.1.3 Quantifying infection risk
The aerosols were assumed not to affect the airflow and to follow the currents exactly. The respiratory emission could therefore be modeled as a passive scalar ξi. On top of the scalar model, a proxy could be made of the total aerosol mass in the emission. This was found to be a relatively good approximation for droplets with a diameter less than 100 μm (Ai and Melikov, 2018; Trivedi et al., 2021). Spray droplets were neglected, as they do not survive long enough to merit a ventilation analysis. The passive scalar ξi can denote the time-averaged mixture or mass fraction of a viral concentration emitted by the i-th stream, that is, ξi = Ci/Ci,0 = Yi/Yi,0 where Ci,0 is the initial concentration of viral particles in the i-th stream and Yi,0 the initial mass fraction of viral particles in the i-th stream. Note that ξi = 0 denotes pure air, while ξi = 1 denotes the maximum concentration of viral particles in the mouth.
The passive scalar ξi was estimated by solving the following transport equation together with the flow variables:
where Dt denotes the turbulent diffusivity (usually negligible compared to the molecular diffusivity) and D the molecular diffusivity.
While CFD simulations were used to assess the effectiveness of PerDiVent in capturing respiratory emission, a well-mixed mass balance was used to estimate the average concentrations of viral particles and carbon dioxide in the room. The balance was adapted from an analytical model developed in a previous study (de Oliveira et al., 2021), based on the ordinary differential Eq. 3 and its respective analytical solution Eq. 4:
Eq. 3 can be dissected into three components: The first term on the right-hand side of the equation corresponds to the total generation of viral particles emitted by infected individuals. The second term denotes the removal rate of viral particles due to macro-scale ventilation, whereas the third term denotes the removal rate due to PerDiVent. This term was derived from
In the above, ξsuc denotes the passive scalar emitted by an occupant i, which is then captured by the local suction. Furthermore, ninf denotes the number of infected people and λdecay denotes the viral decay, which was modeled as 0.636 h−1 based on experiments with SARS-CoV-2 (van Doremalen et al., 2020). κ represents the settling of aerosol droplets, which was modeled as 0.39 h−1 (de Oliveira et al., 2021). vmv is the ventilation rate due to the background MV, and vjets is the ventilation rate due to the PerDiVent jets. Note that this is the fraction of the jets which is not captured by the local suction and contributes to mixing the emission in the macro-environment. This fraction was estimated by:
where ξjets,suc is the passive scalar of the jet captured by the local suction.
Based on a well-mixed assumption for the concentration of viral particles, the total viral dose, that is, the viral particles inhaled by an occupant, are given by
where Qin was assumed to be 0.521 l/s for an average person engaged in sedentary activity (Gupta et al., 2010).
Then a dose-response approach is used to estimate the risk of cross-infection. Based on (Watanabe et al., 2010), the risk of infection is given by
where kp is a parameter that differs by pathogen. Here, we consider kp = 4.1 ⋅ 102 based on a model developed for SARS-CoV-1. This is used due to the similarity of this virus with SARS-CoV-2 and because it is in the same genetic group as other coronaviruses such as HCoV-229E (human common cold), MHV-S and HEV-67N (animal coronaviruses), for which the model also demonstrated good agreement with experimental data (Watanabe et al., 2010).
3.1.4 Integral flow model approach
While high-fidelity simulations are very useful and indeed indispensable together with experiments to give a relatively accurate estimate of PerDiVent’s effectiveness in reducing cross-infection risk, they can be computationally very expensive for practical design. As a remedy, the complex flow interactions of breathing, PerDiVent jets, local suction, and background ventilation can be dissected into parts that can be investigated separately using low-order flow models and scaling laws. In this direction, here we focus on predicting the trajectory and scalar mixing of the buoyant jet coming from a person’s mouth to complement the CFD analysis. This allowed us to better select the position of the suction relative to the mouth, the position of the jets relative to the mouth, and the necessary capture area of the suction.
In this work, an adapted version was developed from an integral model for turbulent axisymmetric buoyant jets in unbound stratified flow, called CorJet (Jirka, 2004). This integral model was tested under a wide range of test conditions and verified using high-quality data. It appeared to be relatively accurate and reliable under general flow conditions. The model tends to become invalid when the boundary layer nature of the flow breaks down, such as during terminal layer formation in stratification, upstream penetration in jets opposing a current, or transition to passive diffusion in a turbulent ambient shear flow. This model has the following main assumptions.
1. The model is only strictly valid when the flow is fully self-similar. However, it was also tested under non-self-similar flow conditions and compared with experimental data. The model still showed relatively good agreement.
2. The boundary layer approximation is assumed; this implies a pressure within the jet equal to that in the ambient outside. This is violated whenever the jet undergoes strong spreading or exhibits strong curvature.
3. The model is not valid in the initial zone of flow establishment (ZOFE).
4. The model is limited to a spatial region with sensible free shear flow behavior.
CorJet formed the basis of the model applied to PerDiVent. The mouth jet was assumed to be round. The only elements that had to be added were the quantitative specifications of ambient velocities ua,x, ua,y, and ua,z. The ambient velocities come from additive contributions of suction, thermal plume, and background ventilation. It was assumed that all of these contributions could be linearly superimposed. Most of the equations and details can be found in the cited work (Jirka, 2004). They are not repeated here, as the only differences are the trivial additions of co- and counterflow (the original work only considered crossflow) and the sources of the ambient velocities ua,x, ua,y, and ua,z.
3.1.4.1 Modeled thermal plume
The human thermal plume was modeled using a point source originating from a cylinder of characteristic diameter Ds (Bouzinaoui et al., 2007). Experiments have confirmed the validity of the point source model for this shape (Bouzinaoui et al., 2007). However, there have been comments on the inaccuracy of approximating a human thermal plume with a cylinder (Zukowska et al., 2008), which was taken into account while tuning the model. The cylinder was defined so that the mouth was placed in the center of the cylinder with respect to the horizontal axis. The top of the cylinder was specified to be exactly between the shoulders and the mouth of the person. The convective power was determined by considering the average heat flux of a person, similar to that in Section 3.1.2.
3.1.4.2 Suction induced flow
It was assumed that suction imposes a velocity in the vertical direction when the flow studied aligns with the hood of the suction on the horizontal axis. The imposed velocity decreases exponentially with the horizontal distance from the edges of the hood. ACGIH has reported simple formulas that have been used for many years in practical applications (Bracconier, 1988). These are denoted by
and
where asuc denotes the length of the hood and bsuc denotes the width. Based on the analyzed CFD simulations, it was observed that Eq. (10) resulted in the best estimates for suction-induced flow. However, both equations underestimated the velocities.
3.1.4.3 Jet impingement
The CorJet model tends to become invalid when the boundary layer nature of the flow breaks down. This means that too strong impingements originating from PerDiVent’s planar jets will render the model inaccurate. It fails to predict the trajectory of the jet and the dilution at the impact point for strong cross-flow, which was shown in independent experiments (Taherian and Mohammadian, 2021). The interaction between a jet and the cross-flow leads to a highly complex, three-dimensional, non-linear, and unsteady flow. In this case, qualitative descriptions and experimental scaling laws were necessary to predict flow behavior.
A round jet in cross- and co-flow can be separated into three distinct zones; the strong-jet, weak-jet, and line momentum puff (Kikkert et al., 2009). The strong jet indicates the flow in a weakly advected region. The term “strong” refers to the properties of the jet, which closely resemble a free jet. As the distance from the source increases, the jet velocity (relative to the ambient velocity) decays and the advection becomes stronger. In the strongly advected region, the rates of spread, dilution, and velocity decay are reduced, and the flow is referred to as a weak jet. A further increase in advection strength results in a mean flow structure resembling that of a counter-rotating vortex pair. The rates of spread, dilution and velocity decay are different from those of the weak-jet region and are therefore more specifically referred to as line momentum puff (Kikkert et al., 2009).
Experiments have been carried out to determine the mixing rate in both the weakly advected and strongly advected regions for jets in cross- and co-flow. In order to quantitatively assess whether the jet is weakly or strongly advected, the jet-to-cross/co-flow velocity ratio is used, denoted by Eq. 11.
Tests have determined that for axisymmetric jets in cross-flow the mixing rate scales with s−1.3 in the weak jet region but scales with s−2/3 in the far-field region (line momentum puff) (Smith and Mungal, 1998). This was verified for velocity ratios between 5 and 25. It was found that the scaling laws are independent of the jet-to-crossflow velocity ratio. Similar tests for axisymmetric jets in co-flow have determined that the mixing rate decays with s−2/3 in strongly advected (weak jet) regions (Davidson and Wang, 2002).
3.2 Assessment of energy costs, noise and thermal comfort
3.2.1 Assessment of energy costs
Apart from the assessment of infection risk, another focus of this study is the costs of mechanical power to ensure broader generality with regard to the design of PerDiVent systems. Although thermal energy costs are often the largest contributor to overall energy consumption, the breakdown of these costs is very specific to the conditions under which the system operates. Due to this great dependence, no general quantitative results can be extracted on the effect of PerDiVent on thermal energy costs. The cost of mechanical power is easier to generalize for all types of buildings.
3.2.1.1 Mechanical energy cost
It is assumed that PerDiVent components are retrofitted into existing buildings and only lead to the addition of additional ventilation ducts. This means that for an equal ventilation rate, PerDiVent causes an increase in energy costs, since the decrease in flow rate in the ducts providing air to the MV diffusers has a negligible effect on the overall energy cost. This increase in energy consumption (neglecting fan efficiencies) is proportional to Q ⋅|ΔP|, where Q is the flow rate and |ΔP| is the pressure loss in the ducts. Much experimental research has been conducted on pipe flow and its associated pressure losses based on geometrical parameters and flow rates. Experimental coefficients are often used to account for separation and other sources of non-frictional losses. These experimental coefficients are denoted by Ki and are coupled with Eq. 12 (Deen, 2016).
where U0 is the mean velocity in the pipe (duct). Additionally, friction losses for a long pipe can be estimated using a trivial control volume analysis, resulting in
In Eq. 13, ffan is the Fanning friction factor, which is derived from experimental data and is a function of the Reynolds number,
where
In Eq. 15, σ denotes the cavity width of a corrugation, while ϵ denotes the depth of the cavity. λ represents the pitch of the corrugation in this context. Typical values for λ, σ and ϵ found in practical applications are 0.1Dh, 0.04Dh and 0.15Dh, respectively (Whitehurst et al., 1966). These expressions were used in further calculations.
3.2.1.2 Mechanical energy losses in the local suction and jets
In Figure 3, a two-dimensional schematic of the suction and a PerDiVent jet is drawn. The design variables available to optimize energy efficiency were the diameters of the pipes and the contraction lengths indicated in figure. All other geometrical parameters were fixed by practical constraints or by design for minimal cross-infection. This includes the hood capture area, the length and width of the jets, and the lengths of the pipes. The numbers indicated in Figure 3 represent regions with different sources of pressure loss. The way these losses were calculated is denoted in Table 2. Pressure losses due to contraction/expansion are coupled to βpipe = Dh,1/Dh,2, where Dh,1 is the smaller hydraulic diameter between the two. The velocity U0 is also coupled to Dh,1. The gradual contraction loss coefficient is given by (Co, 1982):
where
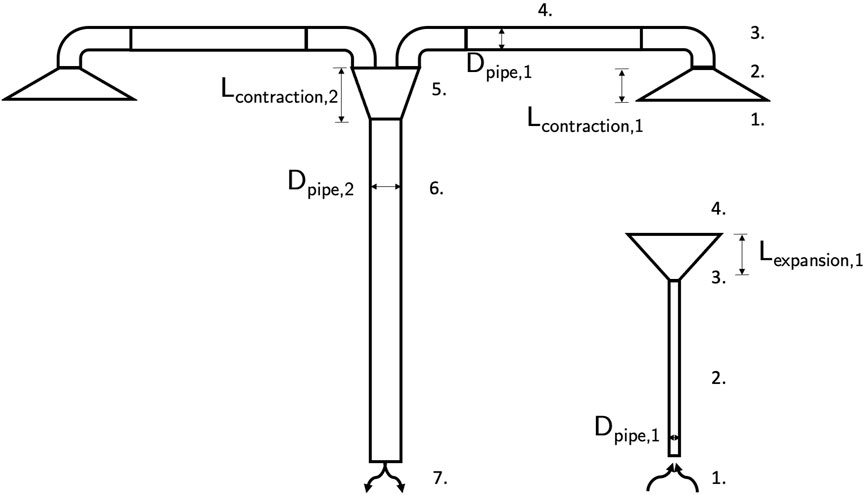
FIGURE 3. Two-dimensional schematic of the suction and a PerDiVent jet. The parameters indicated are design variables. All other geometric characteristics are fixed by other constraints. The numbers denote regions with different experimental loss coefficients.
TABLE 2. Sources of pressure loss in the local suction and PerDiVent jet.
θpipe indicates the slope of the contraction coupled to Dh,1, Dh,2 and the length of contraction. Based on (Co., 1982), the expansion loss is
where
Lastly, before the flow leaves the outlets of the PerDiVent jets, it has to be homogenized to create a uniform flow. Estimates on pressure losses due to this homogenization were difficult to obtain. A close approximation is the pressure loss due to an air stream entering a HEPA filter. Therefore, the estimates of pressure loss in the HEPA filters were used in further calculations (Bergman et al., 1994).
3.2.1.3 Metrics for energy comparison
Since PerDiVent is designed to reduce the risk of cross-infection for an equal (overall) ventilation rate, comparisons of energy costs are made with PerDiVent operating at a reduced ventilation rate, resulting in the same cross-infection risk as for standard MV. In addition, energy cost comparisons were made with PerDiVent operating at a reduced ventilation rate, which would result in equal steady-state carbon dioxide concentrations in the office. An analysis, similar to the one discussed in Section 3.1.3, could be applied to estimate the well-mixed carbon dioxide concentration, which results in:
The exhalation flow rate of CO2 was assumed to be
3.2.2 Assessment of noise and thermal comfort
Very simple and even crude estimations were made to assess the influence of PerDiVent on thermal comfort and noise. These approximations were deemed sufficient to satisfy concerns about basic practical issues. However, more detailed models or even experiments are required in future work for the technology to mature.
3.2.2.1 Noise assessment
The main source of noise in corrugated pipes can be attributed to vortex shedding from the corrugation gaps (Goyder, 2013). The boundary layer emerges from the leading edge of the corrugation to form a shear layer between the moving fluid above the corrugation cavity and the still fluid within the cavity. The shear layer rolls up into discrete vortices, which are then advected toward the trailing edge of the corrugation. This phenomenon is called whistling or singing. Experiments have found that the saturation behavior of corrugated pipes satisfies
If the whistling is completely eliminated, there is still a certain level of noise produced within the main pipe. There exists a well-known semi-empirical relation for estimating the sound power level in standard HVAC ducts, denoted by Eq. (21) (Rakul. and Sathishkumar, 2018):
where LW is the sound power level (dB), U0 the mean velocity in the duct, and Across the cross-sectional area of the duct (m2).
There has been considerable research conducted on the aeroacoustics of planar jets. Deductions have been made about the influence of nozzle geometries and Reynolds numbers on noise, and some scaling laws have been derived. However, this research was mostly focused on the compressible velocity regime (sub- and supersonic). Theoretical and experimental research on planar jets with exit velocities lower than 40 m/s is lacking in the literature. This means that any empirical models and scaling laws derived from this research cannot be used adequately. However, there are some findings that can be generalized to a wider velocity regime and are worth noting.
Higher aspect ratios of planar jets were discovered to result in lower levels of sound power (Henrywood et al., 2014; 2016; Kanjere et al., 2016). Another study compared square jets to round and elliptical jets at low exit pressures and found that square jets are quieter than round and elliptical jets (Balakrishnan and Srinivasan, 2019). The difference in sound pressure levels between square and round jets ranged between about 5–8 dB. A third experimental study confirmed that rectangular jets are quieter than circular jets after performing several tests at supersonic velocities (Viswanath et al., 2016).
For the quantitative results of this work, only the noise inside the ducts was taken into account. Simple estimations on the noise from the inlets- and outlets were not available and therefore ignored in this work. This aspect has to be investigated in more detail in future studies.
3.2.2.2 Thermal comfort assessment
Fanger created a model that can predict the thermal comfort of a person under a wide variety of circumstances (Shaw, 1972; Awbi, 2003). Several experiments were carried out in the 1970s to validate Fanger’s comfort equation. These experiments confirmed the accuracy of the predictions under mainly sedentary activity, which was analyzed in this study.
The most important input to the model is the metabolic rate of a person, the insulation of a person’s clothing, the air temperature, the relative air velocity, the mean radiant temperature of the room surfaces, and the relative humidity. PerDiVent affects the temperature of the air near a person, the relative speed of the air, and the relative humidity. The influence of the system on these variables was investigated and compared to ventilation without PerDiVent, to assess how PerDiVent affects thermal comfort.
Details of the model are available in the literature (Awbi, 2003). In summary, the human body is approximated as a single node. Fanger derived several semi-empirical relations and developed a psychological scale to indicate the thermal sensation during any transient/strain response to adjust the mean skin temperature when the body is not in thermal equilibrium. This scale was called the predicted mean vote (PMV). It represents the average thermal sensation experienced by a large group of people. PMV can also be related to the predicted percentage of dissatisfaction (PPD, percentage of people dissatisfied). ISO Standard 7730 recommends keeping PPD below 10% to achieve satisfactory thermal comfort in most indoor environments (ISO-7730, 1994).
The CFD data of the simulations with and without PerDiVent were used as input for Fanger’s model. Specifically, volume-averaged quantities of air temperature (Ta) and relative air velocity (vrel) were evaluated at three equidistant points on the body. The first point is located near the head, the third is in the center of the abdomen, and the second point is between. The PMV and PPD could be then estimated at each of these three points. In addition, the occupant was assumed to wear a traditional business suit and have a metabolic rate according to average sedentary activity. Work performed during sedentary activity in an office is often negligible and was therefore assumed to be zero (ISO-7730, 1994). The effect of PerDiVent on relative humidity was also estimated with a well-mixed balance (see Section 3.2.1.3). For modeling and comparison purposes, the relative humidity of the inlet air was assumed to be 40%. The average relative humidity of exhaled breath was obtained from a statistical study and was estimated to be around 76.8% (Mansour et al., 2020).
4 Results and discussion
4.1 Results and discussion on infection risk
4.1.1 CFD-derived flow pattern and mixing of respiratory emission
The CFD baseline simulation with MV (no-PerDiVent case) is discussed first. Figure 4 depicts the flow streamlines and iso-surfaces of the passive scalar issued by the occupants and diffusers to provide a general idea of the flow. The diffusers, on each side of the desks, disperse fresh air toward the walls, which circulates back to the center of the room (Figure 5A). In Figure 4B, the diffusers and exhaust are shown to create a complex macro-scale flow, which is typical for MV. The volume of the room is relatively large, resulting in low velocities in most of the room, most importantly near the occupants (
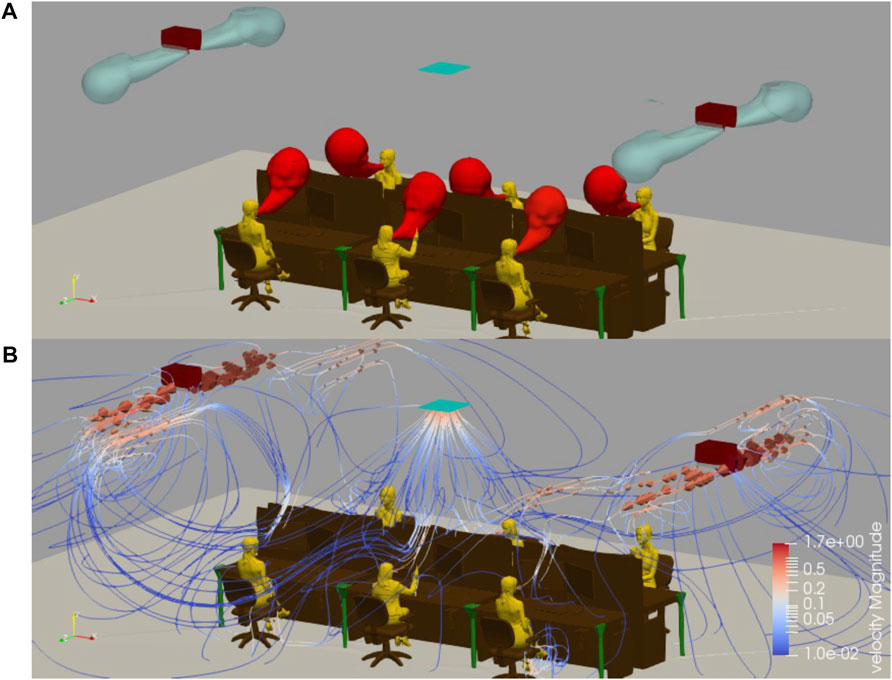
FIGURE 4. (A) Passive scalar iso-surfaces visualized for the mixing ventilation simulation. The passive scalar emitted by the occupants, ξoccupant = 0.005, is indicated in red. The passive scalar emitted by the diffusers, ξdiffuser = 0.2, is indicated with cyan. (B) Streamlines induced by the diffusers and room exhaust are visualized for the mixing ventilation simulation and are colored based on the magnitude of velocity.
FIGURE 5. (A) Velocity distribution visualized in a YZ plane for the no-PerDiVent simulation. Values range from 0.01 to 2.3 m/s. Streamlines induced by the diffusers and room exhaust are indicated in orange. (B) Velocity distribution on one of the outer desks visualized on a YZ plane for the PerDiVent simulation with Qsuc = 6 l/s. Values range from 0.01 to 5.0 m/s. The orange lines indicate the streamlines induced by the diffusers, the exhaust of the room, the suction, and the exhalations. (C) Velocity distribution at one of the outer desks visualized in a XY plane for the PerDiVent simulation with Qsuc = 6 l/s. Values range from 0.01 to 3.3 m/s. The orange lines indicate the streamlines induced by the jets and suction. (D) Logarithmic distribution of the passive scalar of one of the occupants at the outer desks visualized on an XY plane for the PerDiVent simulation with Qsuc = 6 l/s. Values range from 1⋅10–6 to 0.99. The red lines denote temperature iso-lines of which three are labeled.
Figure 5 illustrates how the PerDiVent components affect the flow in the room. The upward velocity field, induced by suction, ensures the removal of part of the respiratory emission near the occupant, resulting in reduced displacement and diffusion to the rest of the room (Figures 5B,C). This leads to lower concentrations of contaminants in the macro-scale flow field and generally near other occupants. In particular, Figure 5C shows how the high momentum flux of the PerDiVent jets inhibits the penetration and dispersion of the exhaled flow in the lateral direction. The jets also entrain part of the emission and ambient air and direct it to the suction. The flow is then entrained by the local suction and removed, as indicated by the streamlines. Due to the additional induced momentum, the jets enhance the mixing of the non-captured air in the room. It should once more be noted that PerDiVent differs from traditional displacement ventilation, in the sense that the displacement of air and contaminants is not based on thermal stratification, but on mechanical means through the combination of jets and local exhaust.
Figure 5D depicts how the passive scalar of an occupant (located at one of the outer desks) evolves along the center-line. Figure 6A shows how the values of this passive scalar change at various distances from the mouth. The induced flow by the PerDiVent jets and suction leads to greater dilution and enhanced turbulent mixing of the emission compared to the MV simulation. This dilution increases even more when the simulations are compared to Qsuc = 6 l/s and 12 l/s, due to increased entrainment of the ambient fluid by suction. More intense mixing may be beneficial in some circumstances, as it can further prevent concentrated contaminants from reaching other occupants and quickly dilute them before directing them to the local suction. The same trend is shown in Figure 6B. Most notably, the blue lines indicate how the PerDiVent jets affect its cross-sectional shape. The dispersion of the emission in the lateral direction is largely prevented by the jets. The emission is laterally squeezed to fit inside the suction. This slightly increases the width of the jet at lower heights and stretches the emission longitudinally. It is interesting to investigate in future work how the jets affect the emission if the desks are smaller or if the exhaled flow is not directed entirely longitudinally but has a non-zero lateral angle.
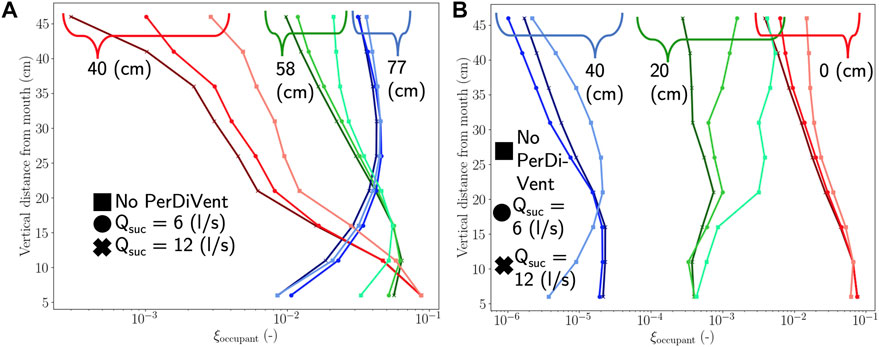
FIGURE 6. (A) Logarithmic distribution of the passive scalar of one of the occupants at the outer desks denoted at different vertical and longitudinal distances from the mouth. The values are taken from the three different simulations (see legend), longitudinally along the center-line of the jet. The distances indicated in the figure represent the horizontal distances from the mouth. (B) Logarithmic distribution of the passive scalar of one of the occupants at the outer desks denoted at different vertical and lateral distances from the mouth. The values are taken from the three different simulations (see legend), at a longitudinal distance of 51 cm from the mouth. The distances indicated in the figure represent the horizontal distances from the center-line of the jet.
Lastly, it is of interest to report the mass-averaged values of ξoccupant at various locations, which will be useful later to estimate the risk of cross infection (Section 4.1.3). The mass-averaged values of ξoccupant at the outer desks in the removed suction flow are approximately 0.0180 for the simulation with Qsuc = 6 l/s and 0.0116 for the simulation with Qsuc = 12 l/s. In contrast, the mass-averaged values of ξoccupant on the central desks are approximately 0.005 and 0.0035 respectively. The mass-averaged values of the passive scalar of the PerDivent jets (ξjet) were found to be very small (
As far as the non-captured emission by the local PerDiVent suction is concerned, here we do not evaluate its dispersion and further mixing within the room. Instead, we assume that the non-captured emission is quickly mixed (just as well as for the MV case) so that we can further use a well-mixed mass balance for the passive scalar. This facilitates the analysis of cross-infection as the component of non-captured emission to the infection risk (a result of the micro-scale flow pattern) can be separated from the specific macro-scale flow pattern of the room which may vary between real settings. Since there is little thermal stratification in the room and the PerDiVent jets further enhance mixing both close to and far from the occupant, a well-mixed assumption for the non-captured emission is justified. This assumption is also quite conservative, since one of the functions of the jets was to act as an air curtain, shielding the occupants from the ambient fluid. Therefore, the inhaled viral particles could be lower than in reality and PerDiVent could potentially be more effective than stated. This will be discussed further in Section 4.1.3.
It should be noted that the only exhalation mode studied was that of a steady exhalation through the mouth. Other modes that should be studied in future studies are (transient) exhalations and inhalations through the nose and exhalations due to speaking, laughing, coughing, and sneezing. In addition, the occupants were assumed to breathe directly at the desk monitor, but the initial trajectory of the exhalation might be in a completely different direction. Furthermore, only a specific type of flow pattern induced by the background ventilation was analyzed. Different types of mixing ventilation system induce different flow patterns. It is important to analyze more precisely in the future how different flow patterns and velocities affect PerDiVent.
4.1.2 Integral model results
In the following section, the results of the integral model are discussed. First, the model was verified against the CFD data. The implications of the results on the positioning of the PerDiVent components and the capture area of the hood are discussed next.
Figure 7 shows how the integral model compares with the CFD simulation of the MV case assuming that the CFD provides the ground truth (comparison using the occupants sitting at the outer desks). For an optimal fit to the data, the approximate diameter of the thermal plume (Ds) was determined to be 0.38 m. This is approximately twice the width of the upper body of the occupant. The velocities induced by the background ventilation were negligible near the emission. It can be seen that the integral model can predict the exhalation flow trajectory with relatively high accuracy. This can be attributed to a correct estimate of the entrainment rate, which increases with the traversed distance due to the contribution of the characteristic free plume, as expected (Figure 7B). The prediction of velocity decay is also relatively accurate, but passive scalar decay is underestimated. The difference in the scalar remains relatively constant along the horizontal distance; therefore, in the future, there is space for appropriate tuning of the integral model constants that emulate the turbulent mixing process.
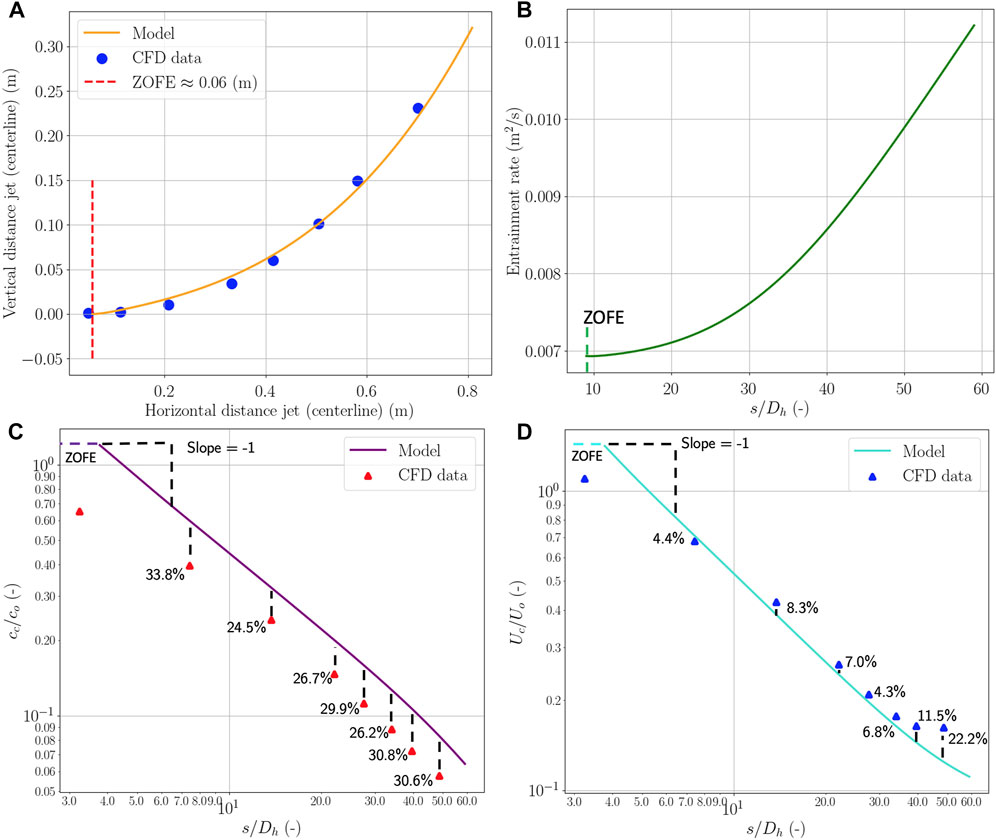
FIGURE 7. (A) Trajectory of the center-line of the mouth exhalation in the situation of the no-PerDiVent simulation. The integral model is compared with the CFD data. (B) Entrainment rate of the mouth exhalation, as predicted by the integral model, in the situation of the no-PerDiVent simulation. The x-axis displays the traversed distance over the hydraulic diameter of the mouth. (C) Center-line scalar decay of the mouth exhalation. (D) Center-line velocity decay for the mouth exhalation.
Although the integral model is strictly not valid when PerDiVent is included due to the cross-flow induced by the jets, and more work is required on model development, it was observed in Section 4.1.1 that the jets have little effect on the center-line trajectory. As a result, the integral model can be used to provide some estimates of the mean flow behavior as a function of several parameters, such as suction removal rate Qsuc, exhalation velocity U0, ambient horizontal and vertical velocities ua,x and ua,y, and ambient temperature relative to the mouth. The effect of the jets will be discussed in further detail in a later section.
With all of the above in mind, Figures 8A,B show how the integral model predicts the center-line trajectory of the emission for the PerDiVent cases. It is observed that the local suction is not adequately able to bend the emission towards it when Qsuc = 6 l/s, U0 = 2.25 m/s and ua,y = 0 m/s. Instead, a much higher flow rate of about 40 l/s would be necessary to significantly bend the emission, as shown in Figure 8C. This requires large pipe diameters to keep both energy costs and noise at low levels, as discussed in Sections 4.2.1 and 4.2.2. Additionally, the potentially large noise produced by the suction inlet at these flow rates could also impose an upper limit that will be used practically. This means that the position of the suction relative to the occupant is very important. Figures 10, Figure 11A,B depict the effect of placing the hood in a better location relative to the occupant. These figures are discussed in more detail in later sections.
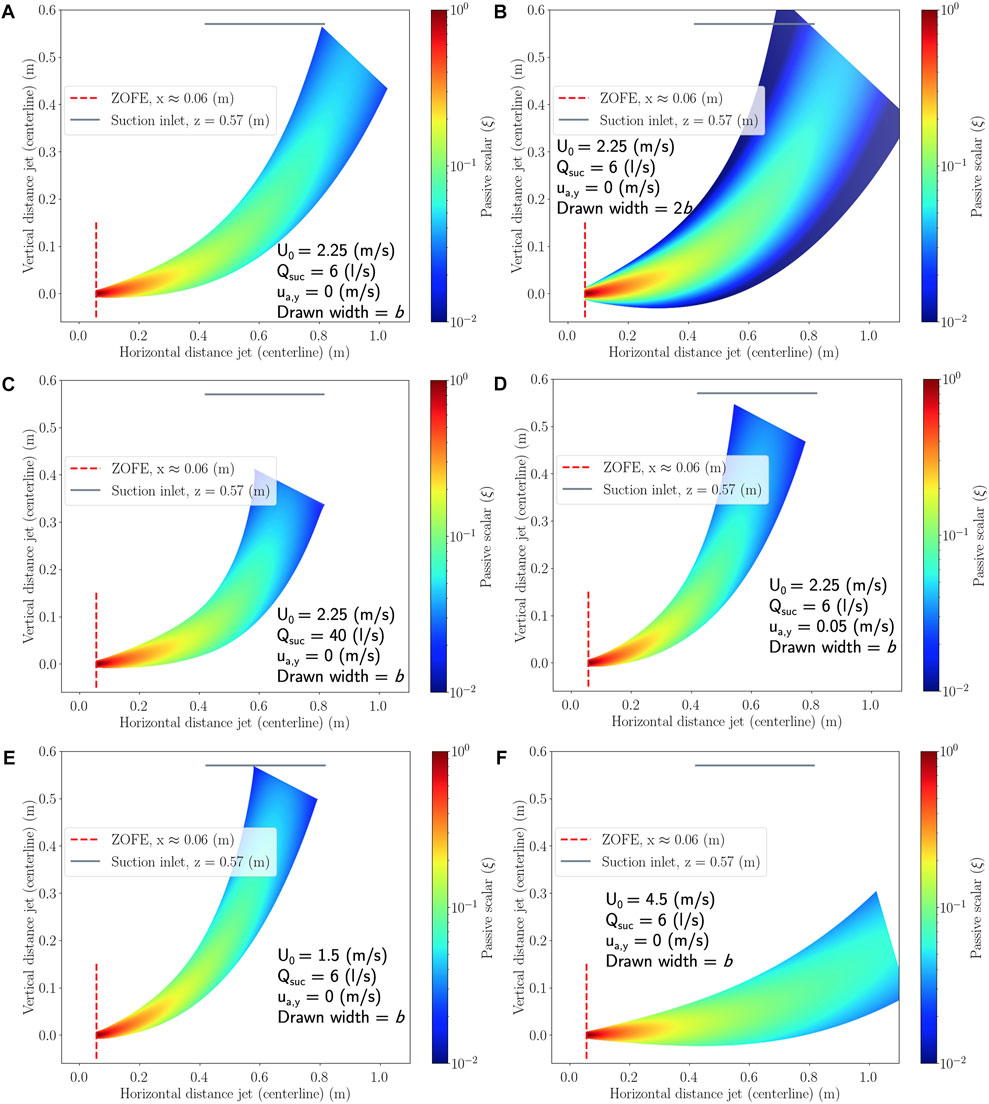
FIGURE 8. Mouth exhalation of one of the occupants at the outer desks predicted by the integral model (center-line) as a function of various conditions. These conditions are (A–F). The trajectory of the exhalation and the scalar distribution along the trajectory is depicted with a two-dimensional cross-section of the jet. The gray line indicates the suction inlet.
Furthermore, the emission trajectory also heavily depends on the background ventilation. In Figure 8D, it can be seen that the suction is well placed if there is a uniform upward velocity of 0.05 m/s. This upward velocity could be induced by different flow patterns of MV, DV, and/or other sources that lead to thermal stratification. Therefore, it is beneficial to know detailed information on background ventilation before a successful PerDiVent design can be installed in the office.
Lastly, Figures 8E,F show how a different mouth exhalation velocity (discharge momentum) affects the emission trajectory. A lower U0 = 1.5 m/s ensures that the emission is directed towards the hood (that is, the capture effectiveness is high). However, low capture effectiveness is observed with a higher velocity of U0 = 4.5 m/s, which could potentially emulate the average momentum during a short-lived violent expiratory event (e.g., sneezing or coughing) that would be harder to contain.
In summary, the factors that affect the success of PerDiVent are the relative position of the occupant, the background ventilation pattern, thermal stratification, and the average exhalation momentum. This is due to the relatively low entrainment strength of the suction jet and the PerDiVent jets. Section 4.3 further discusses how the dependency on these factors could be reduced.
4.1.3 Estimates of cross-infection risk
Provided access to CFD simulation data, a well-mixed balance Eq. (4) that includes the removal rate due to PerDiVent and the macro-scale ventilation can then be used with the dose response model of Eq. 8 to calculate the risk of cross-infection in the office. Figure 9 shows the total infection risk after an exposure time of 8 hours for the three simulated cases (see also Table 1) and for various levels of the virus-generating factor
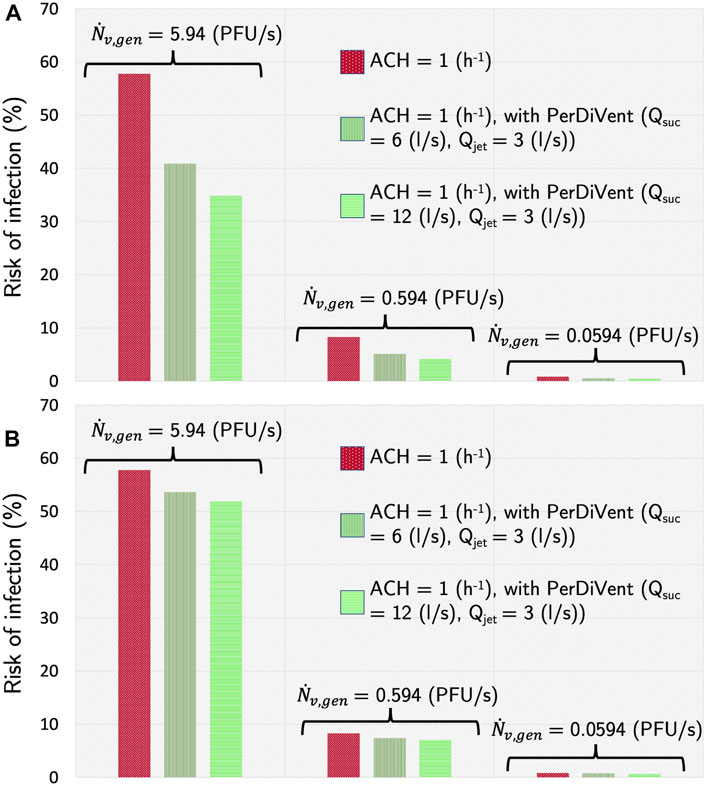
FIGURE 9. Cross-infection risk in the room (well-mixed) after 8 hours due to one infected individual for the three different simulation cases. The risk is shown for various viral loads of the infected individual. (A) The infected individual is located at one of the outer desks. (B) The infected individual is located at one of the center desks.
In Figure 9A, this infected individual is located at one of the outer desks. The reduction in infection risk was found to be strongly dependent on the virus generation rate, as also discussed in the original studies using the current dose-response model (de Oliveira et al., 2021). However, the absolute value of the risk is only indicative since the virus-generating factor is generally quite uncertain in real scenarios [see, e.g., (Zafari et al., 2022)]. The relative change in risk is of greater value in evaluating the effectiveness of PerDiVent. In particular, for simulations with Qsuc = 6 l/s, the reduction in risk compared to MV was a factor of 1.41 when
The removal effectiveness of PerDiVent can further be measured using an additional metric, independent of infection risk, denoted by
where Cvirus,suc denotes the concentration of viral particles captured and
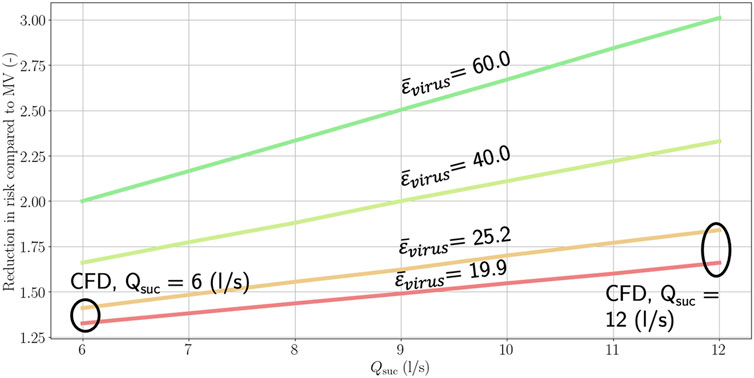
FIGURE 10. Reduction in cross-infection risk compared to MV as a function of flow rate through suction and removal effectiveness
In Figure 9B, the infected occupant is located at one of the central desks, where the emission is not captured as efficiently as at the outer desks due to the relative position of the occupant to the hood. From the discussion of Sections 4.1.2 and 4.1.1 it becomes apparent that
It should be noted that although PerDiVent is not designed for reducing cross-infection risk due to larger/spray droplets, intermediately sized droplets can be suspended in the air for longer times, sufficient to cause harm. These droplets, however, do not have a Stokes number low enough to be modeled as a passive scalar. Further investigations that include Lagrangian droplet tracking will have to be included in the future, similar to the work of Yan et al. (2017), to obtain more information on these transmission routes, especially for violent exhalation events where intermediately sized droplets can be important (Trivedi et al., 2021). Despite the advantages of Lagrangian models, however, such analyses will still bring a lot of uncertainties due to the stochastic nature of viral transmission. Ultimately, the viral load is the most uncertain and important parameter in this framework. A sensitivity analysis, including the viral load, is therefore expected to cover a relatively wide spectrum of the worst- and best-case scenarios. More so than including a different cut-off diameter for aerosols (see Section 3.1.3), as the risk of transmission is significantly more affected by viral load in the sputum (de Oliveira et al., 2021). More detailed analyses on airborne disease transmission risk and the correspondence of viral load with variants of SARS-CoV-2 are given in previous work (de Oliveira et al., 2021; Zafari et al., 2022).
4.2 Results and discussion on energy costs, noise and thermal comfort
4.2.1 Energy costs
Figure 11A illustrates how PerDiVent can lead to a decrease in mechanical energy costs compared to MV when the same risk of infection is desired (maintained). Different lines are used for various values of
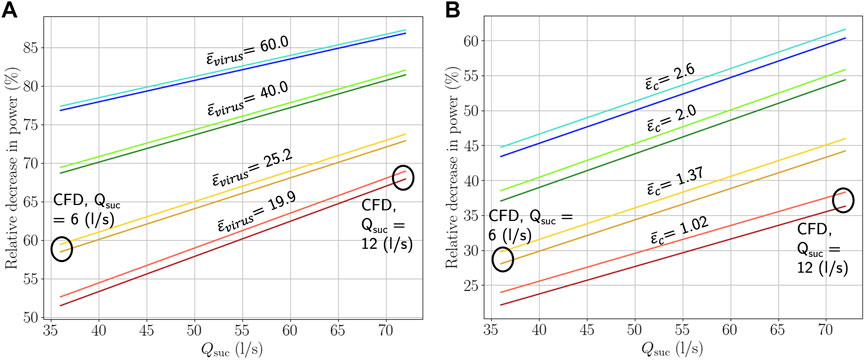
FIGURE 11. (A) Relative decrease in mechanical power using PerDiVent for six people as a function of the total flow through the suctions (summed for six suctions) and removal effectiveness
Similarly to the above, Figure 11B illustrates how PerDiVent can lead to a decrease in mechanical energy costs for equal concentrations of carbon dioxide in the room. Maintaining the carbon dioxide concentration below a certain level is what ventilation systems are often designed for, as too high concentrations of carbon dioxide (which directly results in lower oxygen concentrations) negatively affect human health. It is recommended that the concentration is kept, at least, below 5000 parts per million to avoid discomfort and headache (Awbi, 2003). Different lines are indicated for various values of PerDiVent’s ventilation effectiveness
where
Furthermore, it is observed that increasing the flow rate through the local suction generally increases mechanical energy savings. This suggests that high suction flow rates pose no problem in terms of energy costs and can be used to great advantage to optimize the PerDiVent design. However, this also implies that the suction pipe diameters must be increased to avoid overshoot of energy costs, but more importantly to keep noise levels reasonably low, which is discussed later in Section 4.2.2. Therefore, the space available for pipes of certain sizes, in a particular environment, could be an upper design limit when considering the maximum suction flow used. In addition, the noise levels as a result of any flow entrance effects into the suction are still unknown and may also limit the flow rates.
At this point, it should also be noted that the increase in mechanical energy efficiency mentioned above (for the same risk of infection or CO2 concentration) has also previously been observed with PV systems. The energy saving potential of other PV systems has been studied in various works, both in cold climates (Schiavon and Melikov, 2009), and hot and humid climates (Schiavon et al., 2010). Simulations were used to predict the thermal energy costs of a small office in Copenhagen and Singapore. Room heating and cooling were provided by fan coils, which recirculate, heat, cool, humidify, or dehumidify the air in a room. With respect to both the cold and the hot climate, it was observed that the largest energy contribution comes from room cooling.
In cold climates, PV could lead to an increase in energy consumption of 61%–268% compared to MV if no appropriate energy saving strategies were applied. Saving strategies analyzed for cold climates are as follows.
• Supply air from PV at a constant temperature of 20°C.
• Reduce airflow rates due to increased effectiveness of ventilation. However, its effects are not always beneficial because of the free cooling effect of fresh outdoor air.
• Supply air only when the occupant is at its workstation. This strategy was found to have a minimal effect since the heating and cooling loads from the fan coils had to be increased.
• The most effective strategy was to allow the room temperature to rise above or fall below thermal comfort outside the workstation. It resulted in savings of up to 60% compared to MV.
In hot climates, PV could lead to savings of up to 51% compared to MV when recommended strategies are applied. These are.
• Reduce airflow rates because of the higher effectiveness of ventilation.
• Supply air only when the occupant is at its workstation.
• Increase the maximum temperature above thermal comfort outside the workstation.
Another study explored the energy saving potential of PV under winter conditions in Slovakia (Krajčík et al., 2016). In addition to heating and cooling loads (both from ventilation and external devices), mechanical ventilation loads were also examined. The largest contribution to energy costs was found to come from the heating of the room provided by the fan coils. This is different from the results observed by (Schiavon and Melikov, 2009) because energy consumption during the cooling season was not evaluated. It was found that PV can save up to 70% compared to MV considering only the energy consumption of mechanical ventilation, and up to 20% if space heating is included due to the higher effectiveness of PV, which allows for reduced ventilation rates. It contradicts the strategy recommended by (Schiavon and Melikov, 2009) for cold climates, which is likely because mechanical ventilation loads were included in the study of (Krajčík et al., 2016).
In future studies, it would be interesting to analyze numerically how much thermal energy can be saved with PerDiVent, although these findings are evidently specific to environmental and operating conditions.
4.2.2 Noise and thermal comfort
Basic estimations on noise levels in PerDiVent ducts, assuming whistling is eliminated, are shown in Figure 12. When realistic pipe lengths and distances from the occupant are taken into account, the sound pressure level does not differ significantly from the sound power level. The sound power level can therefore be regarded as a close estimate of the actual sound pressure level sensed by the occupant.
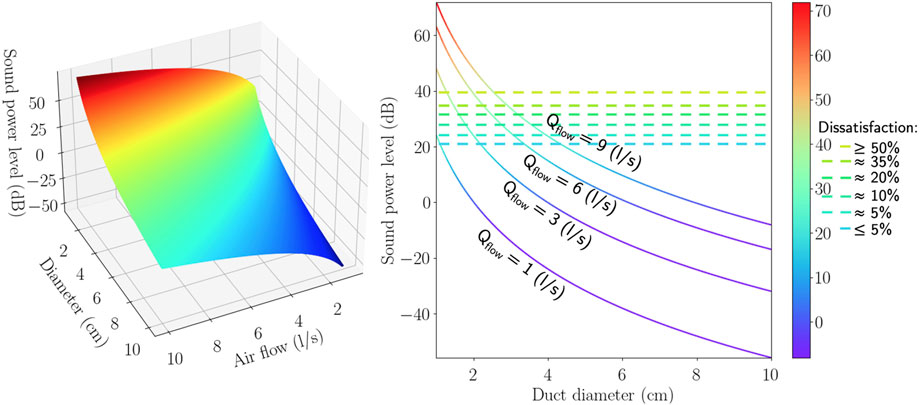
FIGURE 12. Sound power level through the ducts of PerDiVent versus air flow rate and duct hydraulic diameter. Whistling is assumed to be eliminated. The right figure also indicates the percentage of dissatisfaction with sound power/pressure level, which is based on European reports (Harvie-Clark et al., 2019).
Uncomfortable levels of noise still appear to be possible if the diameters of the pipes are too small. However, energy costs and noise are positively correlated in the sense that increasing the diameter of the pipe will decrease both. If we try to stay below 5% of occupant dissatisfaction when designing the jets and suction, noise places a more severe requirement on the choice of pipe diameter than energy. This means that the geometric parameters should be designed for low noise, which will automatically result in acceptable energy costs as well. This is a very important consideration for the design of PerDiVent systems.
In terms of thermal comfort, Figure 13A shows the equivalent effect of PerDiVent around an occupant. The results differ only slightly from the simulated MV case below shoulder height, and therefore only thermal comfort data around head height are reported. In general, we observe that PerDiVent has a negligible effect on thermal comfort near the occupant, although in this particular case a positive effect can even be observed closer to the jets as a result of an increase in relative air velocity. Figure 13B shows how the relative velocity of the air exactly affects thermal comfort at different temperatures. If the average ambient temperature is around 20°C (as was the case in the simulations), velocities up to approximately 1.2 m/s positively affect thermal comfort. Higher velocities will negatively affect thermal comfort. Furthermore, if the ambient temperature and/or temperature of the jets is lower than 20°C, the jets will have a more pronounced negative effect on thermal comfort. The opposite is true for temperatures higher than 20°C. These statements assume that the temperature of the jet flow is equal to the ambient temperature. The differences noted are important for smaller desks, where the jets are located closer to the occupant. Lastly, thermal comfort is found to be higher near the occupant compared to its immediate surroundings. This happens because the thermal plume increases the relative velocity of air close to the occupant. These velocities should be taken into account in addition to the velocities induced by the jets in practical design.
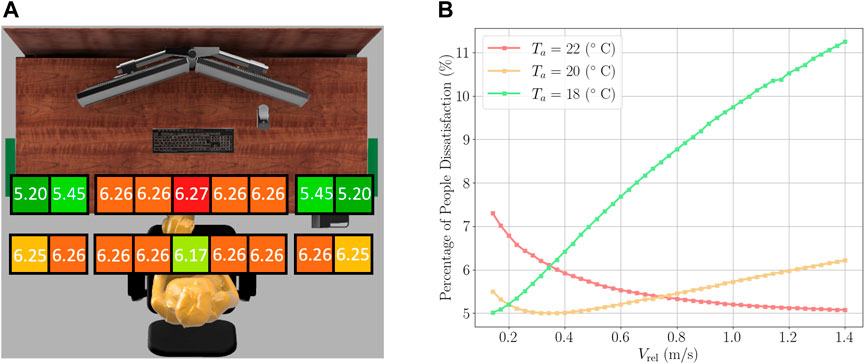
FIGURE 13. (A) People Percentage Dissatisfaction (PPD) evaluated at different points in the XZ plane near one of the occupants at the outer desks for the simulated cases with PerDiVent. The height of the measurements is close to the head of the occupant. The thermal comfort is analyzed at ACH = 1.0 h−1 (RH = 42.4%). (B) Percentage of People Dissatisfaction (PPD) for different relative air velocities and air temperatures (ACH = 1.0 h−1, RH = 42.4%).
4.3 Design considerations and possible improvements
The CFD analysis in the previous sections has shown how well PerDiVent captures the emission of the occupants in the current simulation setup (see, e.g., Figure 5D) and the implications on energy, noise, thermal comfort, and risk of infection. In the discussion, it became evident that the proposed PerDiVent setup is not optimized, mainly due to the ensued flow pattern around the exhalation flow, which directs only part of the emission to the local suction. As corroborated with the integral flow model and the analysis of Section 4.1.2, the position of the local suction relative to the occupant is important, which is not optimal here. Higher suction flow rates were shown to generally decrease infection risk and energy costs, due to a decrease in the exhaled passive scalar (see, e.g., Figures 9, Figure 11) but the removal and ventilation effectiveness cannot be expected to increase significantly as the effect of suction on the emission trajectory is not very pronounced.
In contrast, the effect of the PerDiVent jets can be much more pronounced, as discussed also in other applications of PerDiVent Gkantonas et al. (2020). However, in the current arrangement, the PerDiVent jets induce only a negligible velocity near the emission and there is not enough upward momentum available to direct the emission toward the suction and in general separate the occupant from the macro-scale ventilation-induced flow. In this regard, the jets do not entrain a significant portion of the emission, but perform better as air curtains.
Some alternatives to the current design could be proposed. With respect to PerDiVent jets, for example, one could consider that discharging the flow at smaller angles could lead to a more successful capture of the emission. However, a preliminary analysis for discharge angles smaller than 70° showed that the jets have the unintended effect of displacing the emission away from the suction in the longitudinal direction. When the jets intersect slightly above the emission, the jet flow reaches the suction first and essentially pushes the emission away. Laterally, it also squeezes the emission too much, causing a greater dispersion in the longitudinal direction. In addition, using a smaller discharge angle involves another compromise when considering the effectiveness of the jets as a shield and air curtain. In particular, this option might be less successful in capturing the emission if the exhalation is not directed straight at the desk monitor but has a non-zero lateral angle. Furthermore, if the two jets are slightly misaligned, the emission might be directed away from the suction in the lateral direction. It is essential to analyze such scenarios in future research, but one may conclude that the flow interactions are generally undesirable when the PerDiVent jet flow is discharged at smaller angles.
Alternatively, the size of the suction hood can be increased, as it can reduce the susceptibility of PerDiVent flow to jet misalignment, discharge angle, and background velocity. In particular, when higher upward velocities or significant stratification are present (e.g., with a background DV strategy), the horizontal trajectory of the exhalation shortens and a larger hood might be more effective. The efficacy of emission capture also depends on the horizontal and vertical location of the suction relative to the occupant, as well as the exhalation momentum. Both the location of the occupant and the exhalation momentum can vary considerably per individual, so a larger suction hood could be effective.
Another possible improved design to limit the dependence on the relative position of the individual involves the addition of another jet to direct the flow toward the suction. This limits the horizontal trajectory of the emission, regardless of the location of the occupant or the exhalation momentum. Although adding a jet requires more components, hence complexity and mechanical power, overall power consumption can decrease as a result of higher ventilation effectiveness. It is not recommended to remove the lateral jets, as only emissions directed straight at the monitor can be captured.
Furthermore, a different design of the later PerDiVent jets could prove beneficial. To illustrate this, let us consider the canonical case of a jet in cross-flow as a model for the effect of lateral PerDiVent jets on exhalation flow. Investigating cross-flow becomes even more important when a longitudinally located jet is added. The effect of cross-flow on trajectory and scalar mixing can be coupled to the jet-to-cross-flow velocity ratio rcf given by Eq. 11. For rcf < 5, the center-line velocity of the jet almost immediately decreases to zero and the jet transitions to passive diffusion (Smith and Mungal, 1998). The jet can be assumed to enter the momentum puff region immediately, resulting in decreased mixing, scaling with s−2/3 directly upon impact compared to s−1 for traditional axisymmetric jets (see Section 3.1.4.3). For rcf > 5, the jet first transitions to the weak-jet region, where the mixing scales with s−1.3.
Not only do lower values of rcf result in reduced mixing, but also lead to stronger bending of the exhalation due to the higher momentum flux injected by the PerDiVent jets. However, the counter-rotating vortex pair (CVP) associated with the momentum puff region does not have its peak scalar concentration along the center-line (Smith and Mungal, 1998). During the formation of the CVP, the peak concentration deviates from the center line and moves to one of the lobes in the CVP. The CVP also has an asymmetric scalar concentration distribution, with one lob having a higher concentration than the other. This was further analyzed by Smith and Mungal (1998). The suction has to be adapted to capture the peak concentration when it is not located along the center-line. The asymmetry increases with the distance downstream. It is also noted that although higher values of rcf initially lead to more symmetric scalar concentration distributions in the deflected exhalation jet, the asymmetry increases with rcf during the formation of CVP (Smith and Mungal, 1998).
The jet-to-crossflow velocity ratio can, in a first-order approach, be decoupled from the mass flow. For a constant mass flow, the outlet area of the jets can be adjusted to ensure a value of rcf below 5. This is easier to achieve with a longitudinal jet, since the lateral jets often require, as discussed, relatively large angles from the horizontal, which results in flow patterns that are almost parallel to the buoyant exhalation.
5 Conclusion
This study has analyzed a novel ventilation approach, which can simultaneously reduce airborne disease transmission risk and increase energy efficiency in offices. The concept denoted as Personalized Displacement Ventilation (PerDiVent), combines air curtain- and local extraction techniques, via the use of modular jets and an exhaust hood, to intercept and remove potentially infectious aerosol particles from the workspace. Computational Fluid Dynamics simulations and lower-order integral models were used to assess how effective PerDiVent is in reducing pollutant concentrations and cross-infection risk compared to conventional mixing ventilation. Additionally, the impact on the noise and thermal comfort of the office occupants was also investigated. This resulted in the following main findings.
1 PerDiVent is successful in capturing part of the contaminating respiratory emission exhaled by the occupants. The system was able to reduce the risk of cross infection by a factor of two in the best-case scenario analyzed and by a factor of 1.08 in the worst-case scenario analyzed. This disparity is primarily attributed to a dependence of capture success on the relative position of an infected individual.
2 PerDiVent allows for reduced overall ventilation rates compared to mixing ventilation due to its higher pollutant removal efficiency. This can lead to savings in mechanical power of at least 30% when the ventilation system is set to maintain the carbon dioxide concentration below a certain level or at least 60% when maintaining the cross-infection risk below a certain value. The results also qualitatively suggest that PerDiVent can lead to savings in thermal energy. Quantitative results, however, are dependent on specific conditions and should be investigated more precisely in future studies.
3 PerDiVent was found to improve thermal comfort under simulated conditions. However, this heavily depends on the airspeed discharged from the jets. Estimates are provided of the velocities that lead to an increase or decrease in thermal comfort as a function of various temperatures in the room.
4 The ducts of the system do not generate disturbing levels of noise using the proposed flow parameters and pipe diameters. The noise produced by the outlets of the jets and the exhaust hood was not evaluated, but qualitative correlations were studied to reduce noise.
Finally, despite promising results, the system is not yet fully optimized. Increasing the flow rate through the suction, increasing the hood capture area, and/or adding a longitudinal jet are recommended solutions to increase PerDiVent’s effectiveness. The tools necessary for further optimization were also developed in this work. This includes a relatively low-cost integral model and metrics to assess viral removal and ventilation effectiveness. The concept shows great potential to meet the seemingly conflicting demands for healthier and more energy-efficient buildings.
Data availability statement
The raw data supporting the conclusion of this article will be made available by the authors, without undue reservation.
Author contributions
All authors listed have made a substantial, direct, and intellectual contribution to the work and approved it for publication.
Funding
This work was performed using resources provided by the Cambridge Service for Data Driven Discovery (CSD3) operated by the University of Cambridge Research Computing Service (www.csd3.cam.ac.uk), provided by Dell EMC and Intel using Tier-2 funding from the Engineering and Physical Sciences Research Council (capital grant EP/P020259/1), and DiRAC funding from the Science and Technology Facilities Council (www.dirac.ac.uk).
Conflict of interest
The authors declare that the research was conducted in the absence of any commercial or financial relationships that could be construed as a potential conflict of interest.
Publisher’s note
All claims expressed in this article are solely those of the authors and do not necessarily represent those of their affiliated organizations, or those of the publisher, the editors and the reviewers. Any product that may be evaluated in this article, or claim that may be made by its manufacturer, is not guaranteed or endorsed by the publisher.
Footnotes
References
Ai, Z. T., and Melikov, A. K. (2018). Airborne spread of expiratory droplet nuclei between the occupants of indoor environments: A review. Indoor Air 28, 500–524. doi:10.1111/ina.12465
Asadi, S., Bouvier, N., Wexler, A. S., and Ristenpart, W. D. (2020). The coronavirus pandemic and aerosols: Does Covid-19 transmit via expiratory particles? Aerosol Sci. Technol. 54, 635–638. doi:10.1080/02786826.2020.1749229
Awbi, H. (2003). Ventilation of buildings (Abingdon-on-Thames: Spon press, taylor and francis group).
Balakrishnan, P., and Srinivasan, K. (2019). Impinging jet noise reduction using non-circular jets. Appl. Acoust. 143, 19–30. doi:10.1016/j.apacoust.2018.08.016
Bergman, W., First, M., Anderson, W., Gilbert, H., and Jacox, J. (1994). Criteria for calculating the efficiency of HEPA filters during and after design basis accidents. Tech. rep., United States. UCRL-JC–119490.
Bolashikov, Z. D., and Melikov, A. K. (2009). Methods for air cleaning and protection of building occupants from airborne pathogens. Build. Environ. 44, 1378–1385. doi:10.1016/j.buildenv.2008.09.001
Bourouiba, L. (2021). The fluid dynamics of disease transmission. Annu. Rev. Fluid Mech. 53, 473–508. doi:10.1146/annurev-fluid-060220-113712
Bourouiba, L., Dehandschoewercker, E., and Bush, J. (2014). Violent expiratory events: On coughing and sneezing. J. Fluid Mech. 745, 537–563. doi:10.1017/jfm.2014.88
Bouzinaoui, A., Devienne, R., and Fontaine, J. R. (2007). An experimental study of the thermal plume developed above a finite cylindrical heat source to validate the point source model. Exp. Therm. Fluid Sci. 31, 649–659. doi:10.1016/j.expthermflusci.2006.06.010
Bracconier, R. (1988). Bibliographic review of velocity fields in the vicinity of local exhaust hood openings. Am. Industrial Hyg. Assoc. J. 49, 185–198. doi:10.1080/15298668891379585
Burridge, H. C., Bhagat, R. K., Stettler, M. E. J., Kumar, P., De Mel, I., Demis, P., et al. (2021). The ventilation of buildings and other mitigating measures for Covid-19: A focus on wintertime. Proc. R. Soc. A Math. Phys. Eng. Sci. 477, 20200855. doi:10.1098/rspa.2020.0855
Cao, G., Awbi, H., Yao, R., Fan, Y., Sirén, K., Kosonen, R., et al. (2014). A review of the performance of different ventilation and airflow distribution systems in buildings. Build. Environ. 73, 171–186. doi:10.1016/j.buildenv.2013.12.009
Cheong, C. H., Park, B., and Ryu, S. R. (2021). Effect of under-floor air distribution system to prevent the spread of airborne pathogens in classrooms. Case Stud. Therm. Eng. 28, 101641. doi:10.1016/j.csite.2021.101641
Co, C. (1982). Flow of fluids through valves, fittings, and pipe (New York: Van Nostrand Reinhold Co.).
Davidson, M. J., and Wang, H. J. (2002). Strongly advected jet in a coflow. J. Hydraulic Eng. 128, 742–752. doi:10.1061/(asce)0733-9429(2002)128:8(742)
de Oliveira, P. M., Mesquita, L. C. C., Gkantonas, S., Giusti, A., and Mastorakos, E. (2021). Evolution of spray and aerosol from respiratory releases: Theoretical estimates for insight on viral transmission. Proc. R. Soc. A Math. Phys. Eng. Sci. 477, 20200584. doi:10.1098/rspa.2020.0584
Dear, T. A., and Ingard, K. U. (1997). Acoustically inactive corrugated structure. U.S. Patent No. 5,597,785E. I. Du pont de Nemours and company. Wilmington: Del.
Deen, W. M. (2016). Introduction to chemical engineering fluid Mechanics. Cambridge series in chemical engineering. Cambridge University Press. doi:10.1017/CBO9781316403464
Duguid, J. P. (1945). The numbers and the sites of origin of the droplets expelled during expiratory activities. Edinb. Med. J. 52, 385–401.
Gkantonas, S., Giusti, A., and Mastorakos, E. (2020).personalised displacement ventilation: A novel approach to reduce airborne disease transmission risk in indoor environments. [Preprint] Available at: https://www.researchgate.net/publication/347911665_Personalised_Displac ement_Ventilation_a_novel_approach_to_reduce_airborne_disease_transmission_ris k_in_indoor_environments (Accessed Dec 25, 2021).
Gkantonas, S., Zabotti, D., Mesquita, L. C., Mastorakos, E., and de Oliveira, P. M. (2021). Airborne.cam: A risk calculator of SARS-CoV-2 aerosol transmission under well-mixed ventilation conditions doi:10.17863/CAM.72192
Godri Pollitt, K., Peccia, J., Ko, A., Kaminski, N., Dela Cruz, C., Nebert, D., et al. (2020). COVID-19 vulnerability: The potential impact of genetic susceptibility and airborne transmission. Hum. Genomics 14 14, 17. doi:10.1186/s40246-020-00267-3
Goyder, H. (2013). Noise generation and propagation within corrugated pipes. J. Press. Vessel Technol. 135 135. doi:10.1115/1.4024024
Gupta, J. K., Lin, C.-H., and Chen, Q. (2010). Characterizing exhaled airflow from breathing and talking. Indoor air 20 (1), 31–39. doi:10.1111/j.1600-0668.2009.00623.x
Hamner, L., Dubbel, P., Capron, I., Ross, A., Jordan, A., Lee, J., et al. (2020). High sars-cov-2 attack rate following exposure at a choir practice — Skagit county, Washington, march 2020. MMWR. Morb. Mortal. Wkly. Rep. 69, 606–610. doi:10.15585/mmwr.mm6919e6
Harvie-Clark, J., Conlan, N., Wei, W., and Siddall, M. (2019). How loud is too loud? Noise from domestic mechanical ventilation systems. Int. J. Vent. 18, 303–312. doi:10.1080/14733315.2019.1615217
Hathway, E. A., Noakes, C. J., Sleigh, P. A., and Fletcher, L. A. (2011). CFD simulation of airborne pathogen transport due to human activities. Build. Environ. 46, 2500–2511. doi:10.1016/j.buildenv.2011.06.001
Health, G. B., and Executive, S. (2008). Controlling airborne contaminants at work: A guide to local exhaust ventilation (lev). Health and safety series booklet: HS. Bootle. Norwich: HSE Books.
Henrywood, R., Agarwal, A., and Babinsky, H. (2014). An experimental investigation into noise radiation from thin rectangular jets (20th AIAA/CEAS Aeroacoustics Conference). doi:10.2514/6.2014-2889
Henrywood, R., Agarwal, A., and Kanjere, K. (2016). The aeroacoustics of a subsonic rectangular jet (20th AIAA/CEAS Aeroacoustics Conference). doi:10.2514/6.2016-2869
ISO-7730 (1994). Moderate thermal environments – determination of the PMV and PPD indices and specification of the conditions for thermal comfort (Geneva: Geneva: International Standards Organisation).
Jirka, G. (2004). Integral model for turbulent buoyant jets in unbounded stratified flows. part i: Single round jet. Environ. Fluid Mech. 4, 1–56. doi:10.1023/A.1025583110842
Kanjere, K., Desvard, L., Nicolas, F., Henrywood, R. H., and Agarwal, A. (2016). Empirical modelling of noise from high aspect ratio rectangular jets. Int. J. Heat Fluid Flow 62, 1–9. doi:10.1016/j.ijheatfluidflow.2016.09.004
Kikkert, G., Davidson, M., and Nokes, R. (2009). A jet at an oblique angle to a cross-flow. J. Hydro-environment Res. 3, 69–76. doi:10.1016/j.jher.2009.07.004
Krajčík, M., Kudivani, L., and Mahdavi, A. (2016). Energy saving potential of personalized ventilation applied in an open space office under winter conditions. Appl. Mech. Mater. 861, 417–424. Available at: www.scientific.net/AMM.861.417. doi:10.4028/www.scientific.net/amm.861.417
La Heij, L. (2021). Development of a novel personalised ventilation system to increase energy efficiency and reduce airborne disease transmission in offices. Cambridge: University of Cambridge. [Dissertation/Master’s thesis]
Lau, Z., Griffiths, I. M., English, A., and Kaouri, K. (2022). Predicting the spatio-temporal infection risk in indoor spaces using an efficient airborne transmission model. Proc. R. Soc. A Math. Phys. Eng. Sci. 478, 20210383. doi:10.1098/rspa.2021.0383
Leung, N., Chu, D., Shiu, E., Chan, K.-H., Mcdevitt, J., Hau, B., et al. (2020). Respiratory virus shedding in exhaled breath and efficacy of face masks doi:10.21203/rs.3.rs-16836/v1
Li, A., Yi, H., and Zhang, W. (2012). A novel air distribution method - principles of air curtain ventilation. Int. J. Vent. 10, 383–390. doi:10.1080/14733315.2012.11683963
Lipinski, T., Ahmad, D., Serey, N., and Jouhara, H. (2020). Review of ventilation strategies to reduce the risk of disease transmission in high occupancy buildings. Int. J. Thermofluids 7-8, 100045. doi:10.1016/j.ijft.2020.100045
Liu, L., Li, Y., Nielsen, P., Wei, J., and Jensen, R. (2016a). Short-range airborne transmission of expiratory droplets between two people. Indoor Air 27 27, 452–462. doi:10.1111/ina.12314
Liu, Q., Wei, W., Yuan, H., Zhan, Z.-H., and Li, Y. (2016b). Topology selection for particle swarm optimization. Inf. Sci. 363. doi:10.1016/j.ins.2016.04.050
Mansour, E., Vishinkin, R., Rihet, S., Saliba, W., Fish, F., Sarfati, P., et al. (2020). Measurement of temperature and relative humidity in exhaled breath. Sensors and Actuators B:. Chemical 304, 127371. doi:10.1016/j.snb.2019.127371
Mathai, V., Das, A., Bailey, J. A., and Breuer, K. (2021). Airflows inside passenger cars and implications for airborne disease transmission. Sci. Adv. 7 7, eabe0166. doi:10.1126/sciadv.abe0166
Melikov, A. (2004). Personalized ventilation. Indoor Air 14, 157–167. doi:10.1111/j.1600-0668.2004.00284.x
Mittal, R., Meneveau, C., and Wu, W. (2020). A mathematical framework for estimating risk of airborne transmission of Covid-19 with application to face mask use and social distancing. Phys. Fluids 32, 101903. doi:10.1063/5.0025476
Morawska, L., and Cao, J. (2020). Airborne transmission of sars-cov-2: The world should face the reality. Environ. Int. 139, 105730. doi:10.1016/j.envint.2020.105730
Morawska, L., and Milton, D. K. (2020). It is time to address airborne transmission of coronavirus disease 2019 (COVID-19). Clin. Infect. Dis. 71, 2311–2313. doi:10.1093/cid/ciaa939
Morawska, L., Tang, J., Bahnfleth, W., Bluyssen, P., Boerstra, A., Buonanno, G., et al. (2020). How can airborne transmission of Covid-19 indoors be minimised? Environ. Int. 142. doi:10.1016/j.envint.2020.105832
Nakiboglu, G., Belfroid, S. P. C., Golliard, J., and Hirschberg, A. (2011). On the whistling of corrugated pipes: Effect of pipe length and flow profile. J. Fluid Mech. 672, 78–108. doi:10.1017/s0022112010005884
Narayanan, S. R., and Yang, S. (2021). Airborne transmission of virus-laden aerosols inside a music classroom: Effects of portable purifiers and aerosol injection rates. Phys. Fluids 33, 033307. doi:10.1063/5.0042474
Nielsen, P. (2009). Control of airborne infectious diseases in ventilated spaces. J. R. Soc. Interface/R. Soc. 6, S747–S755. doi:10.1098/rsif.2009.0228.focus
Olmedo, I., Nielsen, P., de Adana, M., Grzelecki, P., and Jensen, R. (2010). Study of the human breathing flow profile in a room with three different ventilation strategies. In ASHRAE’S IAQ 2010. Kuala Lumpur, 10-12 November. (Georgia: American society of heating, refrigerating and air-conditioning engineers, inc.), pp. 102–113.
Pantelic, J., Sze-To, G. N., Tham, K. W., Chao, C. Y. H., and Khoo, Y. C. (2009). Personalized ventilation as a control measure for airborne transmissible disease spread. J. R. Soc. Interface 6, S715–S726. doi:10.1098/rsif.2009.0311.focus
Persily, A., and De Jonge, L. (2017). Carbon dioxide generation rates for building occupants. Indoor Air 27 27, 868–879. doi:10.1111/ina.12383
Rajavel, B., and Prasad, M. (2013). Acoustics of corrugated pipes: A review. Appl. Mech. Rev. 65, 050000. doi:10.1115/1.4025302
Rakul, A. R., and Sathishkumar, U. (2018). Vibration and noise analysis of galvanised steel ducts. Int. J. Eng. Sci. Res. Technol. 7, 241–245. doi:10.5281/zenodo.1246961
Schiavon, S., and Melikov, A. K. (2009). Energy-saving strategies with personalized ventilation in cold climates. Energy Build. 41, 543–550. doi:10.1016/j.enbuild.2008.11.018
Schiavon, S., Melikov, A. K., and Sekhar, C. (2010). Energy analysis of the personalized ventilation system in hot and humid climates. Energy Build. 42, 699–707. doi:10.1016/j.enbuild.2009.11.009
Schibuola, L., and Tambani, C. (2021). High energy efficiency ventilation to limit Covid-19 contagion in school environments. Energy Build. 240, 110882. doi:10.1016/j.enbuild.2021.110882
Shaw, E. (1972). Thermal comfort: Analysis and applications in environmental engineering, by p. o. Fanger. 244 pp. Danish technical press. Copenhagen, Denmark, 1970. Danish kr. 76, 50. R. Soc. Health J. 92, 164. doi:10.1177/146642407209200337
Sirén, K. (2003a). Technical dimensioning of a vertically upwards blowing air curtain—Part i. Energy Build. 35, 681–695. doi:10.1016/s0378-7788(02)00223-2
Sirén, K. (2003b). Technical dimensioning of a vertically upwards-blowing air curtain—Part ii. Energy Build. 35, 697–705. doi:10.1016/s0378-7788(02)00224-4
Smith, S. H., and Mungal, M. G. (1998). Mixing, structure and scaling of the jet in crossflow. J. Fluid Mech. 357, 83–122. doi:10.1017/s0022112097007891
Taherian, M., and Mohammadian, A. (2021). Buoyant jets in cross-flows: Review, developments, and applications. J. Mar. Sci. Eng. 9 9, 61. doi:10.3390/jmse9010061
To, S. G. N., and Chao, C. Y. H. (2010). Review and comparison between the Wells–Riley and dose-response approaches to risk assessment of infectious respiratory diseases. Indoor Air 20, 2–16. doi:10.1111/j.1600-0668.2009.00621.x
Trivedi, S., Gkantonas, S., Mesquita, L. C. C., Iavarone, S., Oliveira, P., Mastorakos, E. M. d., and Mastorakos, E. (2021). Estimates of the stochasticity of droplet dispersion by a cough. Phys. Fluids 33, 115130. doi:10.1063/5.0070528
van Doremalen, N., Bushmaker, T., Morris, D. H., Holbrook, M. G., Gamble, A., Williamson, B. N., et al. (2020). Aerosol and surface stability of sars-cov-2 as compared with sars-cov-1. N. Engl. J. Med. 382, 1564–1567. doi:10.1056/nejmc2004973
Villafruela, J. M., Olmedo, I., Adana, M., Mendez, C., Nielsen, P. R. d., Méndez, C., et al. (2013). CFD analysis of the human exhalation flow using different boundary conditions and ventilation strategies. Build. Environ. 62, 191–200. doi:10.1016/j.buildenv.2013.01.022
Villafruela, J., Olmedo, I., Berlanga Cañete, F., and Ruiz de Adana, M. (2019). Assessment of displacement ventilation systems in airborne infection risk in hospital rooms. PLOS ONE 14 14, e0211390. doi:10.1371/journal.pone.0211390
Viswanath, K., Johnson, R. F., Corrigan, A. T., Kailasanath, K., Mora, P. A., Baier, F., et al. (2016). Noise characteristics of a rectangular vs circular nozzle for ideally expanded jet flow. doi:10.2514/6.2016-1638
Vuorinen, V., Aarnio, M., Alava, M., Alopaeus, V., Atanasova, N., Auvinen, M., et al. (2020). Modelling aerosol transport and virus exposure with numerical simulations in relation to sars-cov-2 transmission by inhalation indoors. Saf. Sci. 130, 104866. doi:10.1016/j.ssci.2020.104866
Watanabe, T., Bartrand, T. A., Weir, M. H., Omura, T., and Haas, C. N. (2010). Development of a dose-response model for sars coronavirus. Risk Anal. 30, 1129–1138. doi:10.1111/j.1539-6924.2010.01427.x
Wells, W. F. (1934). On air-borne infection*: Study II. Droplets and droplet nuclei. Am. J. Epidemiol. 20, 611–618. doi:10.1093/oxfordjournals.aje.a118097
Whitehurst, C. A., Riley, K., Pressburg, B. S., and Langley, J. (1966). Flow losses in flexible hoses, final report. New Orleans: Louisiana State University, 9–4630.
Xiao, J., Travis, J. W., and W, B. (2009). Non-boussinesq integral model for horizontal turbulent buoyant round jets. Sci. Technol. Nucl. Installations 2009, 1–7. doi:10.1155/2009/862934
Xu, C., and Liu, L. (2018). Personalized ventilation: One possible solution for airborne infection control in highly occupied space? Indoor Built Environ. 27, 873–876. doi:10.1177/1420326x18777383
Yan, Y., Li, X., Shang, Y., and Tu, J. (2017). Evaluation of airborne disease infection risks in an airliner cabin using the Lagrangian-based wells-riley approach. Build. Environ. 121, 79–92. doi:10.1016/j.buildenv.2017.05.013
Yu, H. (2021). Novel ventilation systems CFD analysis of the personalised displacement ventilation system (PerDiVent). Cambridge: University of Cambridge. [Dissertation/Master’s thesis].
Zafari, Z., de Oliveira, P. M., Gkantonas, S., Ezeh, C., and Muennig, P. A. (2022). The cost-effectiveness of standalone HEPA filtration units for the prevention of airborne SARS CoV-2 transmission. Cost Eff. Resour. Allocation 20, 22. doi:10.1186/s12962-022-00356-1
Zukowska, D., Melikov, A., and Popiolek, Z. (2008). Impact of thermal plumes generated by occupant simulators with different complexity of body geometry on airflow pattern in rooms. In Proceedings of the 7th International Thermal Manikin and Modelling Meeting – 7I3M. 7th International Thermal Manikin and Modelling Meeting, 7I3M. Coimbra, Portugal: 3–9.
Nomenclature
Greek symbols
βpipe Pipe contraction factor (−)
ϵ Corrugation depth (m)
κ Settling rate of aerosols (h−1)
λ Corrugation pitch (m)
λdecay Rate of decay of viral particles (h−1)
ν Kinematic viscosity air (m2/s)
ρ Density (kg/m3)
σ Corrugation width (m)
τw Shear stress at the pipe wall (Pa)
θpipe Contraction/expansion slope angle (°)
ɛ Dissipation of kinetic energy per unit mass (m2/s3)
ξ Passive scalar denoting the time-averaged mixture or mass fraction of a viral concentration (−)
ξjets,suc Passive scalar emitted by the jets, which is captured by the suction (mass-averaged) (−)
ξjet Passive scalar emitted by a jet (−)
ξoccupant Passive scalar emitted by an occupant (−)
ξsuc Passive scalar captured by the suction (mass-averaged) (−)
Other symbols
ΔP Pressure loss (Pa)
Across Cross-sectional area duct (m2)
Asuc Inlet area of suction (m2)
asuc Length of suction inlet (m)
b Characteristic half-width of the buoyant jet (m)
bsuc Width of suction inlet (m)
c Speed of sound (m/s)
Cpoll Pollutant concentration (ppm)
Cvirus, suc Viral concentration in the flow removed by the suction (PFU/m3)
Cvirus,0 Initial viral concentration in the exhalation of an infected occupant (PFU/m3)
Cvirus Viral concentration in the room (PFU/m3)
Ci,0 Initial concentration in the i-th stream (m−3)
Ci Concentration in the i-th stream (m−3)
D Molecular diffusivity (m2/s)
dcf Aerosol cut-off diameter (m)
Dh Hydraulic diameter (m)
Ds Characteristic diameter of the thermal plume (m)
Dt Turbulent diffusivity (m2/s)
ffan Fanning friction factor (−)
k Roughness factor material (m)
k Turbulent kinetic energy (m2/s2)
Ki Experimental pressure loss coefficient (−)
kp Viral infection constant (PFU)
Lw Sound power level (dB)
ninf Number of infected people (−)
nocc Number of occupants in the office (−)
Nvirus,in Inhaled viral particles (PFU)
Prisk Cross-infection risk (−)
rcf Jet-to-crossflow velocity ratio (−)
s Traversed distance along the center-line of the jet (m)
Sc Schmidt number (−)
Sct Turbulent Schmidt number (−)
Ta Air temperature K)
U0 Mean velocity in the duct (m/s)
ua Ambient velocity (m/s)
Uex Mean velocity of the exhalation (m/s)
Ujet Mean velocity of the jet (m/s)
v Ventilation rate (h−1)
vjets Ventilation rate due to jets, which is not captured by suction (h−1)
vmv Ventilation rate due to mixing ventilation (h−1)
vrel Relative air velocity (m/s)
Vroom Room volume (m3)
vsuc Ventilation/removal rate due to suction (h−1)
Yi,0 Initial mass fraction in the i-th stream (−)
Yi Mass fraction in the i-th stream (−)
Acronyms/Abbreviations
ACH Air changes per hour (h−1)
AMR Adaptive mesh refinement
CFD Computational fluid dynamics
CVP Counter rotating vortex pair
DV Displacement ventilation
HVAC Heating, Ventilation and Air Conditioning
MV Mixing ventilation
PerDiVent Personalized Displacement Ventilation
PFU Plaque forming unit
PISO Pressure Implicit with Splitting of Operator
PMV Predicted mean vote; average thermal sensation of a statistically large group of people indoors
PPD Percentage of dissatisfaction regarding thermal comfort (%)
PV Personalized ventilation
ZOFE Zone of flow establishment
Keywords: personalized displacement ventilation, airborne disease transmission, infection risk, computational fluid dynamics, energy efficiency, office
Citation: La Heij L, Gkantonas S and Mastorakos E (2023) Personalized displacement ventilation as an energy-efficient solution for airborne disease transmission control in offices. Front. Mech. Eng 9:1148276. doi: 10.3389/fmech.2023.1148276
Received: 19 January 2023; Accepted: 20 February 2023;
Published: 06 March 2023.
Edited by:
Seyyed Hossein Hosseini, University of Ilam, IranReviewed by:
Shaoyu Sheng, Osaka University, JapanZhihong Pang, Louisiana State University, United States
Copyright © 2023 La Heij, Gkantonas and Mastorakos. This is an open-access article distributed under the terms of the Creative Commons Attribution License (CC BY). The use, distribution or reproduction in other forums is permitted, provided the original author(s) and the copyright owner(s) are credited and that the original publication in this journal is cited, in accordance with accepted academic practice. No use, distribution or reproduction is permitted which does not comply with these terms.
*Correspondence: Lars La Heij, bHNsMzdAY2FtLmFjLnVr