 Sasanka Katreddi
 Arvind Thiruvengadam
 Gregory Thompson2
- 1Lane Department of Computer Science and Electrical Engineering, West Virginia University, Morgantown, WV, United States
- 2Center for Alternate Fuels, Emissions and Engines, Mechanical and Aerospace Engineering, West Virginia University, Morgantown, WV, United States
The maintenance costs can represent about 15%–60% of the cost of produced goods depending on the type of goods transported. To comply with stringent emissions regulations, diesel engines are incorporated with complex after-treatment systems that demand increased maintenance. The availability of alternative fuels such as natural gas and propane has fostered the natural gas and propane powertrain systems as well as electrification options for heavy- and medium-duty vehicles. A critical barrier to adopting alternative fuel vehicles has been the lack of knowledge on comparative vehicle maintenance/repair costs with conventional diesel. Moreover, the region of operation, the type of vehicle operation, and seasonal temperature changes also affect the duty cycle which impacts the maintenance and repair costs. This study focuses on estimating the cost-per-mile for heavy-duty vehicles using machine learning models such as random forest, xgboost, neural networks, and a super-learner model. The super-learner model achieved an error as low as 0.0068 $/mile for mean absolute error and 0.0086 $/mile for root mean square error with a coefficient of determination/R-Squared of 97.28%. Specifically, the paper investigates the data collected from the maintenance and repair costs associated with delivery trucks using diesel and natural gas fuels. Since the availability of data is the major constraint, we leveraged the data collected by West Virginia University and the partnership with fleet companies. This allows for additional information related to maintenance costs and fleet-specific maintenance practices of alternative fuel vehicles. This study promotes clean fuel technologies and enables fleet management companies to adopt alternative fuel vehicles in case of similar or lower cost of maintenance compared to diesel vehicles resulting in reduced emissions and total cost of ownership.
1 Introduction
The maintenance and repairs costs contribute about 7% of the total cost of ownership (TCO). Along with the maintenance and repair costs, the cost spent on fuel is another factor that contributes the most to the total cost of ownership. The choice of fuel plays a key role in taming the emissions and reducing the maintenance cost as alternative fuels can reduce emissions produced by heavy-duty vehicles due to high mileage long distance travel carrying heavy loads (Kluschke et al., 2019). This in turn reduces the total cost of ownership based on the activity being performed by the vehicle as the fuel cost incurred for a commercial truck contributes about 26% of TCO. Alongside, the United States—Environment Protection Agency (US-EPA) has set forth emission standards for heavy- and medium-duty trucks which contribute about 26% of greenhouse gas emissions (US EPA, 2015). To comply with standards diesel engine heavy-duty vehicles are equipped with complex after-treatment systems, increasing the maintenance costs. Hence, the automotive industries are focusing on alternative fuels such as natural gas and propane for heavy- and medium-duty vehicles offering soot-free combustion and electric powertrains for zero emissions. Especially for delivery trucks that carry heavy loads making frequent stops operating in urban or rural areas using diesel fuel impacts the performance of vehicles resulting in more maintenance costs unlike goods movement trucks operating on highways. Despite the benefits and efforts, the adoption of alternative fuel vehicles (AFVs) in heavy-duty transportation has not increased much in global transportation. The main barrier to the diffusion of AFVs is the lack of understanding of the cost-per-mile (maintenance and repairs costs) requirements based on the activity performed by the vehicle. The motivation of this study is to promote the usage of AFVs such as natural gas when the total cost of ownership is lower or like that of conventional diesel trucks based on the activity being performed.
In recent years, the high computational power, big data, and data storage enabled companies to derive meaningful insights from huge volumes of real-time noisy data, especially for tasks such as predictive maintenance (PdM) and remaining useful life (RUL) using machine learning techniques. Determining the average time until the next maintenance based on the current state of the automobile/engine can be useful in scheduling maintenance and lowering maintenance costs. Predictive maintenance in automobiles using machine learning requires modeling huge volumes of sensor data, hence a representation learning to convert high dimensional data to low dimensional and predicting vehicle faults was proposed by (Revanur et al., 2020) using parallel stacked autoencoder. Machine Learning techniques such as support vector machines (SVM) (Hearst et al., 1998), random forest (RF) (Breiman, 2001), feed-forward neural networks (NN) (Bebis and Georgiopoulos, 1994), and Gaussian Processes (GP) (Rasmussen and Williams, 2006) are evaluated for predictive maintenance in automotive engine components using simulated data (Tessaro et al., 2020). Several deep learning (DL) algorithms have been used in identifying faults and estimating remaining useful life (RUL) in various automobile fields due to their ability to extract features automatically (Arena et al., 2022). An ensemble approach combining RUL estimation from a similarity-based curve matching technique and bidirectional recurrent neural network (RNN) was proposed by Yu et al. (2020). A multiscale convolutional neural network was introduced for bearing RUL estimation using the bilinear interpolation of time-frequency representations as input to the deep learning model (Zhu et al., 2019). Prognosis involves the effect of time, hence as the time step increases, the accuracy of the prognosis decreases. Hence a sequence-based recurrent neural network (RNN) model using the vibration signals of defect rolling bearings was analyzed by Malhi et al. (2011) with more accurate prediction than the incremental training. Long Short Term Memory (LSTM) Neural Networks and Random Survival Forest (RSF) (Ishwaran et al., 2008) are applied for predicting the component failure probabilities in lead-acid batteries of heavy-duty vehicles using a few data collected during workshop visits (Voronov et al., 2020) and LSTM performed significantly better compared to other techniques. Multi-sensor fault detection, fault identification, isolation, and health index forecasting were performed using deep convolutional neural networks (DCNN) in autonomous vehicles (Safavi et al., 2021). The remaining fatigue life based on health monitoring of automotive suspension was estimated in test cars using LSTM (Hu et al., 2021). The performance of vehicles can be improved with proper maintenance to reduce downtime and prevent unnecessary overhead maintenance costs (Arena et al., 2022). There are many studies related to maintenance prediction, but studies related to maintenance cost estimation are very limited.
The cost involved in corrective maintenance of replacing the failed part was studied using the Poisson distribution stochastic model (Andrzejczak et al., 2018). This study was performed on urban rail vehicles with 45 vehicles used for 5 years. An artificial neural network (ANN) model for classifying the faults and determining the frequency of failure was analyzed (Adekitan et al., 2018). The model includes six vehicle usage parameters such as fuel cost, fuel volume in liters, car mileage in km, normalized fuel cost, normalized fuel volume, and normalized mileage as input parameters with maintenance cost as output. A super-learner model for predicting the transient CO2 and NOX was proposed (Wei et al., 2022). However, the existing studies are limited to estimating maintenance costs for passenger cars or a specific type of maintenance cost in vehicles or using OEM-prescribed maintenance intervals. There are very few studies related to comparing maintenance costs in alternative fuel vehicles and estimating maintenance costs as the maintenance of vehicles is highly impacted by the fuel type, region, and activity. There is a large gap in adopting alternative fuel vehicles due to the uncertainty and unavailability of data and information (Ghadikolaei et al., 2021) even though they produce fewer emissions (Chen et al., 2018). A study has been presented to estimate fuel consumption and the maintenance cost in heavy-duty vehicles using a machine learning-based approach (Katreddi, 2023). The factors influencing the shift towards natural gas fuel in freight transportation by businesses have been studied (Cantillo et al., 2022), and was observed that the AFVs adoption is sensitive to initial purchase cost, environmental factors, and operational factors using Colombia case study and developed a model considering marginal rates, tax exemptions, elasticities to identify implications and develop policy recommendations.
The literature survey revealed a gap in studying cost-per-mile as a function of vehicle age which is highly variable based on the activity, fuel type, region of operation, and other factors. Hence to fill the gap, this study addresses the following.
• Lack of data by collecting real-time and real-world maintenance records of natural gas and diesel-fueled heavy-duty delivery trucks from fleet management companies.
• Investigated the machine learning models on the large volume of maintenance data collected from delivery trucks using natural gas and diesel to understand the change in cost-per-mile patterns as the vehicle ages.
• Developed a Super-Learner Model on real-world real-time data for predicting the Cost-Per-Mile.
To our knowledge, this is the first work to develop an ensemble super-learner model for the real-time maintenance data collected from heavy-duty delivery trucks. The work helps in the diffusion of natural gas delivery trucks and policymakers to develop policies based on the total cost of ownership.
2 Methodology
The maintenance needs for a vehicle vary based on the vehicle type, usage, activity, fuel type, engine, and many other factors. This study possesses a large volume of data collected from different medium- and heavy-duty trucks using different fuel types such as diesel, natural gas, propane, and electric vehicles which are then further categorized per vocational categories as goods movement, delivery, school bus, refuse, and other vocational applications. The vehicles undergo different types of maintenance strategies such as periodic—periodically scheduled maintenance, preventative—checking for potential failures and eliminating them, and finally corrective—after the failure occurred. The cost associated with this maintenance varies drastically based on the type of maintenance, the part of maintenance, the age of the vehicle, and other factors such as region, weather, and the duty cycle of the vehicle. The workflow for this study is shown in Figure 1.
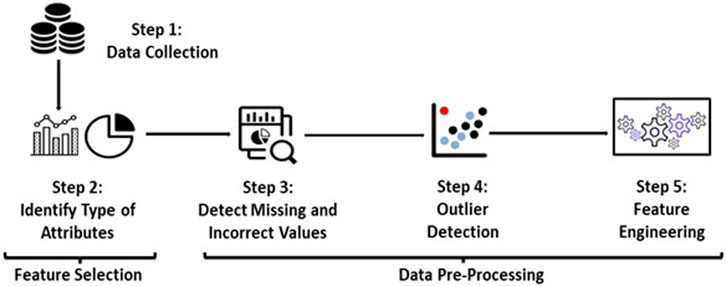
FIGURE 1. Data processing workflow.
2.1 Data collection and pre-processing
One of the key challenges in studying the influence of different affecting parameters—vocation, fuel type, and other parameters on maintenance cost is the lack of real-world data. This study leverages the data collected from developing data-sharing agreements with various fleets through which, information related to maintenance cost (MC) and fleet-specific maintenance practices of diesel-powered and alternative-fueled vehicles were collected. The team collected data related to the maintenance of diesel and alternative fuel vehicles from fleets operating in various regions of the country. The current data collected contains 5,128 instances for delivery trucks. The data collected has the features shown in Table 1 along with derived features such as Road Congestion Index (RCI), Maintenance Number, Time Between Maintenance (TBM), Miles Per Day, Vehicle Age, Cumulative Cost, and Cost Per Mile. The data is related to three types of maintenance, namely, periodic, preventative, and corrective for different parts are collected. Corrective maintenance is performed to fix or replace a failed or non-performing component whereas preventative maintenances are done to prevent the downtime of the vehicle by proactively checking for failures. The regular inspections recommended by the manufacturer and inspections by law are considered periodic maintenance. Medium- and heavy-duty vehicles are built with many heavy components for safety. For ease of analysis, the parts of the truck are grouped into five major part types: engine and transmission, exhaust and emissions, tire and brake, fuel system, and chassis. Maintenance is categorized as engine and transmission if the maintenance such as repair or replacement is performed on the engine, transmission, and/or any of their subcomponents such as a radiator, turbocharger, solenoids, etc. The exhaust and emissions include the after-treatment system and components such as hangers, clamps, bolts, etc. This part of the truck might have a significant change in the maintenance of the vehicle as the system depends on the fuel type used and the combustion process. The tire and brake group included the replacement of tires, brakes, brake shoes, or fitting new tires and brakes. The fuel system group includes maintenance related to the fuel tank, fuel lines, fuel filter, and wear and tear of the fuel tank and pipes. The preventive maintenance (PM) categorized as PM A, PM B, PM C, and PM D are classified as chassis. These services consisted of PM A: performing a safety check on the entire vehicle and adding lubricants to major components, PM B: PM A plus oil change and inspection of driveline, PM C: PM B plus alignment verifications, annual inspection, PM D: scheduled rebuild or major component replacement (“Preventive Maintenance Programs”; Keller, 2023).
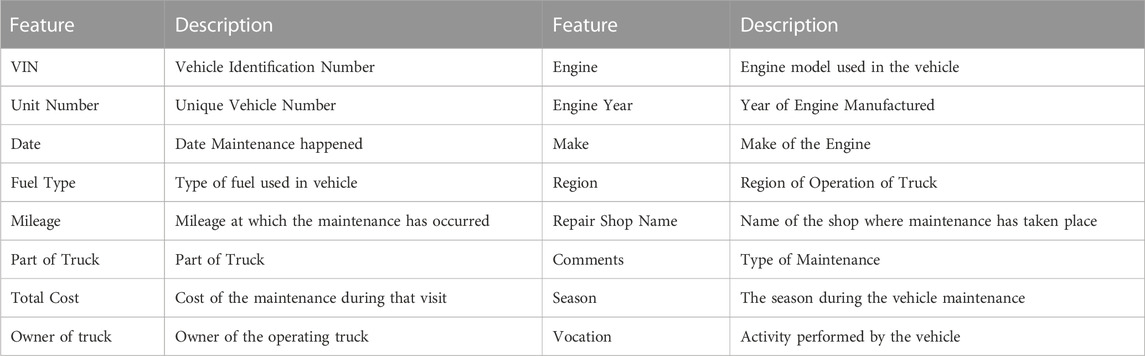
TABLE 1. Features in the raw data collected.
To understand the correlation of features, the correlation scores for features are calculated and plotted as a feature association matrix shown in Figure 2. The correlation score tells association strength which is how accurately one feature can be determined based on the other. Features partitioned into groups based on the similarities are clustered by different colors. The opacity of color indicates the level of co-occurrence from 0 to 1. A correlation score of 0 means the features are independent and a correlation score of 1 indicates perfect correlation. Ideally, multicollinearity should be avoided, as the high degree of correlation can cause a problem in fitting a model. The target variable is shown as a bolded white variable. With numerical data, different features have different ranges of values as the features are not unified. To protect data integrity, normalization is performed. The dataset is then divided into train and test datasets. The data is then randomized to make machine learning models capture patterns in data. Without randomization, the ordering of data might just pick up the initial maintenance well but not the one that has higher vehicle age with larger mileage. Therefore, the randomization of data is important in the machine-learning process.
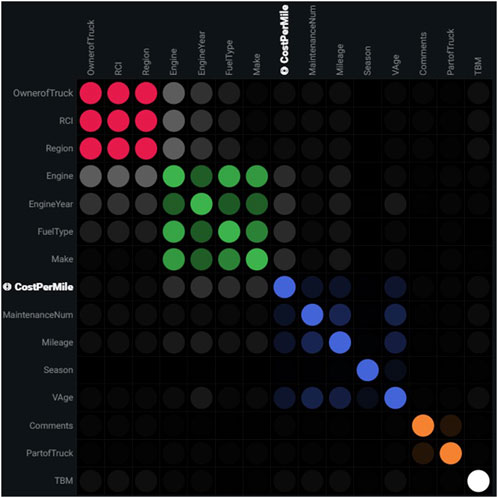
FIGURE 2. Feature association matrix.
2.2 Machine learning analysis
In this work, machine learning algorithms: random forest (RF), extreme gradient boosting (XGB) (Chen and Guestrin, 2016), neural network (NN), and a super-learner model are developed and compared for predicting continuous variables. The general process of machine learning prediction models is shown in Figure 3. The selected features from the data collected, the derived features along with the target label, i.e., cost-per-mile are passed to the machine learning model for training. Based on the machine algorithm the hyperparameters are chosen and trained for many iterations. The resulting generated model is then used to make predictions on unseen test data.
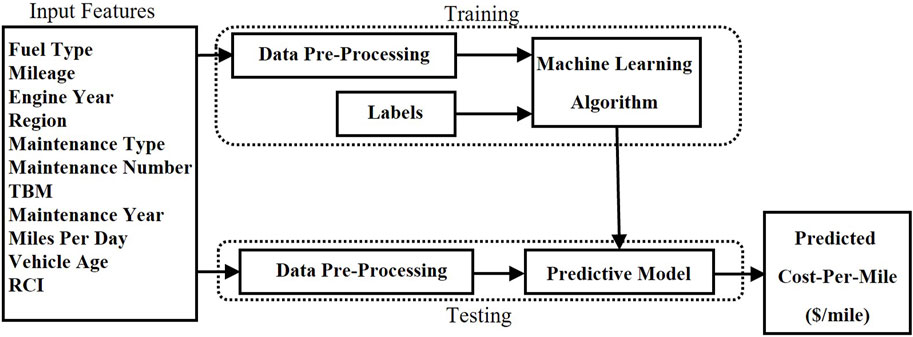
FIGURE 3. Machine learning model process.
2.2.1 Neural network (NN)
Neural Networks are referred to as the system of human brain neurons. A neural network or a multi-layer perceptron (MLP) is a base architecture of deep learning typically containing an input layer, hidden layers, and an output layer with multiple neurons called perceptron (Rosenblatt, 1958). The network learns by updating the weights of neurons through the backpropagation (Rumelhart et al., 1986) technique. NNs might become computationally expensive and require lots of hyperparameter tuning such as the number of neurons, number of layers, learning rate, batch size, etc. A 6-layer fully connected dense network with 4 hidden layers containing 15 neurons in each layer is developed (shown in Figure 4). The input layer contains 10 inputs, and the output layer contains single neurons. All the neurons are activated with an activation function called ReLU (Rectified Linear Unit) and an Adam optimizer with a learning rate of 0.001 and batch size of 64 is trained for 200 epochs. All the hyper-parameters are selected after several tests and grid searches.
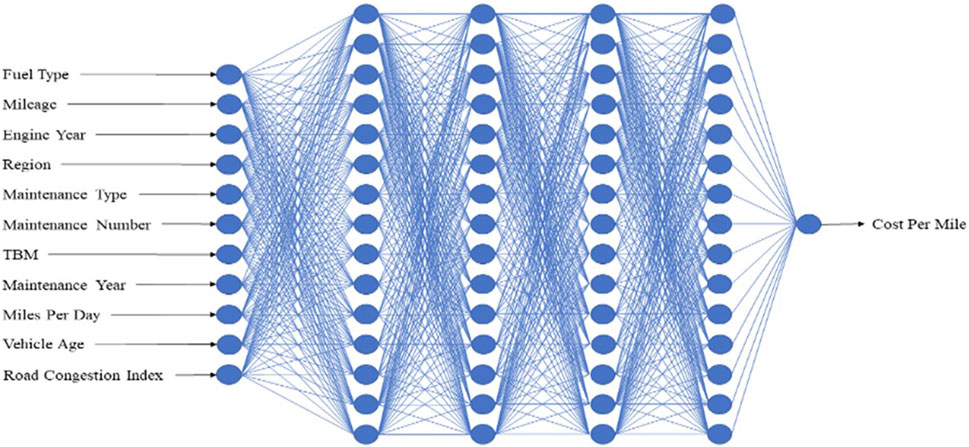
FIGURE 4. Neural network.
2.2.2 Random forest (RF)
Random Forest is an ensemble machine-learning technique that uses decision trees to build a model. The model fits several decision trees parallelly considering subsets of data. The final decision is based on the average for regression tasks. Since it internally performs cross-validation, over-fitting is minimized. The key hyper-parameter in the performance of random forest is the number of trees which is set to be 25 in the model developed.
2.2.3 Extreme gradient boosting (XGB)
Like Random Forest, Extreme Gradient Boosting is another ensemble learning algorithm that considers more detailed approximations to build the final model based on a series of decision trees. The over-fitting is handled by minimizing the loss using gradients. XGB performs well with large datasets, and the training is fast due to parallel processing. The model uses the learning rate and the number of trees as the key parameters which are set to 0.1 and 100, respectively.
2.2.4 Super-learner model
The Super-Learner model (Laan et al., 2007) is developed by stacking multiple base algorithms to improve the performance of the model. In this work, a super-learner model based on the predictions from base models such as random forest (RF) and XGBoost (XGB) and a linear regression meta-model is developed. The framework for super-learner is shown in Figure 5. The training of the super-learner model involves various steps. The dataset is initially divided into training and validation datasets without overlap. A 5-fold cross-validation approach is used during the training of base models. During 5-fold cross-validation, the training dataset is further divided into five folds of data without overlap, of which 4-folds are used as train folds to train the base models and 1-fold is used as a test fold to validate the performance of base models. Thus, the base models are trained on four train folds and the remaining fold is used for testing the base model. This process is repeated five times, where each of the five folds is used as a test fold exactly once. Each time the predictions from each of the base models on the test fold are stacked to form a new training set. The base models are then used to make predictions on the entire validation dataset. The base models are then evaluated on the entire validation dataset. The weighted average of predictions on the validation dataset is stacked to form a new validation set. The new training set is used to train the linear regression meta-model and validated using the new validation set. Given a set of training data points represented as (
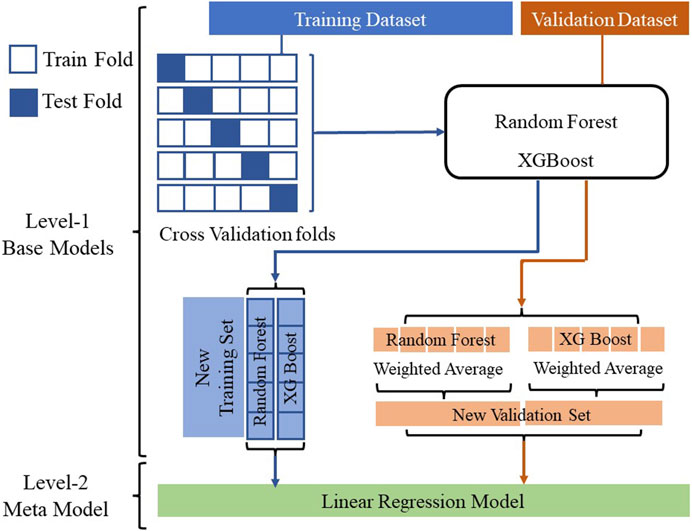
FIGURE 5. Super-learner model.
Where
Each machine learning model has hyper-parameters that need to be determined to achieve the best-performing model. A grid search has been performed for each of the algorithms to identify the hyper-parameters. Since the amount of data is limited, k-fold cross-validation is performed to prevent overfitting and to understand how well the model generalizes for unseen data. To compare the performance of models, the error metrics such as Root Mean Square Error (RMSE), Mean Absolute Error (MAE), and Coefficient of Determination (R2) are widely used in regression tasks. The mathematical expressions for RMSE, MAE, and R2 are given below.
where
3 Results
The data used in this study included 18 delivery trucks fueled by diesel and 12 delivery trucks fueled by natural gas. The diesel trucks ranged in mileage from 2,896 to 895,592 miles while the natural gas trucks ranged in mileage from 756 to 563,249 miles. The model year of diesel trucks was in the range of 2010–2022 while that of natural gas was in the years 2014–2017. The data includes various types of maintenance such as periodic, corrective, and preventative for major parts such as chassis, engine and transmission, tire and brake, exhaust and emission, and fuel system. Natural gas vehicles have a lower cost per mile ranging from 0.000285–0.152489 $/mile with few outlier points whereas diesel fuel vehicles have an average cost per mile ranging from 0.000851–0.456851 $/mile. The higher value is the indication of corrective maintenance for replacing the failed larger or complex parts such as transmission, exhaust system, etc. that have incurred a very large amount. Since these data points are important for calculations, they are included in the analysis. Diesel vehicles include an after-treatment system that consists of multiple catalytic systems that require increased maintenance to reduce vehicle downtime. Whereas natural gas vehicles compared to diesel have only a single catalytic system in the form of a three-way catalyst (TWC) offering lower maintenance costs, especially the corrective maintenance cost as shown in Figure 6.

FIGURE 6. Distribution of cost per mile ($/mile) vs. fuel type for train data.
The machine learning models are trained on pre-processed train data. The 5-fold cross-validation scores for the Neural Network, Random Forest, XGBoost, and Super-Learner models are presented in Figure 7. The cross-validation scores represent the average
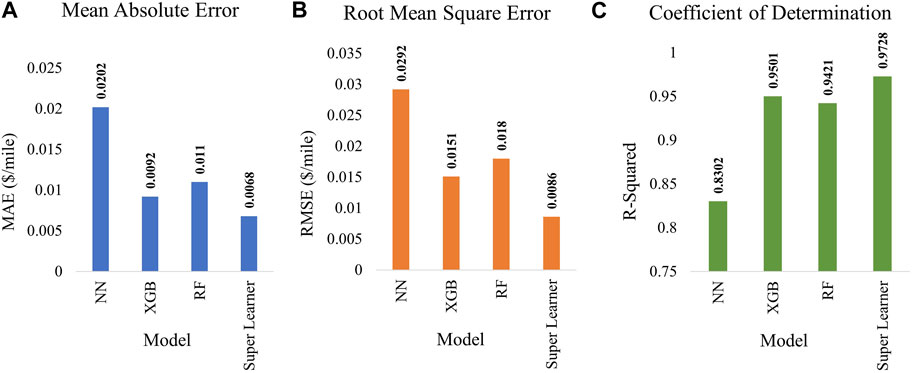
FIGURE 7. Cross-validation result (A) Mean Absolute Error, (B) Root Mean Square Error, (C) Coefficient of Determination comparison for all models.
However, to understand the model performance, the models need to be evaluated using the test datasets which are not seen during the training or validation phase. Two vehicles using diesel and natural gas fuels operated with 5 years of maintenance records are used as test data. The average cost-per-mile distribution of the test data for diesel and natural gas is shown in Figure 8. Like train data distribution, the original test data shows that natural gas has a lower average cost per mile than diesel fuel trucks. The natural gas vehicles have a lower cost per mile ranging from 0.011543–0.106729 $/mile with few outliers whereas the diesel fuel vehicles have an average cost per mile ranging from $0.037794 - $0.268725 $/mile.
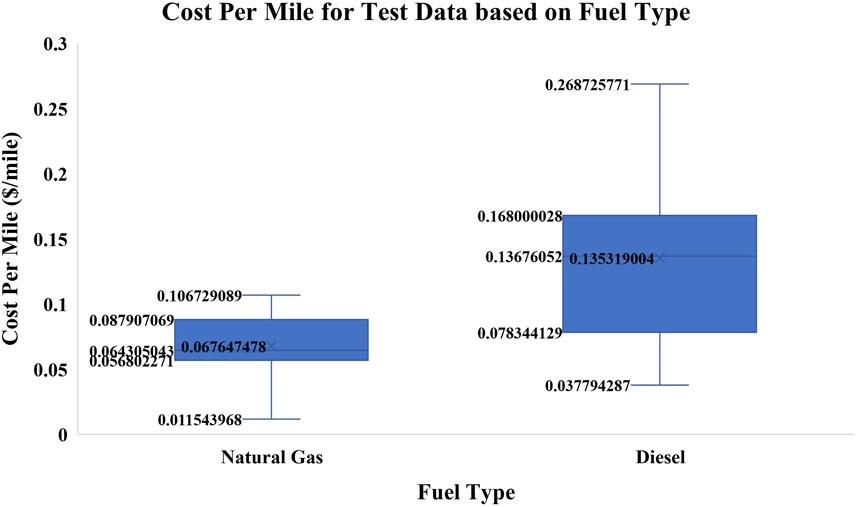
FIGURE 8. Distribution of cost per mile ($/mile) vs fuel type for test data.
The model evaluation results for the test data are shown in Figure 9. From the results, the tree-based ensemble model performs better on the tabular data compared to neural networks. The super-learner model with random forest and XGBoost as base models and linear regression as meta-model achieved the best performance compared to the individual tree-based and neural network models. The 96.78% coefficient of determination of the super learner model indicates the percentage of variation in data captured those results in the prediction of the output with mean absolute error as low as $0.071 $/mile and root mean square error as low as 0.085 $/mile.
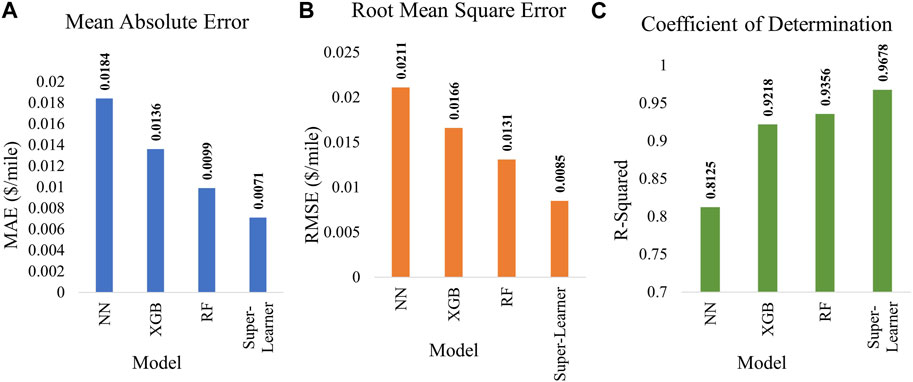
FIGURE 9. Model performance evaluation (A) Mean Absolute Error, (B) Root Mean Square Error, (C) Coefficient of Determination for unseen test data.
To see the generalization of the super-learner model for each fuel type, the scatter plot for actual and predicted cost-per-mile for the test dataset showing uncertainty in predictions is plotted in Figure 10. The red diagonal line is where the actual value and predicted value are equal. The blue data points along with the blue line represent the data with the regression fit. The closer the red line is to the blue line, the better the model predicts.
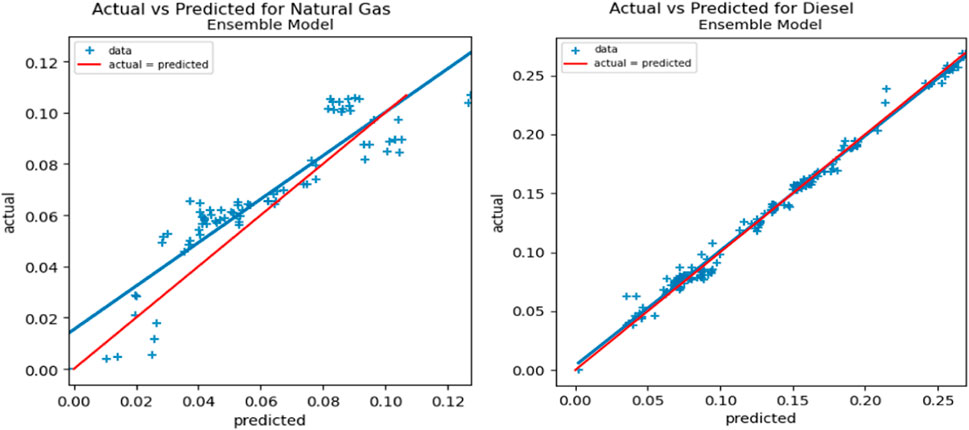
FIGURE 10. Scatter Plot for uncertainty analysis of model on the test data.
The actual and predicted average cost-per-mile over the vehicle duration of operation using the super-learner model for diesel and natural gas in delivery trucks is shown in Figure 11. The comparison shows that for a given duration of operation, the maintenance cost involved with natural gas fuel is lower than with diesel fuel.
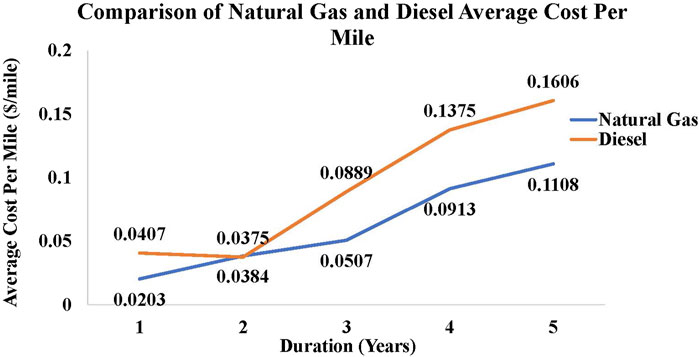
FIGURE 11. Comparison of Predicted Average Cost Per Mile over Vehicle Age for Natural Gas and Diesel Delivery Trucks using the Super-Learner Model.
4 Discussion
The major difference in the maintenance cost for natural gas and diesel trucks is seen in the exhaust and emissions and fuel system which had almost half the maintenance cost for a diesel vehicle system. Though the natural gas vehicle needs frequent periodic maintenance for engine and transmission, the cost involved is less than the periodic maintenance cost for diesel engines and transmission. Diesel vehicles require more maintenance because the aftertreatment system, which is expensive should be operated under optimal combustion to reduce emissions. Though there is an almost equal number of corrective and periodic maintenance for a diesel vehicle, the average cost per mile for both types of maintenance is almost equal to 0.18 $/mile. Whereas for a natural gas vehicle, the number of periodic maintenance is more than twice the number of corrective maintenance but the average cost per mile for periodic maintenance is less than the average cost per mile for corrective maintenance.
The cost per mile over years of operation for a vehicle gives the fleet management companies the average cost of maintenance based on the vehicle age, mileage, activity type, and fuel type helping in making the procurement decision easy. This study helps in promoting alternative fuel vehicles that incur the same or lower cost of maintenance. Based on previous studies, opting for alternative fuel vehicles reduces emissions by almost 16% (Speirs et al., 2020). A study on medium and heavy-duty vehicles (Boyce, 2022) compared the maintenance costs using LPG and diesel fuel and observed a reduction in the maintenance cost of delivery trucks by 62% using LPG over the life of vehicles.
The super-learner model approximates the true function well when the base learning algorithms cannot capture the relationship well. The current study is limited to delivery trucks due to less availability of data for trucks performing activities such as goods movement, school buses, and refuse trucks that use alternative fuels. We would further like to extend this study to vehicles using diesel and alternative fuels such as natural gas, propane, etc. Though alternative fuels are gaining popularity, their usage has not reached the expectation yet. With the current data capturing technologies, companies should concentrate on logging the maintenance data frequently for a given duration or mileage which would help in understanding the performance and maintenance of vehicles with different duty cycles using different fuel engines. This would help promote the usage of alternative fuels where feasible to offer soot-free emissions and environmentally reduce pollution.
5 Conclusion
Maintenance Cost is one of the important considerations for fleet companies. Understanding how the maintenance cost is changing over the years given the vehicle operation, fuel type, region of operation, etc., would enable the fleet companies to make data-driven decisions on the procurement of vehicles that reduce their overall total cost of ownership. The study conducted an extensive literature survey on the topic of data-driven fleet maintenance solutions that have been published in the recent past, for the commercial vehicle industry. One of the major gaps found in the literature is the availability of real-world maintenance datasets from a diverse set of vocational applications, which has limited the validation of algorithms developed using machine learning techniques.
The present study aims to address this gap by using real-world datasets collected from a variety of fleet companies. In this work, an investigation study based on real-world maintenance data collected using machine learning algorithms to predict the average cost per mile is shown. Four different machine learning algorithms, neural networks, random forest, XGBoost, and super-learner models were applied to the well-pre-processed data. A 5-fold cross-validation technique is performed to understand the generalization of the model with comprehensive results. To evaluate the performance of models several regression metrics such as mean absolute error (MAE), root means square error (RMSE), and coefficient of determination (R2) was used.
The Super-learner model has given promising results on the given data and the comparison of predicted values for delivery trucks using diesel and natural gas fuel types is shown. The super-learner works by training the meta-learning algorithm by creating an optimal weighted average of the level one base learner per k-fold cross-validation to approximate complex relationships. Super-learner eases the issue of selecting the right learners for learning a function. The super-learner model achieved the cross-validation performance with errors as low as 0.0068 $/mile for mean absolute error (MAE) and 0.0086 $/mile for root mean square error (RMSE) with a coefficient of determination (R2) as 97.28%. On unseen test data, the model achieved an MAE of 0.0071 $/mile, RMSE of 0.0085 $/mile, and R2 of 96.78%.
This study is important as it fills the gap by performing the study on real-world maintenance and vehicle activity data and shows the comparison of natural gas alternative fuel with diesel fuel in delivery trucks. The results indicate lower maintenance costs for natural gas delivery trucks, hence opting for alternative fuel vehicles offers a low cost of ownership along with reduced emissions. The outcome of the solution developed in this study could potentially pave the way for creating a cloud-based application, that can ingest the data from fleet companies, run the deployed machine learning model in the cloud, and enable the companies in making data-driven decisions for procurement of newer fleet that will have a positive impact on meeting their TCO targets and sustainability goals, by adopting alternative fuel vehicles.
Data availability statement
The datasets presented in this article are not readily available due to Confidentiality. Requests to access the datasets should be directed to SK Z2swMDM3QG1peC53dnUuZWR1.
Author contributions
Conceptualization: SK and AT; Data analysis and visualization: SK; Writing—original draft: SK; Writing—review and editing: SK, AT, NS, and VP; Supervision: AT, GT, and NS. All authors contributed to the article and approved the submitted version.
Funding
Project funded by the Department of Energy under the funding opportunity announcement DE-FOA-0002197.
Conflict of interest
The authors declare that the research was conducted in the absence of any commercial or financial relationships that could be construed as a potential conflict of interest.
Publisher’s note
All claims expressed in this article are solely those of the authors and do not necessarily represent those of their affiliated organizations, or those of the publisher, the editors and the reviewers. Any product that may be evaluated in this article, or claim that may be made by its manufacturer, is not guaranteed or endorsed by the publisher.
References
Adekitan, A. I., Bukola, A., and Kennedy, O. (2018). A data-based investigation of vehicle maintenance cost components using ANN. IOP Conf. Ser. Mat. Sci. Eng. 413, 012009. doi:10.1088/1757-899X/413/1/012009
Andrzejczak, K., Młyńczak, M., and Selech, J. (2018). Poisson-distributed failures in the predicting of the cost of corrective maintenance. Eksploat. i Niezawodn. 20, 602–609. doi:10.17531/ein.2018.4.11
Arena, F., Collotta, M., Luca, L., Ruggieri, M., and Termine, F. G. (2022). Predictive maintenance in the automotive sector: A literature review. Math. Comput. Appl. 27, 2. doi:10.3390/mca27010002
Bebis, G., and Georgiopoulos, M. (1994). Feed-forward neural networks. IEEE Potentials 13, 27–31. doi:10.1109/45.329294
Boyce, I. C. (2022). Comparison of maintenance cost of medium and heavy-duty alternative fuel and diesel vehicles. MS Thesis. Morgantown (WV): West Virginia University Libraries. doi:10.33915/etd.11586
Cantillo, V., Amaya, J., Serrano, I., Cantillo-García, V., and Galván, J. (2022). Influencing factors of trucking companies willingness to shift to alternative fuel vehicles. Transp. Res. Part E Logist. Transp. Rev. 163, 102753. doi:10.1016/j.tre.2022.102753
Chen, T., and Guestrin, C. (2016). “XGBoost: A scalable tree boosting system,” in Proceedings of the 22nd ACM SIGKDD International Conference on Knowledge Discovery and Data Mining, KDD ’16, New York, NY, USA (Association for Computing Machinery), 785–794. doi:10.1145/2939672.2939785
Chen, Y., Ma, J., Han, B., Zhang, P., Hua, H., Chen, H., et al. (2018). Emissions of automobiles fueled with alternative fuels based on engine technology: A review. J. Traffic Transp. Eng. Engl. Ed. 5, 318–334. doi:10.1016/j.jtte.2018.05.001
Ghadikolaei, M. A., Wong, P. K., Cheung, C. S., Zhao, J., Ning, Z., Yung, K.-F., et al. (2021). Why is the world not yet ready to use alternative fuel vehicles? Heliyon 7, 07527. doi:10.1016/j.heliyon.2021.e07527
Hearst, M. A., Dumais, S. T., Osuna, E., Platt, J., and Scholkopf, B. (1998). Support vector machines. IEEE Intelligent Syst. their Appl. 13, 18–28. doi:10.1109/5254.708428
Hu, H., Luo, H., and Deng, X. (2021). Health monitoring of automotive suspensions: A LSTM network approach. Shock Vib. 2021, 1–11. doi:10.1155/2021/6626024
Ishwaran, H., Kogalur, U. B., Blackstone, E. H., and Lauer, M. S. (2008). Random survival forests. Ann. Appl. Stat. 2. doi:10.1214/08-AOAS169
Keller, J. J. (2023). Preventive maintenance Programs, Available at: https://www.jjkeller.com/learn/preventive-maintenance-program (accessed 3 23 23).
Katreddi, S. (2023). Development of Machine Learning based approach to predict fuel consumption and maintenance cost of Heavy-Duty Vehicles using diesel and alternative fuels. PhD Dissertation. Morgantown (WV): West Virginia University Libraries. doi:10.33915/etd.11780
Kluschke, P., Gnann, T., Plötz, P., and Wietschel, M. (2019). Market diffusion of alternative fuels and powertrains in heavy-duty vehicles: A literature review. Energy Rep. 5, 1010–1024. doi:10.1016/j.egyr.2019.07.017
Laan, M. J., Polley, E. C., and Hubbard, A. E. (2007). Super learner. Stat. Appl. Genet. Mol. Biol. 6, Article25. doi:10.2202/1544-6115.1309
Malhi, A., Yan, R., and Gao, R. X. (2011). Prognosis of defect propagation based on recurrent neural networks. IEEE Trans. Instrum. Meas. 60, 703–711. doi:10.1109/TIM.2010.2078296
Rasmussen, C. E., and Williams, C. K. I. (2006). Gaussian processes for machine learning, Adaptive computation and machine learning. Cambridge, Mass: MIT Press.
Revanur, V., Ayibiowu, A., Rahat, M., and Khoshkangini, R. (2020). “Embeddings based parallel stacked autoencoder approach for dimensionality reduction and predictive maintenance of vehicles,” in IoT streams for data-driven predictive maintenance and IoT, edge, and mobile for embedded machine learning, communications in computer and information science. Editors J. Gama, S. Pashami, A. Bifet, M. Sayed-Mouchawe, H. Fröning, F. Pernkopfet al. (Cham: Springer International Publishing), 127–141. doi:10.1007/978-3-030-66770-2_10
Rosenblatt, F. (1958). The perceptron: A probabilistic model for information storage and organization in the brain. Psychol. Rev. 65, 386–408. doi:10.1037/h0042519
Rumelhart, D. E., Hinton, G. E., and Williams, R. J. (1986). Learning representations by back-propagating errors. Nature 323, 533–536. doi:10.1038/323533a0
Safavi, S., Safavi, M. A., Hamid, H., and Fallah, S. (2021). Multi-sensor fault detection, identification, isolation and health forecasting for autonomous vehicles. Sensors 21, 2547. doi:10.3390/s21072547
Speirs, J., Balcombe, P., Blomerus, P., Stettler, M., Achurra-Gonzalez, P., Woo, M., et al. (2020). Natural gas fuel and greenhouse gas emissions in trucks and ships. Prog. Energy 2, 012002. doi:10.1088/2516-1083/ab56af
Tessaro, I., Mariani, V. C., Coelho, L., and dos, S. (2020). Machine learning models applied to predictive maintenance in automotive engine components. Proceedings 64, 26. doi:10.3390/IeCAT2020-08508
US EPA (2015). Fast facts on transportation greenhouse gas emissions. Available at: https://www.epa.gov/greenvehicles/fast-facts-transportation-greenhouse-gas-emissions (accessed September 18 2023).
Voronov, S., Krysander, M., and Frisk, E. (2020). Predictive maintenance of lead-acid batteries with sparse vehicle operational data. Int. J. Prognostics Health Manag. 11. doi:10.36001/ijphm.2020.v11i1.2608
Wei, N., Zhang, Q., Zhang, Y., Jin, J., Chang, J., Yang, Z., et al. (2022). Super-learner model realizes the transient prediction of CO2 and NOx of diesel trucks: Model development, evaluation and interpretation. Environ. Int. 158, 106977. doi:10.1016/j.envint.2021.106977
Yu, W., Kim, I. Y., and Mechefske, C. (2020). An improved similarity-based prognostic algorithm for RUL estimation using an RNN autoencoder scheme. Reliab. Eng. Syst. Saf. 199, 106926. doi:10.1016/j.ress.2020.106926
Zhu, J., Chen, N., and Peng, W. (2019). Estimation of bearing remaining useful life based on multiscale convolutional neural network. IEEE Trans. Industrial Electron. 66, 3208–3216. doi:10.1109/TIE.2018.2844856
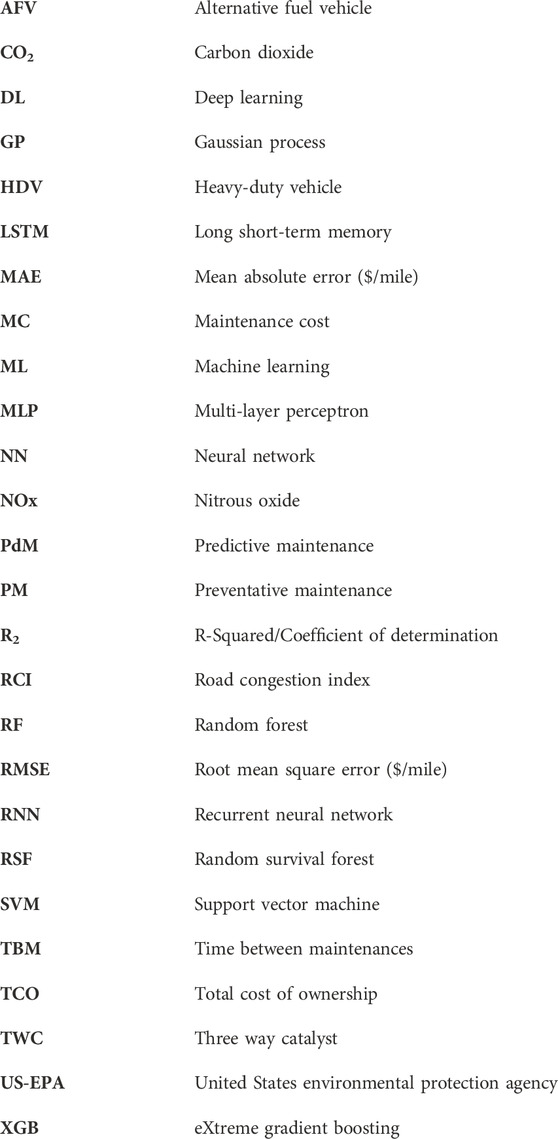
Nomenclature
Abbreviations
Keywords: heavy duty vehicle, diesel, delivery trucks, maintenance cost, total cost of ownership, alternative fuel vehicle, natural gas
Citation: Katreddi S, Thiruvengadam A, Thompson G, Schmid N and Padmanaban V (2023) Machine learning models for maintenance cost estimation in delivery trucks using diesel and natural gas fuels. Front. Mech. Eng 9:1201068. doi: 10.3389/fmech.2023.1201068
Received: 06 April 2023; Accepted: 05 June 2023;
Published: 14 June 2023.
Edited by:
Georgios Mavropoulos, School of Pedagogical and Technological Education, GreeceReviewed by:
Roussos Papagiannakis, Hellenic Air Force Academy, GreeceEvangelos Bellos, School of Pedagogical and Technological Education, Greece
Copyright © 2023 Katreddi, Thiruvengadam, Thompson, Schmid and Padmanaban. This is an open-access article distributed under the terms of the Creative Commons Attribution License (CC BY). The use, distribution or reproduction in other forums is permitted, provided the original author(s) and the copyright owner(s) are credited and that the original publication in this journal is cited, in accordance with accepted academic practice. No use, distribution or reproduction is permitted which does not comply with these terms.
*Correspondence: Sasanka Katreddi, Z2swMDM3QG1peC53dnUuZWR1